Review

Numerical Mesoscale Modelling of Microstructure Evolution during Selective Laser Melting

The Institute of Metals and Technology, 1000 Ljubljana, Slovenia
*
Authors to whom correspondence should be addressed.
Metals 2020, 10(6), 800; https://doi.org/10.3390/met10060800
Submission received: 30 April 2020 / Revised: 28 May 2020 / Accepted: 11 June 2020 / Published: 16 June 2020

Abstract

:
Selective laser melting (SLM) is one of the most popular additive-manufacturing techniques that are revolutionising the production process by opening up new possibilities for unique product-shape fabrication, generating objects of complex geometry and reducing energy consumption as well as waste. However, the more widespread use of this technology is hindered by a major drawback—the thermal-history-dependent microstructure that is typical of SLM-fabricated objects is linked to uncertainties regarding the crucial material properties. While trial-and-error approaches are often employed to limit these risks, the rapidly developing field of numerical modelling represents a cheap and reliable methodology for predicting the microstructure—and by extension, the mechanical properties—of SLM-fabricated objects. Numerical approaches hitherto applied to predicting the evolution of the microstructure in SLM processes and similar boundary-value problems are reviewed and analysed in this article. The conducted analysis focused on mesoscopic scale models, which currently offer sufficient resolution to recover the key microstructural properties at a computational cost that is low enough for the methodology to be applied to industrial problems.

1. Introduction

The concept of additive manufacturing (AM) has revolutionised the production process by inverting the conventional ’subtractive’ manufacturing methods. Whereas the latter are based on removing material from a larger volume in order to generate objects, AM generates objects ’from the ground up’ by adding material. This allows for the production of geometrically complex structures that are either impossible or too expensive to make with traditional methods like milling or machining [1]. Additionally, compared to conventional manufacturing processes, AM dramatically reduces material waste and energy consumption [2] as well as reducing the number of processing steps and the number of necessary tools [3]. A wide range of applications, including those in the medical, aerospace, defence and automotive industries [4,5,6], have already benefited from AM. However, the more widespread use of AM is still hindered by uncertainties regarding the ‘trustworthiness’ and durability of the fabricated objects [7,8].
Selective laser melting (SLM), one of the most popular AM techniques, generates objects by adding material in a layer-wise fashion in the form of powder and then selectively melting and fusing it to the underlying geometry using a moving laser source. The volume of material close to the laser heat source, where the melting temperature is exceeded, is referred to as the melt pool, while the volume around it where the temperature is not high enough to melt the material but is still high enough to result in grain growth, is referred to as the heat-affected zone. The thermal gradient and the liquid–solid interface velocity in the heat-affected zone are observed to have a decisive influence on the solidified microstructure and the transition from columnar to equiaxed grains [1,3]. The laser path, velocity, power and thickness represent the fabrication parameters that have a strong influence on the thermal processes within the manufactured material and consequently its developing microstructure. The strong microstructural inhomogeneity that is typical of SLM-produced parts [9] is linked to uncertainties regarding crucial material parameters, such as the yield and ultimate stresses, which ultimately depend on the microstructure [10]. This represents a major drawback and limits the use of this manufacturing technique [11].
While a multitude of trial-and-error approaches are presently applied for optimising the SLM-fabrication parameters of individual products in order to achieve the desired microstructure [12], numerical modelling is quickly establishing itself as the methodology of the future [10,13]. Predicting the solidified microstructure of SLM-fabricated objects, however, remains a major challenge in the field of AM [11], mostly due to the size of the computational problem to be solved. Achieving quantitative predictions of AM microstructures is an inherently multi-scale problem that requires bridging several length and time scales [14]. The material transformations during solidification take place locally (O(10-100 μ m)) over short time spans (O(10 ms)), while the manufactured parts are of the scale O(10 cm 3 ) and take O(hours-days) to build [10].
Depending on the length scale of interest, one of three different approaches is generally considered when modelling microstructural features in industrial problems. Macroscopic scale methods (Figure 1b) are based on volume averaging over a representative domain. They can be applied to the scale of the product, but on the other hand do not provide a direct microstructure representation. Instead, the microstructure is approximated by variables representing its length scales such as the average grain size, the dendrite tip radius, the dendrite arm spacing, etc. [1,15]. Microscopic scale methods (Figure 1d) aim to model the morphology of the solidifying microstructure by tracking the solid–liquid interface [16,17,18]. They offer a full description of the entire dendritic microstructure, but can only be applied to the scale of a few grains, due to the extremely high computational costs. Mesoscopic scale methods (Figure 1c) offer a compromise between the numerical cost and the resolution of the microstructure’s representation. Rather, that tracking the internal morphology of the grains, i.e., the network of dendrite trunks and arms, only the growing grain envelope is modelled. This considerably reduces the numerical cost and allows the method to be applied to macroscopic scales. Due to the fact that the modelling does not take place on sufficiently fine scales to track the growth kinetics, approximate laws are utilised to describe the velocities of the primary dendrite arms [19].
This paper is thus structured as follows: numerical approaches to modelling heat transfer during SLM processes are analysed in Section 2, simulations of microstructure evolution during SLM processes are reviewed in Section 3, combined heat-transfer and microstructure-solidification models are described in Section 4 and some final remarks and perspectives are discussed in Section 5.

2. Modelling the Heat Transfer

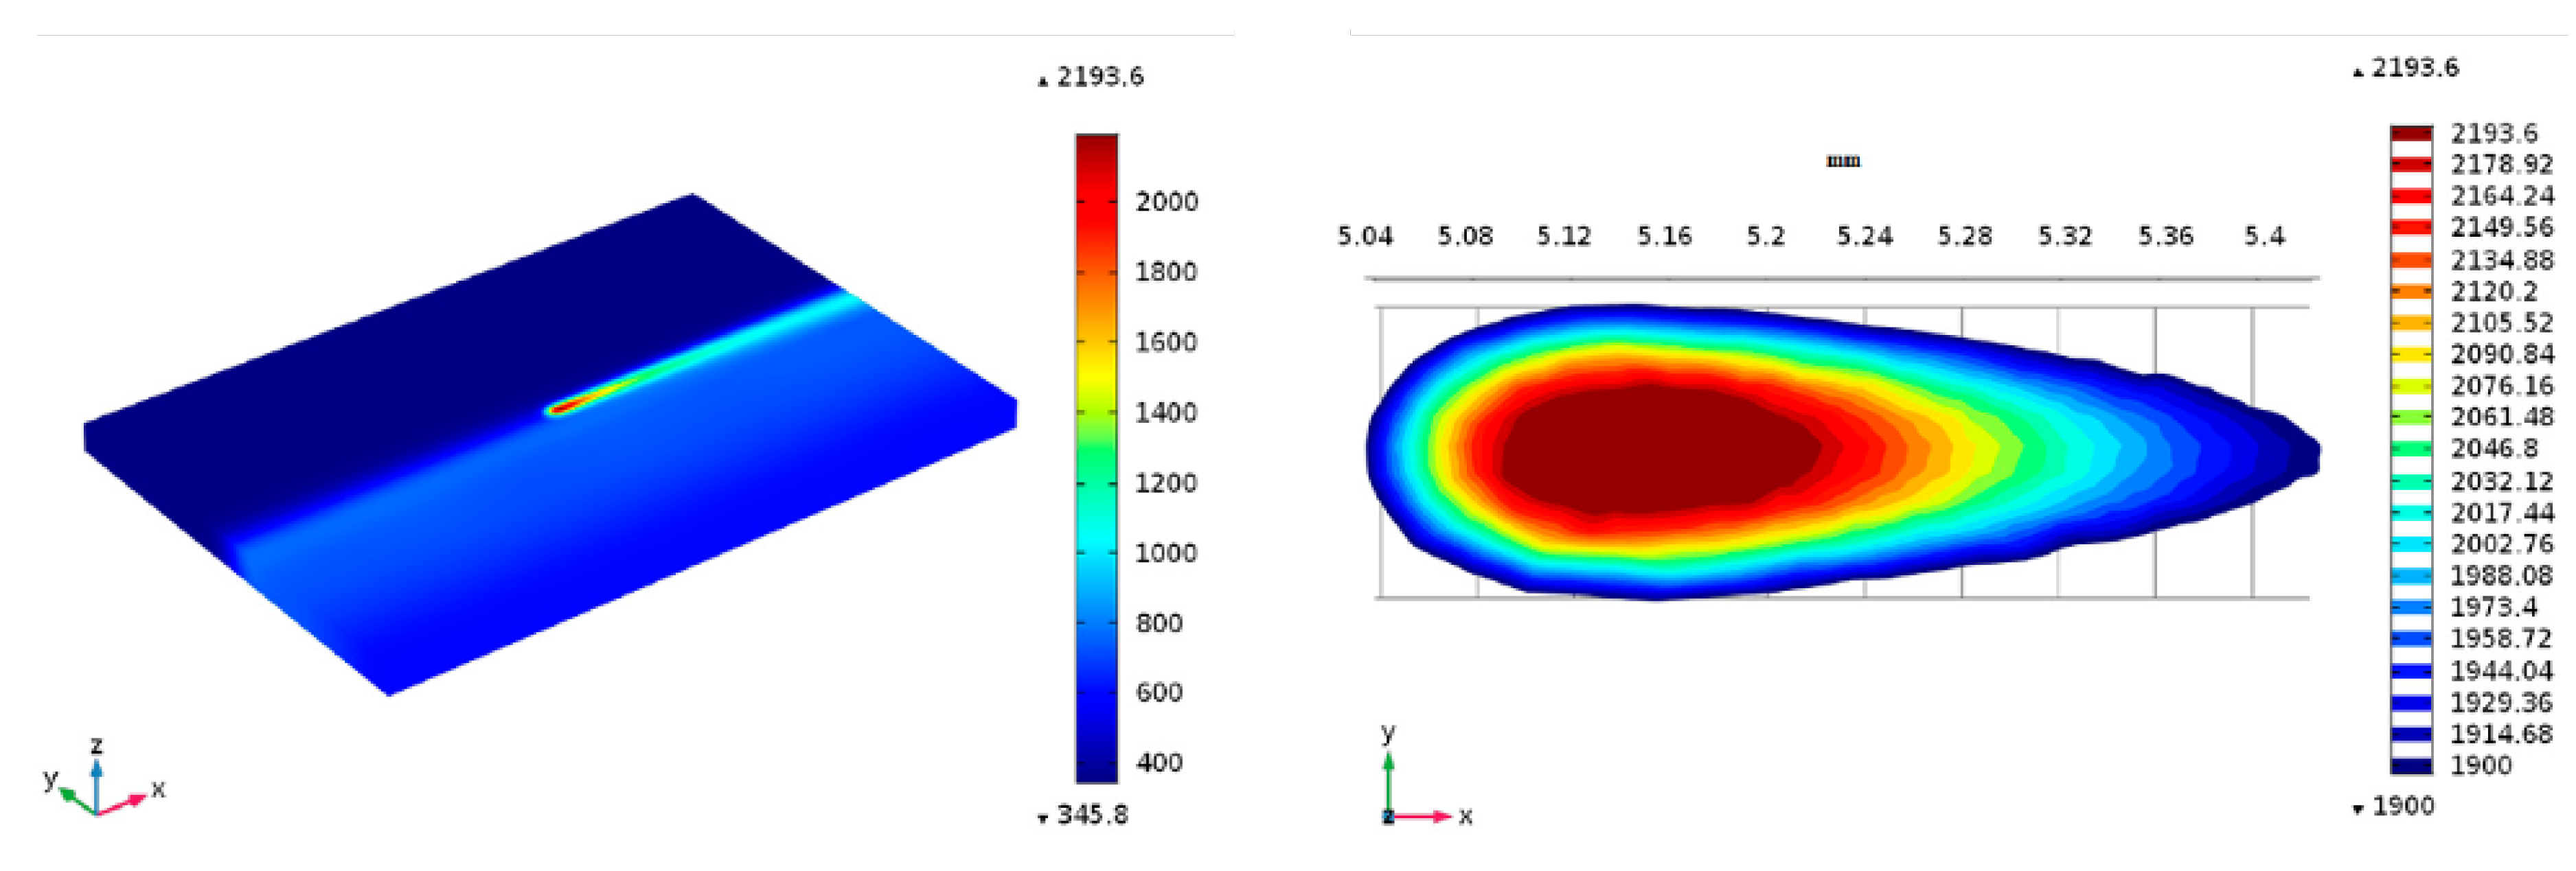
The solidified microstructure of SLM-fabricated objects ultimately depends on the local thermal history [15]. Simulation of the heat transfer within the fabricated object, which is being heated by a moving laser heat source (Figure 2) is thus an implicit part of any numerical model, aiming at predicting the microstructure evolution during SLM fabrication [20]. Although alternative approaches have been employed [11,21,22] the finite-element method (FEM) remains the most widely used methodology for solving the transient heat-transfer problem during SLM fabrication due to its flexibility in handling complex geometries, material properties and boundary conditions [23], and will henceforth be the focus of this section. While certain FEM analyses were performed in 2D [24,25,26], Kolossov et al. [27] have shown that a full 3D approach is needed and underlined that any reduction in the dimension of the model will lead to non-realistic predictions of the temperature field.
Heat-transport phenomena occur in the form of heat conduction within the material, on the one hand, and radiation and convection on the other. In general, at a continuum scale, the spatial temperature (T) distribution during laser-beam melting can be defined using the heat-flow equation [28]:
ρ ( T ) c p ( T ) T t = [ λ ( T ) T ] + Q ( x , y , z , t ) ,
where ρ ( T ) , c p ( T ) and λ ( T ) are the temperature-dependent density, specific heat capacity and thermal conductivity, respectively, while Q ( x , y , z , t ) is the heat generation per unit volume.

2.1. Material Properties

The change of material density from a relatively low powder value ρ p to a much higher bulk value ρ b is normally modelled with a smooth transition from between the liquidus ( T L ) and solidus ( T S ) temperatures [30,31,32]. The temperature dependence of the thermal conductivity has been modelled with varying levels of complexity. From a simple stepwise function to account for the material transformation from powder to bulk [31] to simple temperature dependency [27,30,33,34] and highly complex modelling of the powder conductivity by accounting for heat transfer through particle contacts, gas surroundings and inter-particle radiation [22,26,35]. The specific heat capacity is most often modelled as a temperature-dependent function [27,31,36]. In either case, due to the material’s transformation from powder to bulk during melting, its temperature-dependent material properties cannot be described with a bijective function. In order to overcome this problem, Foroozmehr et al. have changed the material properties of all the finite elements (FEs) that have exceeded the melting temperature from powder to solid in every time step [31].

2.2. Boundary Conditions

The thermal boundary conditions of SLM fabrication are defined by the two mechanisms of heat exchange with the surroundings: convection and radiation. Thermal convection q c is usually modelled as:
q c = h c ( T T ) ,
where T is the ambient temperature and h c is the convective heat-transfer coefficient. Although several authors claim heat convection can be neglected without loss of accuracy [30,37], most authors implemented convective heat losses in their models. Apart from very few exceptions [35], h c is assumed constant [22,24,27,29,31,32,34,38]. The thermal radiation q r is usually ignored [11,24,27,31,32,34,37,38], although it has already been implemented in a FEM model [22,29,35] by applying the equation:
q r = σ ε s ( T 4 T 4 ) ,
where σ is the Stefan–Boltzmann constant and ε s the emissivity. Dai and Shaw have also accounted for the reduced emissivity of the powder bed in comparison with the bulk material by accounting for the surface fraction, occupied by radiation-emitting holes [35].

2.3. Modelling the Heat Source

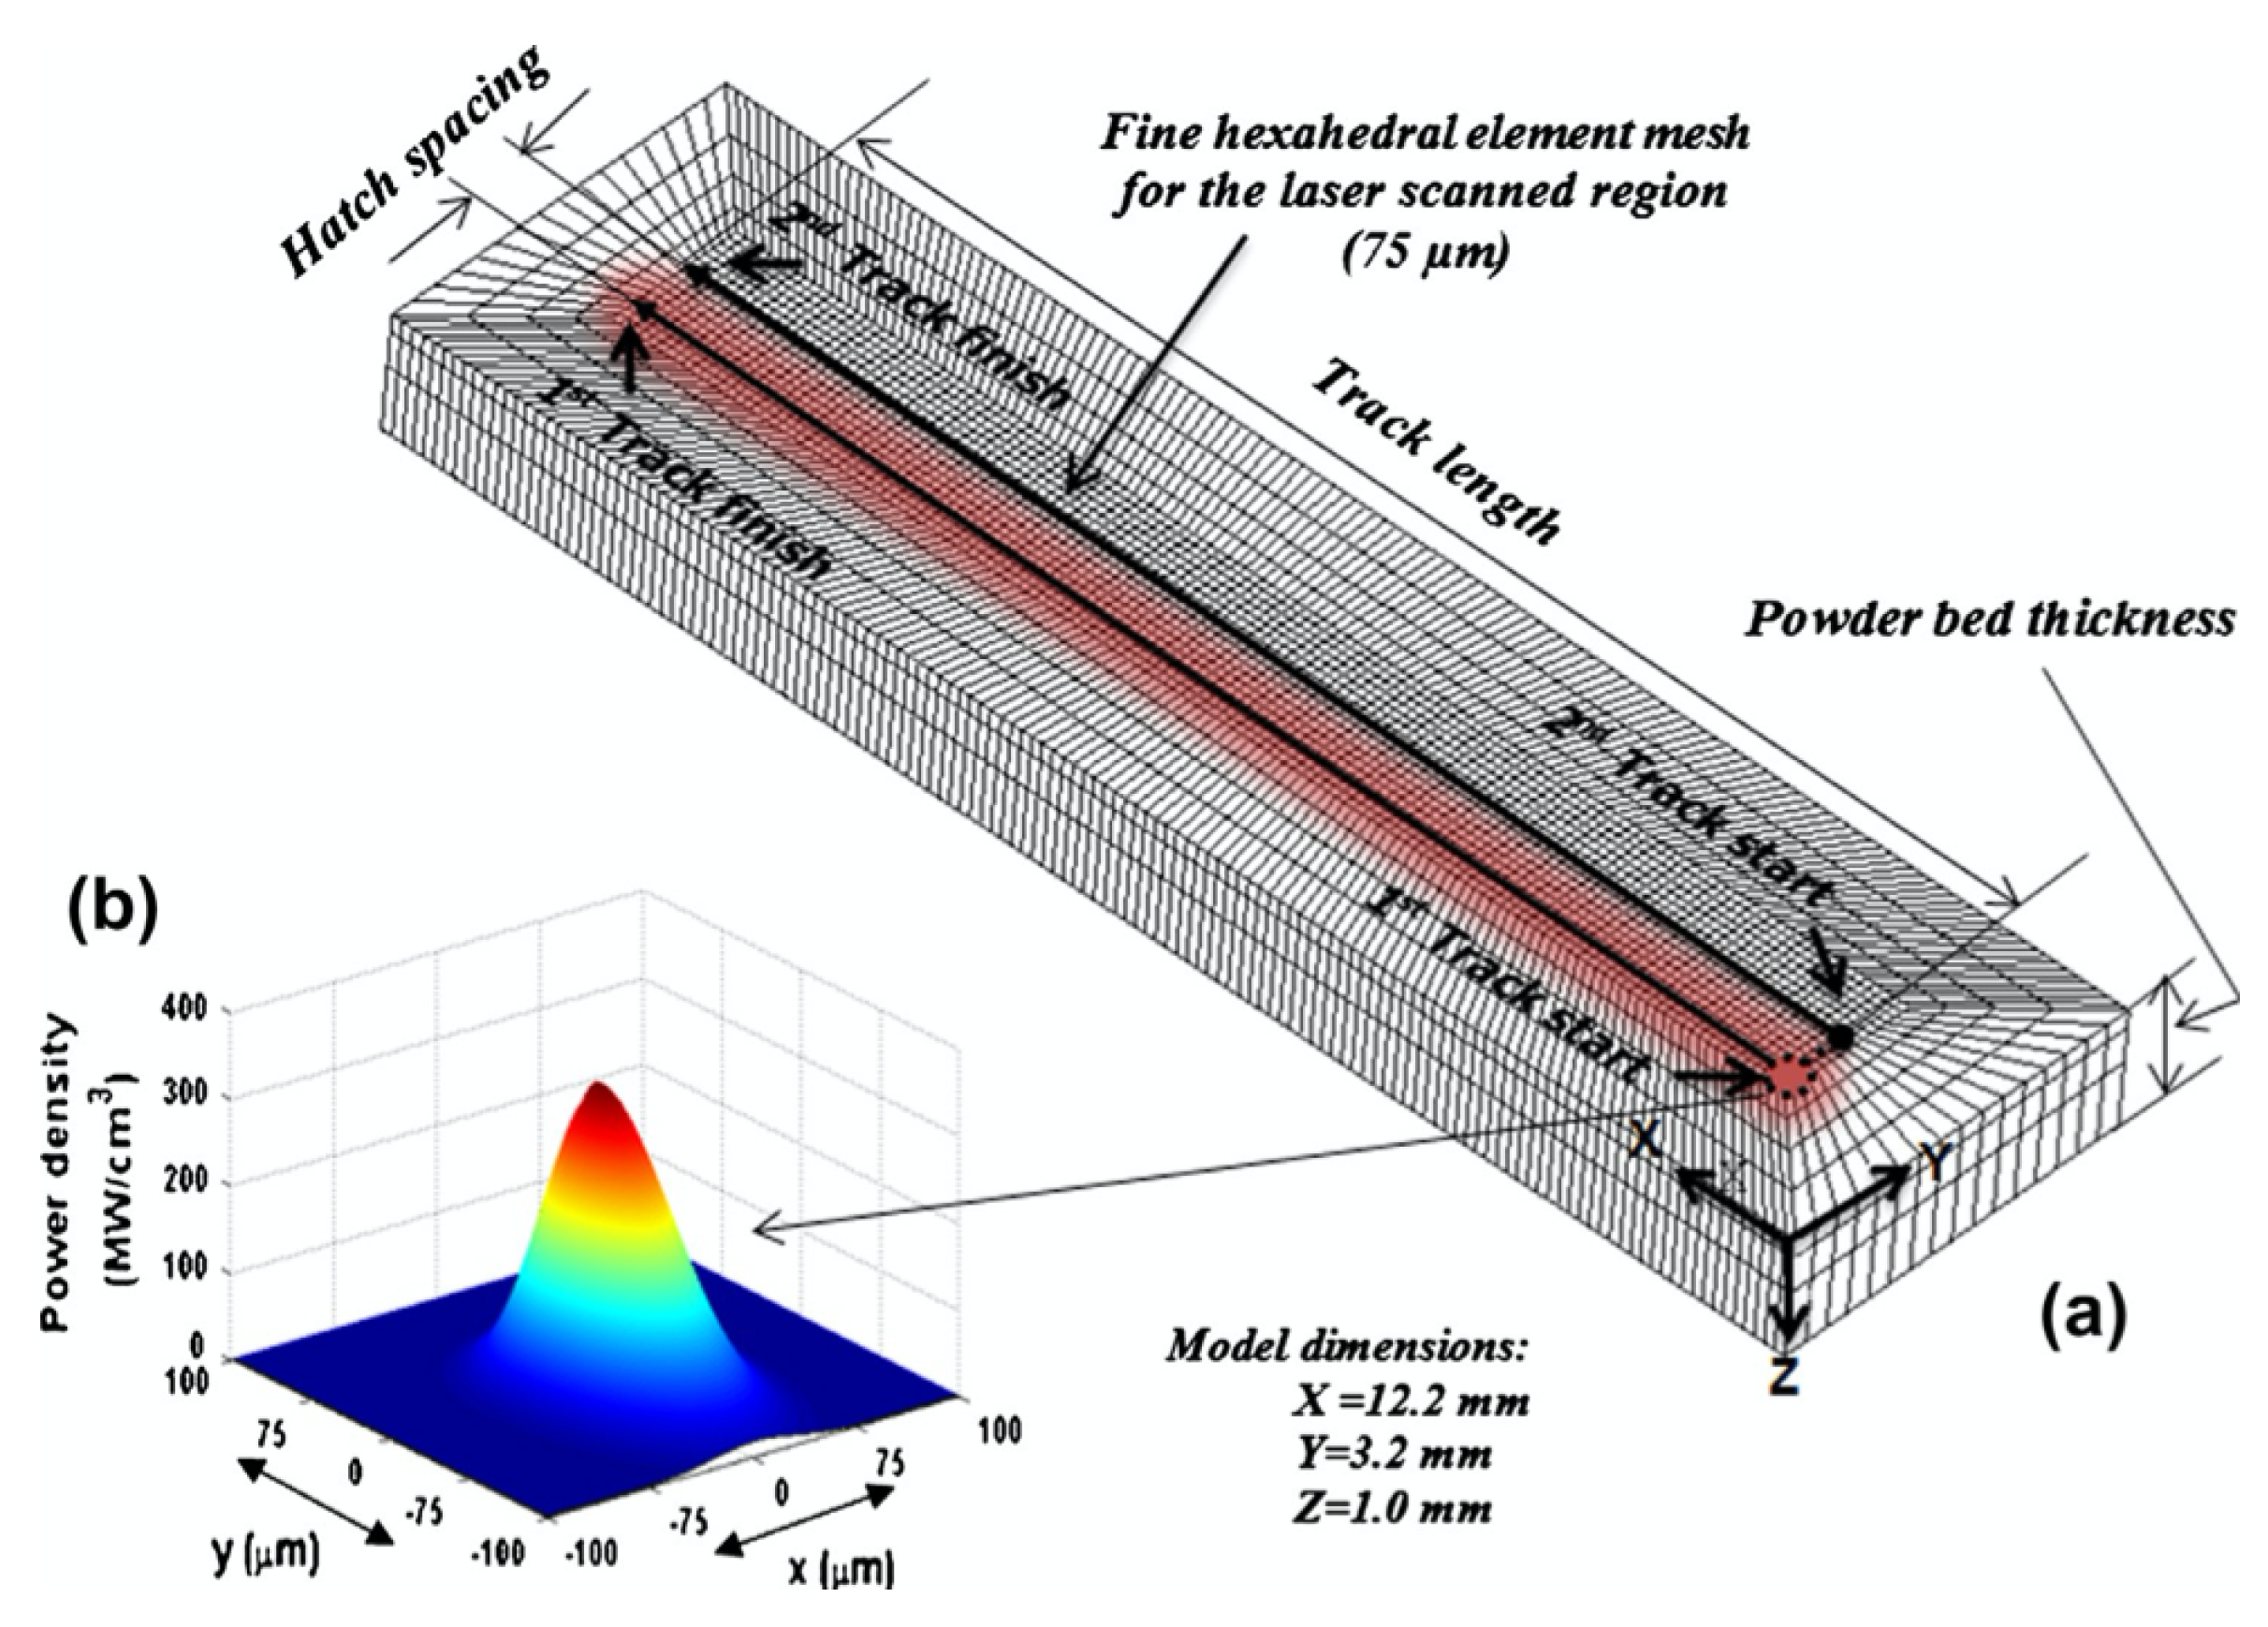
A variety of different approaches have been applied to model the laser heat source in the SLM processes, which usually features a cross-section with a Gaussian power distribution around the beam centre. While simpler approaches are based on fixing the desired temperature of a subsection of surface nodes to simulate the laser-beam heating [35], most numerical models simulate the laser beam as a heat source. When a Gaussian laser beam is exposed to the powder bed, it experiences multiple reflections through the powder layers and is not only absorbed at the surface, but rather through a certain depth of the powder bed [39]. Ansari et al. [29] thus modelled the laser as a volumetric heat source and used the Beer–Lambert attenuation law to define the depth penetration of a Gaussian surface heat flux. Several authors [11,38] used a double-ellipsoid volumetric heat source [40], where the heat is generated in a volume defined by two ellipsoids and decays exponentially with the distance from the centre. Foroozmehr at al. [31], on the other hand, argued that the multiple reflections through the powder layers cause a drastic deviation from the Gaussian distribution under the powder surface and that a uniform volumetric heat source down to an effective depth of penetration can be assumed. Kolossov et al. [27] further simplified this dependence by claiming that the penetration depth only needs to be taken into account if the finite element (FE) elementary size is smaller than five grain parameters—in the opposite case it can be neglected and the laser beam modelled as a surface heat source. Indeed, most other authors simulated the laser beam as a Gaussian surface heat flux [12,32,34,36,37] as exemplified in Figure 3b.

2.4. Finite Element Mesh

Accurate simulations of the transient temperature field during SLM processes are computationally costly, mostly due to the fact that a relatively fine FE mesh is needed in the vicinity of the laser source in order to capture the high temperature gradients. A homogeneous mesh is therefore relatively rarely used [35] as the high mesh density is not needed through the entire computational domain, but significantly increases the computational time. Instead, the majority of simulations employ a relatively coarse mesh in the substrate and a refined conforming mesh in the laser scan region [29,31,32,36] as shown in the example in Figure 3a. Adaptive remeshing has been utilised in a relatively limited number of applications, such as the examples in SLM solidification simulation [41] and laser forming [42]. Alternatively, Kolossov et al. [27] bypassed the difficulties related to building conformal meshes and came up with a quasi-regular mesh construction that features a non-conforming interface between the finely meshed scan region and the coarsely meshed substrate. A number of authors also employed Lagrangian–Eulerian approach [43] and computational fluid dynamics [44,45] to simulate melt pool dynamics, which is however out of scope of this paper.
Most authors employed finite elements with linear approximation functions [31,35,36,46], but their estimations of the necessary FE size in the heat-affected zone vary over several orders of magnitude. While certain authors utilised extremely small FEs (50 μ m) [31,32], Kolossov et al. obtained a good simulation agreement with infra-red-camera temperature measurements utilising FEs with a 0.01-mm side length and Dai et al. [46] claimed good temperature agreement with pyrometer measurements utilising FEs as large as 0.2 mm.

2.5. Validation

Two general types of experimental validation can be distinguished among the numerical simulations of the temperature field’s evolution during SLM fabrication. The direct approach involves comparing the calculated spatial temperature distribution with the measured temperature distribution, which is usually captured with an infrared camera [24,27,29,46]. In a similar fashion, the in-situ monitoring of melt pool images, principally used for quality control, can also be used for validation by providing information on melt pool geometry [47,48] as well as temperature distribution [49]. Alternatively, an indirect approach is possible, where the solidified tracks of selective laser melting are extracted, measured and compared with the simulated size of the melt pool [30,31,38,50]. Dai et al. [46] also examined the microstructure of the solidified material and used it to estimate the spatial temperature field, which they then compared with the FEM simulation results.

3. Modelling the Microstructure Evolution

The literature on grain-growth modelling for laser AM remains sparse [11] and in order to produce a relevant literature review on the subject, applications of microstructure-evolution modelling applied to other processes, such as casting and laser welding, will also be reviewed in this section.
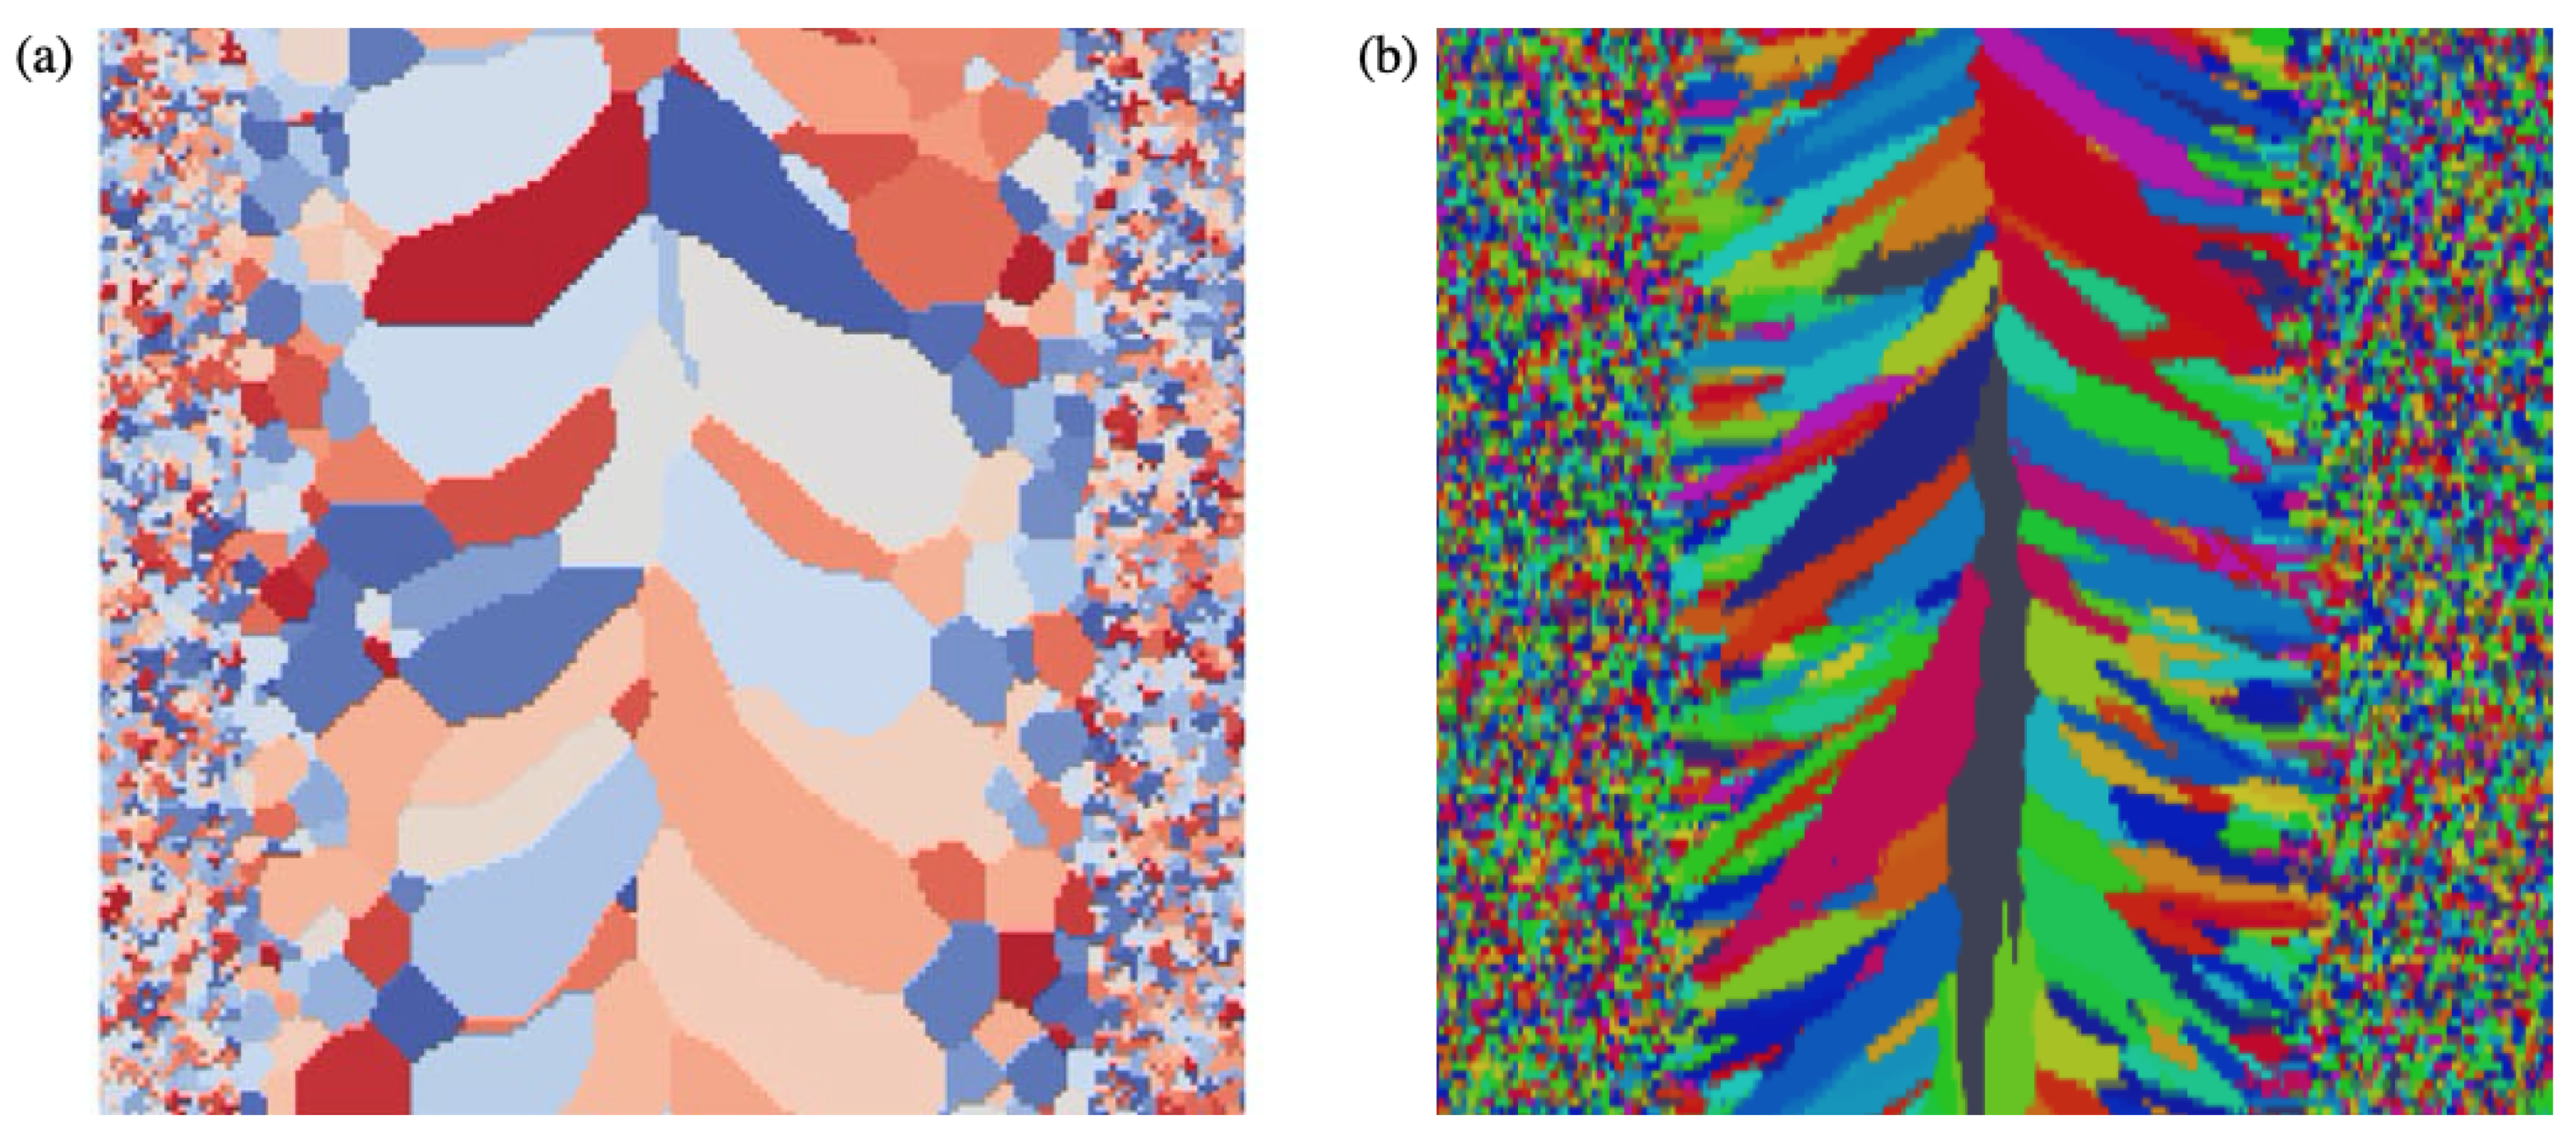
Historically, some of the first meaningful mesoscale simulations of microstructure upon solidification were produced using a probabilistic method. Brown and Spittle [51] were able to produce computed two-dimensional microstructures that closely resembled those in real micrographic cross-sections by applying the Monte Carlo method, previously developed by Anderson et al. [52]. Recently, this methodology has also been applied to electron-beam welding and the authors managed to closely reproduce the emerging microstructure [53] (Figure 4a). The method is based on assigning a solid/liquid state to each grain and considering the energy of sites, belonging to different grains. These states are then allowed to alter in order to achieve interfacial energy minimisation. The approach suffers from an inherent drawback, i.e., that they do not explicitly integrate the growth kinetics of the solid–liquid interface, which is the relationship between the undercooling and the dendrite tip’s growth rate [19]. As noted by the authors themselves, this lack of a physical basis prevents any quantitative analysis of the effects of various physical phenomena. Additionally, the simulation time step’s relation to real time is not fully clear, as the material transformation is applied to a fraction of the network cells in each time step [54].
As an answer to the shortcomings of probabilistic modelling, the cellular-automata (CA) approach was developed [56], incorporating a fundamental understanding from smaller-scale deterministic models and the computational efficiency of the probabilistic mesoscale models. While grain nucleation is modelled stochastically, the growth kinetics of dendritic tips is calculated with a deterministic approach. Due to the fact that the approach is physically sound and has proven itself flexible enough to incorporate the complexity of the solidification phenomena [57], it has established itself as a benchmark methodology in microstructure solidification in recent years. As such, CA approaches will be in the focus of this section.
The CA algorithm as applied to solidification problems can be summarised in the following steps [58]: (i) domain is discretised into cells of equal size, usually squares or hexagons—depending on the number of dimensions—arranged in a regular lattice; (ii) the neighbourhood is defined for each cell (e.g., first neighbours or first-and-second neighbours); (iii) a set of different variables (e.g., temperature, crystallographic orientation) and states (e.g., solid/liquid) is defined for each cell; (iv) rules of transition (e.g., from liquid to solid) define how the state of an individual cell will evolve in a given time step as a function of the variables and the states of the neighbouring cells. Finally, a time-stepping sequence is run across the discretised domain in order to simulate the solidification process.

3.1. Grain Nucleation

According to the pioneering work of Oldfield [59], the grain-density increase d n of the solidifying metal can be related to the effective undercooling Δ T by a continuous nucleation distribution d n / d ( Δ T ) . While Oldfield used a simple polynomial law with two parameters in order to describe the nucleation distribution of cast iron, most subsequent works adopted the Oldfield approach but presumed a Gaussian nucleation distribution [11,37,50,56,57,60,61,62,63,64]:
d n d ( Δ T ) = N m a x Δ T σ 2 π e x p 1 2 Δ T Δ T N Δ T σ 2 ,
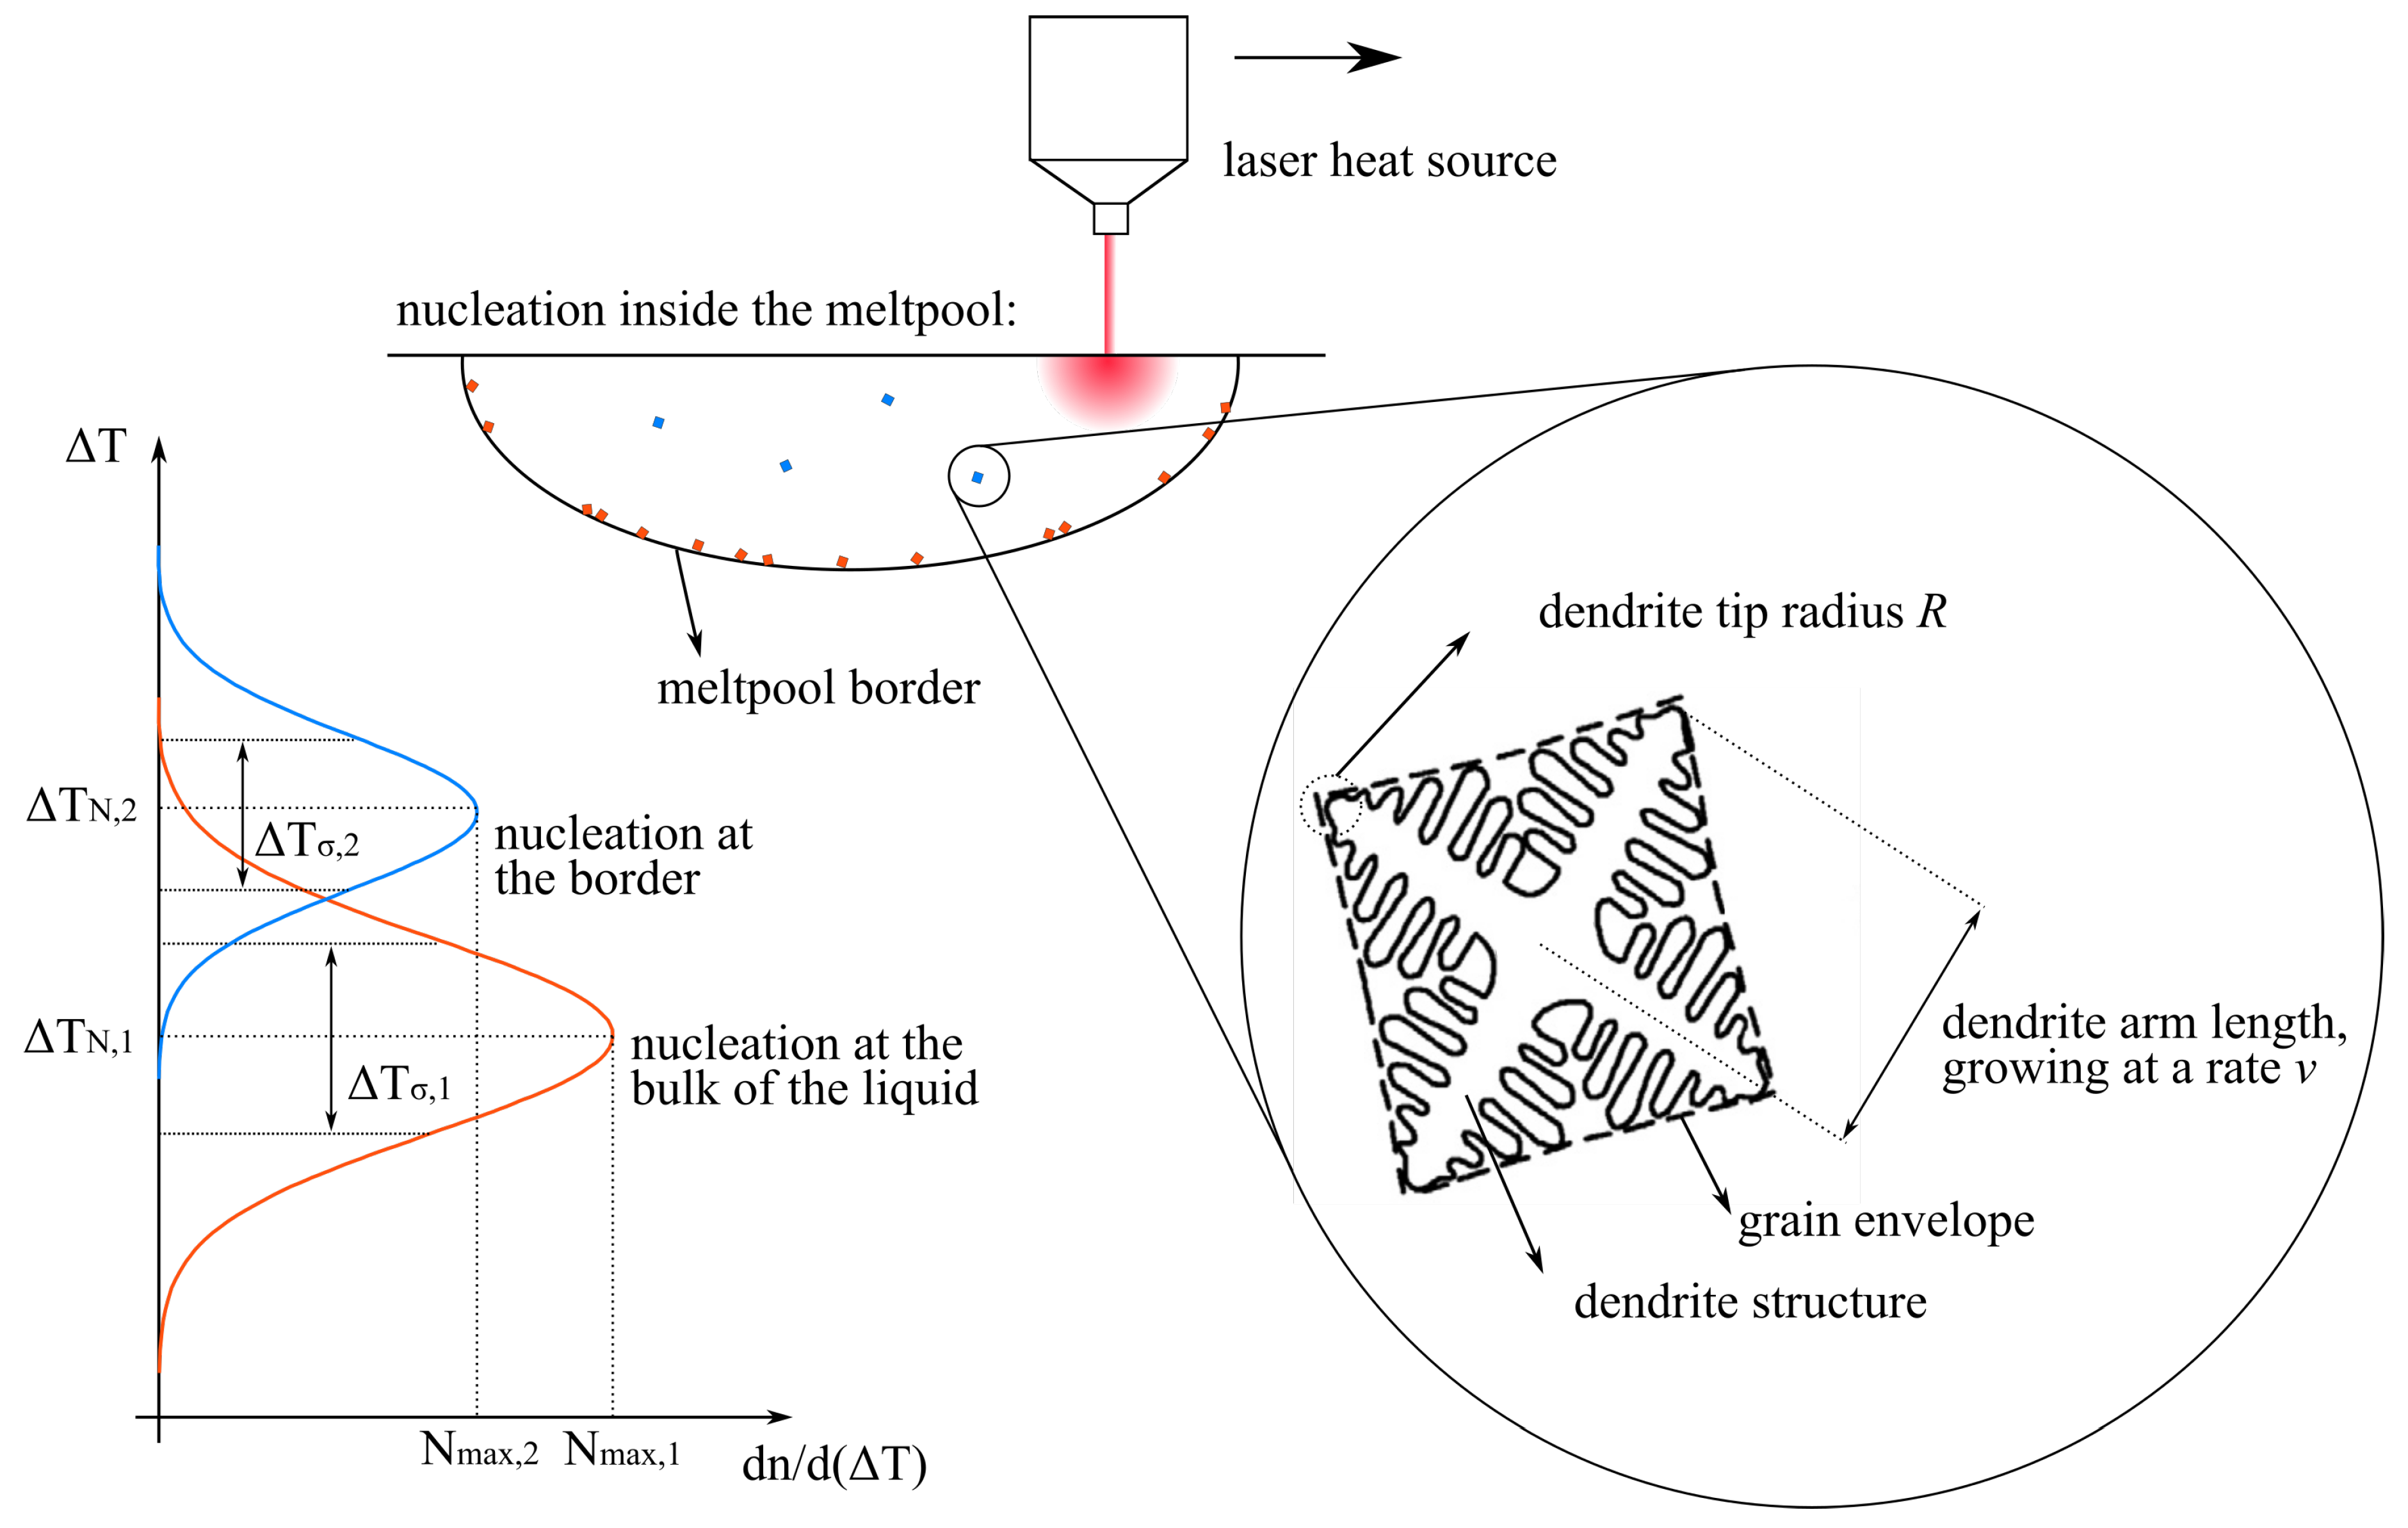
where Δ T σ is the standard deviation of the distribution, Δ T N is the mean nucleation undercooling and N m a x is the maximum nucleation density. The three standard distribution parameters are derived from experiments based on a differential thermal analysis. Rappaz [65] reported that using a single distribution for all the nucleation sites fails to reproduce the grain size dependency observed experimentally. He later introduced separate Gaussian distributions for nuclei formed at the mould wall and the bulk of the liquid [56], as shown in Figure 5, which established itself as the benchmark approach for heterogeneous grain nucleation modelling. Several authors, however, deliberately ignored nucleation inside the melt pool during gas welding [55] and SLM [11] in order to promote columnar grain growth.
In each time step of the CA solidification simulation, the total number of nuclei is calculated separately for the molten pool wall and the bulk liquid, and randomly distributed among the CA cells (Figure 5). Each grain nucleus is assigned a random preferential growth direction.

3.2. Grain Growth

Within the scope of the mesoscale modelling of microstructure evolution, the latter is described by grain envelopes, rather than a full description of the network of dendrite trunks and arms (Figure 5). Since the internal grain morphology is not of interest, the solid–liquid interface does not need to be tracked directly. Instead, the growing grain envelope can be obtained by calculating the dendrite arm lengths along the <100> crystallographic grain orientations as long as the solidifying structure of the material is known—generally it is a simple geometric shape—square in 2D and octahedron in 3D [66]. This considerably reduces the numerical cost and allows the method to be applied to macroscopic scales.
In order to sustain their growth, free dendritic crystals require an undercooled melt, which acts as a sink for the latent heat that is being rejected into the melt. In the case that the distribution coefficient k 0 is less than unity, solute is also being rejected into the melt. Both thermal and solute transport, which govern the dendritic growth, are functions of the total undercooling Δ T , which in turn consists of three main contributions [67]:
Δ T = Δ T T + Δ T C + Δ T R .
Thermal undercooling Δ T T accounts for the difference between the interface temperature at the dendrite tip and the melt temperature far from the tip; solutal undercooling Δ T C accounts for the change of liquidus temperature in the phase diagram due to the change of the solute concentration around the dendrite tip; and the curvature undercooling Δ T R accounts for the shift of liquidus line in the phase diagram due to the finite radius of the dendrite tip.
Ivantsov [68] introduced a solution for the diffusion field around a branchless paraboloidal dendrite growing in an infinite melt. The transport solution also referred to as the Ivantsov function I v ( P e ) is valid for both the thermal and solutial fields:
Ω T = P e T e x p ( P e T ) P e T e x p ( x ) x d x I v ( P e T ) ; P e T = V R 2 a ,
Ω C = P e C e x p ( P e C ) P e C e x p ( x ) x d x I v ( P e C ) ; P e C = V R 2 D ,
where Ω T and Ω C are the dimensionless undercooling and dimensionless supersaturation, respectively, P e T and P e C are the Péclet numbers for the thermal and solutial field, respectively, a and D are the thermal and solutial diffusivity, respectively, R is the dendrite tip’s radius and V is the dendrite tip’s velocity. Ivantsov’s solution can be used to express the total undercooling of the melt as a function of R and V [67]:
Δ T = Δ H c p I v ( P e T ) + m C 0 1 1 1 ( 1 k 0 ) I v ( P e C ) + 2 Γ R ,
where Δ H is the latent heat, c p is the specific heat, m is the liquidus slope, C 0 is the initial concentration of the alloy, k 0 is the equilibrium distribution coefficient and Γ is the Gibbs–Thomson coefficient. However, in order to solve the transport problem and obtain unique values of R and V, an additional independent equation is needed [69]. Kurz et al. [19] provided this extra equation by approximating the dendrite tip’s radius with the critical wavelength of the solid–liquid interface at the limit of stability and obtaining the relation:
R = 2 π Γ m G C ξ C G ,
where G C is the solute gradient in the liquid at the tip and G is the thermal gradient. ξ C is a function of the Péclet number, which approaches unity at low growth rates [56] and the thermal gradient G can be neglected in the dendritic regime [19]. According to Lipton [67], Equation (9) can further be expanded into:
R = 4 π 2 Γ P e T Δ H c p P e C m C 0 ( 1 k 0 ) 1 ( 1 k 0 ) I v ( P e C ) ,
resulting in a system of equations, consisting of Equations (8) and (10) and unknowns V and R—providing that the thermal field is known. This so-called Kurz–Giovanola–Trivedi (KGT) model [19] has been adopted in varying degrees of simplification by the vast majority of authors modelling crystal growth on the mesoscale in casting [54,56,60,70], laser melting [61] and additive manufacturing [11,12,37,62,64,71]. The differences between the approaches adopted by these authors stem mostly from the simplifications introduced to Equation (5). Zhang et al. [62,71] as well as Ao et al. [64] took into account the solutial, thermal and curvature effects, while Dezfoli et al. [61] neglected all the contributions with the exception thermal undercooling and Gandin [33] approximated the undercooling by accounting only for solutal and curvature undercooling. Several other authors argued that for most metallic alloys under normal solidification conditions, solute undercooling predominates and the other contributions can be neglected [11,54,56,63].
Among other approaches, Chet et al. [55] utilized a simple quadratic dependence of the dendrite tip’s velocity on undercooling, but admitted that better values could be obtained by fitting the KGT solution.

3.3. Mesh Dependency

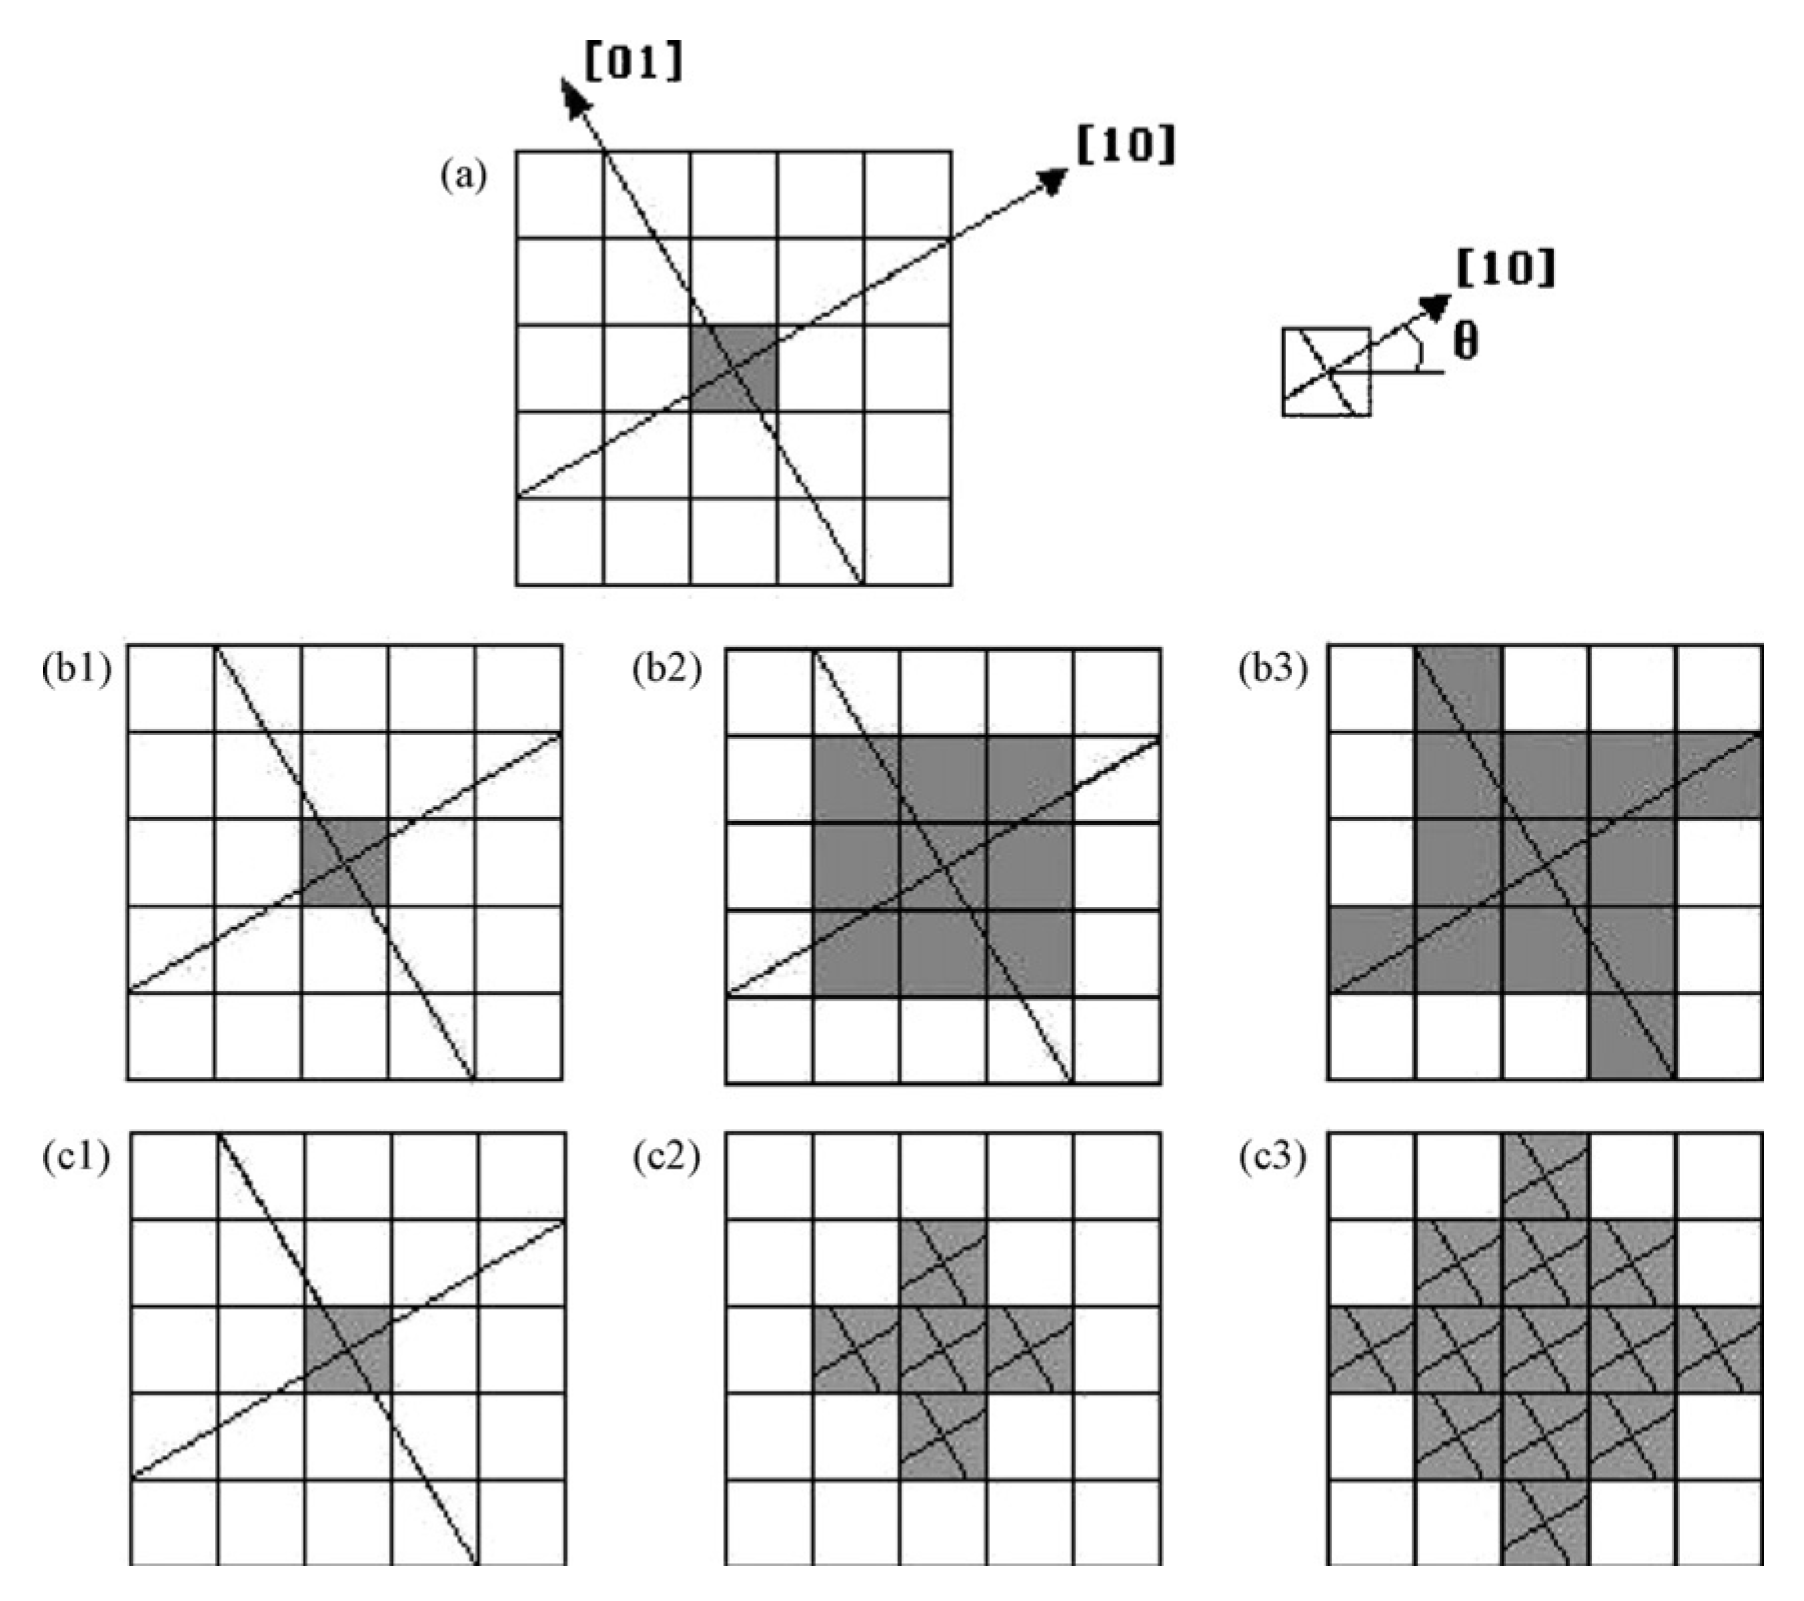
Typically, in CA simulations of the crystal growth, the computational mesh can give rise to artificial anisotropy [57]. If no measures are taken in order to counter this effect, the initial orientation of a growing grain is lost after a certain number of time steps and its crystallographic orientation aligns with the CA lattice [56], as can be observed in Figure 6. In order to address this issue, Rappaz and Gandin [56] first developed the ‘dendrite-tip correction’ technique, which could, however, only be applied in uniform temperature fields. They soon overcame this limitation with the ‘two-dimensional rectangular algorithm’ [54]. A three-dimensional variation of this approach, the ‘decentred square algorithm’ was later introduced by the same authors [72], but proved computationally very expensive in three dimensions. It has, however, recently been applied by other authors [12,71] in 2D simulations of microstructure solidification during AM. Zhan et al. [57] later developed the ‘limited angle method’ that proved simple to implement in two dimensions, but carried a heavy computational load due to its multi-layer mesh. Recently, Zinovieva et al. [63] introduced a modified version of the original ‘dendrite-tip correction’ technique by Rappaz and Gandin [56]. The authors claimed an improved mesh-anisotropy reduction and later implemented it in a two-dimensional simulation of microstructure evolution during SLM [11].

3.4. Simulation Parameters

When defining the size of the CA cells, a balance is usually sought between the resolution of the simulated microstructure and the computational cost, both of which increase as the CA cell size diminishes. The CPU time of CA simulations increases roughly linearly with the number of cells [56], which is relatively slowly compared to numerical methods such as FEM. In order to obtain an accurate description of the crystal envelopes, the size of the CA cells should be set to the order of the secondary dendrite arm’s spacing [54,62]. The cell size of the order of 1 μ m is has been used for CA simulations of SLM [11] and laser-based metal deposition [71] of 316 steel, as well as SLM [37] and laser melting [61] of Ti-6Al-4V alloy. There are, however, incidences of 10- μ m [62] and even 100- μ m [55] CA grids used in similar applications.
An analogue trade-off results from the choice of the time step δ t in CA simulations, where a diminishing δ t increases the accuracy of the simulation as well as the computational cost. Commonly, δ t is defined with respect to the CA cell size l C A and the velocity of the fastest growing dendrite tip V m a x . An appropriate δ t is chosen to prevent the dendrite tips from growing more than a fraction f of the cell size [11,12,37,60]. An additional limitation of the time step with respect to the diffusivity D is sometimes added [63,64]:
δ t = f m i n l C A 2 D , l C A V m a x .

4. Coupled Models

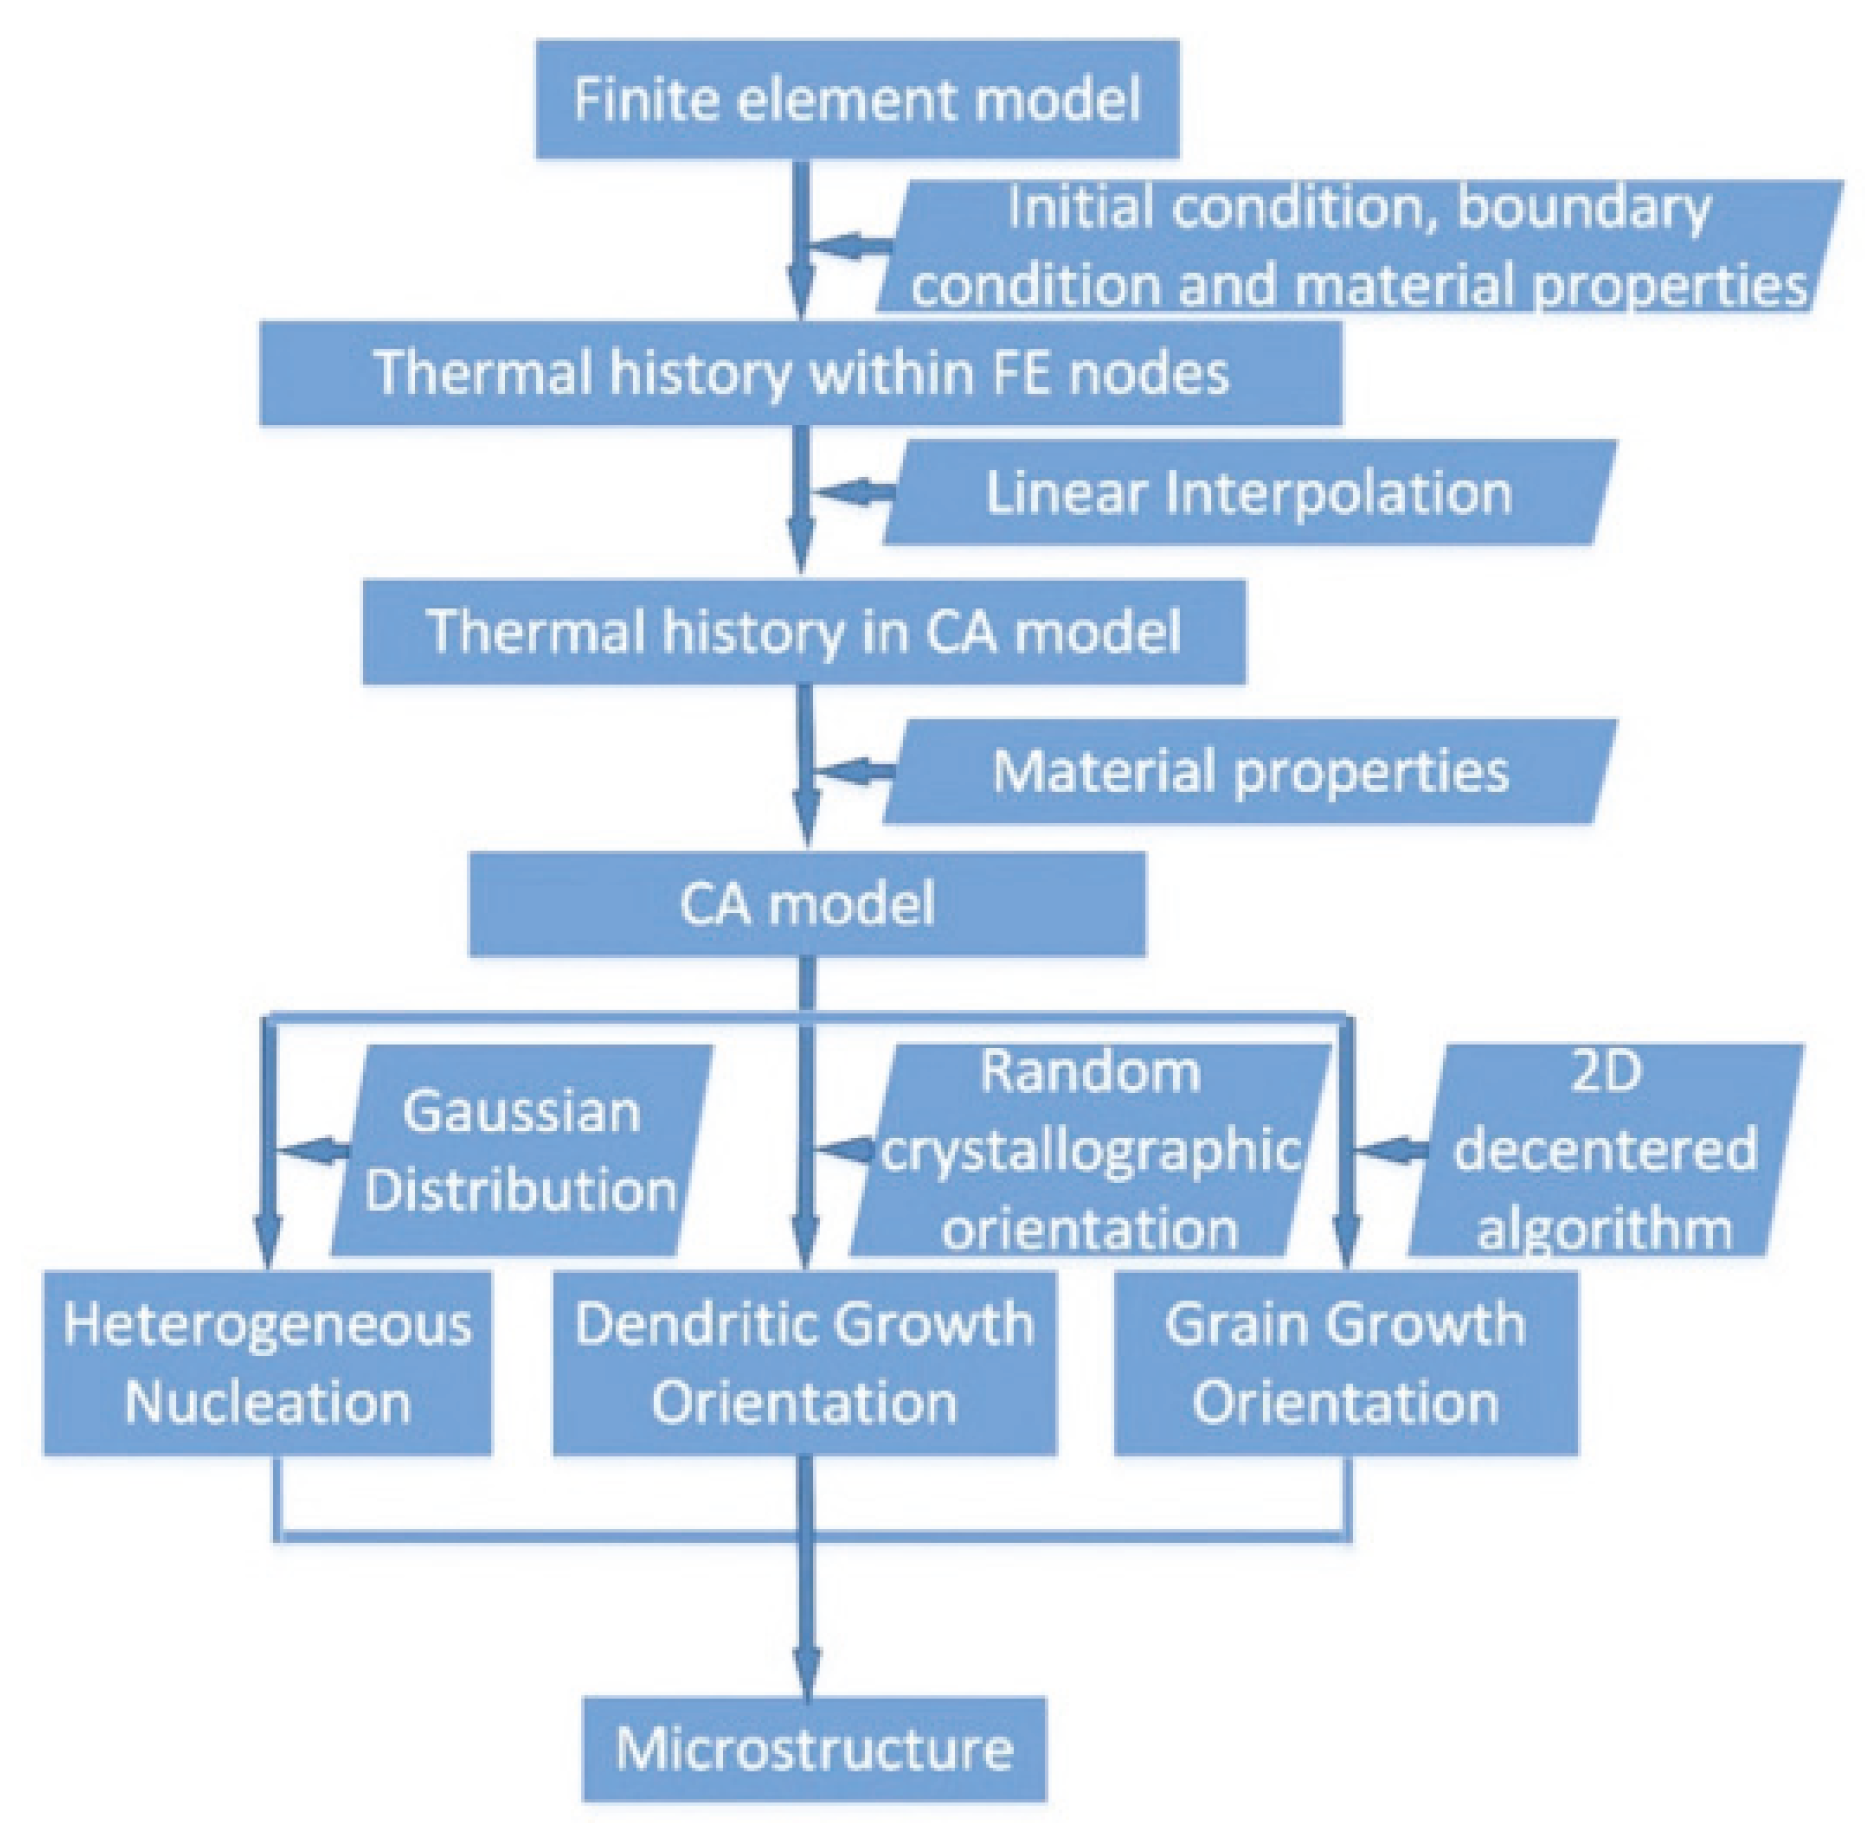
Coupling between the FEM and the CA, also referred to as the CAFE approach, is a useful tool to solve industrial boundary-value problems. The methodology has been successfully applied to casting [54,60,70], welding [55,73], laser-based deposition [62] and laser melting [61]. A flowchart of a simple CAFE coupled model as proposed by Zhang et al. [62] to simulate microstructure solidification in direct metal deposition is shown in Figure 7. The temperature history, obtained by FEM, is fed into the CA model in order to simulate the crystal growth during the passing of the laser. Fully coupled CAFE models, on the other hand, imply the macroscopic model (FEM) and the microscopic model (CA) running in parallel and feature an exchange of information between the two models for every time step of the macroscopic simulation. The release of latent heat during CA cell solidification is thus exported from the CA model into the following time step of the FEM model in the works of Gandin and Rappaz [54] and Carozzani et al. [60] and the solute mass exchange from the CA model is projected back to the FEM model to be used for the average conservation of the solute mass in the following macroscopic time step in the work of Gandin [33].
It should be noted at this point that although CAFE models are the most common approach to mesoscopic microstructure solidification modelling in boundary-value problems, alternative approaches such as the Finite Difference–Cellular Automata coupled approach by Zinoviev et al. [11] or the Cellular Automata–Lattice Boltzmann coupled model by Rai et al. [12] also exist.
The coupled use of the FEM and the CA does not impose the use of the same mesh for the two simulations. Instead, a coarser mesh is normally used for the FEM simulation of heat transfer and the temperature field obtained in the Gaussian nodes is then linearly interpolated to obtain the temperatures in the individual CA cells [33,54,60,61,62]. Similarly, the information computed on the CA grid can be projected back to the FEM grid [33,73]. The time step of the microscopic and the macroscopic simulation can likewise differ. Indeed, a smaller time step and several cycles of CA simulation are often performed for each time step of the FEM simulation [60,62,71].

5. Conclusions and Outlook

The field of additive manufacturing is providing unprecedented opportunities for manufacturing materials with a-la-carte microstructures and mechanical properties, and the race is on to control the solidifying microstructure during the manufacturing process. The research on the solidification process from smaller scales has already yielded simplified models of crystal growth than can be incorporated into larger-scale models. Furthermore, application of mesoscale models to processes such as casting, welding and laser melting helped clarify the role of different process parameters on the resulting microstructure. Additive manufacturing remains a problematic field in terms of microstructure prediction, mostly due to the long processing times and the changing geometry of the manufactured part. Several simplified two-dimensional models have already been developed and yielded promising results, but a coupled three-dimensional mesoscopic model of heat transfer and microstructure evolution, such as the ones developed for other industrial processes, has not yet been implemented. The successful application of these models to the field of additive manufacturing is also expected to become more likely with the ever-increasing computing power and the application of parallel computing, which is already under way.

Author Contributions

Conceptualization, T.M. and M.G.; investigation, T.M.; writing—original draft preparation, T.M.; writing—review and editing, M.G., A.K. and I.P.; supervision, M.G.; project administration, I.P.; funding acquisition, M.G. All authors have read and agreed to the published version of the manuscript.

Funding

The authors acknowledge the financial support from the Slovenian Research Agency (research core funding No. P2-0132 and the project founding No. J2-1729).

Conflicts of Interest

The authors declare no conflict of interest. The funders had no role in the design of the study; in the collection, analyses or interpretation of data; in the writing of the manuscript, or in the decision to publish the results.

Abbreviations

The following abbreviations are used in this manuscript:
SLMSelective laser melting
FEMFinite element method
FEFinite element
CACellular automata
CAFECoupled finite element-cellular automata approach

References

  1. Raghavan, N.; Dehoff, R.; Pannala, S.; Simunovic, S.; Kirka, M.; Turner, J.; Carlson, N.; Babu, S.S. Numerical modeling of heat-transfer and the influence of process parameters on tailoring the grain morphology of IN718 in electron beam additive manufacturing. Acta Mater. 2016, 112, 303–314. [Google Scholar] [CrossRef] [Green Version]
  2. Bikas, H.; Stavropoulos, P.; Chryssolouris, G. Additive manufacturing methods and modeling approaches: A critical review. Int. J. Adv. Manuf. Technol. 2016, 83, 389–405. [Google Scholar] [CrossRef] [Green Version]
  3. Olakanmi, E.O.; Cochrane, R.; Dalgarno, K. A review on selective laser sintering/melting (SLS/SLM) of aluminium alloy powders: Processing, microstructure, and properties. Progr. Mater. Sci. 2015, 74, 401–477. [Google Scholar] [CrossRef]
  4. Chang, I.; Zhao, Y. Advances in Powder Metallurgy: Properties, Processing and Applications; Elsevier: Amsterdam, The Netherlands, 2013; pp. 1–604. [Google Scholar] [CrossRef]
  5. Cooper, P.W. 3D Printing: A Potential Game Changer for Aerospace and Defense. Gain. Altit. 2013, 7. [Google Scholar]
  6. Gu, D. Laser Additive Manufacturing of High-Performance Materials; Springer: Amsterdam, The Netherlands, 2015. [Google Scholar]
  7. Thompson, S.M.; Bian, L.; Shamsaei, N.; Yadollahi, A. An overview of Direct Laser Deposition for additive manufacturing; Part I: Transport phenomena, modeling and diagnostics. Addit. Manuf. 2015, 8, 36–62. [Google Scholar] [CrossRef]
  8. Agius, D.; Kourousis, K.I.; Wallbrink, C. A review of the as-built SLM Ti-6Al-4V mechanical properties towards achieving fatigue resistant designs. Metals 2018, 8, 75. [Google Scholar] [CrossRef] [Green Version]
  9. Song, B.; Zhao, X.; Li, S.; Han, C.; Wei, Q.; Wen, S.; Liu, J.; Shi, Y. Differences in microstructure and properties between selective laser melting and traditional manufacturing for fabrication of metal parts: A review. Front. Mech. Eng. 2015, 10, 111–125. [Google Scholar] [CrossRef]
  10. Francois, M.M.; Sun, A.; King, W.E.; Henson, N.J.; Tourret, D.; Bronkhorst, C.A.; Carlson, N.N.; Newman, C.K.; Haut, T.; Bakosi, J.; et al. Modeling of additive manufacturing processes for metals: Challenges and opportunities. Curr. Opin. Solid State Mater. Sci. 2017, 21, 198–206. [Google Scholar] [CrossRef]
  11. Zinoviev, A.; Zinovieva, O.; Ploshikhin, V.; Romanova, V.; Balokhonov, R. Evolution of grain structure during laser additive manufacturing. Simulation by a cellular automata method. Mater. Des. 2016, 106, 321–329. [Google Scholar] [CrossRef]
  12. Rai, A.; Markl, M.; Körner, C. A coupled Cellular Automaton–Lattice Boltzmann model for grain structure simulation during additive manufacturing. Comput. Mater. Sci. 2016, 124, 37–48. [Google Scholar] [CrossRef]
  13. Zhang, X.; Yocom, C.J.; Mao, B.; Liao, Y. Microstructure evolution during selective laser melting of metallic materials: A review. J. Laser Appl. 2019, 31, 031201. [Google Scholar] [CrossRef]
  14. Karma, A.; Tourret, D. Atomistic to continuum modeling of solidification microstructures. Curr. Opin. Solid State Mater. Sci. 2016, 20, 25–36. [Google Scholar] [CrossRef] [Green Version]
  15. Dehoff, R.R.; Kirka, M.; Sames, W.J.; Bilheux, H.; Tremsin, A.S.; Lowe, L.E.; Babu, S.S. Site specific control of crystallographic grain orientation through electron beam additive manufacturing. Mater. Sci. Technol. 2015, 31, 931–938. [Google Scholar] [CrossRef]
  16. Boettinger, W.J.; Warren, J.A.; Beckermann, C.; Karma, A. Phase-field simulation of solidification. Ann. Rev. Mater. Sci. 2002, 32, 163–194. [Google Scholar] [CrossRef]
  17. Nie, P.; Ojo, O.A.; Li, Z. Numerical modeling of microstructure evolution during laser additive manufacturing of a nickel-based superalloy. Acta Mater. 2014, 77, 85–95. [Google Scholar] [CrossRef]
  18. Tourret, D.; Clarke, A.J.; Imhoff, S.D.; Gibbs, P.J.; Gibbs, J.W.; Karma, A. Three-Dimensional Multiscale Modeling of Dendritic Spacing Selection During Al-Si Directional Solidification. JOM 2015, 67, 1776–1785. [Google Scholar] [CrossRef]
  19. Trivedi, R.; Kurz, W. Theory of microstructural development during rapid solidification. In Science and Technology of the Undercooled Melt; Springer: Berlin, Germany, 1986; pp. 260–267. [Google Scholar]
  20. Tan, J.H.K.; Sing, S.L.; Yeong, W.Y. Microstructure modelling for metallic additive manufacturing: A review. Virt. Phys. Prototyp. 2020, 15, 87–105. [Google Scholar] [CrossRef]
  21. Cho, D.H. Determining the Temperature Field of Selective Laser Melting Process for Different Heat Source Paths. Ph.D. Thesis, Northeastern University, Boston, MA, USA, 2016. [Google Scholar]
  22. Dai, D.; Gu, D. Thermal behavior and densification mechanism during selective laser melting of copper matrix composites: Simulation and experiments. Mater. Des. 2014, 55, 482–491. [Google Scholar] [CrossRef]
  23. Minkowycz, W.J.; Sparrow, E.M.; Murthy, J.Y. Handbook of Numerical Heat Transfer, 2nd ed.; Wiley: Boca Raton, FL, USA, 2000. [Google Scholar]
  24. Gao, Y.; Xing, J.; Zhang, J.; Luo, N.; Zheng, H. Research on measurement method of selective laser sintering (SLS) transient temperature. Optik 2008, 119, 618–623. [Google Scholar] [CrossRef]
  25. Matsumoto, M.; Shiomi, M.; Osakada, K.; Abe, F. Finite element analysis of single layer forming on metallic powder bed in rapid prototyping by selective laser processing. Int. J. Mach. Tools Manuf. 2002, 42, 61–67. [Google Scholar] [CrossRef]
  26. Patil, R.B.; Yadava, V. Finite element analysis of temperature distribution in single metallic powder layer during metal laser sintering. Int. J. Mach. Tools Manuf. 2007, 47, 1069–1080. [Google Scholar] [CrossRef]
  27. Kolossov, S.; Boillat, E.; Glardon, R.; Fischer, P.; Locher, M. 3D FE simulation for temperature evolution in the selective laser sintering process. Int. J. Mach. Tools Manuf. 2004, 44, 117–123. [Google Scholar] [CrossRef]
  28. Carslaw, H.S.; Jaeger, J.C. Conduction of Heat in Solids; Clarendon Press: Oxford, UK, 1959. [Google Scholar]
  29. Ansari, M.J.; Nguyen, D.S.; Park, H.S. Investigation of SLM process in terms of temperature distribution and melting pool size: Modeling and experimental approaches. Materials 2019, 12, 1272. [Google Scholar] [CrossRef] [PubMed] [Green Version]
  30. Badrossamay, M.; Childs, T.H. Further studies in selective laser melting of stainless and tool steel powders. Int. J. Mach. Tools Manuf. 2007, 47, 779–784. [Google Scholar] [CrossRef]
  31. Foroozmehr, A.; Badrossamay, M.; Foroozmehr, E.; Golabi, S. Finite Element Simulation of Selective Laser Melting process considering Optical Penetration Depth of laser in powder bed. Mater. Des. 2016, 89, 255–263. [Google Scholar] [CrossRef]
  32. Hussein, A.; Hao, L.; Yan, C.; Everson, R. Finite element simulation of the temperature and stress fields in single layers built without-support in selective laser melting. Mater. Des. 2013, 52, 638–647. [Google Scholar] [CrossRef]
  33. Gandin, C.A. Modélisation de la solidification: Structures de grains et ségrégations des alliages métalliques. Comptes Rendus Phys. 2010, 11, 216–225. [Google Scholar] [CrossRef]
  34. Ma, L.; Bin, H. Temperature and stress analysis and simulation in fractal scanning-based laser sintering. Int. J. Adv. Manuf. Technol. 2007, 34, 898–903. [Google Scholar] [CrossRef]
  35. Dai, K.; Shaw, L. Thermal and mechanical finite element modeling of laser forming from metal and ceramic powders. Acta Mater. 2004, 52, 69–80. [Google Scholar] [CrossRef]
  36. Li, Y.; Gu, D. Thermal behavior during selective laser melting of commercially pure titanium powder: Numerical simulation and experimental study. Addit. Manuf. 2014, 1, 99–109. [Google Scholar] [CrossRef]
  37. Yang, J.; Yu, H.; Yang, H.; Li, F.; Wang, Z.; Zeng, X. Prediction of microstructure in selective laser melted Ti–6Al–4V alloy by cellular automaton. J. Alloys Compd. 2018, 748, 281–290. [Google Scholar] [CrossRef]
  38. Ilin, A.; Logvinov, R.; Kulikov, A.; Prihodovsky, A.; Xu, H.; Ploshikhin, V.; Günther, B.; Bechmann, F. Computer aided optimisation of the thermal management during laser beam melting process. Phys. Proc. 2014, 56, 390–399. [Google Scholar] [CrossRef] [Green Version]
  39. Fischer, P.; Romano, V.; Weber, H.P.; Karapatis, N.P.; Boillat, E.; Glardon, R. Sintering of commercially pure titanium powder with a Nd:YAG laser source. Acta Mater. 2003, 51, 1651–1662. [Google Scholar] [CrossRef]
  40. Goldak, J.A.; Akhlaghi, M. Computational Welding Mechanics; Springer Science & Business Media: Berlin, Germany, 2006. [Google Scholar]
  41. Shiomi, M.; Yoshidome, A.; Abe, F.; Osakada, K. Finite element analysis of melting and solidifying processes in laser rapid prototyping of metallic powders. Int. J. Mach. Tools Manuf. 1999, 39, 237–252. [Google Scholar] [CrossRef]
  42. Yu, G.; Masubuchi, K.; Maekawa, T.; Patrikalakis, N. FEM simulation of laser forming of metal plates. J. Manuf. Sci. Eng. 2001, 123, 405–410. [Google Scholar] [CrossRef]
  43. Khairallah, S.A.; Anderson, A. Mesoscopic simulation model of selective laser melting of stainless steel powder. J. Mater. Proc. Technol. 2014, 214, 2627–2636. [Google Scholar] [CrossRef]
  44. Lee, Y.; Zhang, W. Modeling of heat transfer, fluid flow and solidification microstructure of nickel-base superalloy fabricated by laser powder bed fusion. Addit. Manuf. 2016, 12, 178–188. [Google Scholar] [CrossRef] [Green Version]
  45. Qiu, C.; Panwisawas, C.; Ward, M.; Basoalto, H.C.; Brooks, J.W.; Attallah, M.M. On the role of melt flow into the surface structure and porosity development during selective laser melting. Acta Mater. 2015, 96, 72–79. [Google Scholar] [CrossRef] [Green Version]
  46. Dai, K.; Li, X.X.; Shaw, L.L. Comparisons between thermal modeling and experiments: Effects of substrate preheating. Rapid Prototyp. J. 2004, 10, 24–34. [Google Scholar] [CrossRef]
  47. Lott, P.; Schleifenbaum, H.; Meiners, W.; Wissenbach, K.; Hinke, C.; Bültmann, J. Design of an optical system for the in situ process monitoring of selective laser melting (SLM). Phys. Proc. 2011, 12, 683–690. [Google Scholar] [CrossRef]
  48. Clijsters, S.; Craeghs, T.; Buls, S.; Kempen, K.; Kruth, J.P. In situ quality control of the selective laser melting process using a high-speed, real-time melt pool monitoring system. Int. J. Adv. Manuf. Technol. 2014, 75, 1089–1101. [Google Scholar] [CrossRef]
  49. Khanzadeh, M.; Chowdhury, S.; Tschopp, M.A.; Doude, H.R.; Marufuzzaman, M.; Bian, L. In-situ monitoring of melt pool images for porosity prediction in directed energy deposition processes. IISE Trans. 2019, 51, 437–455. [Google Scholar] [CrossRef]
  50. López, O.; Martínez-Hernández, U.; Ramírez, J.; Pinna, C.; Mumtaz, K. Simulating the microstructural evolution of a Selective Laser Melted AA-2024. In Proceedings of the 27th Annual International Solid Freeform Fabrication Symposium in Austin, Austin, TX, USA, 17–19 August 2016; pp. 257–267. [Google Scholar]
  51. Spittle, J.; Brown, S. Computer simulation of the effects of alloy variables on the grain structures of castings. Acta Metall. 1989, 37, 1803–1810. [Google Scholar] [CrossRef]
  52. Anderson, M.; Srolovitz, D.; Grest, G.; Sahni, P. Computer simulation of grain growth—I. Kinetics. Acta Metall. 1984, 32, 783–791. [Google Scholar] [CrossRef]
  53. Rodgers, T.M.; Madison, J.D.; Tikare, V.; Maguire, M.C. Predicting Mesoscale Microstructural Evolution in Electron Beam Welding. JOM 2016, 68, 1419–1426. [Google Scholar] [CrossRef] [Green Version]
  54. Gandin, C.A.; Rappaz, M. A coupled finite element-cellular automaton model for the prediction of dendritic grain structures in solidification processes. Acta Metall. Mater. 1994, 42, 2233–2246. [Google Scholar] [CrossRef]
  55. Chen, S.; Guillemot, G.; Gandin, C.A. 3D coupled cellular automaton (CA)–finite element (FE) modeling for solidification grain structures in gas tungsten arc welding (GTAW). ISIJ Int. 2014, 54, 401–407. [Google Scholar] [CrossRef] [Green Version]
  56. Rappaz, M.; Gandin, C.A. Probabilistic modelling of microstructure formation in solidification processes. Acta Metall. Mater. 1993, 41, 345–360. [Google Scholar] [CrossRef]
  57. Zhan, X.; Wei, Y.; Dong, Z. Cellular automaton simulation of grain growth with different orientation angles during solidification process. J. Mater. Proc. Technol. 2008, 208, 1–8. [Google Scholar] [CrossRef]
  58. Hesselbarth, H.W.; Göbel, I. Simulation of recrystallization by cellular automata. Acta Metall. Mater. 1991, 39, 2135–2143. [Google Scholar] [CrossRef]
  59. Oldfield, W. A quantitative approach to casting solidification: Freezing of cast iron. Trans. Am. Math. Soc. 1966, 59, 945–960. [Google Scholar]
  60. Carozzani, T.; Digonnet, H.; Gandin, C.A. 3D CAFE modeling of grain structures: Application to primary dendritic and secondary eutectic solidification. Mod. Simul. Mater. Sci. Eng. 2012, 20, 015010. [Google Scholar] [CrossRef]
  61. Dezfoli, A.R.A.; Hwang, W.S.; Huang, W.C.; Tsai, T.W. Determination and controlling of grain structure of metals after laser incidence: Theoretical approach. Sci. Rep. 2017, 7, 41527. [Google Scholar] [CrossRef] [PubMed] [Green Version]
  62. Zhang, J.; Liou, F.; Seufzer, W.; Taminger, K. A coupled finite element cellular automaton model to predict thermal history and grain morphology of Ti-6Al-4V during direct metal deposition (DMD). Addit. Manuf. 2016, 11, 32–39. [Google Scholar] [CrossRef]
  63. Zinovieva, O.; Zinoviev, A.; Ploshikhin, V.; Romanova, V.; Balokhonov, R. A solution to the problem of the mesh anisotropy in cellular automata simulations of grain growth. Comput. Mater. Sci. 2015, 108, 168–176. [Google Scholar] [CrossRef]
  64. Ao, X.; Xia, H.; Liu, J.; He, Q. Simulations of microstructure coupling with moving molten pool by selective laser melting using a cellular automaton. Mater. Des. 2020, 185, 108230. [Google Scholar] [CrossRef]
  65. Rappaz, M. Modelling of microstructure formation in solidification processes. Int. Mater. Rev. 1989, 34, 93–124. [Google Scholar] [CrossRef]
  66. Carozzani, T.; Gandin, C.A.; Digonnet, H. Optimized parallel computing for cellular automaton-finite element modeling of solidification grain structures. Modell. Simul. Mater. Sci. Eng. 2014, 22, 015012. [Google Scholar] [CrossRef]
  67. Lipton, J.; Glicksman, M.; Kurz, W. Dendritic growth into undercooled alloy metals. Mater. Sci. Eng. 1984, 65, 57–63. [Google Scholar] [CrossRef]
  68. Ivantsov, G. The temperature field around a spherical, cylindrical, or pointed crystal growing in a cooling solution. Dokl. Akad. Nauk SSSR 1947, 58, 567–569. [Google Scholar]
  69. Müller, G.; Métois, J.J.; Rudolph, P. Crystal Growth-From Fundamentals to Technology; Elsevier: Amsterdam, The Netherlands, 2004. [Google Scholar]
  70. Carozzani, T.; Gandin, C.A.; Digonnet, H.; Bellet, M.; Zaidat, K.; Fautrelle, Y. Direct simulation of a solidification benchmark experiment. Metall. Mater. Trans. A Phys. Metall. Mater. Sci. 2013, 44, 873–887. [Google Scholar] [CrossRef] [Green Version]
  71. Zhang, J.; Liou, F.; Seufzer, W.; Newkirk, J.; Fan, Z.; Liu, H.; Sparks, T.E. Probabilistic simulation of solidification microstructure evolution during laser-based metal deposition. In Proceedings of the 24th International SFF Symposium—An Additive Manufacturing Conference, Austin, TX, USA, 12–14 August 2013; pp. 739–748. [Google Scholar]
  72. Gandin, C.A.; Rappaz, M. A 3D cellular automaton algorithm for the prediction of dendritic grain growth. Acta Materialia 1997, 45, 2187–2195. [Google Scholar] [CrossRef]
  73. Guillemot, G.; Desmaison, O.; Chen, S.; Bellet, M.; Gandin, C.A. A multi-physic CAFE approach for the simulation of grain structure development in GMAW processes. In 11th International Seminar on Numerical Analysis of Weldability, Seggau, Austria, 27–30 September 2015, Proceedings in Mathematical Modelling of Weld Phenomena 11; The Institute for Materials Science and Welding (IWS) at Graz University of Technology (TU Graz): Graz, Austria, 2015; p. 16. [Google Scholar]
Figure 1. Schematic representation of (a) manufactured object microstructure; (b) macroscopic scale methods where microstructure is represented by variables such as grain anisotropy, etc. at a relatively low computational cost; (c) mesoscopic scale methods, representing a compromise solution at a moderate numerical cost and delivering microstructure at a lower resolution by tracking solely the grain envelopes; and (d) microscopic scale methods, where the complete dendritic grain microstructure is modelled at a high numerical cost.
Metals 10 00800 g001
Figure 2. Temperature contours during selective laser melting (SLM) process on Ti6Al4V powder bed [29].
Metals 10 00800 g002
Figure 3. Details of the FEM simulation of temperature field evolution during SLM fabrication, performed by Hussein et al. [32]: (a) conformal mesh refinement in the laser scan region; (b) Gaussian laser-energy density distribution.
Metals 10 00800 g003
Figure 4. (a) Solidified microstructure after electron-beam welding, modelled with Kinetic Monte Carlo method by Rodgers et al. [53]; (b) solidified microstructure after gas tungsten arc welding, modelled with cellular automata by Chen et al. [55].
Metals 10 00800 g004
Figure 5. Separate Gaussian distributions for nucleation density in the bulk of the liquid and on the meltpool borders, a schematic representation of nuclei distribution in the meltpool and a zoom into an individual growing grain.
Metals 10 00800 g005
Figure 6. Schematics for the growth of a nucleus, whose crystallographic direction has a divergence angle with respect to the cellular-automata (CA) lattice, as presented by Zhan et al. [57]: (a) the crystallographic orientation of the nucleus; (b) expected growth process; (c) actual growth process.
Metals 10 00800 g006
Figure 7. Flowchart of CAFE coupling as proposed by Zhang et al. [62].
Metals 10 00800 g007