Heterogeneous Distribution of Microstrain Evolved During Tensile Deformation of Polycrystalline Plain Low Carbon Steel


Abstract
1. Introduction
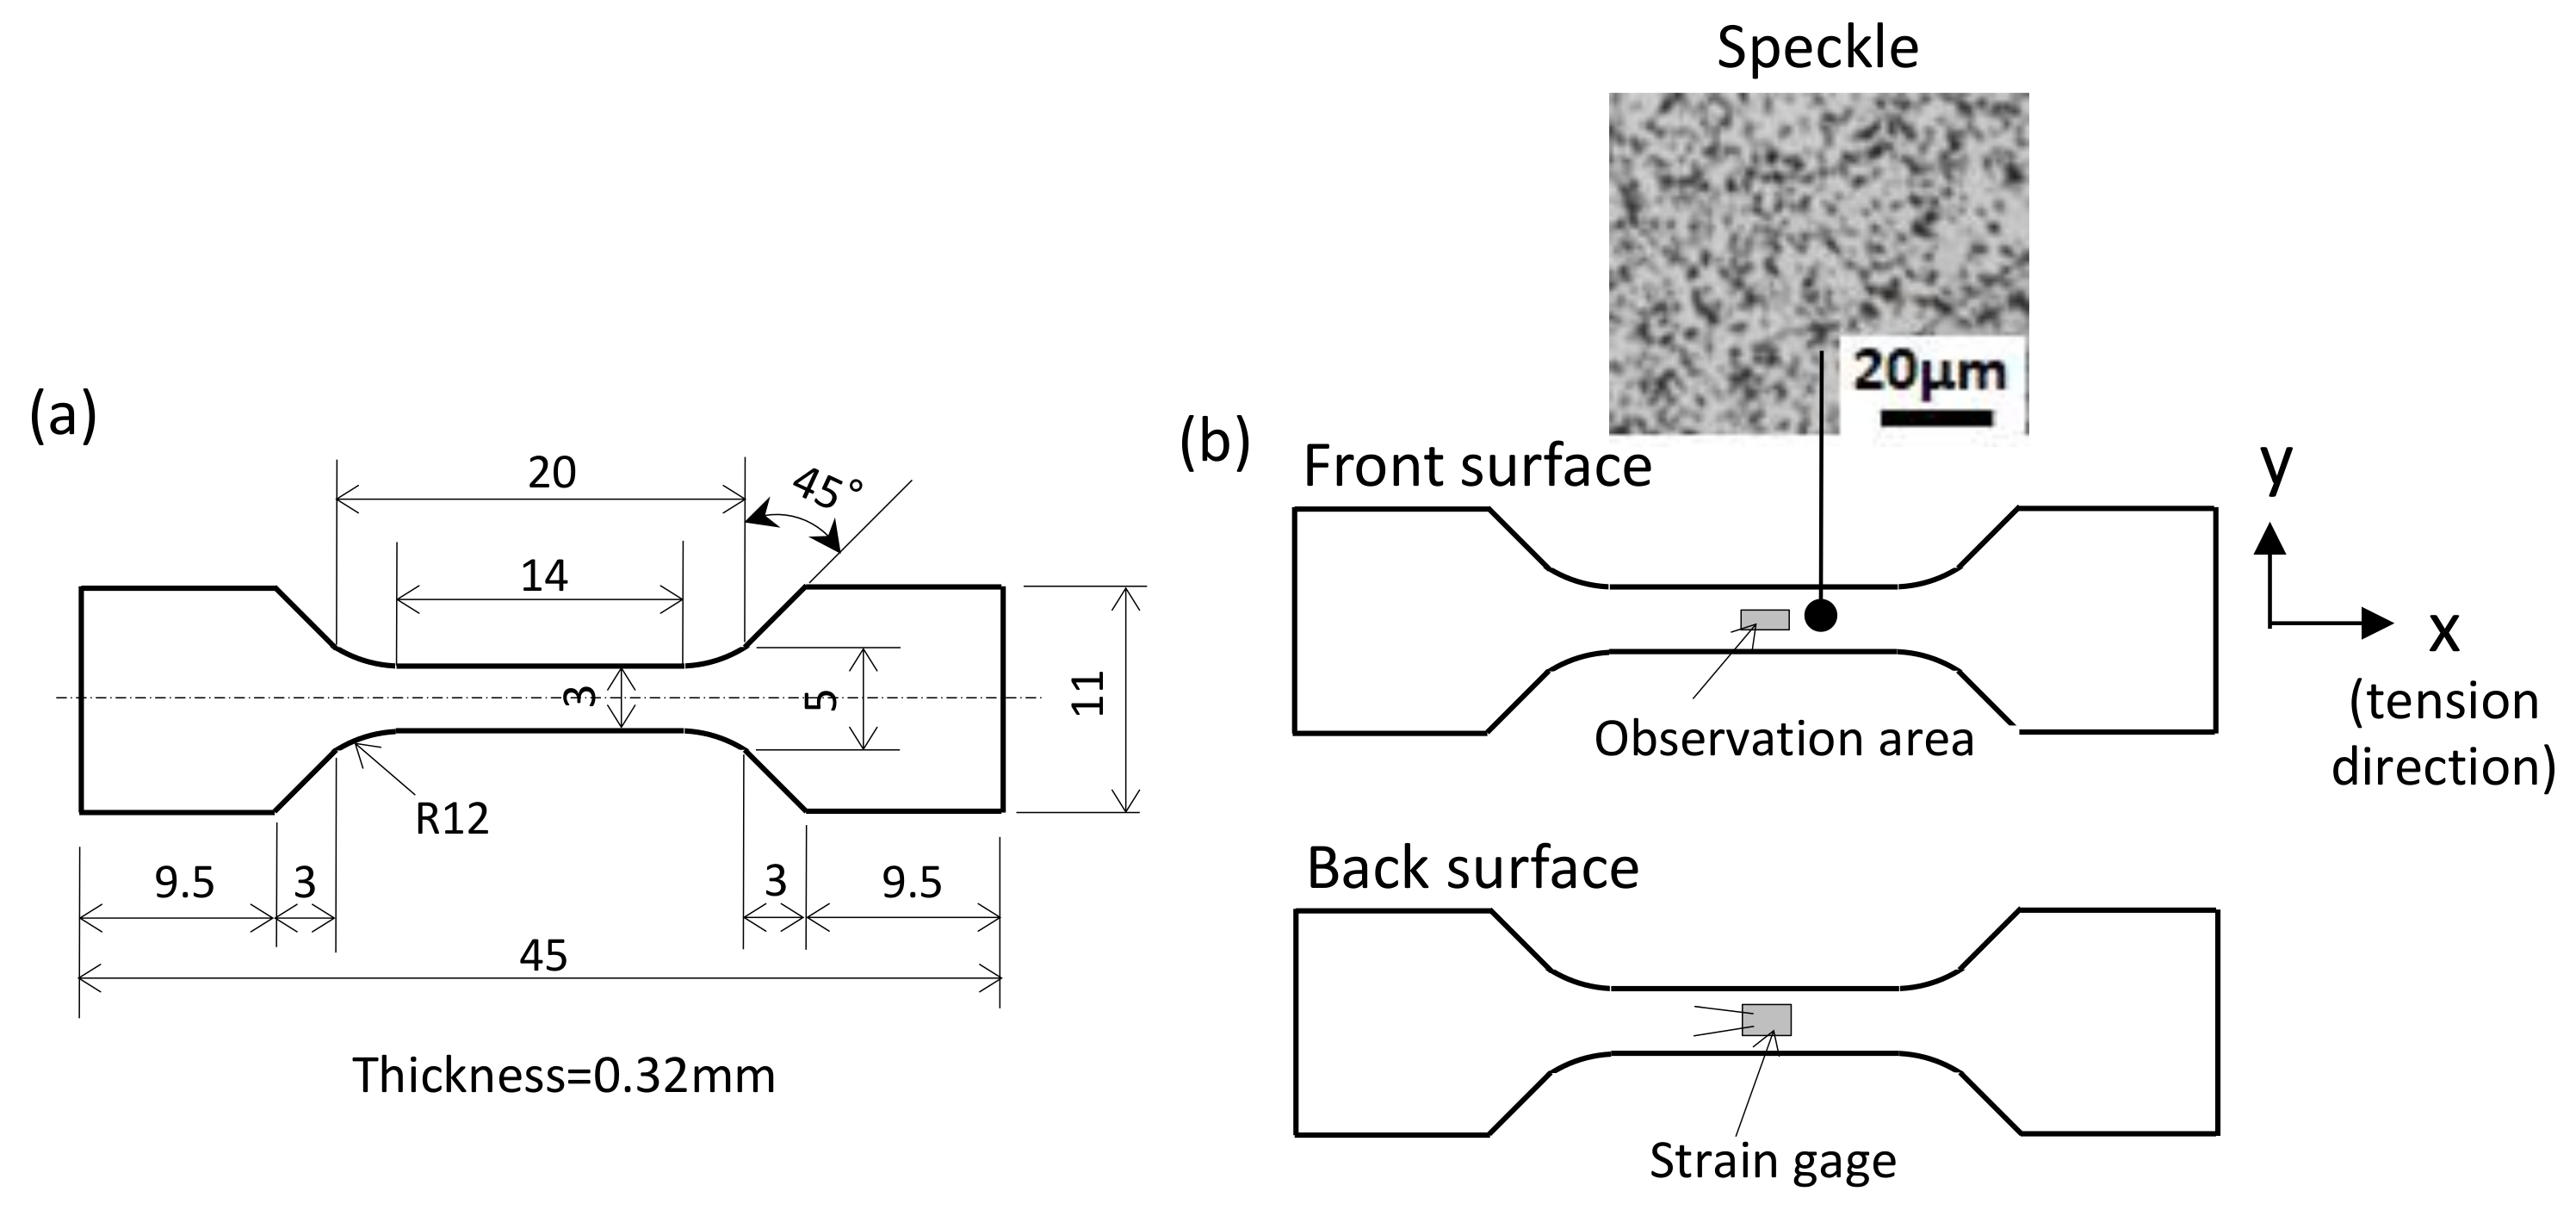
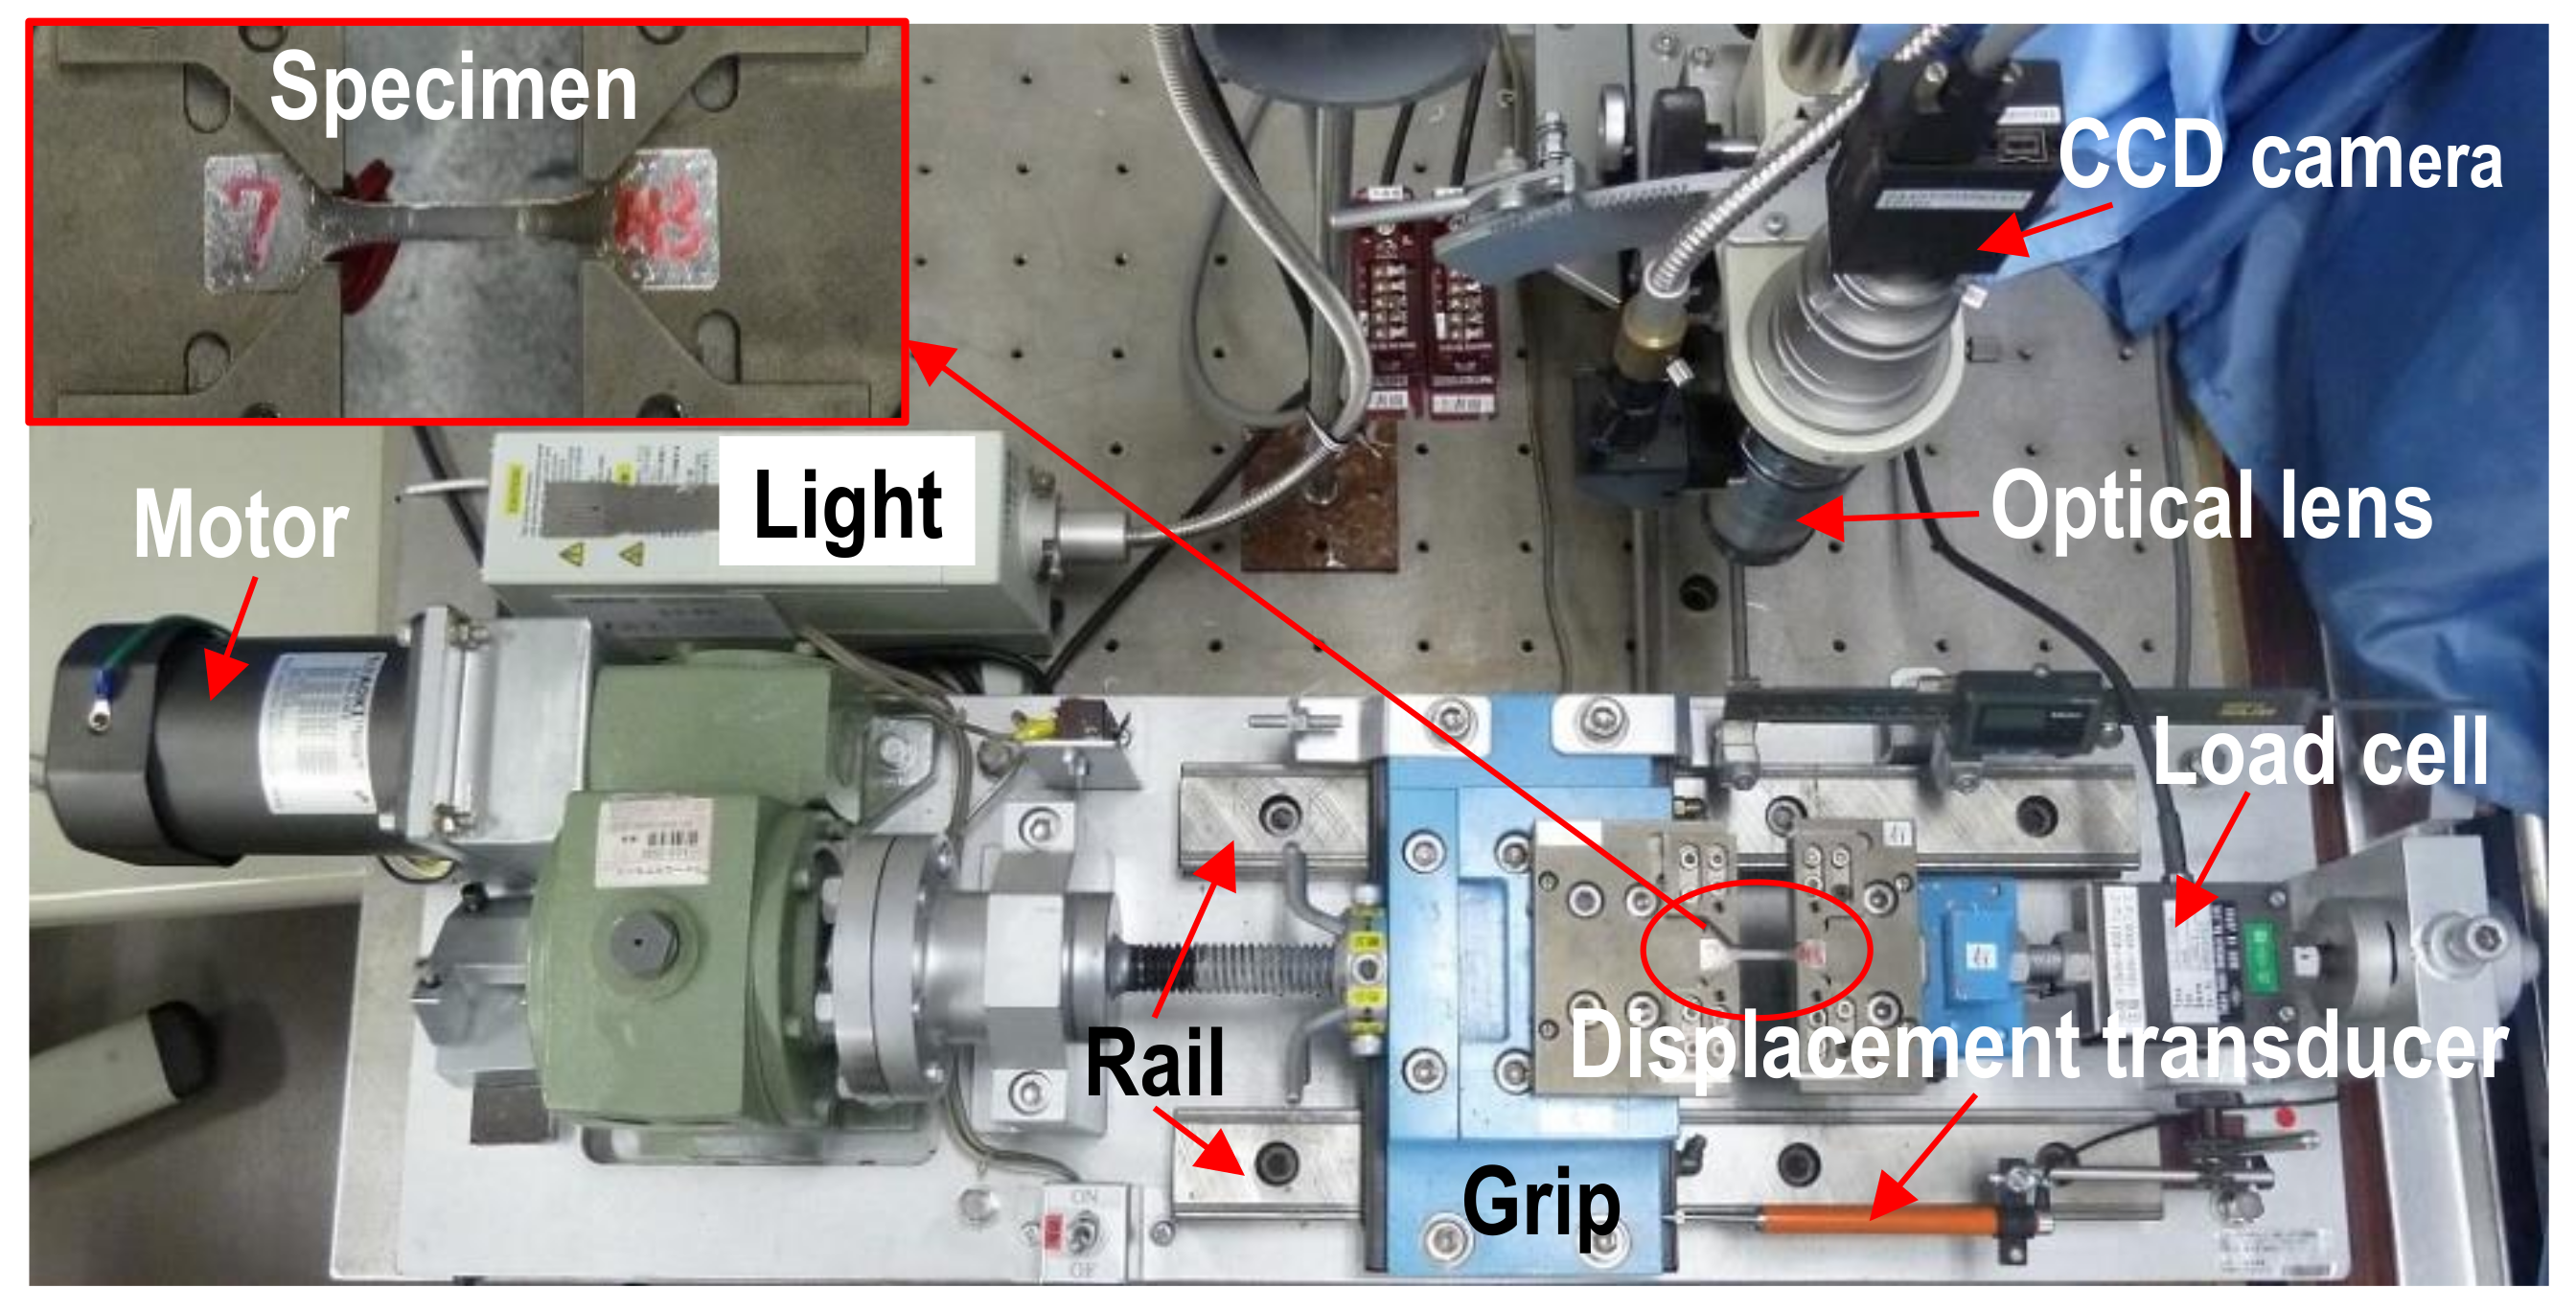
2. Materials and Methods
3. Results
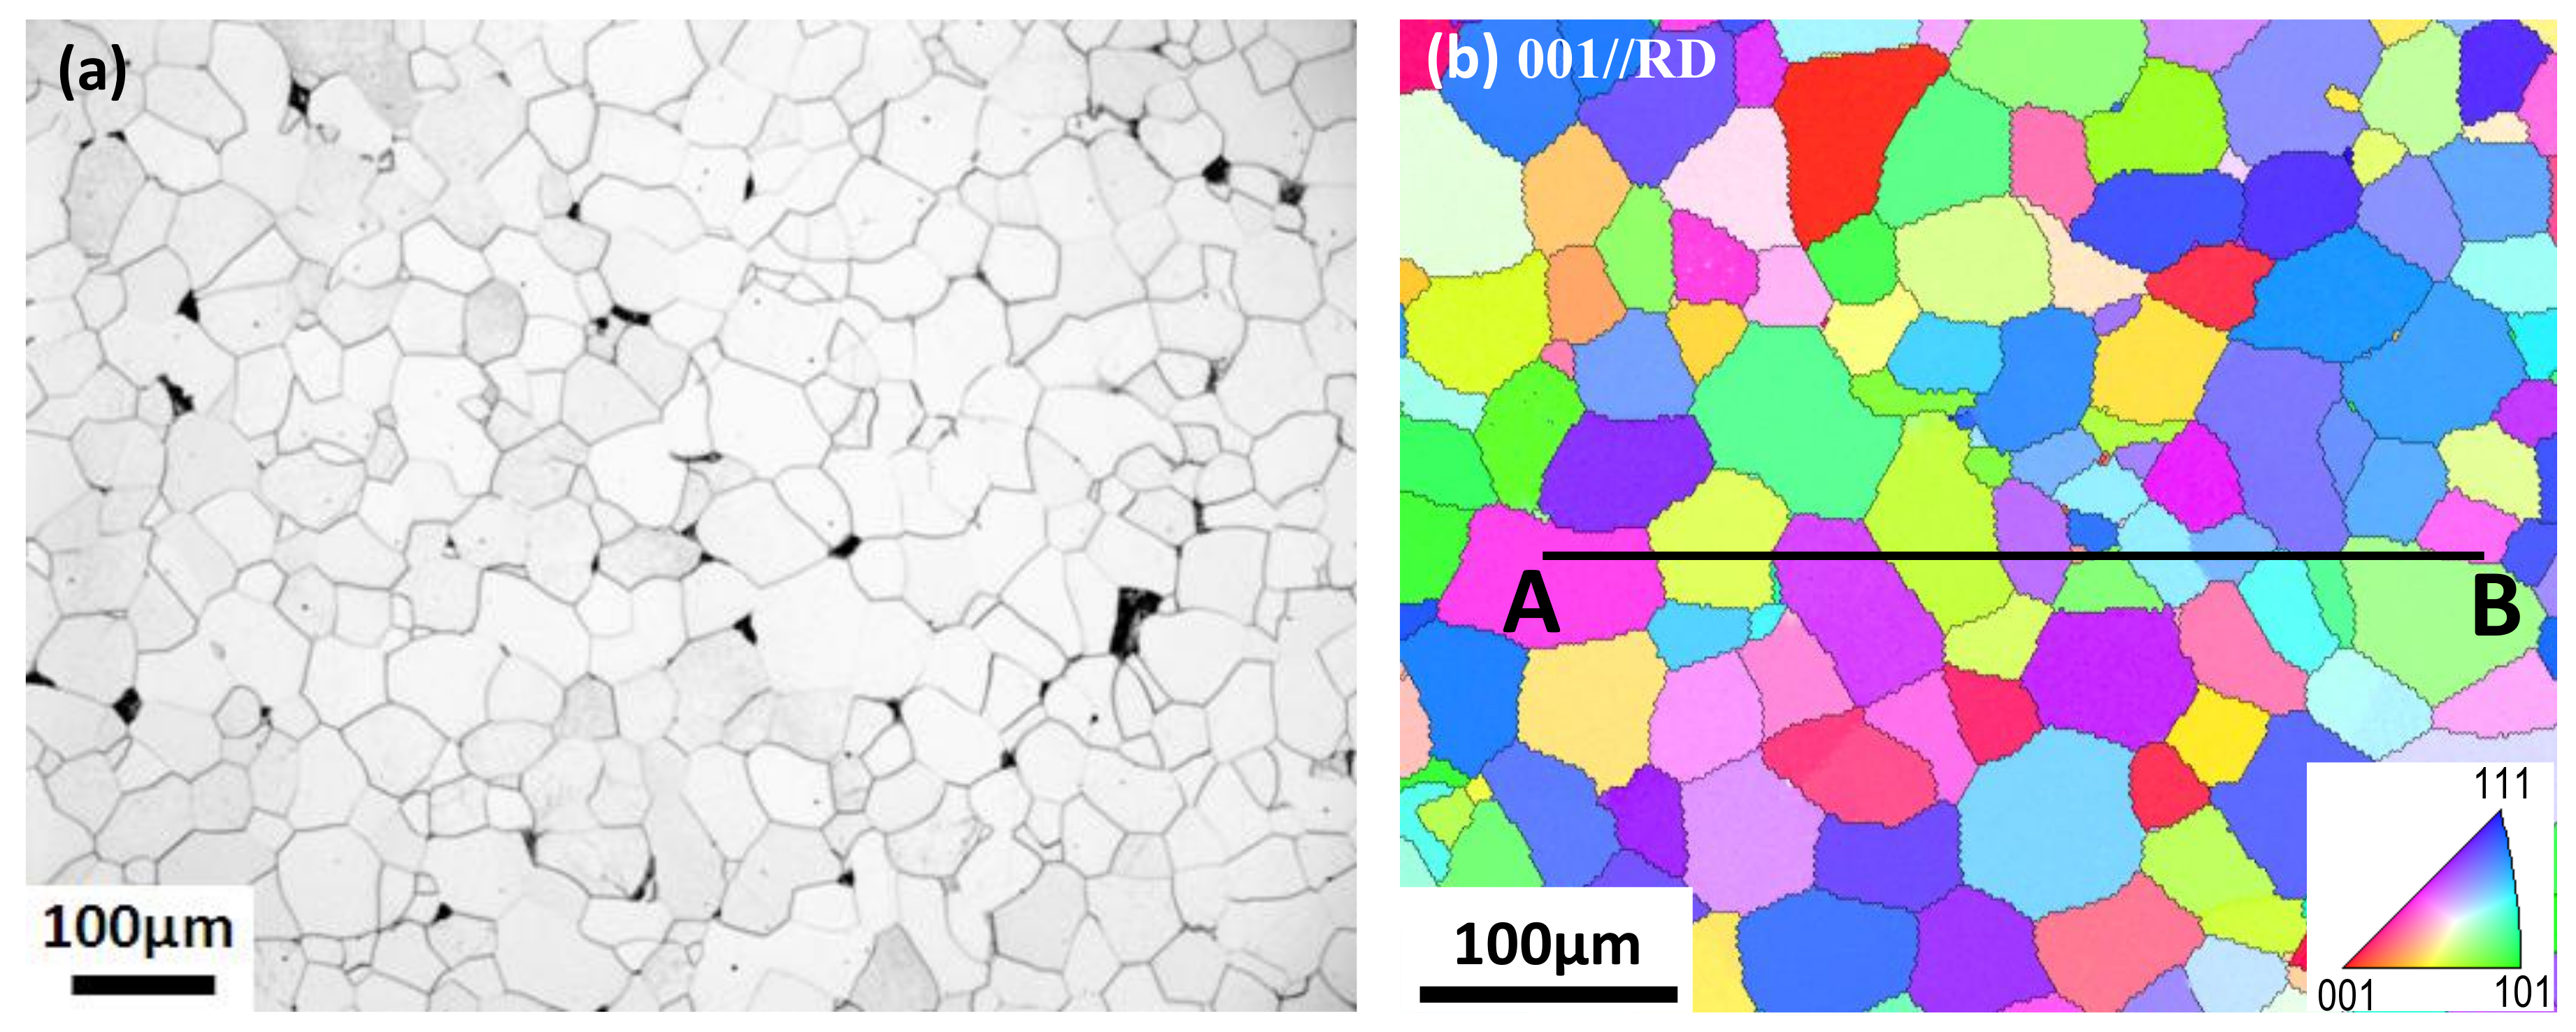
3.1. Microstructure
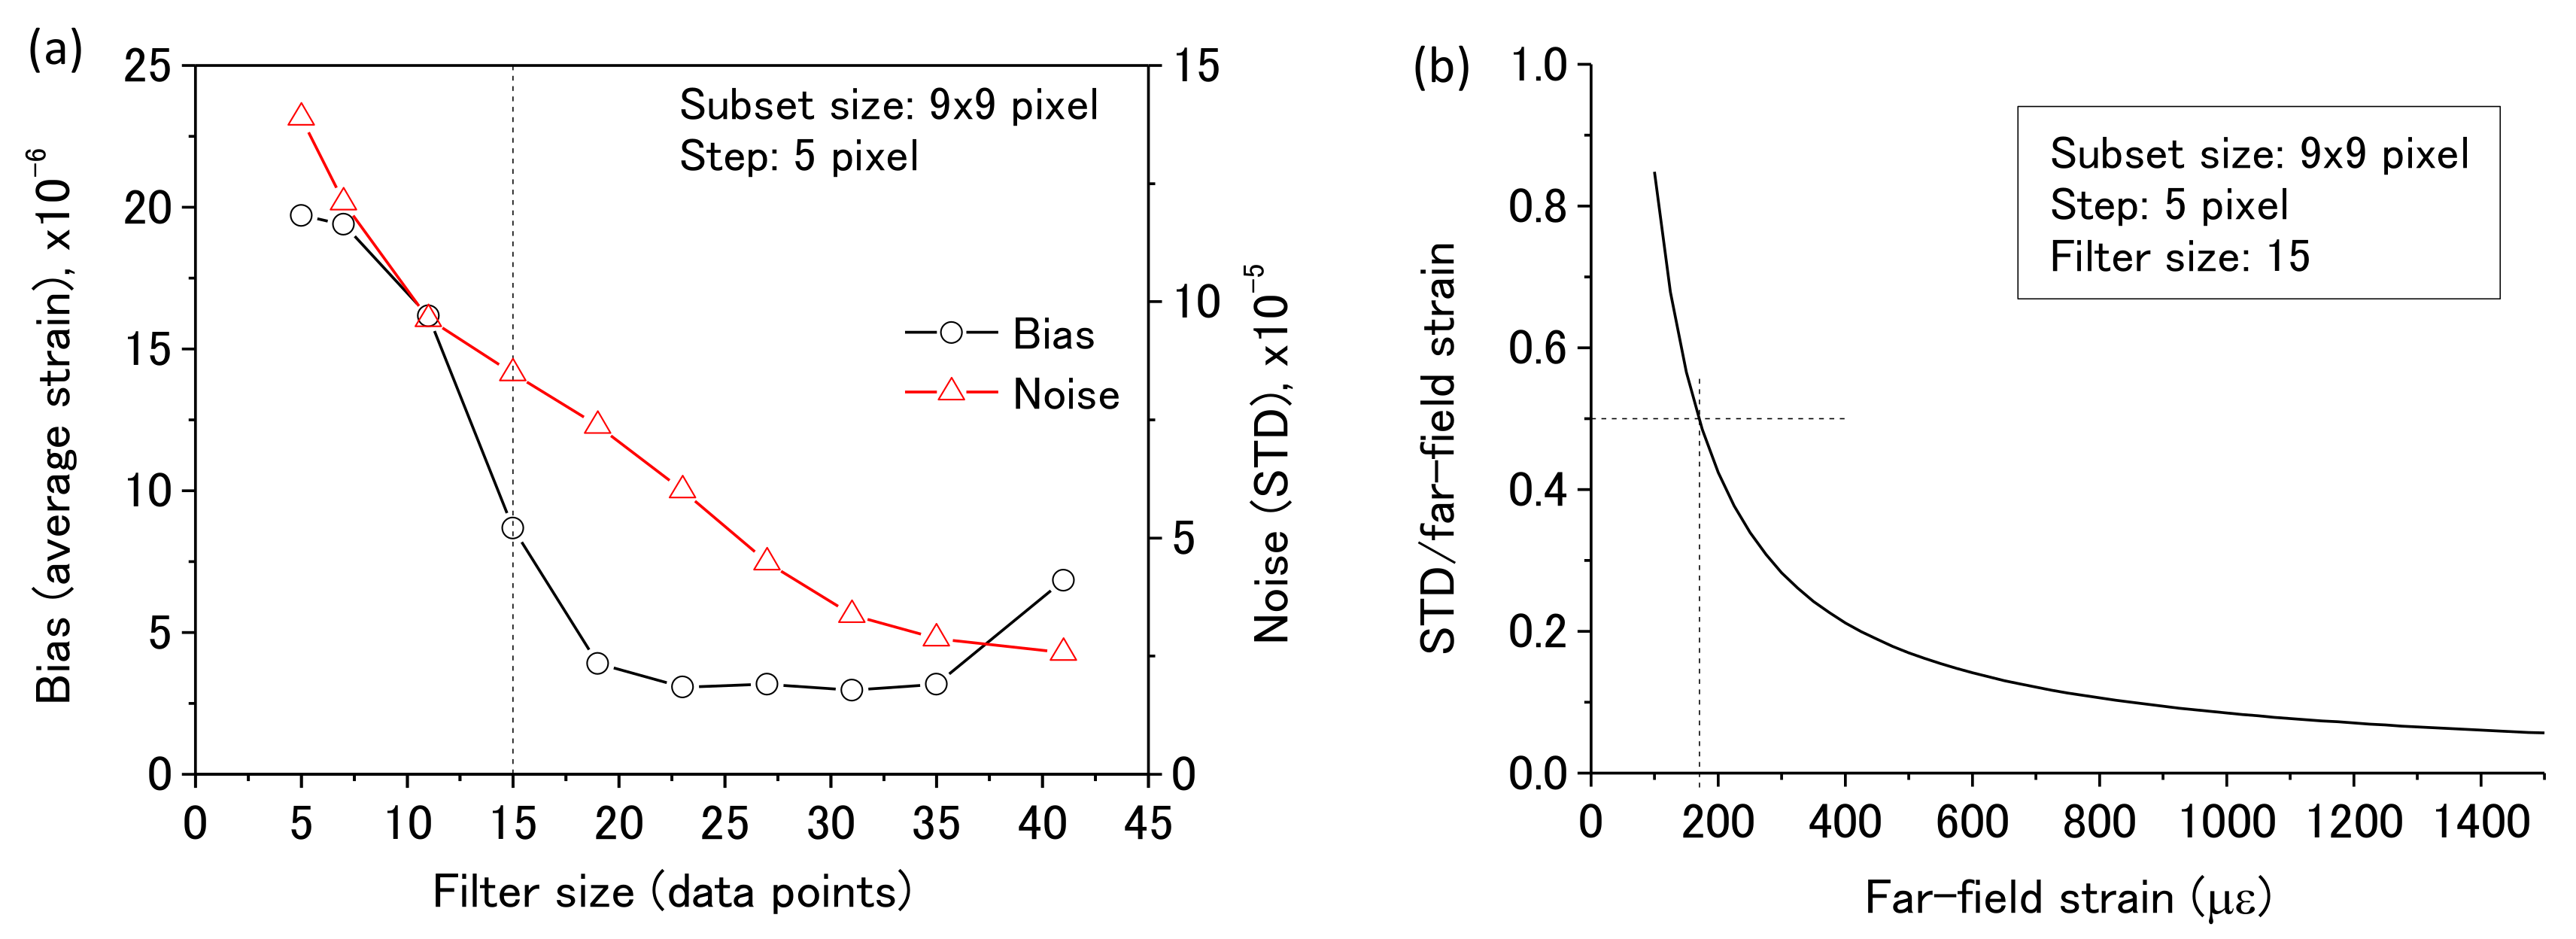
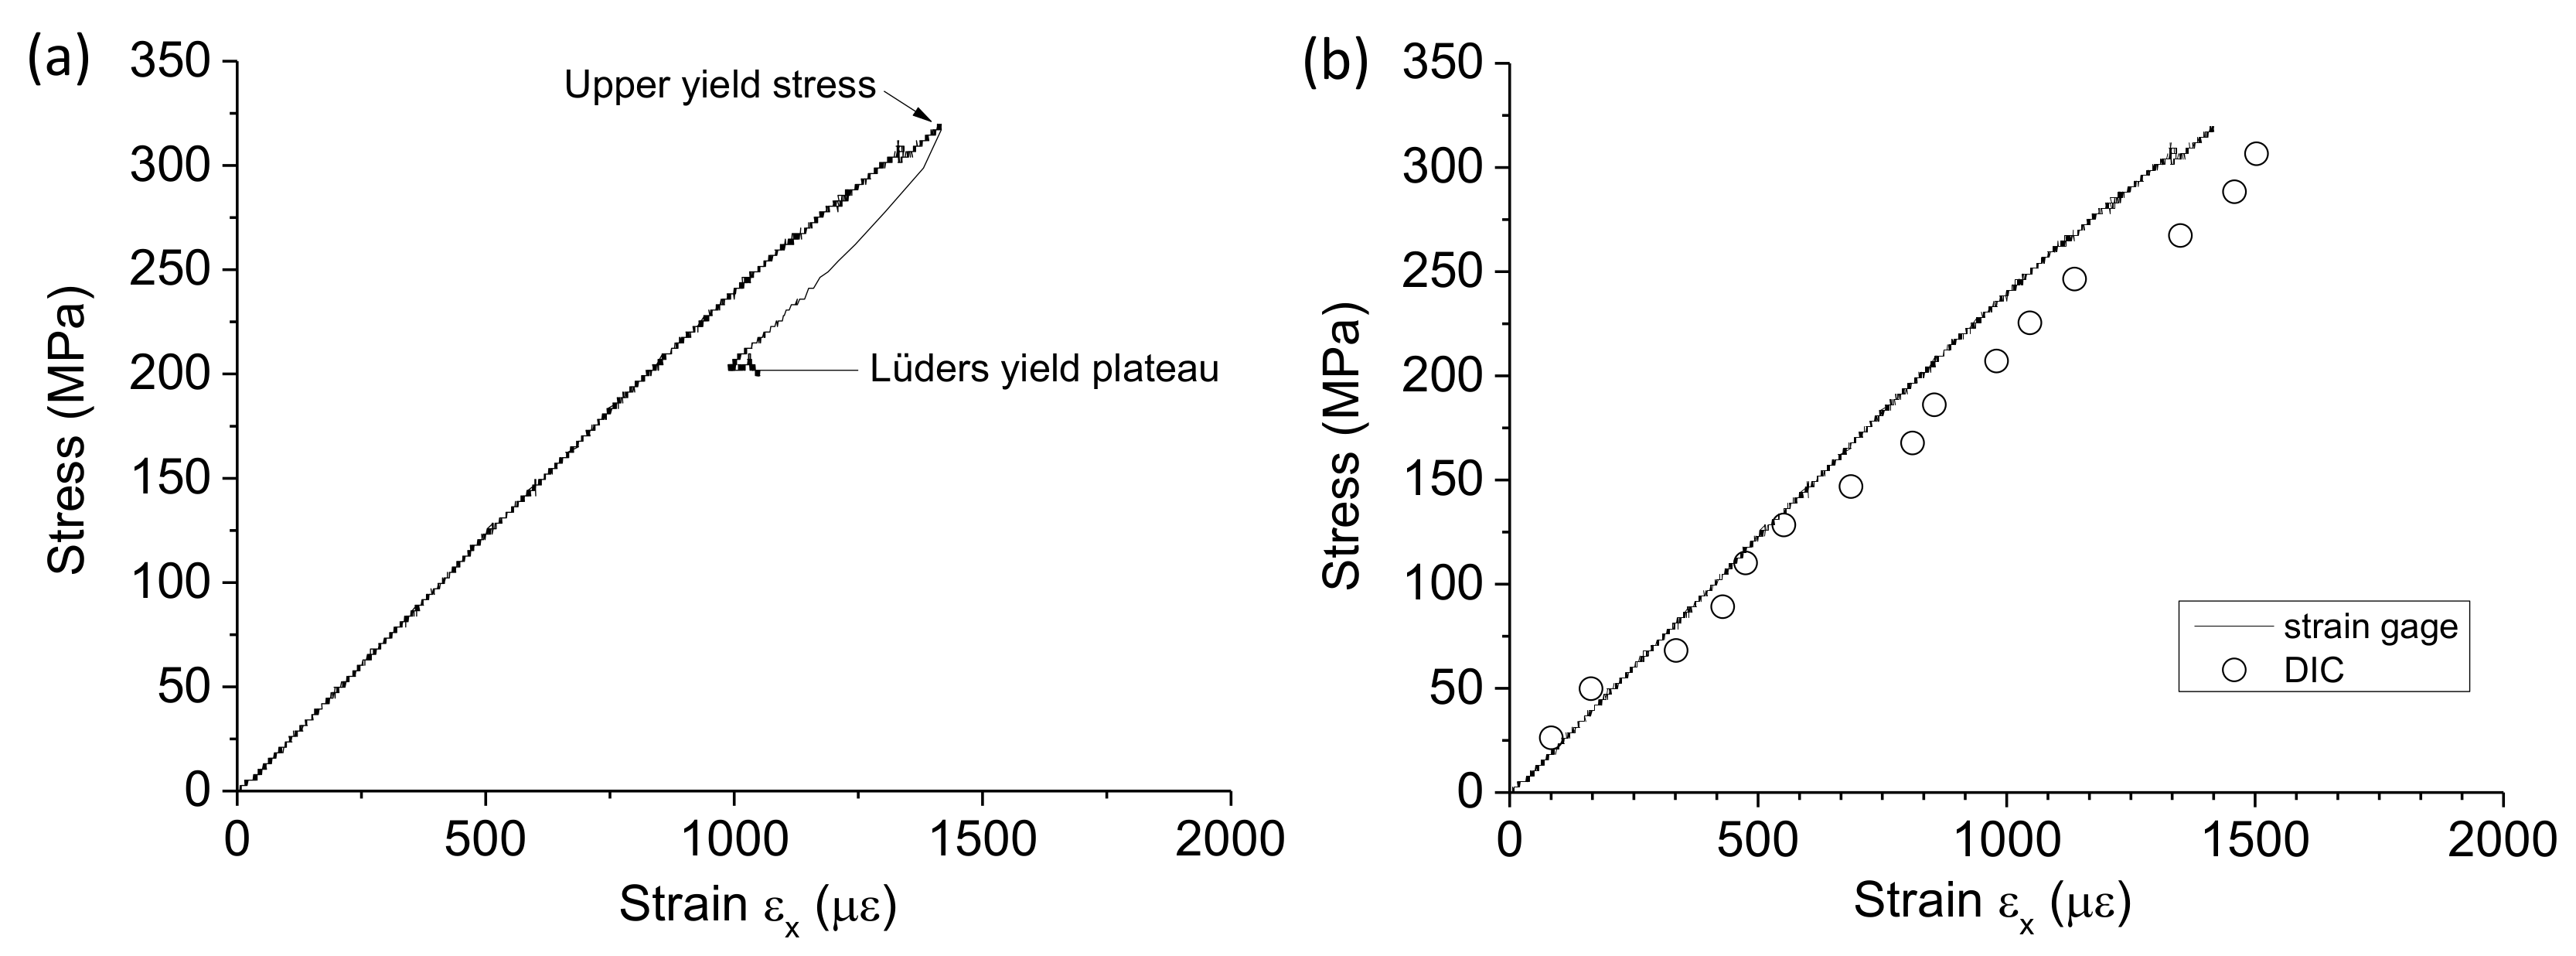
3.2. Noise level of the DIC Strain Measurement
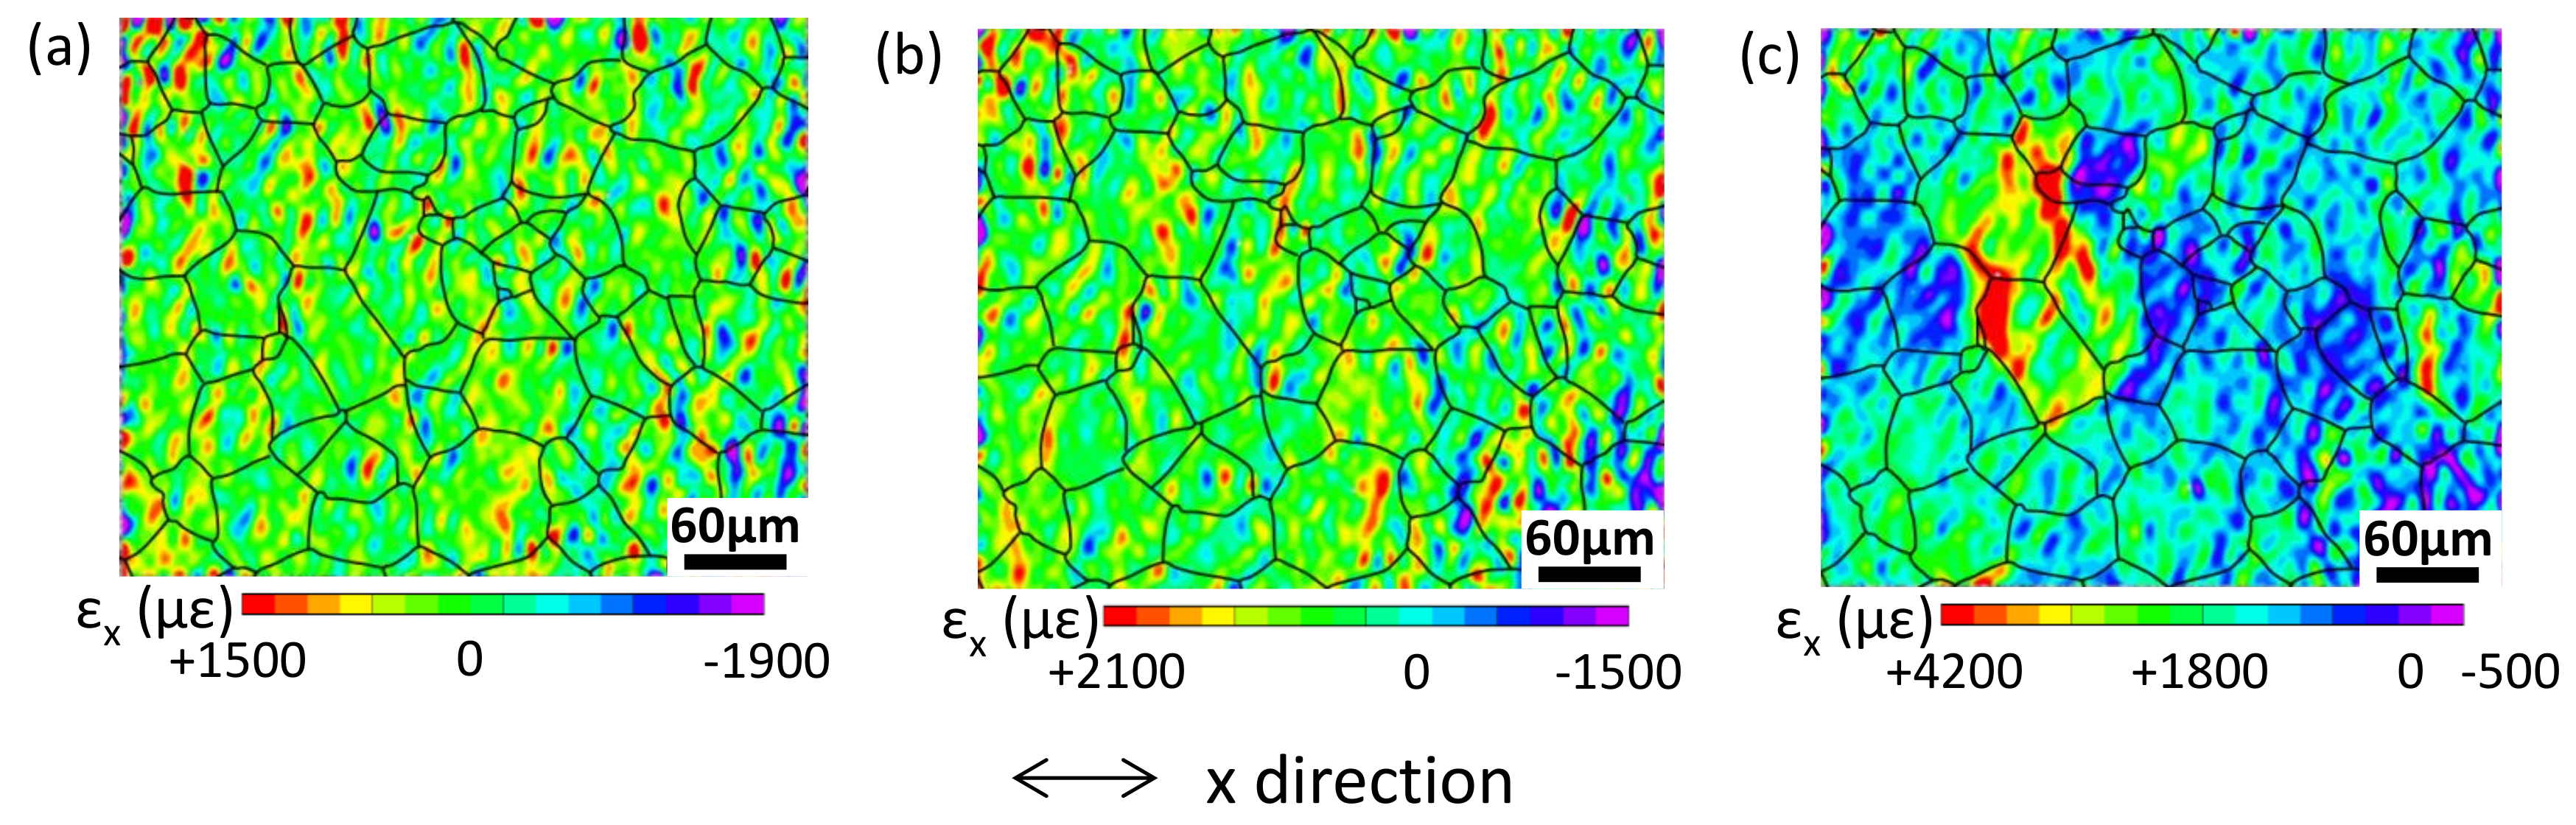
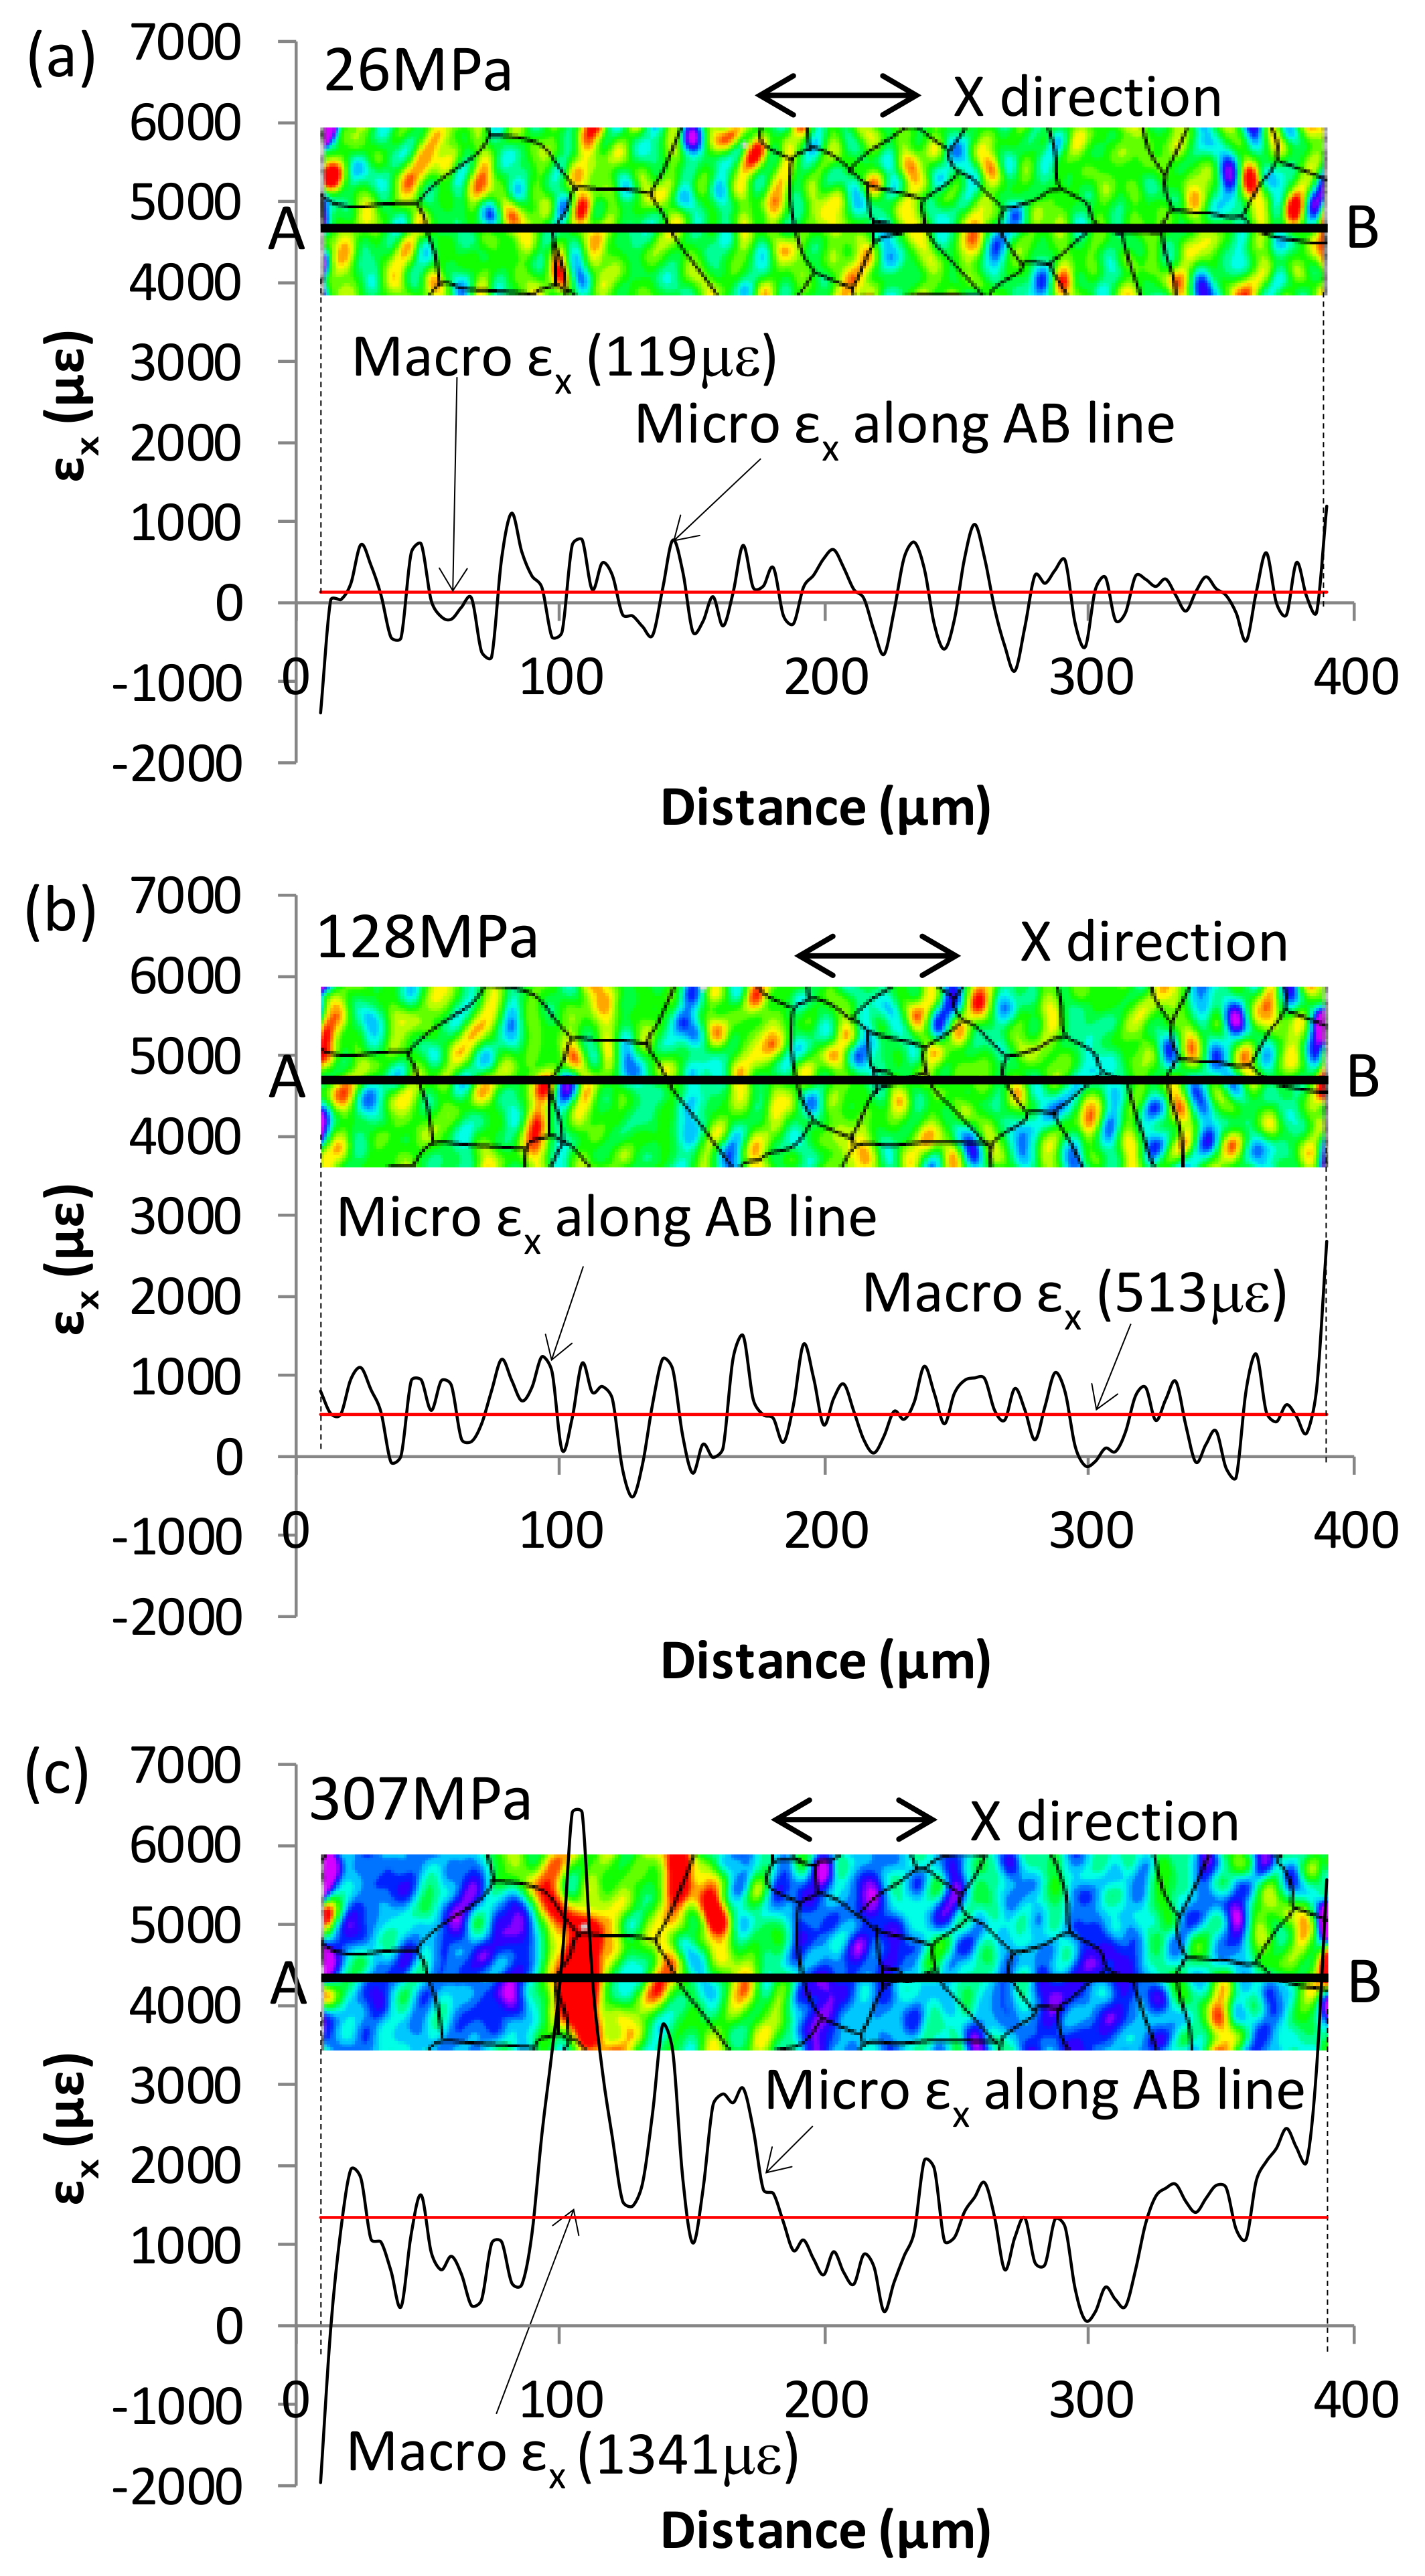
3.3. Microstrain within Grains
4. Conclusions
- (1)
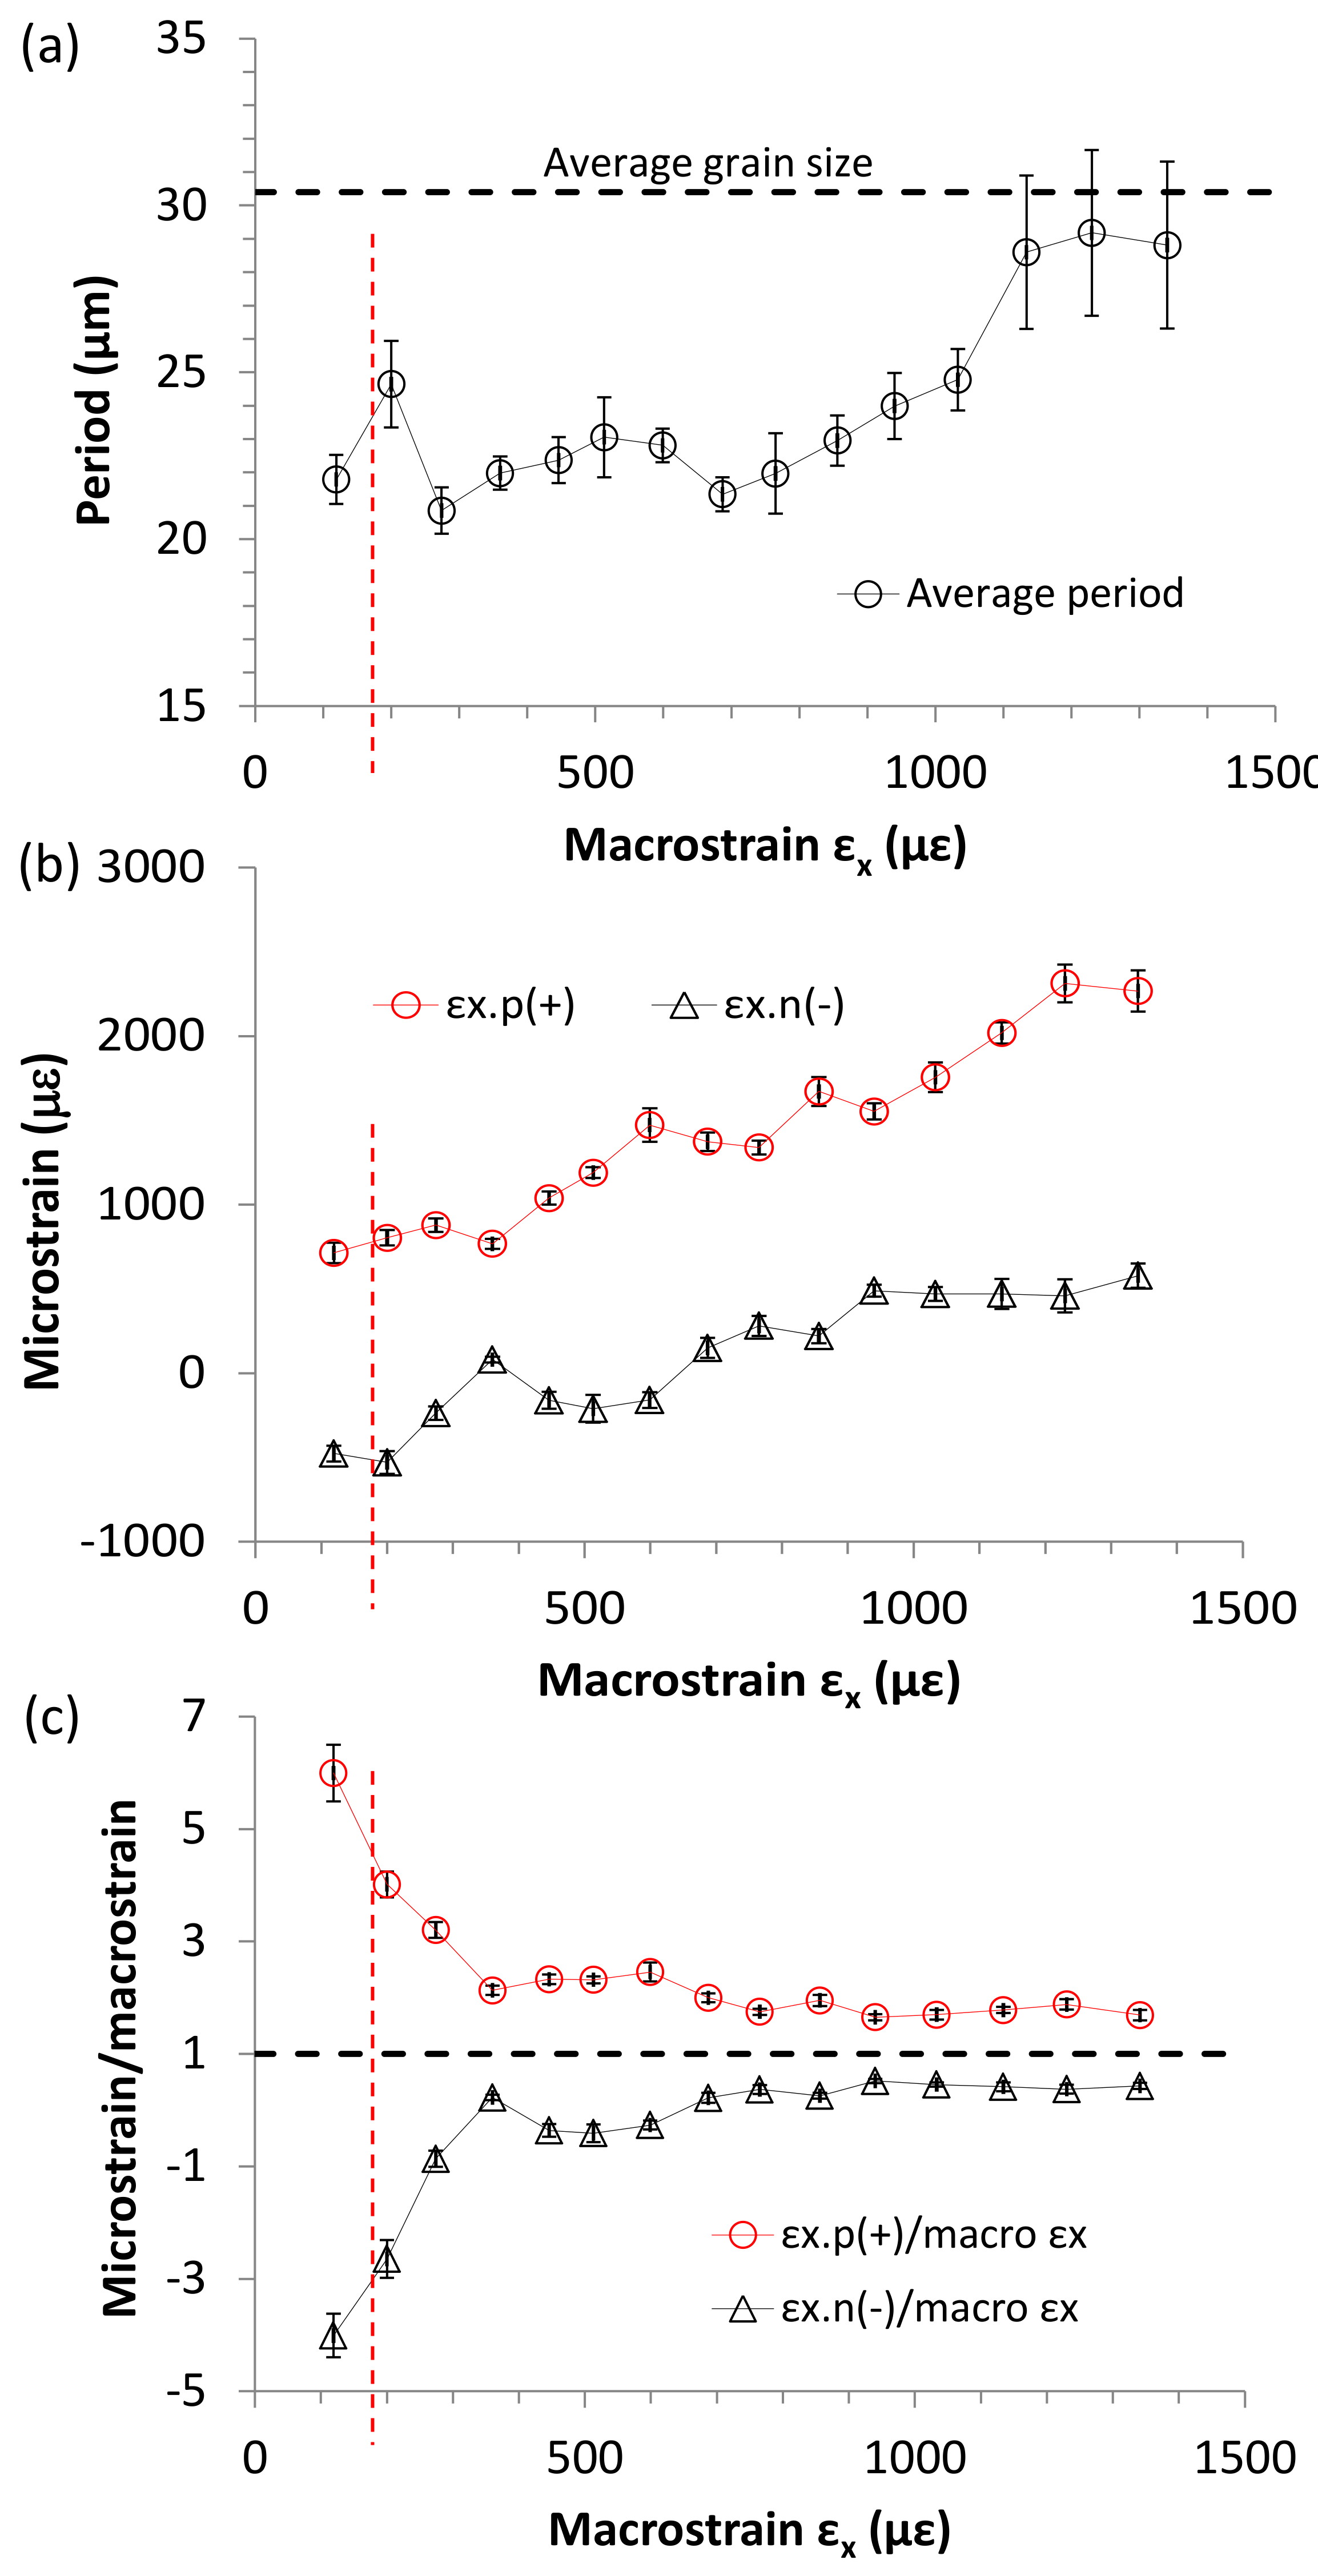
- Microstrain distribution within grains in the elastic deformation region was pseudo-periodic. The period increased with the increase of applied stress, tending to approach the grain size;
- (2)
- The degree of microstrain concentration decreased as the tensile test proceeds. The compression microstrain, even approximately four times that of the macrostrain, was present at small strain levels;
- (3)
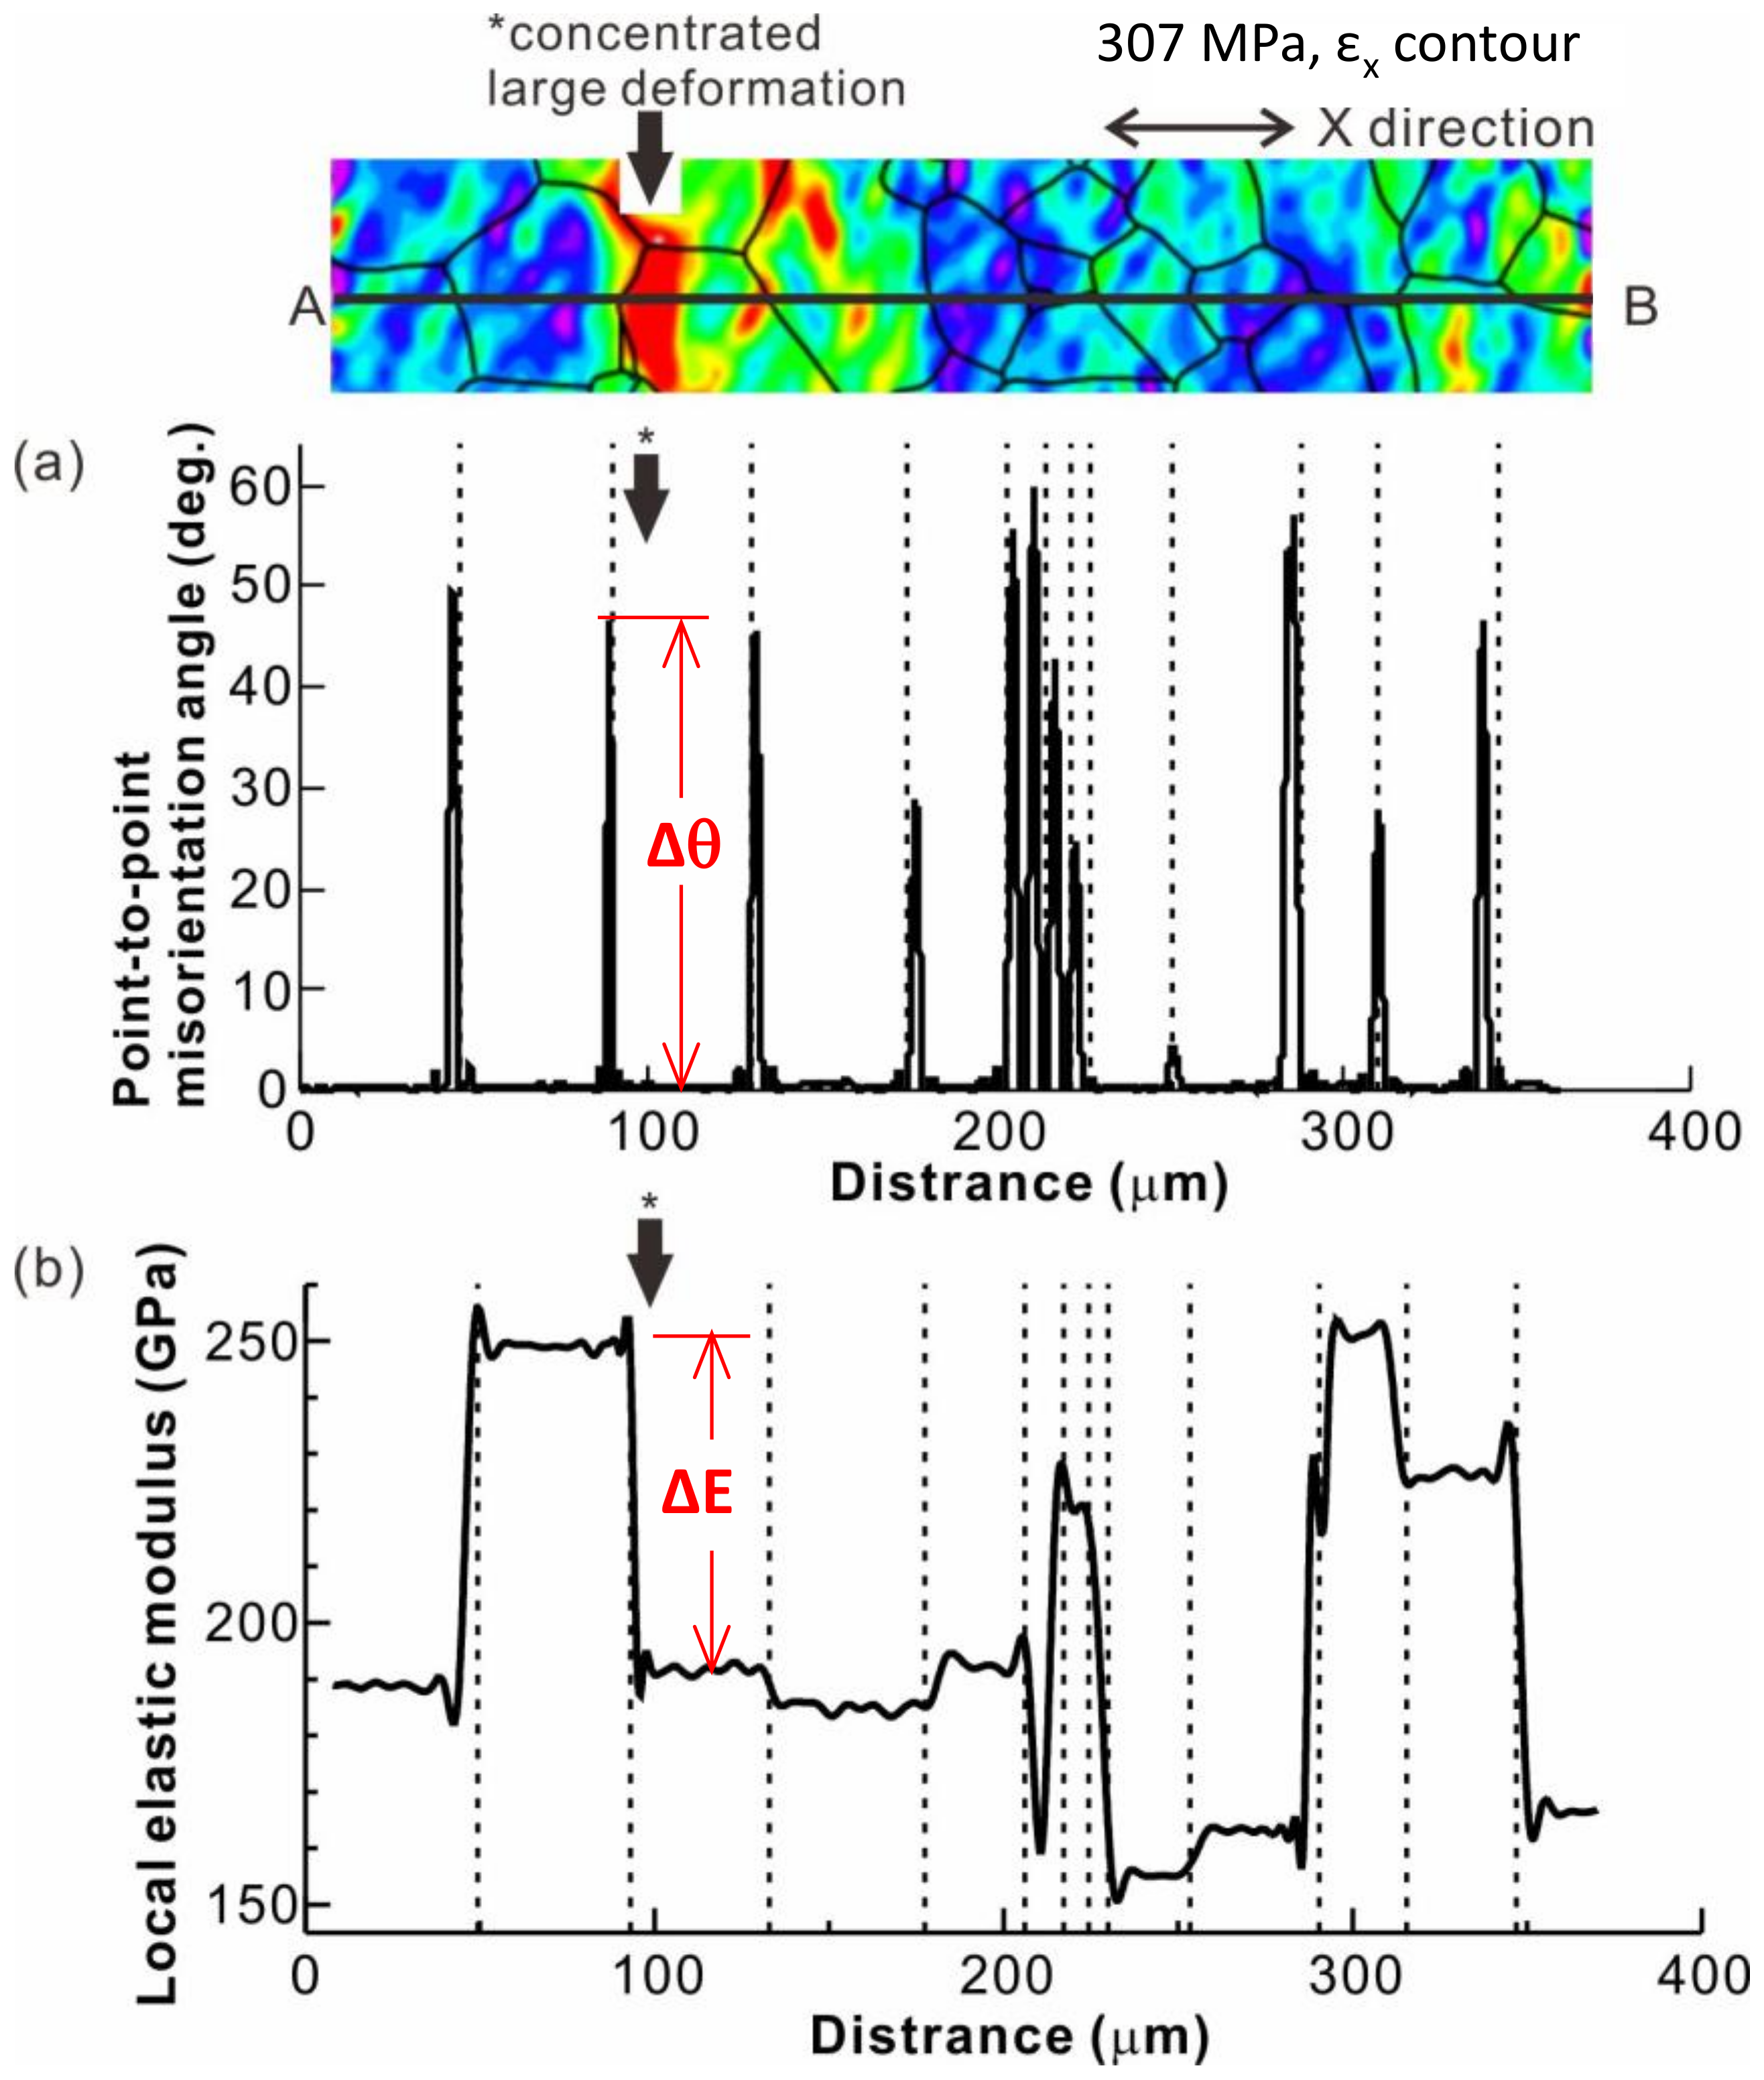
- Great misorientation angle and significant difference in the elastic modulus between adjacent grains promoted microstrain concentration at grain boundaries. However, microstrain concentration did not inevitably occur even if both the misorientation angle and the difference in the elastic modulus were great. Strong concentration of microstrain provided easy sites for microyielding.
Author Contributions
Funding
Conflicts of Interest
References
- Fleck, N.A.; Muller, G.M.; Ashby, M.F.; Hutchinson, J.W. Strain gradient plasticity: Theory and experiment. Acta Metall. Mater. 1994, 42, 475–487. [Google Scholar] [CrossRef]
- Ashby, M.F.; Jones, D.R.H. Engineering Materials 1: An Introduction to Their Properties and Applications; Elsevier: London, UK, 2007; Volume 136–139, pp. 182–189. [Google Scholar]
- Harren, S.V.; Asaro, R.J. Nonuniform deformations in polycrystals and aspects of the validity of the Taylor model. J. Mech. Phys. Solids 1989, 37, 191–232. [Google Scholar] [CrossRef]
- Hook, R.E.; Hirth, J.P. The deformation behavior of isoaxial bicrystals of Fe-3%Si. Acta Metall. 1967, 15, 535–551. [Google Scholar] [CrossRef]
- Raabe, D.; Sachtleber, M.; Zhao, Z.; Roters, F.; Zaefferer, S. Micromechanical and macromechanical effects in grain scale polycrystal plasticity experimentation and simulation. Acta Mater. 2001, 49, 3433–3441. [Google Scholar] [CrossRef]
- Raabe, D.; Sachtleber, M.; Weiland, H.; Scheele, G.; Zhao, Z. Grain-scale micromechanics of polycrystal surfaces during plastic straining. Acta Mater. 2003, 51, 1539–1560. [Google Scholar] [CrossRef]
- Carrington, W.E.; McLean, D. Slip nuclei in silicon-iron. Acta Metall. 1965, 13, 493–499. [Google Scholar] [CrossRef]
- Matoba, R.; Nakada, N.; Futamura, Y.; Tsuchiyama, T.; Takaki, S. Effect of duplex-grained structure on yield stress of IF steels. J. Iron. Steel Inst. Jpn. 2007, 93, 513–517. [Google Scholar] [CrossRef]
- Shen, Z.; Wagoner, R.H.; Clark, W.A.T. Dislocation and grain boundary interactions in metals. Acta Metall. 1988, 36, 3231–3242. [Google Scholar] [CrossRef]
- Tsuchiyama, T.; Fujii, Y.; Terazawa, Y.; Ando, T.; Takaki, S. Factors inducing intergranular fracture in nickel-free high nitrogen austenitic stainless steel produced by solution nitriding. ISIJ Int. 2008, 48, 861–867. [Google Scholar] [CrossRef]
- Suits, J.C.; Chalmers, B. Plastic microstrain in silicon-iron. Acta Metall. 1961, 9, 854–860. [Google Scholar] [CrossRef]
- Tonda, H.; Ando, S.; Takashima, K.; Vreeland JR, T. Anomalous temperature dependence of the yield stress by {1122} ⟨1123⟩ secondary pyramidal slip in cadmium crystals–I. Experiments. Acta Metall. Mater. 1994, 42, 2845–2851. [Google Scholar] [CrossRef]
- Sutton, M.; Wolters, W.; Peters, W.; Ranson, W.; McNeill, S. Determination of displacements using an improved digital correlation method. Image Vis Comput. 1983, 1, 133–139. [Google Scholar] [CrossRef]
- Luccarelli, P.G.; Rabbolini, S.; Beretta, S.; Foletti, S. Crack-closure simulations of Ni-based super-alloy polycrystal, a comparison between experiments and crystal plasticity. Mater Sci Eng A 2019, 740–741, 368–380. [Google Scholar] [CrossRef]
- Yan, D.S.; Tasan, C.C.; Raabe, D. High resolution in situ mapping of microstrain and microstructure evolution reveals damage resistance criteria in dual phase steels. Acta Mater. 2015, 96, 399–409. [Google Scholar] [CrossRef]
- Bourdin, F.; Stinville, J.C.; Echlin, M.P.; Gallahan, P.G.; Lenthe, W.C.; Torbet, C.J.; Texier, D.; Bridier, F.; Cormier, J.; Villechaise, P.; et al. Measurements of plastic localization by Heaviside-digital image correlation. Acta Mater. 2018, 157, 307–325. [Google Scholar] [CrossRef]
- Tasan, C.C.; Hoefnagels, J.P.M.; Geers, M.G.D. Microstructural banding effects clarified through micrographic digital image correlation. Script Mater. 2010, 62, 835–838. [Google Scholar] [CrossRef]
- Qiu, H.; Inoue, T.; Ueji, R. In-situ observation of Lüders band formation in hot-rolled steel via digital image correlation. Metals 2020, 10, 530. [Google Scholar] [CrossRef]
- Koohbor, B.; Ravindran, S.; Kidane, A. Experimental determination of Representative Volume Element (RVE) size in woven composites. Opt. Lasers Eng. 2017, 90, 59–71. [Google Scholar] [CrossRef]
- Tracy, J.; Daly, S.; Sevener, K. Multiscale damage characterization in continuous fiber ceramic matrix composites using digital image correlation. J Mater. Sci. 2015, 50, 5286–5299. [Google Scholar] [CrossRef]
- Kammers, A.D.; Daly, S. Small-scale patterning methods for digital image correlation under scanning electron microscopy. Meas. Sci. Technol. 2011, 22, 125501. [Google Scholar] [CrossRef]
- Ravindran, S.; Koohbor, B.; Kidane, A. Experimental characterization of meso-scale deformation mechanisms and the RVE size in plastically deformed carbon steel. Strain 2017, 53, e12217. [Google Scholar] [CrossRef]
- Hosford, W.F. The Mechanics of Crystals and Textured Polycrystals; Oxford University Press: New York, NY, USA, 1993; pp. 15–20. [Google Scholar]
- Roters, F.; Eisenlohr, P.; Hantcherli, L.; Tjahjanto, D.; Bieler, T.R.; Raabe, D. Overview of constitutive laws, kinematics, homogenization and multiscale methods in crystal plasticity finite-element modeling: Theory, experiments, applications. Acta Mater. 2010, 58, 1152–1211. [Google Scholar] [CrossRef]
- Erieau, P.; Rey, C. Modeling of deformation and rotation bands and of deformation induced grain boundaries in IF steel aggregate during large plane strain compression. Int. J. Plasticity 2004, 20, 1763–1788. [Google Scholar] [CrossRef]
- Staker, M.R.; Holt, D.L. The dislocation cell size and dislocation density in copper deformed at temperatures between 25 and 700°C. Acta Metall. 1972, 20, 569–579. [Google Scholar] [CrossRef]
- Ashby, M.F. The deformation of plastically non-homogeneous materials. Philos. Mag. 1970, 21, 399–424. [Google Scholar] [CrossRef]
- Anderson, T.L. Fracture Mechanics, Fundamentals and Applications; CRC Press: Boca Raton, FL, USA, 2005; pp. 45–64. [Google Scholar]


© 2020 by the authors. Licensee MDPI, Basel, Switzerland. This article is an open access article distributed under the terms and conditions of the Creative Commons Attribution (CC BY) license (http://creativecommons.org/licenses/by/4.0/).
Share and Cite
Qiu, H.; Ueji, R.; Kimura, Y.; Inoue, T. Heterogeneous Distribution of Microstrain Evolved During Tensile Deformation of Polycrystalline Plain Low Carbon Steel. Metals 2020, 10, 774. https://doi.org/10.3390/met10060774
Qiu H, Ueji R, Kimura Y, Inoue T. Heterogeneous Distribution of Microstrain Evolved During Tensile Deformation of Polycrystalline Plain Low Carbon Steel. Metals. 2020; 10(6):774. https://doi.org/10.3390/met10060774
Chicago/Turabian StyleQiu, Hai, Rintaro Ueji, Yuuji Kimura, and Tadanobu Inoue. 2020. "Heterogeneous Distribution of Microstrain Evolved During Tensile Deformation of Polycrystalline Plain Low Carbon Steel" Metals 10, no. 6: 774. https://doi.org/10.3390/met10060774
APA StyleQiu, H., Ueji, R., Kimura, Y., & Inoue, T. (2020). Heterogeneous Distribution of Microstrain Evolved During Tensile Deformation of Polycrystalline Plain Low Carbon Steel. Metals, 10(6), 774. https://doi.org/10.3390/met10060774