Abstract
The paper presents a brief review of the main experimental and numerical techniques and standards to investigate and quantify the structural, mechanical, thermal, and acoustic properties of cellular metals. The potential of non-destructive techniques, such as X-ray computed tomography and infrared thermography are also presented.
1. Introduction
Cellular metals are considered to be one of the world’s most versatile lightweight multifunctional materials for a wide range of commercial, industrial, and military applications [1,2,3,4]. Cellular metals are non-flammable and recyclable, extremely tough, and can plastically deform and absorb energy. They can survive high temperatures in comparison to cellular polymers (e.g., polyurethane foams), which are widely used as crash/impact energy absorbers for vehicles due to their high strength-to-weight and stiffness-to-weight ratios and high energy absorption capacity [4].
Over recent decades, many products and solutions based on cellular metals [5,6,7,8,9,10,11,12,13,14,15,16,17,18] have been developed combined with other light materials like advanced high strength steels, light metals [19,20], polymers [21,22,23,24,25,26,27] and carbon nanostructures (e.g., carbon fibers) [28]. For example, cellular solids are used and/or tested as filler [29,30,31,32] and cores [33,34] of thin-walled structures and sandwich panels for buildings, industrial machines, cars, trains, and aircrafts. Their use contributes to an immediate weight reduction and material savings of the components, but also to perform multiple functions due to their 3D porous cellular structures (open-or-closed-cells) [35]. The open- and closed-cell structures are used as functional materials (e.g., electrodes, heat exchangers, and biomedical implants) and structural materials (e.g., impact/crash energy absorbers in vehicles, antivibration dampers), respectively [1,2]. The field of cellular materials has significantly increased over the last decades, which is reflected in the growth of published literature (Figure 1). Several cellular metals have been emerging due to two main reasons. The first reason is the need to create cellular structures with high structural efficiency and capacity to absorb both impact and damping noise and vibration. The second reason is the need to create periodic cellular structures with an easily reproducible unit cell to achieve predefined performances, establishing the process–structure–property relationships. Recent developments include composite and nanocomposite metal foams [28], lattices [36,37], 3D printed structures [38], syntactic foams [26,29,39], hollow sphere structures [27], auxetic materials [40,41,42], and hybrid structures [22,23,24,25,43] (e.g., filled hollow structures and sandwich panels). The latter often leads to the introduction of new technologies (e.g., 3D additive manufacturing) and products.
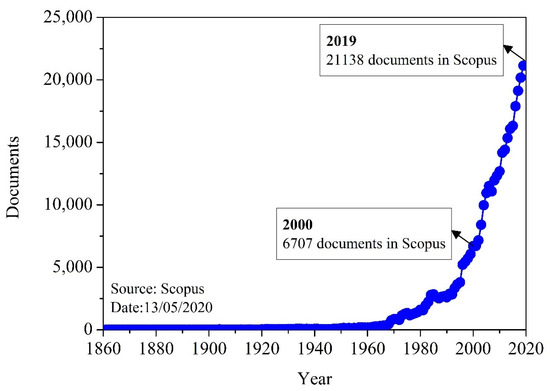
Figure 1.
Number of published documents per year in the field of cellular materials (Source: Scopus).
Given the importance and diversity of these cellular materials, it is essential that the researchers use the same measurement science tools and techniques to assess their performance for comparing the different cellular materials. Most of the experimental tests are based on standards. Nevertheless, there is the need to improve and upgrade current testing techniques and methods in some cases.
2. Geometrical and Structural Characterization
Cellular metals are complex materials, formed by two or more phases (Figure 2). For example, two phases are observed in the open- and closed-cell metal foams, a discontinuous or continuous gaseous phase (cells or pores) and a continuous solid phase (base material or matrix). The base material can also have micro and nano reinforcement elements (e.g., alumina and carbon nanotubes) [28]. Other cellular materials like some syntactic foams can be formed by two solid phases (material from the porous particles/hollow spheres and interstitial material) and a discontinuous or continuous gaseous phase (e.g., pores from filler particle) [39].
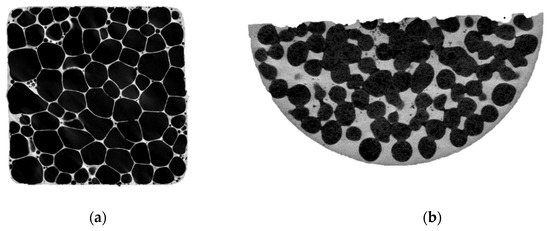
Figure 2.
Closed-cell foam (cross section: 20 mm × 20 mm) (a) and syntactic foam (diameter: 30 mm) (b).
Several material characterization techniques are normally used to characterize them. Microstructure, morphology formed phases/precipitates within matrix are usually analyzed by optical microscopy, scanning electron microscopy (SEM), X-ray diffraction (XRD), energy-dispersive x-ray spectroscopy (EDS), and atomic force microscopy (AFM). Formed phases, precipitates, fibers, and particles can also be investigated to some extent with nanotomography [44].
AFM is used to achieve a correlation between the surface roughness with the precipitated phase density in metallic matrix. Nano and micro indentation testers are used to determine the parameters like the stiffness and Vickers hardness of the matrix. XRD is used to identify and determine the various crystalline forms.
The morphometric parameters of the cellular metals such as a mean cell size and cell size distribution, fraction of solid, connectivity between cells, cell orientation, and porosity can be measured by a non-destructive technique, X-ray microcomputed tomography (μCT). This technique has revealed a power tool to characterize the cellular structure of these materials [45,46,47], but also to study their deformation behavior [48,49,50] and to develop numerical models to predict the mechanical, thermal and acoustic behavior. There are many different μCT scanners on the market, each having different capabilities, namely the resolution, maximum energy level, different filter options, stage set up and internal chamber area.
The equipment is composed of an X-ray source, a motor controlling rotating stage (where the specimen is mounted) and a detector (Figure 3a). The specimen is mounted between the X-ray source and the detector panel and projections are taken after each degree of rotation. Flat panel is an example of a commercial detector which is composed by an array of discrete sensors arranged as a matrix. The response of each sensor is proportional to the radiation energy that reaches its surface and is captured. The capture of data from each discrete part produces a 2D projection/scanned image (Figure 3a) that is converted into a digital image and, thus, is immediately visualized on a computer.
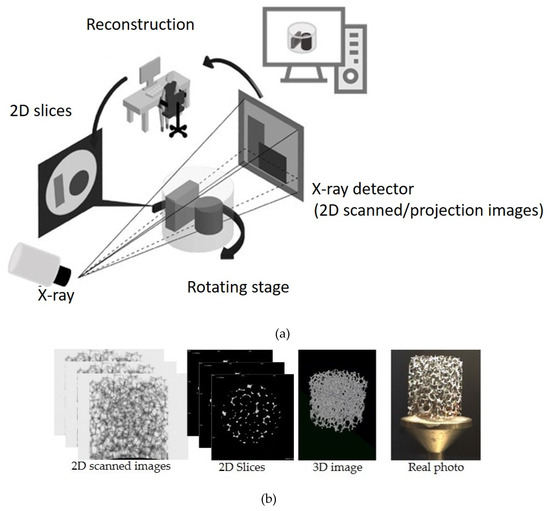
Figure 3.
Scheme of the X-ray microcomputed tomography (μCT) equipment and an open-cell aluminum foam (height: 20.4 mm; diameter: 18.9 mm) (a) and showing and showing raw scans/projections, segmented images, reconstructed structure, and real photo (b).
The μCT principles are based on an X-ray source, which produces the X-ray emission that passes across the specimen and is projected on a digital detector, measuring the attenuation of the X-rays and producing a radiograph (known as scanned or projection image, Figure 3). The quality of the images mainly depends on the partial absorption and differential absorption that occurs during the scanning step. The partial absorption is associated to the absorption of some X-rays by the specimen and the transmission of others to the detector. The differential absorption refers to the absorption characteristics of the different materials to be scanned. For example, in the case that there is no differential absorption, the specimen result comes out as a uniform gray level (no contrast). Usually, it is difficult to distinguish the different materials within the specimen. Both (partial and differential) absorptions are influenced by several aspects, such as the size of the specimen and the chemical composition of the materials that are made which the X-rays have to pass. The projection images are taken incrementally over a total rotation (180° or 360°). The projection images (Figure 3a) are then processed using a computer software, producing a series of reconstructed images (2D slices) that allow to observe the internal structure of the object. Basically, the μCT data analysis is divided in four main steps, which are scanning, segmentation, reconstruction and visualization, as shown in Figure 3b. To optimize the image quality during these steps, it is necessary to adjust several parameters like magnification, incident X-ray intensity, filter type (e.g., no filter, copper, and aluminum), rotation step and acquisition time, and threshold.
There are many commercial software tools (e.g., NRecon v.1.7.3.1, Bruker, Kontich, Belgium; Octopus 8.6, Inside Matters BVBA, Aalst, Belgium and Phoenix datos, GE Sensing & Inspection Technologies GmbH, Wunstorf, Germany) that include the filtering (artefacts) and smoothing of the μCT data to enhance the quality of the images. Threshold segmentation converts a grey value image into a binary one. The resulting image then comprises two sets: one represents the background (e.g., black), the other one the object (e.g., white). This image binarization/segmentation procedure is an essential step in which the different phases/constituents using thresholding algorithms to measure the grayscale values in the μCT images are distinguished.
The reconstructed μCT images can be used for volume rendering of tomographic data, creating 3D models (Figure 4) using numerous available software tools, e.g., CTAn, CTvox, CTVol, VGStudio, and Avizo. The data visualization includes the mapping and the rendering of the results.
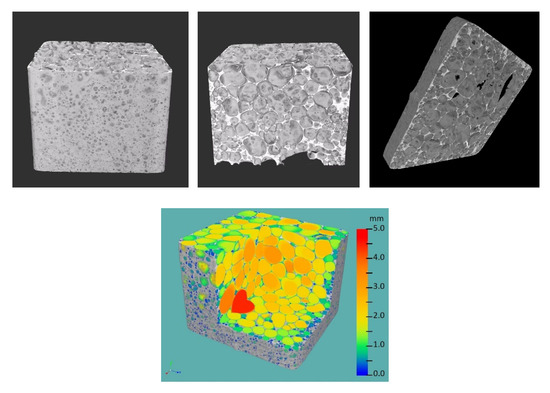
Figure 4.
Volume rendering showing the cellular structure and the dense metal skin covered a closed-cell foam (width: 20 mm) with color by local structure separation, a measure of pore size.
The μCT can also be used to study the deformation and failure mode of these materials using ex-situ and in-situ tests. Ex-situ tests use specimens previously subjected to a mechanical test in a universal testing machine. In-situ imaging is performed inside μCT scanner using a material testing stage that allows the study of the deformation and failure behavior. The specimen is placed into the material testing stage (MTS) chamber and an accurate force, measured by a load cell, is applied to the specimen. The resulting deformation is measured by a precision displacement sensor. During scanning, the loading curve is displayed on the screen in real time.
Figure 5 shows a force–displacement curve of a closed-cell foam compressed with MTS up to 1540 N and 11 mm displacement, showing the collapse of pores of cellular structure.
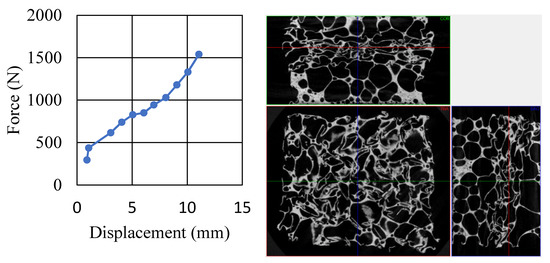
Figure 5.
Force–displacement curve, showing the three orthogonal reconstructed slices (from Bruker’s Data Viewer software [51]) of a closed-cell foam (cross section: 15 mm × 15 mm).
The μCT is also used together with finite element modelling [52,53] to develop the numerical models to describe and predict different process parameters and the mechanical, acoustic, and thermal behavior of the cellular materials, studying the different geometrical parameters. Finite element method (FEM) models can help to select the best microstructure for a given property (then for a given application) without the traditional, complex, time consuming, and labor-intensive experimental tests. The μCT scanned images are reconstructed using algorithms (e.g., filtering and smoothing) and software like NRecon (Bruker, Belgium). The μCT scanned images are used to create FEM meshes (Figure 6).
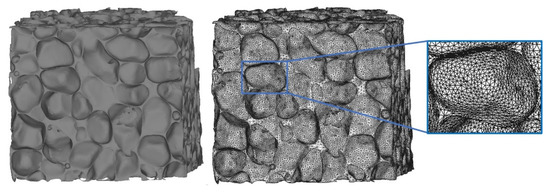
Figure 6.
Finite element method (FEM) meshes of aluminum closed-cell foam (cross section: 10 mm × 10 mm). Courtesy of Diogo Heitor, Universidade de Aveiro, Portugal.
After segmentation, geometry cleanup, and refinement the model can be discretized and analyzed in a software (e.g., Abaqus, ANSYS). The geometrical properties of the mesh elements are based on the actual structure of the solid phase measured in the μCT image [54,55].
3. Mechanical Characterization
Mechanical characterization provides an insight into the mechanical response of cellular metals when subjected to various loading conditions. For this purpose, mechanical tests are being used. They allow to determine the deformation mechanics and mechanical properties of various types of cellular materials and structures. The tests can vary with respect to loading conditions (e.g., type, direction, and velocity), tested materials and expected results. Most commonly, mechanical tests are carried out by experimental or numerical (computational) methods, as the complexity of the cellular structure usually exceeds the efficiency and applicability of the analytical approach.
3.1. Experimental Methods
The most frequently applied experimental method for cellular metals is the uniaxial compressive test [56,57,58,59] because: (i) cellular metals are in applications often subjected to compressive loading and (ii) this type of test is straightforward, cost-effective and has minimum time requirements (short preparation time). From the compressive tests, the force-displacement (engineering/true stress–strain) diagrams can be obtained via load cells (or additional sensors) and the deformation behavior by visual capturing. Regardless of the type of the cellular metal, porosity or relative density (influences the elastic modulus, plastic strength, and energy absorption [60], base material, topology, and morphology (e.g., cell size effect [61], graded porosity [62]), a characteristic compressive behavior can be observed (Figure 7), which can be distributed in four main sections. Quasi-linear response (i) represents the initial stiffness of the cellular metal and is followed by transition zone (ii), where the cellular structure constituents (cell walls and struts) start to compress, bend, or stretch, resulting in local yielding. After additional loading, the stress–strain curve flattens into the stress plateau (iii). The stress is kept almost constant due to bending, buckling, stretching, and crushing of the cellular structure up to densification (iv), where the stiffness increases and approaches the base material properties at full compaction. The most important mechanical properties are initial stiffness, stress plateau (in cellular metal literature also sometimes referred to as yield stress, yield strength), densification strain , and energy absorption capacity (grey area under the stress–strain curve).
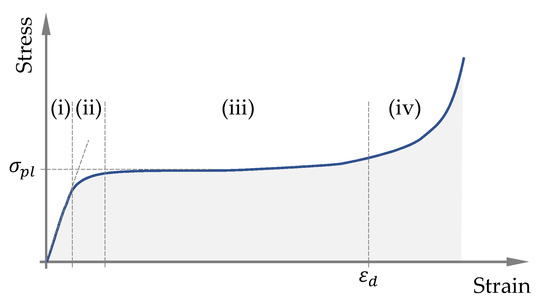
Figure 7.
Characteristic compressive behavior of cellular materials.
The other types of mechanical tests involve bending [43,63], tensile [59,64], shear [59] and torsion load. The described loading types can be also combined into multiaxial loading conditions (to define e.g., multiaxial loading/stress states [59], yield surfaces [65]). For these tests, longer preparation time for specimen preparation and setting up the experimental device is usually needed.
The cellular specimens can be during the tests subjected to quasi-static or dynamic (monotonic or cyclic [66,67,68]) loading. According to [69], the quasi-static loading is considered for strain rates up to approx. 5 s−1. During compressive loading, three different deformation modes (in respect to critical velocities) can occur [70]: homogeneous, transitional, or shock mode. For the homogeneous mode at low loading velocities, it is common that the material starts to deform at its weakest point (negligible effect of inertia), while at the shock mode the main deformation takes place at the loading surface, regardless to the position of the weakest point in the material (substantial effect of inertia and strain rate sensitivity). In addition to dynamic servo-hydraulic testing machines other testing methods are also being used to achieve higher strain rates, e.g., drop towers, Taylor tests, Split–Hopkinson Pressure Bar (SPHB) tests [71].
The deformation mechanics and collapse mechanisms can be monitored by recording the visual data. For this purpose, cameras with a sufficient frame rate must be used, especially for the high-velocity testing. The deformation behavior can additionally be monitored and analyzed by e.g., digital image correlation (DIC) techniques (e.g., ARAMIS and GOM Correlate [72]), ex- and in-situ μCT (see Section 2), infrared thermography (see Section 4).
3.2. Numerical Methods
In the last two decades, numerical methods became a useful tool to supplement the mechanical characterization of various types of cellular metals. They can be used before experimental testing to reduce the number of specimens and experimental tests by predicting the mechanical response or after to validate computer models and reduce the number of further experimental tests. In some cases, computer simulations provide additional insight into the deformation behavior of cellular metals since they also provide data for material points inside the specimens. In solid mechanics, the finite element method (FEM) is the most used tool for analyzing the mechanical behavior of materials and structures subjected to different types of loading conditions [73]. Advanced quasi-static and dynamic numerical models of cellular structures allow to simultaneously account for material (e.g., strain rate dependent elasto-plasticity with damage and failure), geometrical (e.g., large deformation) and structural (e.g., contact and changing boundary conditions) nonlinearities. There are several ways how to model and discretize a cellular metal. The structure can be discretized in a detail (using beam [74], shell [75], or solid [76] finite elements, usually resulting in longer computational times) or as a homogenized material (most commonly as solid finite elements, resulting in shorter computational times). The geometry of the detailed computer models is either -based on computer aided design (for regular and simple cellular geometries) or μCT-based (for irregular and complex cellular structures [55]), as described in Section 2. In the case of homogenized models, the volume of the complex foam structure is simply fully discretized with solid finite elements (structured mesh) with proper constitutive relation, e.g., crushable foam [77]. If a regularity or periodicity can be found in the cellular structure, a part of the structure can be represented with a unit cell (representative volume element—RVE [78]) and proper boundary conditions, which drastically decreases the computational time. In addition to the finite element method, also some other numerical methods can be used to study the mechanical properties with highly effective accuracy and time consumption ratio, e.g., discrete element method (DEM) [79]. Numerical methods are also a very efficient tool for performing parametric studies (varying topology and morphology of the cellular structure). Furthermore, specific effects in the mechanical behavior can be easily isolated and studied. Their influence can be analyzed by changing one single or several material or geometric parameters. Additional possibilities and applicability of numerical methods represent topological optimization and current trends and development of additive manufacturing and other production techniques allowing fabrication of pre-designed cellular metals targeted for specific applications in various industries [80,81,82,83,84]. Although it is usually easier to predict the behavior of pre-designed structures (performing numerical simulations before the fabrication), special care should be taken to account for the additive manufacturing effects, e.g., surface roughness [85,86] (crucial also for studying the osseointegration [87]) and balling [88,89,90].
4. Infrared Thermography
Infrared (IR) thermography is a non-destructive testing method and already part of engineering norms and standard procedures [91,92,93] applicable in evaluation of dynamic deformation process of cellular materials. As cellular materials are often used as energy absorption structural elements, such components are mostly loaded in compression, where a compression yield plateau is characterizing the force-displacement, i.e., energy absorption response. It is common to use compression tests and evaluation at loading rates starting from quasi-static to dynamic and impact velocities. To understand the deformation scenario and what locally happens with cellular specimen, the strain at the specimen’s surface is relevant. The passive IR thermography [91,94] is similar to the digital image correlation (DIC), both applicable to such testing as these methods are providing strain distribution during loading process. In references [95,96,97,98,99], it is shown how thermal image is comparable to effective strain obtained by DIC. In [95], we have shown for the first time the similarity of strain pattern and thermal image on a simple tension example, while in [96], more profound evaluation including tension and three-point bending is provided. Both methods provide strain pattern (field) on specimen surface and deformation of energy absorbing material, energy is mostly converted to the heat, thermal image reveals, where the energy is locally transformed, where yielding occurs, where plastic strain is created and how plastification zones spread through the specimen [96,97]. The thermographic approach, where DIC is combined with IR thermography has been adopted also by other authors [98,99]. IR thermography is not applicable at quasi-static to low-rate dynamic loading velocities as the heat dissipates trough material, what makes the DIC a more appropriate method. For higher loading rates DIC is requiring faster CCD cameras, where the available hardware limits the ability to obtain clear images relevant for surface pattern recognition, as reported in [96,97,98,99]. Contrary to DIC, higher heat generation with less dissipation enables better IR images with lower integration time. Importantly, IR hardware has specific acquisition rate characteristics. Most appropriate are middle-wave IR focal point array detectors (e.g., InSb detector) cooled to cryogenic temperatures [92]. Such detector enables approximately 150 fps of clear images for full resolution (when data from all detector’s pixels are acquired) up to 1000 fps for reduced size image resolution (when reduced number of data from detector are used, so called window). Focal Point Array detectors of cooled middle wave (MW) IR cameras are capable to acquire data for high frame rate. To transfer all data from detector to computer, windowing (reducing active pixels) enables higher frame rates, with a drawback of recording just a portion of full frame image. For the FLIR SC 5000 MW camera (FLIR Systems Inc., Portland, OR, USA) with InSb, Focal Point Array detector was used in this research, with full size of 320 × 265 pixels, while minimum window size enabling faster frame rates with 160 × 128 pixels and 64 × 120 pixels. Although, there are MW cameras capable of acquiring 35,112 fps for a strip for reduced window size (64 × 4 pixels), it has been proven that the above mentioned camera provides for reliable observation of cellular metals dynamic deformation behavior. The method based on IR thermography is not limited to any particular type of cellular material. Various types of cellular metals can be evaluated, e.g., open- and closed-cell foams, advanced pore morphology (APM) foam elements, syntactic foams, pre-designed cellular structures [25,100]. Typical conclusions that can be drawn are, e.g., where yielding is initialized, how plastification fronts propagate, where densification occurs. This was shown in the previous research [25,100] related to thermography in experimental testing of porous materials.
It is a full field method and the temperature image can be processed as a thermal gradient image [97], giving information about direction of thermal change. Thus, from a single thermal image it can be concluded what is happening with a specimen (Figure 8). The example in Figure 8 shows the case of dynamical compression of a syntactic aluminum specimen (diameter: 26.9 mm; height: 43.2 mm). Infrared images are showing the specimen’s surface, where generated heat is representing energy dissipated during compression process and, thus, the source of plastic deformation and collapse. IR camera acquisition rate was 489 Hz. IR images present specimen’s deformation at a strain increment of approximately 10%.
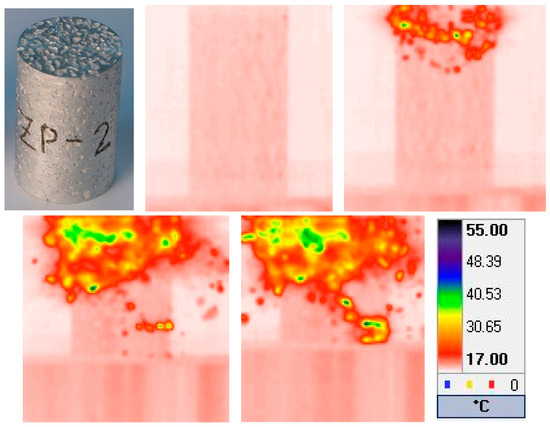
Figure 8.
Photo and Infrared (IR) image of aluminum syntactic specimen compressed at the rate of 284 mm/s.
5. Thermal Characterization
Thermal characterization methods of cellular metals predominantly address their thermal conductivity and heat capacity. The heat capacity is readily determined based on foam density and the heat capacity of the metallic matrix. Hence, this overview concentrates on commonly used measurement techniques for the effective thermal conductivity of cellular metals. All methods are summarized in Table 1. Techniques can be differentiated into transient and steady-state methods. In general, transient methods are faster, permit simpler setups, and can operate within a narrow temperature band. Steady-state methods are highly accurate and permit directional measurements (thermal anisotropy) yet often require complex equipment and significant temperature gradients. A challenge that affects all experimental techniques is thermal contact resistance. Cellular metals are particularly susceptible to thermal contact resistance due to their porous surfaces and resulting small contact areas. Failure to minimize and/or consider thermal contact resistance will result in an underestimation of the effective thermal conductivity. Mitigation strategies include the application of compressive force, thermal paste, and soft metallic foils at the interphases of samples, sensors, heaters, and cooling elements.

Table 1.
Commonly used methods for the determination of the effective thermal conductivity of cellular metals.
5.1. Transient Methods
The well-established hot wire method [101,102] is not commonly used for cellular metals. In order to measure the effective thermal conductivity of cellular metals, a representative volume element (RVE) must be considered. The relatively small sample volume that is affected by hot wire measurements often does not meet this requirement. Instead, transient hot strip (THS), transient hot disc (THD), or transient hot plane (THP) methods with larger planar sensors are utilized [103,104,105,106,107,108,109]. In all cases, a wire is attached to a carrier material and acts simultaneously as the sensor (measuring the variation of electrical resistance) and the heat source. The planar sensor must be positioned between two samples and the measured thermal diffusivity is an average value of both samples. The evaluation of these methods is relatively complex and requires the solution of Fourier’s differential equation [110]. The intermediate result is the effective thermal diffusivity, which can be converted into an effective thermal conductivity using the foam’s density and specific heat capacity. Benefits of these transient methods are a minor temperature increase of only 1–5 K and the ability to measure thermal conductivities between 0.01–200 W/mK [111]. The maximum measurement temperature is limited by the carrier material and is currently about 800 °C [111].
Another commonly used transient method is laser flash measurement [112]. However, the complex geometry of the foam surface does not ensure a controlled energy transfer to the sample. In addition, sample sizes are often too small to achieve RVEs. Hence, this method is not usually applied for the characterization of cellular metals.
5.2. Steady-State Methods
Steady-state measurements impose a time-independent temperature gradient on a sample. Key benefits are a high accuracy, simple test evaluation and the ability to measure directional conductivities. In addition, heat flux passes through the entire sample facilitating measurements on RVEs. As a negative, a significant temperature gradient is required that complicates the measurement of the variation of thermal conductivity with temperature. Another disadvantage are the long measurement times required to ensure thermal steady-state, in particular for materials with low thermal diffusivities.
In absolute steady-state methods, the effective thermal conductivity is measured directly [113]. A commonly used method is the guarded hot plate [114,115,116]. The sample is positioned between a heating and a cooling element to generate a thermal gradient within the sample. After reaching steady-state, Fourier’s law is used for the evaluation, i.e., , where is the effective thermal conductivity of the cellular metal, is the sample cross section, and the temperature gradient. In the guarded hot plate method, the heat flux is determined as the energy input into the heating element at steady state. The term “guarded” describes the thermal isolation of the measurement setup to prevent convective and radiation heat losses. The Heat-Flow-Meter [115,117] resembles the guarded hot plate, however, instead of directly measuring the energy input into the heating element a heat flux sensor is positioned between the sample and the cooling element. The panel test technique [104,118,119,120] is another variation, where the heat flux is measured using a calorimeter that simultaneously acts as the cooling element. Compared to the guarded hot plate method, higher measurement temperatures can be achieved.
In relative steady-state methods, the thermal conductivity is measured relative to a reference material [121,122,123,124]. For increased accuracy, the thermal conductivities of the sample and the reference should be similar. In the cut bar method, the sample and either one or two reference bodies are stacked on a heating (cooling) element. The upper surface of the stack is brought into contact with a cooling (heating) element and usually a compressive force is applied to minimize thermal contact resistances within the stack. After reaching steady state, the reference bodies act as the heat flux sensors (similar to a heat-flow-meter) and Fourier’s equation can be used for the evaluation.
5.3. Numerical Methods
In addition to the experimental methods outlined above, numerical analysis can be used to predict the effective thermal conductivity of metallic foams. An important step is the discretization of the typically complex cellular geometries. Unit cell models [125] and simplified model structures [126] suffice in some cases, however, improved accuracy can be obtained by deriving the numerical models from microcomputed tomography data [127,128]. Analogous to the experimental methods, transient or steady-state calculations can be performed. Due to the significantly higher computational cost of transient methods, almost exclusively steady-state analysis is selected. The two predominant numerical methods are the Finite Element Method (FEM) [125,126127,128] and the Lattice Monte Carlo (LMC) method [129]. The result of the numerical analyses is typically a relative conductivity, i.e., the effective thermal conductivity is determined as a fraction of the matrix material. These numbers can readily be scaled for different type of matrices and temperatures. Comparison of effective thermal conductivities obtained by numerical analysis and experimental studies usually results in good agreement [129,130].
6. Acoustic Characterization
The acoustic characterization of the cellular metals is essential, since they are subjected to the noise and vibration applications (e.g., high resonance response). However, the knowledge and data are lacking for this type of materials. Few works have been published in this research topic [131,132,133,134,135,136,137,138,139,140]. The natural cork (100%) is an example of a natural cellular material widely used to minimize noise and vibration problems in mechanical systems, including industrial machines, appliances, vehicles, and buildings. The noise, vibration, and harshness (NVH) are one of the most fundamental issues for automotive industry. The NVH analysis has commonly two targets, which are to reduce and control noise and vibration for the benefits of users (occupants’ comfort and environmental noise emission) and to minimize the effects of harsh forces and vibration on equipment (e.g., loosen joints and material fatigue). The vibrations are measured in two ways (frequency and amplitude) and expressed as waves per second (Hz). Vibrations that are felt are under 200 Hz, while vibrations between 20–20,000 Hz are audible by humans. Vibrations over 20,000 Hz are ultrasonic and not audible by humans.
The sound absorption coefficient (α), noise reduction coefficient (NRC), sound transmission loss, impact sound transmission and damping behavior (e.g., vibration frequencies, modes, and damping ratios) are examples of the parameters measured to characterize the acoustic properties of cellular metals.
The ability of a material to reduce sound reflections, reverberation, and echo within an enclosed space are determined based on the sound absorption coefficient and noise reduction coefficient. These are the parameters used to evaluate the sound absorption characteristics of the cellular materials and are assessed using an impedance tube according to the ASTM E1050 standard [141]. The cylindrical specimen is placed into the impedance tube (e.g., inner diameter: 37 mm) at one end, while a sound source consisting of a loudspeaker emitting a random noise is introduced at the other end of the tube [22,23]. Two microphones are placed into the tube between the sound source and the studied specimen to detect the sound pressure wave transmitted through the specimen and the wave portion that was reflected. The acoustic absorption coefficient is defined as a ratio of absorbed sound intensity in a given material and the incident sound intensity that is imposed on that material. The acoustic absorption coefficient varies from 0 (0% sound absorption) to 1 (100% sound absorption). The value 0 means no sound is absorbed, while the value 1 means the opposite. The noise reduction coefficient is calculated by defining an average of the sound absorption coefficients at the frequencies 250, 500, 1000, and 2000 Hz and rounding off the result to the nearest multiple of 0.05. The absorption and noise reduction values are also measured in a small echo chamber, either in sound transmission test or echo chamber.
The vibroacoustic behavior is measured by microphones (to measure sound pressure), accelerometers (to measure acceleration), and force/displacement/velocity transducers (to measure forces), in which the measurements are made by setting the instrument for a certain bandwidth and center frequency vibration analyzer, covering the values over that range. The ability to act as a barrier preventing airborne sound transmission from one space to another, sound transmission loss coefficient at 1/3 octave bands, will be performed according to the ASTM E90. The modal analyses are usually performed by vibration of specimens, exciting by a shaker or an impact hammer, measuring the response using a laser scanning vibrometer [140]. The time domain response and loss factor from their damped wave decay is determined using a spectral analyzer. The damping ratio of the resonance mode is determined using the half-power bandwidth method.
7. Conclusions
Different experimental and numerical characterization methods of the cellular metals are presented, i.e., different techniques to determine their structural, mechanical, thermal, and acoustic properties. The methodology, the experimental set-up, the equipment, and its principles and standards were summarized. The potential of non-destructive methods like X-ray computed tomography and infrared thermography are also presented.
X-ray microcomputed tomography is a powerful tool to characterize the complex cellular structure of cellular metals in terms of their structural morphometric parameters, to study their deformation and failure behavior and to develop numerical models to predict the mechanical, thermal, and acoustic behavior. Infrared thermography is a versatile tool well suited for the study of dynamic deformation processes of cellular metals (e.g., closed-cell foams, syntactic foams and metal hollow spheres structures) and filled profiles and sandwich panels based on cellular materials.
In general, there is a huge demand for experimental and computational characterization of physical properties of novel cellular metals. Thus, new opportunities for advances in new experimental techniques and computational modelling arise. Furthermore, computational modelling can help in designing new cellular materials (in combination with additive manufacturing) with desired properties and behavior demanded by an application.
Author Contributions
Conceptualization, I.D., T.F., L.K.-O., and M.V.; methodology, I.D., T.F., L.K.-O., and M.V.; software, I.D., T.F., L.K.-O., and M.V.; validation, I.D., T.F., L.K.-O., and M.V.; formal analysis, I.D., T.F., L.K.-O., and M.V.; investigation, I.D., T.F., L.K.-O., and M.V.; resources, I.D., T.F., L.K.-O., and M.V.; data curation, I.D., T.F., L.K.-O., and M.V.; writing—original draft preparation, I.D., T.F., L.K.-O., and M.V.; writing—review and editing, I.D., T.F., L.K.-O., and M.V.; visualization, I.D., T.F., L.K.-O., and M.V.; supervision, I.D., T.F., L.K.-O., and M.V. All authors have read and agreed to the published version of the manuscript.
Funding
This research was funded by Portuguese Science Foundation (FCT): UIDB/00481/2020 and UIDP/00481/2020-FCT and CENTRO-01–0145-FEDER-022083 (Centro 2020 program-Portugal 2020).
Acknowledgments
Supports given by the Portuguese Science Foundation (FCT), UIDB/00481/2020 and UIDP/00481/2020-FCT and CENTRO-01–0145-FEDER-022083 (Centro 2020 program-Portugal 2020, Centro Portugal Regional Operational Partnership Agreement through the European Regional Development Fund).
Conflicts of Interest
The authors declare no conflict of interest.
References
- Banhart, J. Manufacture, characterisation and application of cellular metals and metal foams. Prog. Mater. Sci. 2001, 46, 559–632. [Google Scholar] [CrossRef]
- Garcia-Moreno, F. Commercial Applications of Metal Foams: Their Properties and Production. Materials 2016, 9, 85. [Google Scholar] [CrossRef] [PubMed]
- Marx, J.; Portanova, M.; Rabiei, A. A study on blast and fragment resistance of composite metal foams through experimental and modeling approaches. Compos. Struct. 2018, 194, 652–661. [Google Scholar] [CrossRef]
- Degischer, H.-P.; Kriszt, B. Handbook of Cellular Metals: Production, Processing, Applications, 1st ed.; Wiley-VCH Verlag GmbH & Co. KGaA: Weinheim, Germany, 2001. [Google Scholar]
- Banhart, J. Light-Metal Foams—History of Innovation and Technological Challenges. Adv. Eng. Mater. 2013, 15, 82–111. [Google Scholar] [CrossRef]
- Baumgärtner, F.; Duarte, I.; Banhart, J. Industrialization of powder compact foaming process. Adv. Eng. Mater. 2000, 2, 168–174. [Google Scholar] [CrossRef]
- Trejo Rivera, N.M.; Torres Torres, J.; Flores Valdés, A. A-242 Aluminium Alloy Foams Manufacture from is fine.the Recycling of Beverage Cans. Metals 2019, 9, 92. [Google Scholar] [CrossRef]
- Duarte, I.; Banhart, J. A study of aluminium foam formation-kinetics and microstructure. Acta Mater. 2000, 48, 2349–2362. [Google Scholar] [CrossRef]
- García-Moreno, F.; Radtke, L.A.; Neu, T.R.; Kamm, P.H.; Klaus, M.; Schlepütz, C.M.; Banhart, J. The Influence of Alloy Composition and Liquid Phase on Foaming of Al–Si–Mg Alloys. Metals 2020, 10, 189. [Google Scholar] [CrossRef]
- Lehmhus, D.; Hünert, D.; Mosler, U.; Martin, U.; Weise, J. Effects of Eutectic Modification and Grain Refinement on Microstructure and Properties of PM AlSi7 Metallic Foams. Metals 2019, 9, 1241. [Google Scholar] [CrossRef]
- Kuwahara, T.; Kaya, A.; Osaka, T.; Takamatsu, S.; Suzuki, S. Stabilization Mechanism of Semi-Solid Film Simulating the Cell Wall during Fabrication of Aluminum Foam. Metals 2020, 10, 333. [Google Scholar] [CrossRef]
- García-Moreno, F.; Babcsan, N.; Banhart, J. X-ray radioscopy of liquid metal foams: Influence of heating profile, atmosphere and pressure. Colloids Surf. A Physicochem. Eng. Asp. 2005, 263, 290–294. [Google Scholar] [CrossRef]
- Kuwahara, T.; Osaka, T.; Saito, M.; Suzuki, S. Compressive Properties of A2024 Alloy Foam Fabricated through a Melt Route and a Semi-Solid Route. Metals 2019, 9, 153. [Google Scholar] [CrossRef]
- Nosko, M.; Simancík, F.; Florek, R. Reproducibility of aluminum foam properties: Effect of precursor distribution on the structural anisotropy and the collapse stress and its dispersion. Mater. Sci. Eng. A 2010, 527, 5900–5908. [Google Scholar] [CrossRef]
- Duarte, I.; Ferreira, J.M.F. 2D quantitative analysis of metal foaming kinetics by hot-stage microscopy. Adv. Eng. Mater. 2014, 16, 33–34. [Google Scholar] [CrossRef]
- Kuwahara, T.; Saito, M.; Osaka, T.; Suzuki, S. Effect of Primary Crystals on Pore Morphology during Semi-Solid Foaming of A2024 Alloys. Metals 2019, 9, 88. [Google Scholar] [CrossRef]
- Mukherjee, M.; García-Moreno, F.; Jiménez, C.; Rack, A.; Banhart, J. Microporosity in aluminium foams. Acta Mater. 2017, 131, 156–168. [Google Scholar] [CrossRef]
- Körner, C.; Singer, R.F. Processing of metal foams—Challenges and opportunities. Adv. Eng. Mater. 2000, 2, 159–165. [Google Scholar] [CrossRef]
- Duarte, I.; Vesenjak, M.; Vide, M. Automated continuous production line of parts made of metallic foams. Metals 2019, 9, 531. [Google Scholar] [CrossRef]
- Duarte, I.; Krstulović-Opara, L.; Vesenjak, M. Analysis of performance of in-situ carbon steel bar reinforced Al-alloy foams. Compos. Struct. 2016, 152, 432–443. [Google Scholar] [CrossRef]
- Gopinathan, A.; Jerz, J.; Simancík, F.; Kovácik, J.; Pavlík, L. Assessment of the aluminium foam panel on PCM based thermal energy storage. Mech. Technol. Struct. Mater. 2019, 2019, 53–60. [Google Scholar]
- Pinto, S.C.; Marques, P.A.A.P.; Vesenjak, M.; Vicente, R.; Godinho, L.; Krstulović-Opara, L.; Duarte, I. Characterization and physical properties of aluminium foam–polydimethylsiloxane nanocomposite hybrid structures. Compos. Struct. 2019, 230, 111521. [Google Scholar] [CrossRef]
- Pinto, S.C.; Marques, P.A.A.P.; Vesenjak, M.; Vicente, R.; Godinho, L.; Krstulović-Opara, L.; Duarte, I. Mechanical, thermal, and acoustic properties of aluminum foams impregnated with epoxy/graphene oxide nanocomposites. Metals 2019, 9, 1214. [Google Scholar] [CrossRef]
- Stöbener, K.; Rausch, G. Aluminium foam–polymer composites: Processing and characteristics. J. Mater. Sci. 2009, 44, 1506–1511. [Google Scholar] [CrossRef]
- Duarte, I.; Krstulović-Opara, L.; Vesenjak, M.; Ren, R. Crush performance of multifunctional hybrid foams based on an aluminium alloy open-cell foam skeleton. Polym. Test. 2018, 67, 246–256. [Google Scholar] [CrossRef]
- Taherishargh, M.; Linul, E.; Broxtermann, S.; Fiedler, T. The mechanical properties of expanded perlite-aluminium syntactic foam at elevated temperatures. J. Alloys Compd. 2018, 737, 590–596. [Google Scholar] [CrossRef]
- Waag, U.; Schneider, L.; Löthman, P.; Stephani, G. Metallic hollow spheres—Materials for the future. Metal. Powder Rep. 2000, 55, 29–33. [Google Scholar]
- Duarte, I.; Ferreira, J.M. Composite and Nanocomposite metal foams. Materials 2016, 9, 79. [Google Scholar] [CrossRef]
- Movahedi, N.; Murch, G.E.; Belova, I.V.; Fiedler, T. Manufacturing and compressive properties of tube-filled metal syntactic foams. J. Alloys Compd. 2020, 820, 153465. [Google Scholar] [CrossRef]
- Duarte, I.; Krstulović-Opara, L.; Vesenjak, M. Axial crush behaviour of the aluminium alloy in-situ foam filled tubes with very low wall thickness. Compos. Struct. 2018, 192, 184–192. [Google Scholar]
- Hangai, Y.; Kobayashi, R.; Suzuki, R.; Matsubara, M.; Yoshikawa, N. Aluminum Foam-Filled Steel Tube Fabricated from Aluminum Burrs of Die-Castings by Friction Stir Back Extrusion. Metals 2019, 9, 124. [Google Scholar] [CrossRef]
- Duarte, I.; Krstulović-Opara, L.; Dias-de-Oliveira, J.; Vesenjak, M. Axial crush performance of polymer-aluminium alloy hybrid foam filled tubes. Thin Walled Struct. 2019, 138, 124–136. [Google Scholar]
- Banhart, J.; Seeliger, H.-W. Aluminium foam sandwich panels: Manufacture, metallurgy and applications. Adv. Eng. Mater. 2008, 10, 793–802. [Google Scholar] [CrossRef]
- Baumeister, J.; Weise, J.; Hirtz, E.; Höhne, K.; Hohe, J. Applications of Aluminum Hybrid Foam Sandwiches in Battery Housings for Electric Vehicles. Procedia Mater. Sci. 2014, 4, 317–321. [Google Scholar] [CrossRef]
- Duarte, I.; Peixinho, N.; Andrade-Campos, A.; Valente, R. Editorial—Special Issue on Cellular Materials. Sci. Technol. Mater. 2018, 30, 1–3. [Google Scholar]
- Wadley, H.N.G. Multifunctional periodic cellular metals. Philos. Trans. R. Soc. A 2006, 364, 31–68. [Google Scholar]
- Yang, C.; Xu, K.; Xie, S. Comparative Study on the Uniaxial Behaviour of Topology-Optimised and Crystal-Inspired Lattice Materials. Metals 2020, 10, 491. [Google Scholar] [CrossRef]
- Hong, S.; Sanchez, C.; Du, H.; Kim, N. Fabrication of 3D Printed Metal Structures by Use of High-Viscosity Cu Paste and a Screw Extruder. J. Electron. Mater. 2015, 44, 836–841. [Google Scholar] [CrossRef]
- Gupta, N.; Rohatgi, P.K. Metal. Matrix Syntactic Foams: Processing, Microstructure, Properties and Applications; DEStech Publications Inc.: Lancaster, PA, USA, 2014. [Google Scholar]
- Novak, N.; Vesenjak, M.; Ren, Z. Auxetic Cellular Materials—A Review. J. Mech. Eng. 2016, 62, 485–493. [Google Scholar] [CrossRef]
- Xue, Y.; Wang, W.; Han, F. Enhanced compressive mechanical properties of aluminum based auxetic lattice structures filled with polymers. Compos. Part B Eng. 2019, 171, 183–191. [Google Scholar] [CrossRef]
- Carneiro, V.H.; Rawson, S.D.; Puga, H.; Meireles, J.; Withers, P.J. Additive manufacturing assisted investment casting: A low-cost method to fabricate periodic metallic cellular lattices. Addit. Manuf. 2020, 33, 101085. [Google Scholar] [CrossRef]
- Vesenjak, M.; Duarte, I.; Baumeister, J.; Göhler, H.; Krstulović-Opara, L.; Ren, Z. Bending performance evaluation of aluminium alloy tubes filled with different cellular metal cores. Compos. Struct. 2020, 234, 111748. [Google Scholar] [CrossRef]
- Möbus, G.; Inkson, B.J. Review. Nanoscale tomography in materials science. Mater. Today 2007, 10, 18–25. [Google Scholar] [CrossRef]
- Bock, J.; Jacobi, A.M. Geometric classification of open-cell metal foams using X-ray micro-computed tomography. Mater. Charact. 2013, 75, 35–43. [Google Scholar]
- Olurin, O.B.; Arnold, M.; Körner, C.; Singer, R.F. The investigation of morphometric parameters of aluminium foams using micro-computed tomography. Mater. Sci. Eng. A 2002, 328, 334–343. [Google Scholar] [CrossRef]
- Wang, N.; Maire, E.; Cheng, Y.; Amani, Y.; Chen, X. Comparison of aluminium foams prepared by different methods using X-ray tomography. Mater. Charact. 2018, 138, 296–307. [Google Scholar] [CrossRef]
- Zhang, Q.; Lee, P.D.; Singh, R.; Wu, G.; Lindley, T.C. Micro-CT characterization of structural features and deformation behavior of fly ash/aluminum syntactic foam. Acta Mater. 2019, 57, 3003–3011. [Google Scholar]
- Kader, M.A.; Brown, A.D.; Hazell, P.J.; Robins, V.; Saadatfar, M. Geometrical and topological evolution of a closed-cell aluminium foam subject to drop-weight impact: An X-ray tomography study. Int. J. Impact Eng. 2020, 139, 103510. [Google Scholar] [CrossRef]
- Chaturvedi, A.; Bhatkar, S.; Sarkar, P.S.; Chaturvedi, S.; Gupta, M.K. 3D Geometric modeling of aluminum-based foam using micro Computed Tomography technique. Mater. Today Proc. 2019, 18, 4151–4156. [Google Scholar]
- Bruker. Bruker microCT Method Note: DataViewer, An. Overview; Bruker: Kontich, Belgium, 2016; p. 16. [Google Scholar]
- Miedzińska, D.; Niezgoda, T.; Gieleta, R. Numerical and experimental aluminum foam microstructure testing with the use of computed tomography. Comput. Mater. Sci. 2012, 64, 90–95. [Google Scholar] [CrossRef]
- Veyhl, C.; Belova, I.V.; Murch, G.E.; Fiedler, T. Finite element analysis of the mechanical properties of cellular aluminium based on micro-computed tomography. Mater. Sci. Eng. A 2011, 528, 4550–4555. [Google Scholar]
- Fiedler, T.; Belova, I.V.; Murch, G.E. μ-CT-based finite element analysis on imperfections in open-celled metal foam: Mechanical properties. Scr. Mater. 2012, 67, 455–458. [Google Scholar] [CrossRef]
- Kozma, I.; Zsoldos, I. CT-based tests and finite element simulation for failure analysis of syntactic foams. Eng. Fail. Anal. 2019, 104, 371–378. [Google Scholar] [CrossRef]
- Japanese Standards Association. JIS-H-7902 Compression Test. For. Porous And Cellular Metals; Japanese Standards Association: Tokyo, Japan, 2016. [Google Scholar]
- The International Organization for Standardization. ISO 13314:2011 Mechanical Testing of Metals—Ductility Testing—Compression Test. for Porous and Cellular Metals; The International Organization for Standardization: Geneva, Switzerland, 2011. [Google Scholar]
- Hipke, T.; Lange, G.; Poss, R. Taschenbuch für Aluminiumschäume; Alu Media: Düsseldorf, Germany, 2007. [Google Scholar]
- Ashby, M.F.; Evans, A.; Fleck, N.A.; Gibson, L.J.; Hutchinson, J.W.; Wadley, H.N.G. Metal Foams: A Design Guide; Elsevier Science: Burlington, MA, USA, 2000. [Google Scholar]
- Ramamurty, U.; Paul, A. Variability in mechanical properties of a metal foam. Acta Mater. 2004, 52, 869–876. [Google Scholar]
- Tekoğlu, C.; Gibson, L.J.; Pardoen, T.; Onck, P.R. Size effects in foams: Experiments and modeling. Prog. Mater. Sci. 2011, 56, 109–138. [Google Scholar] [CrossRef]
- Xu, F.; Zhang, X.; Zhang, H. A review on functionally graded structures and materials for energy absorption. Eng. Struct. 2018, 171, 309–325. [Google Scholar]
- The International Organization for Standardization. ISO 7438:2005 Metallic Materials-Bend Test; International Organization for Standardization: Geneva, Switzerland, 2005. [Google Scholar]
- The International Organization for Standardization. ISO 6892-1:2009 Metallic Materials—Tensile Testing—Part 1: Method of Test at Room Temperature; International Organization for Standardization: Geneva, Switzerland, 2009. [Google Scholar]
- Jung, A.; Diebels, S. Microstructural characterisation and experimental determination of a multiaxial yield surface for open-cell aluminium foams. Mater. Des. 2017, 131, 252–264. [Google Scholar] [CrossRef]
- Taherishargh, M.; Katona, B.; Fiedler, T.; Orbulov, I.N. Fatigue properties of expanded perlite/aluminum syntactic foams. J. Compos. Mater. 2017, 51, 773–781. [Google Scholar] [CrossRef]
- Nečemer, B.; Vesenjak, M.; Glodež, S. Fatigue of Cellular Structures—A Review. J. Mech. Eng. 2019, 65, 525–536. [Google Scholar] [CrossRef]
- Tomažinčič, D.; Vesenjak, M.; Klemenc, J. Prediction of static and low-cycle durability of porous cellular structures with positive and negative Poisson’s ratios. Theor. Appl. Fract. Mech. 2020, 106, 102479. [Google Scholar] [CrossRef]
- Jacob, P.; Goulding, L. An Explicit Finite Element Primer; NAFEMS: Glasgow, UK, 2002. [Google Scholar]
- Zheng, Z.; Yu, J.; Li, J. Dynamic crushing of 2D cellular structures: A finite element study. Int. J. Impact Eng. 2005, 32, 650–664. [Google Scholar] [CrossRef]
- Taşdemirci, A.; Ergönenç, Ç.; Güden, M. Split Hopkinson pressure bar multiple reloading and modeling of a 316 L stainless steel metallic hollow sphere structure. Int. J. Impact Eng. 2010, 37, 250–259. [Google Scholar] [CrossRef]
- GOM. Material Testing/Material Properties—ARAMIS and the Detection of Flow Behaviour for Sheet Metal Material in High Speed Tensile Tests; GOM: Leuven, Belgium, 2009. [Google Scholar]
- Altenbach, H.; Oechsner, A. Cellular and Porous Materials in Structures and Processes; CISM International Centre for Mechanical Sciences/Springer: Wien, Austria, 2010. [Google Scholar]
- Guo, H.; Takezawa, A.; Honda, M.; Kawamura, C.; Kitamura, M. Finite element simulation of the compressive response of additively manufactured lattice structures with large diameters. Comput. Mater. Sci. 2020, 175, 109610. [Google Scholar] [CrossRef]
- Caty, O.; Maire, E.; Youssef, S.; Bouchet, R. Modeling the properties of closed-cell cellular materials from tomography images using finite shell elements. Acta Mater. 2008, 56, 5524–5534. [Google Scholar]
- Kucewicz, M.; Baranowski, P.; Małachowski, J.; Popławski, A.; Płatek, P. Modelling, and characterization of 3D printed cellular structures. Mater. Des. 2018, 142, 177–189. [Google Scholar] [CrossRef]
- Dassault Systémes SIMULIA, ABAQUS Documentation, 4.4.6 Models for Crushable Foams. Available online: https://classes.engineering.wustl.edu/2009/spring/mase5513/abaqus/docs/v6.6/books/stm/default.htm?startat=ch04s04ath118.html (accessed on 28 May 2020).
- Fiedler, T.; Öchsner, A.; Gracio, J.; Kuhn, G. Structural modeling of the mechanical behavior of periodic cellular solids: Open-cell structures. Mech. Compos. Mater. 2005, 41, 277–290. [Google Scholar] [CrossRef]
- Kovačič, A.; Vesenjak, M.; Borovinšek, M.; Ren, Z. Modelling large compression of advanced pore morphology foams with discrete element method. In Proceedings of the 11th World Congress on Computational Mechanics (WCCM XI) and 5th European Conference on Computational Mechanics (ECCM V) and 6th European Conference on Computational Fluid Dynamics (ECFD VI), Barcelona, Spain, 20–25 July 2014. [Google Scholar]
- Zuo, Q.; He, K.; Mao, H.; Dang, X.; Du, R. Manufacturing process and mechanical properties of a novel periodic cellular metal with closed cubic structure. Mater. Des. 2018, 153, 242–258. [Google Scholar]
- Xu, Z.; Meng, K.; Yang, C.; Zhang, W.; Fan, X.; Sun, Y. Elasto-Plastic Behaviour of Transversely Isotropic Cellular Materials with Inner Gas Pressure. Metals 2019, 9, 901. [Google Scholar]
- Lee, M.-G.; Ko, G.-D.; Song, J.; Kang, K.-J. Compressive characteristics of a wire-woven cellular metal. Mater. Sci. Eng. A 2012, 539, 185–193. [Google Scholar]
- Al-Ketan, O.; Rowshan, R.; Al-Rub, R.K.A. Topology-mechanical property relationship of 3D printed strut, skeletal, and sheet based periodic metallic cellular materials. Addit. Manuf. 2018, 19, 167–183. [Google Scholar] [CrossRef]
- Kang, K.-J. Wire-woven cellular metals: The present and future. Prog. Mater. Sci. 2015, 69, 213–307. [Google Scholar] [CrossRef]
- Harris, J.A.; McShane, G.J. Metallic stacked origami cellular materials: Additive manufacturing, properties, and modelling. Int. J. Solids Struct. 2020, 185–186, 448–466. [Google Scholar] [CrossRef]
- Oliveira, J.P.; Lalonde, A.; Ma, J. Processing parameters in laser powder bed fusion metal additive manufacturing. Mater. Des. 2020, 193, 108762. [Google Scholar] [CrossRef]
- Murr, L.E. Strategies for creating living, additively manufactured, open-cellular metal and alloy implants by promoting osseointegration, osteoinduction and vascularization: An overview. J. Mater. Sci. Technol. 2019, 35, 231–241. [Google Scholar] [CrossRef]
- Attar, E. Simulation of Selective Electron Beam Melting Processes. Ph.D. Thesis, Universität Erlangen-Nürnberg, Erlangen, Germany, 2011. [Google Scholar]
- Novak, N.; Borovinšek, M.; Vesenjak, M.; Wormser, M.; Körner, C.; Tanaka, S.; Hokamoto, K.; Ren, Z. Crushing Behavior of Graded Auxetic Structures Built from Inverted Tetrapods under Impact. Phys. Status Solidi B 2019, 256, 1800040. [Google Scholar] [CrossRef]
- Yuan, L.; Ding, S.; Wen, C. Additive manufacturing technology for porous metal implant applications and triple minimal surface structures: A review. Bioact. Mater. 2019, 4, 56–70. [Google Scholar] [CrossRef] [PubMed]
- SIS. Non-Destructive Testing—Thermographic Testing—Part 1: General Principles (EN 16714-1:2016); Swedish Institute of Standards: Stockholm, Sweden, 2016. [Google Scholar]
- SIS. Non-Destructive Testing—Thermographic Testing—Part 2: Equipment (EN 16714-2:2016); Swedish Institute of Standards: Stockholm, Sweden, 2016. [Google Scholar]
- SIS. Non-Destructive Testing—Thermographic Testing—Part 3: Terms and Definitions (EN 16714-3:2016); Swedish Institute of Standards: Stockholm, Sweden, 2016. [Google Scholar]
- Jung, A.; Majthoub, K.A.; Jochum, C.; Kirsch, S.-M.; Welsch, F.; Seelecke, S.; Diebels, S. Correlative digital image correlation and infrared thermography measurements for the investigation of the mesoscopic deformation behaviour of foams. J. Mech. Phys. Solids 2019, 130, 165–180. [Google Scholar] [CrossRef]
- Krstulović-Opara, L.; Surijak, M.; Vesenjak, M.; Tonković, Z.; Kodvanj, J.; Domazet, Ž. Comparison of Infrared and 3D Digital Image Correlation Techniques Applied for Mechanical Testing of Materials. In Proceedings of the 31th Danubia-Adria Symposium on Advances in Experimental Mechanics, Kempten, Germany, 24–27 September 2014; pp. 232–233. [Google Scholar]
- Krstulović-Opara, L.; Surijak, M.; Vesenjak, M.; Tonković, Z.; Kodvanj, J.; Domazet, Ž. Comparison of infrared and 3D digital image correlation techniques applied for mechanical testing of materials. Infrared Phys. Technol. 2015, 73, 166–174. [Google Scholar] [CrossRef]
- Pehilj, A.; Krstulović-Opara, L.; Bagavac, P.; Vesenjak, M.; Duarte, I.; Domazet, Ž. The detection of plastic flow propagation based on the temperature gradient. Mater. Today Proc. 2017, 4, 5925–5930. [Google Scholar] [CrossRef]
- Jung, A.; Bronder, S.; Diebels, S.; Schmidt, M.; Seelecke, S. Thermographic investigation of strain rate effects in Al foams and Ni/Al hybrid foams. Mater. Des. 2018, 160, 363–370. [Google Scholar] [CrossRef]
- Osornio-Rios, R.A.; Antonino-Daviu, J.A.; Romero-Troncoso, R.J. Recent Industrial Applications of Infrared Thermography: A Review. IEEE Trans. Ind. Inform. 2019, 15, 615–625. [Google Scholar] [CrossRef]
- Broxtermann, S.; Vesenjak, M.; Krstulović-Opara, L.; Fiedler, T. Quasi static and dynamic compression of zinc syntactic foams. J. Alloys Compd. 2018, 768, 962–969. [Google Scholar] [CrossRef]
- Wei, L.C.; Ehrlich, L.E.; Powell-Palm, M.J.; Montgomery, C.; Beuth, J.; Malen, J.A. Thermal conductivity of metal powders for powder bed additive manufacturing. Addit. Manuf. 2018, 21, 201–208. [Google Scholar] [CrossRef]
- ASTM International. ASTM D5930-17: Standard Test Method for Thermal Conductivity of Plastics by Means of a Transient Line-Source Technique; ASTM International: West Conshohocken, PA, USA, 2017. [Google Scholar]
- The International Organization for Standardization. ISO 22007-2:2015 Plastics—Determination of Thermal Conductivity and Thermal Diffusivity—Part 2: Transient Plane Heat Source (Hot Disc) Method; International Organization for Standardization: Geneva, Switzerland, 2015. [Google Scholar]
- Skibina, V.; Wulf, R.; Gross, U. Temperature Influence on the Effective Thermal Conductivity of Cellular Metals Measured in Stagnant Air. Procedia Mater. Sci. 2014, 4, 347–351. [Google Scholar] [CrossRef][Green Version]
- Solórzano, E.; Rodríguez-Perez, M.A.; de Saja, J.A. Thermal conductivity of metallic hollow sphere structures: An experimental, analytical and comparative study. Mater. Lett. 2009, 63, 1128–1130. [Google Scholar] [CrossRef]
- Liu, P.S.; Qing, H.B.; Hou, H.L.; Wang, Y.Q.; Zhang, Y.L. EMI shielding and thermal conductivity of a high porosity reticular titanium foam. Mater. Des. 2016, 92, 823–828. [Google Scholar] [CrossRef]
- Solórzano, E.; Reglero, J.A.; Rodríguez-Pérez, M.A.; Lehmhus, D.; Wichmann, M.; de Saja, J.A. An experimental study on the thermal conductivity of aluminium foams by using the transient plane source method. Int. J. Heat Mass Transf. 2008, 51, 6259–6267. [Google Scholar] [CrossRef]
- Solórzano, E.; Rodríguez-Pérez, M.A.; Reglero, J.A.; de Saja, J.A. Density gradients in aluminium foams: Characterisation by computed tomography and measurements of the effective thermal conductivity. J. Mater. Sci. 2007, 42, 2557–2564. [Google Scholar] [CrossRef]
- Solórzano, E.; Hirschmann, M.; Rodríguez-Pérez, M.A.; Körner, C.; de Saja, J.A. Thermal conductivity of AZ91 magnesium integral foams measured by the Transient Plane Source method. Mater. Lett. 2008, 62, 3960–3962. [Google Scholar] [CrossRef]
- Carslaw, H.S.; Jaeger, J.C. Conduction of Heat in Solids, 2nd ed.; Clarendon Press: Oxford, UK, 1959. [Google Scholar]
- Wulf, R. Waermeleitfaehigkeit von Hitzebestaendigen und Feuerfesten Daemmstoffen—Untersuchungen zu Ursachen Fuer Unterschiedliche Messergebnisse bei Verwendung Verschiedener Messverfahren. Ph.D. Thesis, Technischen Universitaet Bergakademie Freiberg, Freiberg, Germany, 2009. [Google Scholar]
- ASTM. E1461-13: Standard Test Method Thermal Diffusivity by Flash Method; ASTM International: West Conshohocken, PA, USA, 2013. [Google Scholar]
- Amani, Y.; Takahashi, A.; Chantrenne, P.; Maruyama, S.; Dancette, S.; Maire, E. Thermal conductivity of highly porous metal foams: Experimental and image based finite element analysis. Int. J. Heat Mass Transf. 2018, 122, 1–10. [Google Scholar] [CrossRef]
- DIN Deutsches Institut für Normung. DIN 52612-1: Testing of Thermal Insulating Materials; Determination of Thermal Conductivity by The Guarded Hot Plate Apparatus; Test Procedure and Evaluation of Results; DIN Deutsches Institut für Normung: Berlin, Germany, 1979. [Google Scholar]
- DIN Deutsches Institut für Normung. DIN EN 12664: Thermal Performance of Building Materials and Products—Determination of Thermal Resistance by Means of Guarded Hot Plate and Heat Flow Meter Methods—Dry and Moist Products with Medium and Low Thermal Resistance; DIN Deutsches Institut für Normung: Berlin, Germany, 2001. [Google Scholar]
- ASTM International. ASTM C177–19: Standard Test Method for Steady-State Heat Flux Measurements and Thermal Transmission Properties by Means of the Guarded-Hot-Plate Apparatus; ASTM International: West Conshohocken, PA, USA, 2019. [Google Scholar]
- ASTM International. ASTM C 518: Standard Test Method for Steady-State Thermal Transmission Properties by Means of the Heat Flow Meter Apparatus; ASTM International: West Conshohocken, PA, USA, 2017. [Google Scholar]
- DIN Deutsches Institut für Normung. DIN EN 1094-7: Insulating Refractory Products—Part 7: Methods of Test for Ceramic Fibre Products; DIN Deutsches Institut für Normung: Berlin, Germany, 2005. [Google Scholar]
- ASTM International. ASTM C 201: Standard Test Method for Thermal Conductivity of Refractories; ASTM International: West Conshohocken, PA, USA, 2019. [Google Scholar]
- Gross, U.; Barth, G.; Wulf, R.; Tran, L.T.S. Messung der Wärmeleitfähigkeit von Dämmstoffen mit unterschiedlichen Methoden. High Temp. High Press. 2001, 33, 141–150. [Google Scholar] [CrossRef]
- ASTM International. ASTM E1225-13: Standard Test Method for Thermal Conductivity of Solids Using the Guarded-Comparative-Longitudinal Heat Flow Technique; ASTM International: West Conshohocken, PA, USA, 2013. [Google Scholar]
- Catchpole-Smith, S.; Sélo, R.R.J.; Davis, A.W.; Ashcroft, I.A.; Tuck, C.J.; Clare, A. Thermal conductivity of TPMS lattice structures manufactured via laser powder bed fusion. Addit. Manuf. 2019, 30, 100846. [Google Scholar] [CrossRef]
- Abuserwal, A.F.; Elizondo Luna, E.M.; Goodall, R.; Woolley, R. The effective thermal conductivity of open cell replicated aluminium metal sponges. Int. J. Heat Mass Transf. 2017, 108, 1439–1448. [Google Scholar] [CrossRef]
- Dyga, R.; Witczak, S. Investigation of Effective Thermal Conductivity Aluminum Foams. Procedia Eng. 2012, 42, 1088–1099. [Google Scholar] [CrossRef]
- Mirabolghasemi, A.; Akbarzadeh, A.H.; Rodrigue, D.; Therriault, D. Thermal conductivity of architected cellular metamaterials. Acta Mater. 2019, 174, 61–80. [Google Scholar] [CrossRef]
- Hu, Y.; Fang, Q.-Z.; Yu, H.; Hu, Q. Numerical simulation on thermal properties of closed-cell metal foams with different cell size distributions and cell shapes. Mater. Today Commun. 2020, 24, 100968. [Google Scholar] [CrossRef]
- Iasiello, M.; Bianco, N.; Chiu, W.K.S.; Naso, V. Thermal conduction in open-cell metal foams: Anisotropy and Representative Volume Element. Int. J. Therm. Sci. 2019, 137, 399–409. [Google Scholar] [CrossRef]
- Veyhl, C.; Belova, I.V.; Murch, G.E.; Oechsner, A.; Fiedler, T. Thermal analysis of aluminium foam based on micro-computed tomography. Materwiss. Werksttech. 2011, 42, 350–355. [Google Scholar] [CrossRef]
- Fiedler, T.; Belova, I.V.; Murch, G.E. Theoretical and Lattice Monte Carlo analyses on thermal conduction in cellular metals. Comput. Mater. Sci. 2010, 50, 503–509. [Google Scholar] [CrossRef]
- Wulf, R.; Mendes, M.A.A.; Skibina, V.; Al-Zoubi, A.; Trimis, D.; Ray, S.; Gross, U. Experimental and numerical determination of effective thermal conductivity of open cell FeCrAl-alloy metal foams. Int. J. Therm. Sci. 2014, 86, 95–103. [Google Scholar] [CrossRef]
- Cops, M.J.; McDaniel, J.G.; Magliula, V.; Bamford, D.J.; Bliefnick, J. Measurement and analysis of sound absorption by a composite foam. Appl. Acoust. 2020, 160, 107138. [Google Scholar] [CrossRef]
- Byakova, A.V.; Gnyloskurenko, S.; Bezimyanniy, Y.; Nakamura, T. Closed-Cell Aluminum Foam of Improved Sound Absorption Ability: Manufacture and Properties. Metals 2014, 3, 445–454. [Google Scholar] [CrossRef]
- Yang, F.; Shen, X.; Bai, P.; Zhang, X.; Li, Z.; Yin, Q. Optimization and Validation of Sound Absorption Performance of 10-Layer Gradient Compressed Porous Metal. Metals 2019, 9, 588. [Google Scholar] [CrossRef]
- Vaidya, U.A.; Pillay, S.; Bartus, S.; Ulven, C.A.; Grow, D.T.; Mathew, B. Impact and post-impact vibration response of protective metal foam composite sandwich plates. Mater. Sci. Eng. A 2006, 428, 59–66. [Google Scholar] [CrossRef]
- Pang, X.; Du, H. Dynamic characteristics of aluminium foams under impact crushing. Compos. Part B 2017, 112, 265–277. [Google Scholar] [CrossRef]
- Liu, H.; Wei, J.; Qu, Z. Prediction of aerodynamic noise reduction by using open-cell metal foam. J. Sound Vib. 2012, 331, 1483–1497. [Google Scholar] [CrossRef]
- Otaru, A.J.; Morvan, H.P.; Kennedy, A.R. Modelling and optimisation of sound absorption in replicated microcellular metals. Scr. Mater. 2018, 150, 152–155. [Google Scholar] [CrossRef]
- Yang, X.; Peng, K.; Shen, X.; Zhang, X.; Bai, P.; Xu, P. Geometrical and Dimensional Optimization of Sound Absorbing Porous Copper with Cavity. Mater. Des. 2017, 131, 297–306. [Google Scholar] [CrossRef]
- Jiejun, W.; Chenggong, L.; Dianbin, W.; Manchang, G. Damping and sound absorption properties of particle reinforced Al matrix composite foams. Compos. Sci. Technol. 2003, 63, 569–574. [Google Scholar] [CrossRef]
- Carneiro, V.H.; Puga, H.; Meireles, J. Positive, zero and negative Poisson’s ratio non-stochastic metallic cellular solids: Dependence between static and dynamic mechanical properties. Compos. Struct. 2019, 226, 111239. [Google Scholar] [CrossRef]
- ASTM International. ASTM E 1050 Standard. Standard Test Method for Impedance and Absorption of Acoustical Materials Using a Tube, Two Microphones and a Digital Frequency Analysis System; ASTM International: West Conshohocken, PA, USA, 2019. [Google Scholar]
© 2020 by the authors. Licensee MDPI, Basel, Switzerland. This article is an open access article distributed under the terms and conditions of the Creative Commons Attribution (CC BY) license (http://creativecommons.org/licenses/by/4.0/).