Article

Comparative Study on the Uniaxial Behaviour of Topology-Optimised and Crystal-Inspired Lattice Materials

Key Laboratory of Traffic Safety on Track, Ministry of Education, School of Traffic & Transportation Engineering, Central South University, Changsha 410075, China
*
Author to whom correspondence should be addressed.
Metals 2020, 10(4), 491; https://doi.org/10.3390/met10040491
Submission received: 10 March 2020 / Revised: 5 April 2020 / Accepted: 7 April 2020 / Published: 8 April 2020
(This article belongs to the Special Issue Cellular Metals: Fabrication, Properties and Applications)

Abstract

:
This work comparatively studies the uniaxial compressive performances of three types of lattice materials, namely face-centre cube (FCC), edge-centre cube (ECC), and vertex cube (VC), which are separately generated by topology optimisation and crystal inspiration. High similarities are observed between the materials designed by these two methods. The effects of design method, cell topology, and relative density on deformation mode, mechanical properties, and energy absorption are numerically investigated and also fitted by the power law. The results illustrate that both topology-optimised and crystal-inspired lattices are mainly dominated by bending deformation mode. In terms of collapse strength and elastic modulus, VC lattice is stronger than FCC and ECC lattices because its struts are arranged along the loading direction. In addition, the collapse strength and elastic modulus of the topology-optimised FCC and ECC are close to those generated by crystal inspiration at lower relative density, but the topology-optimised FCC and ECC are obviously superior at a higher relative density. Overall, all topology-generated lattices outperform the corresponding crystal-guided lattice materials with regard to the toughness and energy absorption per unit volume.

1. Introduction

As a mimic of nature cellular material, lattice material is designed with its unit cells arranged periodically along tessellation directions. Metallic lattice materials can provide excellent mechanical properties, e.g., ultra light weight, better durability, high specific strength and stiffness, and a superior energy absorption capability [1,2,3,4]. Methods for lattice material design can be generally classified into two categories, i.e., manual generation and mathematical generation [5].
Manual generation means designing a lattice material by using beams and trusses with joints modified to create seamless transitions between unit cell elements [5]. There are numerous manually designed lattice materials and some of them are inspired by crystal structures. Typical examples are simple cubic [6], diamond [7], face-centred cubic (FCC) [8], FCCZ (i.e., FCC with enhanced vertical struts) [9], body-centred cubic (BCC) [10], Kagome [11], F2BCC [12]; Gurtner-Durand [13], Octet-truss [14], Octahedron [13], Octahedron-cross [15], Octahedral [16], tetrakaidecahedron [13], rhombic dodecahedron [17], etc. Additive manufacturing (AM) technology can be employed to fabricate lattice materials [18]. Lozanovski et al. [19,20] numerically investigated the strut defects of lattice materials fabricated by the AM method, and a Monte Carlo simulation-based approach was proposed to predict the stiffness of a lattice material with defects.
The mathematical generation method utilises algorithms and constraints to create a lattice structure [5]. Examples of mathematically generated lattice materials are triply periodic minimal surfaces (TPMS) (e.g., skeletal-TPMS and sheet-TPMS lattices) [17,21,22], all face-centred cubic (AFCC) [23], FCC [1], edge-centre cube (ECC) [1], vertex cube (VC) [1], cuttlebone-like lattice (CLL) [24], etc.) The topology optimisation algorithm can also be used to determine the optimal material distribution for lightweight structure design.
Two common solutions for topology optimisation are the optimality criteria (OC) [25] and the Method of Moving Asymptotes (MMA) [26], and details are referred to [27]. Its applications on engineering structures are reviewed by Sigmund and Maute [28] and Kentli [29]. Topology optimisation methods based on discrete elements are the ground structure approach (GSA) [30], solid isotropic material with penalization (SIMP) method [31,32,33,34], homogenization method (HM) [35], evolutionary structural optimization (ESO) [36], level-set method (LSM) [37,38], and the hybrid cellular automata (HCA) algorithm [39]. In terms of lattice material design by topology optimisation, Hu et al. [24] proposed a CLL material that exhibited high compression-resistant capability. However, it can only suffer uniaxial loading rather than multiple loadings from triaxial directions. Xiao et al. [1] proposed three topology-optimised lattice materials, i.e., FCC, VC, and ECC, under three different loading modes, which were similar to manually designed lattices. Yang et al. [40] addressed four different lattice cells under various extreme loading modes, which expanded the library of structural metamaterials. However, the differences between topology-optimised and manually generated lattices have not been assessed.
In the present work, our objective is to systematically explore the similarities and differences of three types of lattice materials guided by two methods, i.e., topology optimisation and crystal inspiration. Section 2 presents the detailed design process and topological geometries, as well as the relationship between relative density and aspect ratio for crystal-inspired lattices. Finite element models are built in Section 3, and the results are presented in Section 4, including deformation modes, mechanical properties, and energy absorption. Finally, some meaningful conclusions are reported in Section 5.

2. Cell Architecture Design

2.1. Topology Optimisation Problem

In this study, two kinds of design methods, i.e., topology optimisation and crystal inspiration, are adopted to generate lattice cells. Topology optimisation is carried out in LS-TaSCTM by integrating with Ls-dyna® (LSTC, Livermore, CA, USA). The implicit algorithm is employed. The optimisation problem can be mathematically stated as follows:
{ min F ( x ) = c ( x ) s . t . K ( x ) u = f , M ( x ) / M 0 M f , 0 < x m i n x i 1 ,   i = 1 n
The goal of the topology optimisation in Equation (1) is to minimise the compliance c(x). The design variable x, with 0 < xminx ≤ 1 is known as relative density. n denotes the total number of design variables. f and u are, respectively, the vectors of nodal force and displacement, while K ( x ) is the structure stiffness matrix. M 0 and M ( x ) represent the initial mass and the current mass of the design domain. A constraint is imposed on the mass fraction M f . The base material is a high-strength steel referred to Yang et al. [41], with the key parameters presented in Table 1. Three different loading conditions, i.e., face-centred loadings, edge-centred loadings and vertexes loadings, represented by arrows, are illustrated in Table 2. The magnitude of loadings (1 N) is well selected to make sure that the design domain only suffers elastic deformation and the loading points are fixed during the optimisation process. Increasing the value of loading may lead to different optimised cells and it may also cause a problem in designing structures with a high level of porosity [1]. The topology optimisation method is a hybrid cellular automata (HCA) algorithm [42], and the solid isotropic material with penalization (SIMP) model is adopted. Two termination conditions are used to stop the optimisation process: (i) the number of iterations exceeds the maximum number of iterations, or (ii) the change in the topology is smaller than the tolerance [43]. Corresponding optimal cells are also presented in Table 2.

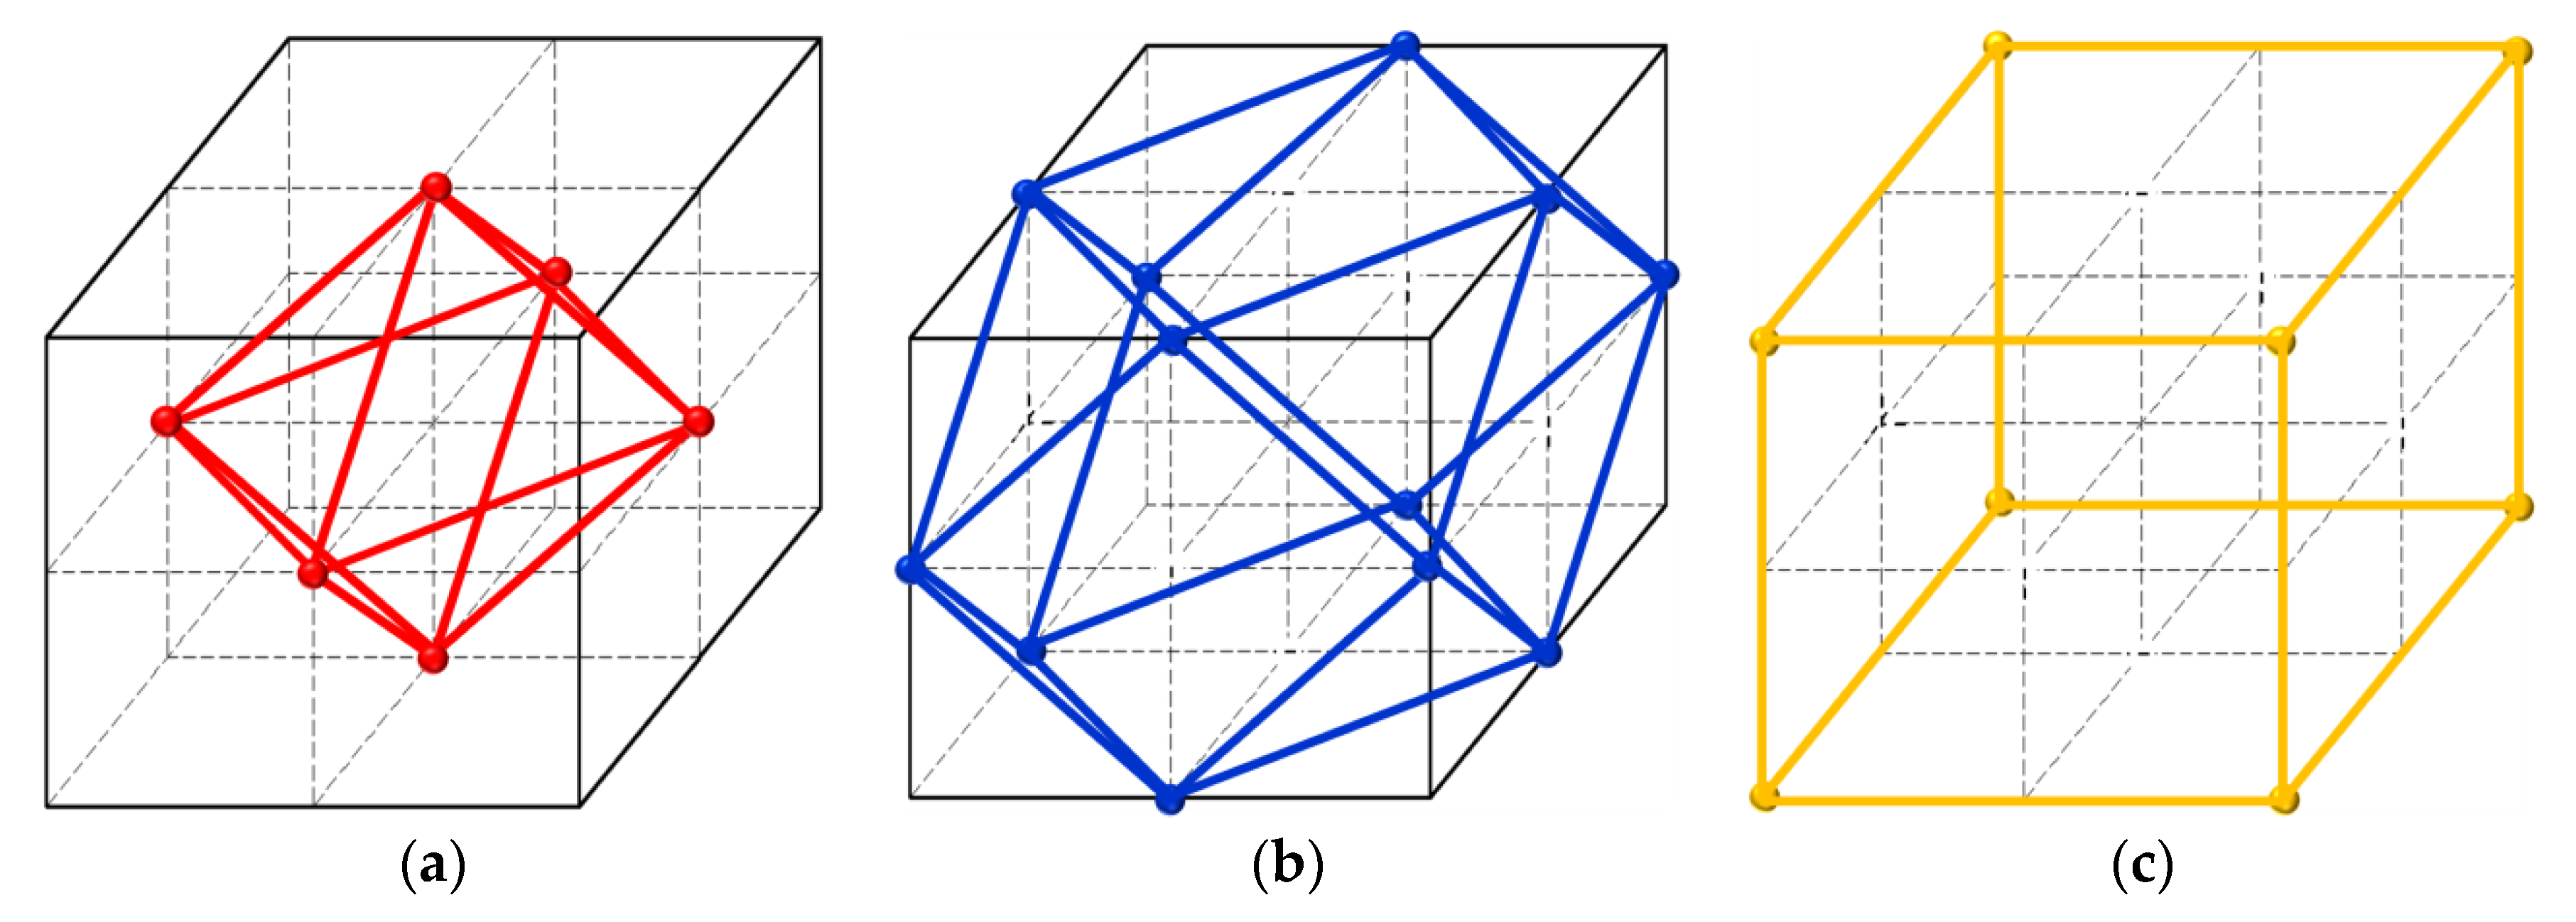
2.2. Analogy with Crystal Structures

Crystal structures are favourable sources of inspiration in manual designs with struts and joints [44]. As shown in Figure 1, a simple cube (7.5 × 7.5 × 7.5 mm3) is composed of six faces, twelve edges, and eight vertexes. Therefore, three lattice materials can be generated by, respectively, connecting the face-centre points, edge-centre points, and vertexes. The obtained lattice materials are referred to as the face-centred cube (FCC), edge-centred cube (ECC), and vertex cube (VC), which is consistent with Xiao et al. [1].
To mathematically analyse a lattice material, the individual struts shown in Figure 2 are considered. The materials overlapping in joints are removed to calculate the actual volume occupied by the lattice material. It is assumed that the lattice is composed of several struts and each strut contains one cylinder and two cones. Thus, the relative density ( ρ ¯ ) of three cells can be obtained via Equations (3) and (4), respectively.
ρ ¯ = ρ L / ρ 0
FCC   and   ECC :   ρ ¯ = 3 π ( d l 1 ) 2 ( 2 2 5 d 6 l 1 )
VC :   ρ ¯ = 3 π 2 ( d l 1 ) 2 ( 1 2 d 3 l 1 )
where ρ 0 and ρ L are the density of the base material and of the lattice material, respectively, d represents strut diameter, l1 is cube length, and d/l1 denotes the aspect ratio.
It should be mentioned that FCC and ECC share the same expression of relative density (Equation (3)). Figure 3 plots the curves showing the change in the relative density versus aspect ratio d/l1 given by Equations (3) and (4). Computer-aided design (CAD) predictions are also given in the same figure to properly validate the responses of both equations. As can be seen from Figure 3, good consistency is observed between theoretical and CAD predictions.

2.3. Numerical Results

Lattice materials derived from topology optimisation (labelled as -TO) and crystal inspiration (labelled as -CI) are presented in Table 2. The relative density of the generated cells varies in the interval [0.1, 0.3], which is comparable to that of aerogel, alumina nanolattices, and other ultralight materials [45]. The boundary surface of the final optimised topology of the lattice is fitted smoothly by using FreeCAD software (open source); thus, the geometry model of the lattice cell is obtained. High consistency is observed in geometry between topology-optimised and crystal-inspired materials, but the solutions provided by topology optimisation are generally non-uniform in terms of strut thickness and joint shape, unlike the regular topology of crystal-inspired cells. By increasing the relative density, walls are likely to be formed between neighbouring struts (see lattice materials with ρ ¯ = 0.30). It should be mentioned that the FCC in this work is similar to the octahedral lattice in [5,46]. The ECC in this work is also named as octahedron in Gross et al. [13], and the VC in this work has the same cell topology as the cubic lattice in Mei et al. [2].

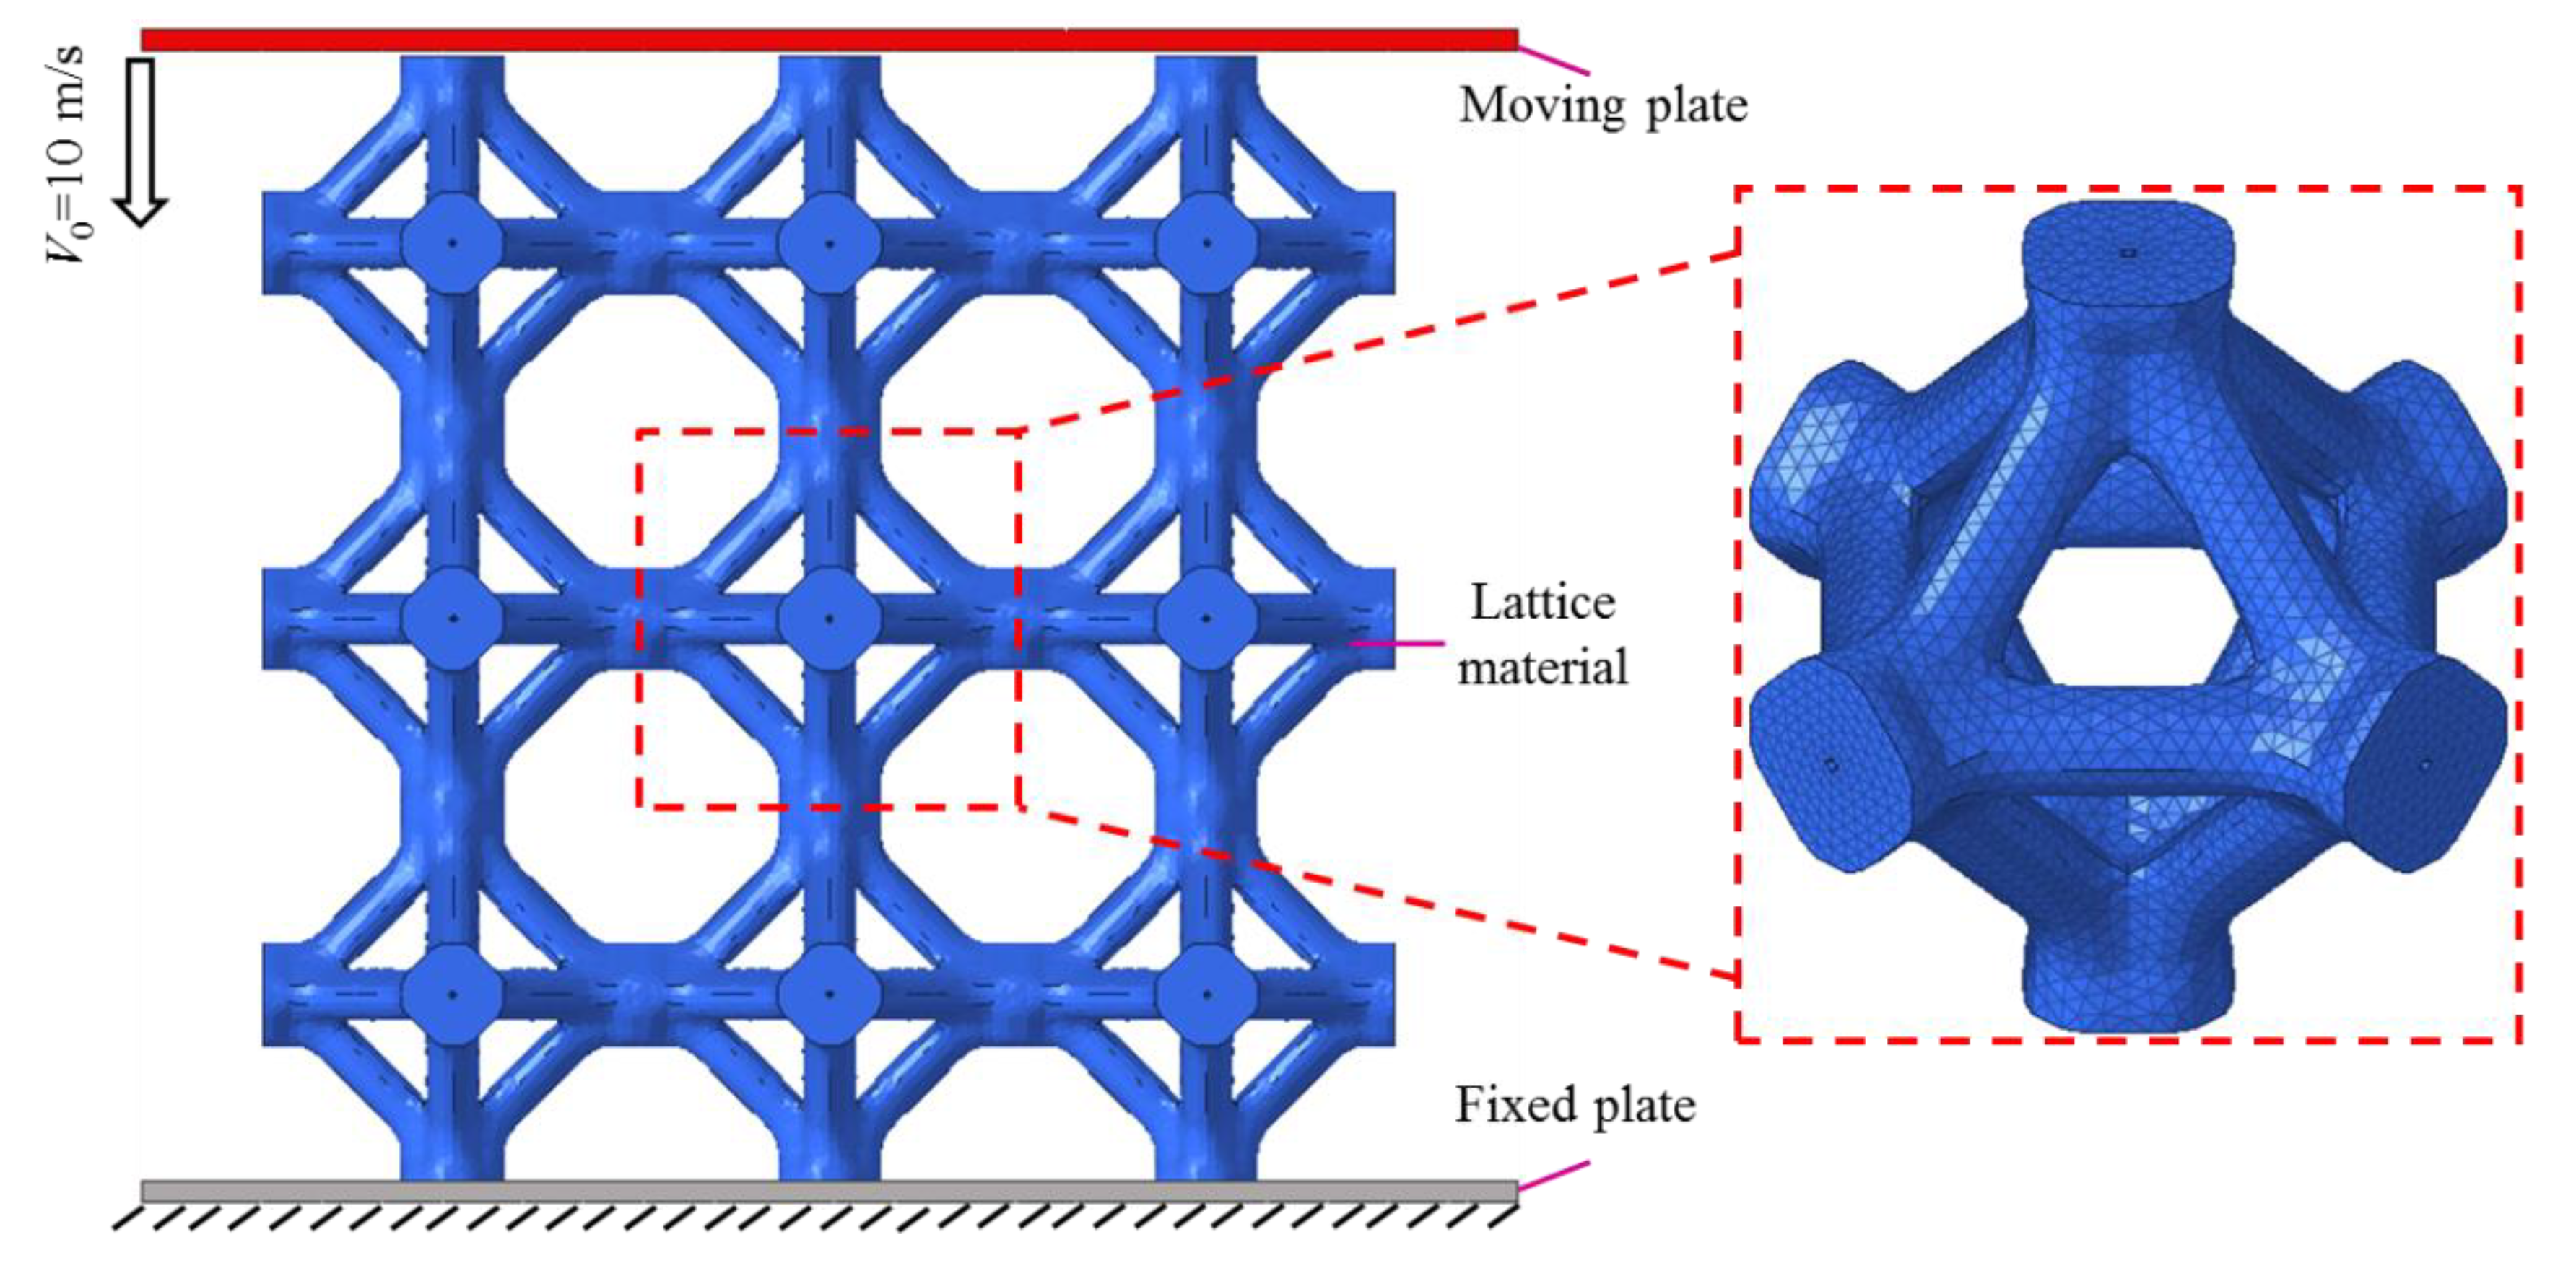
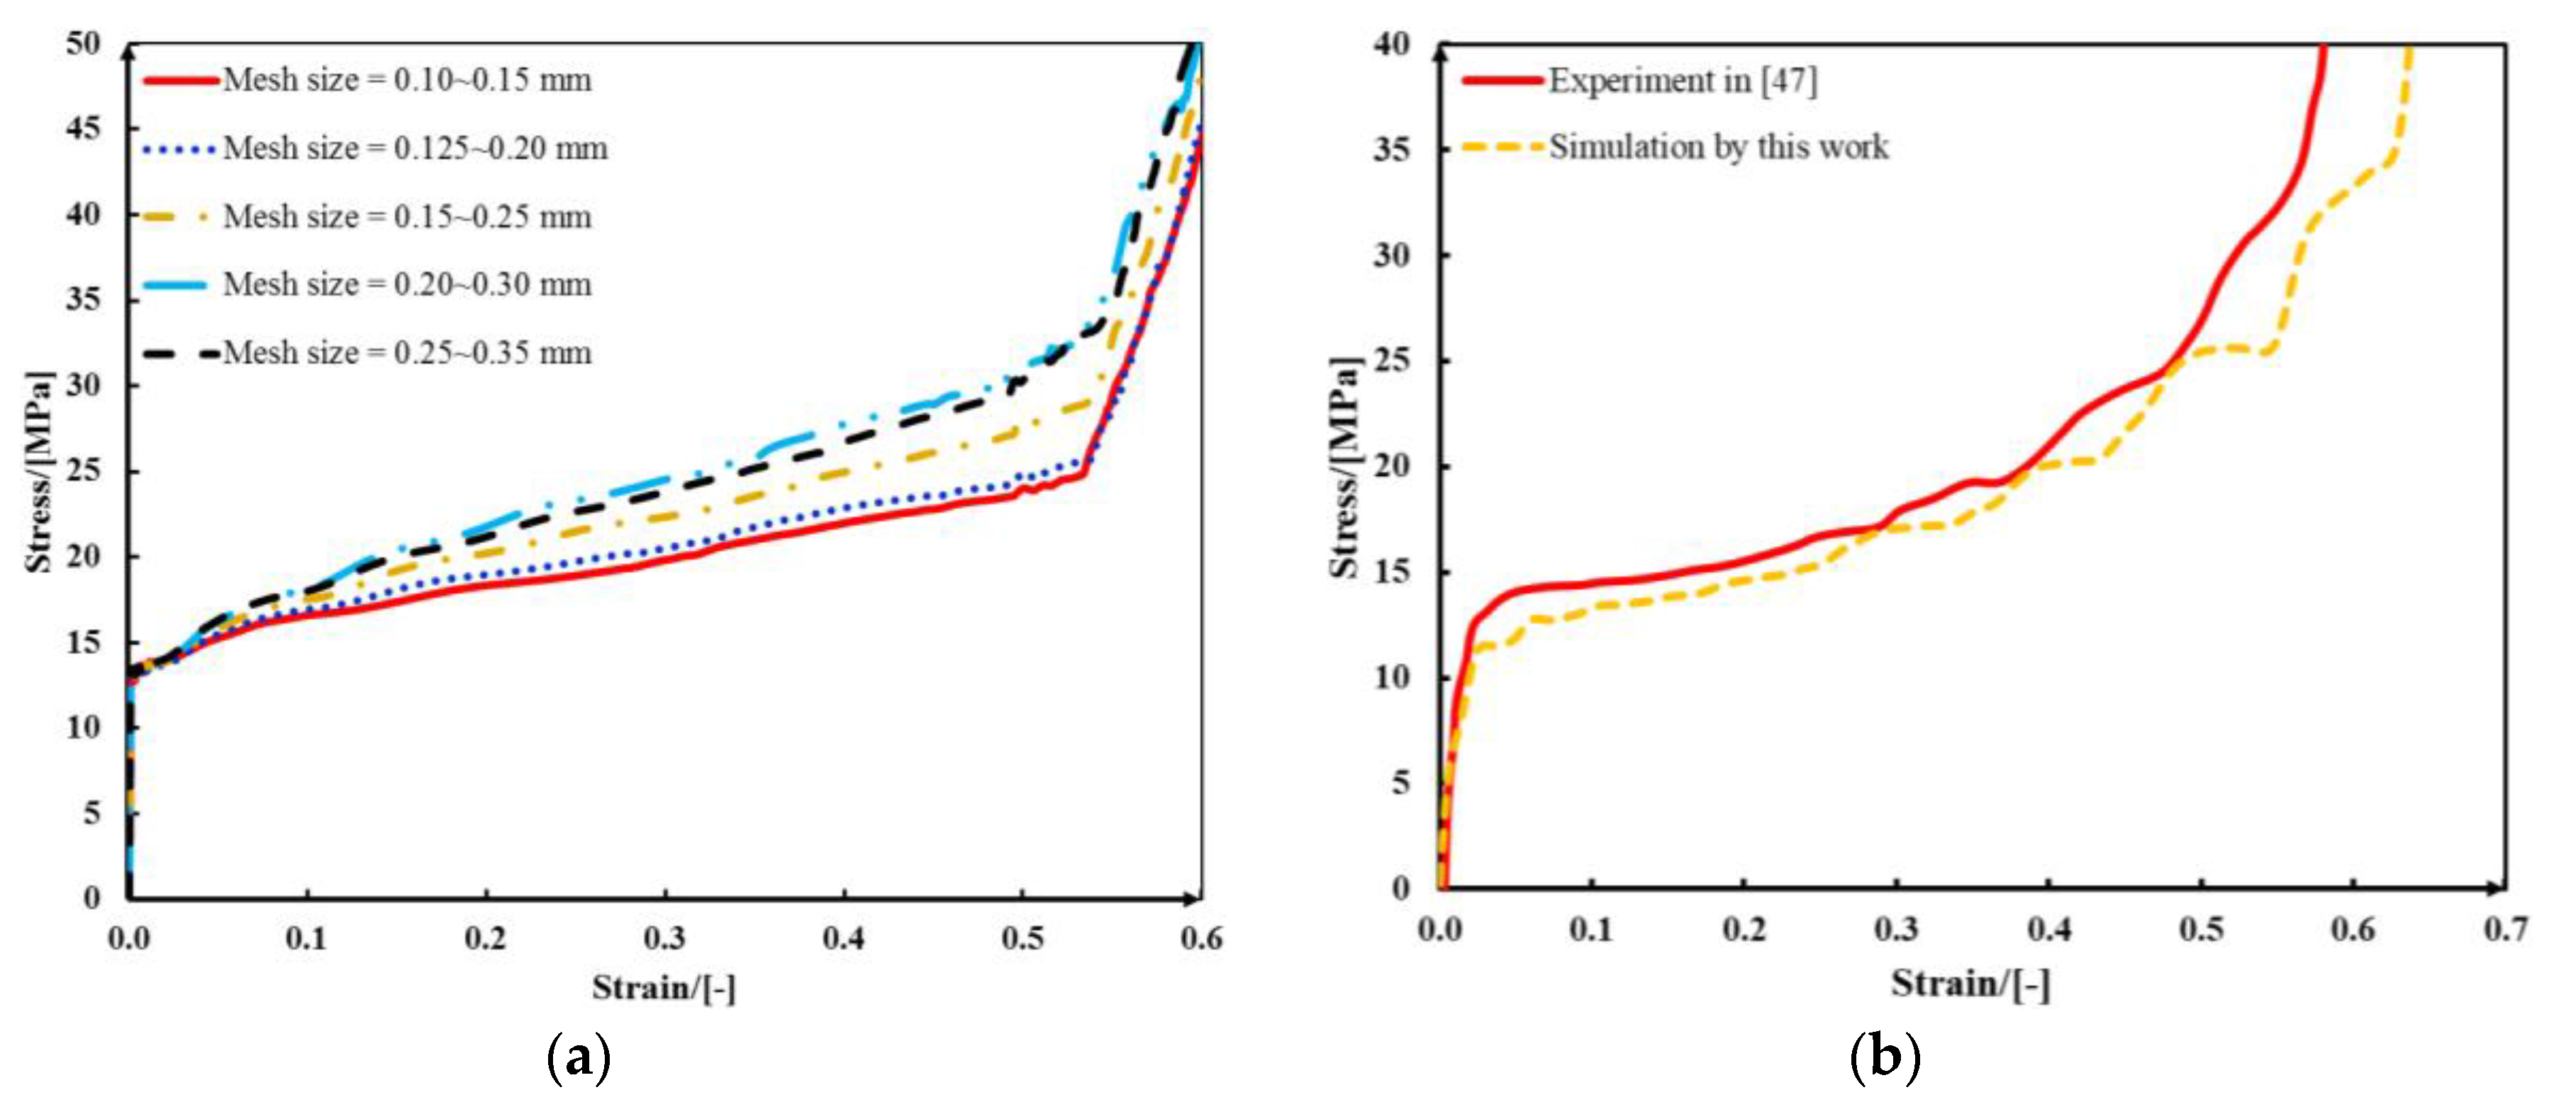
3. Finite Element Modelling

Finite element models are built in Ls-dyna® to predict the uniaxial compressive behaviour of the lattice materials. The geometry models of lattice materials are meshed into tetrahedral elements, which are constant stress solid elements. Instead of using periodic boundary conditions on a single unit cell, a 3 × 3 × 3 cell model with dimension of 22.5 × 22.5 × 22.5 mm3 is built. The influence of the number of cells on the elastic modulus of lattice material was numerically studied by Maskery et al. [47], and they found that the converged modulus of the 3 × 3 × 3 cell diamond lattice was just 1% below the upper bound of the theoretical elastic modulus. The FE model of FCC-TO is shown in Figure 4. The lattice materials are placed between two parallel plates, which are modelled as rigid bodies by *Mat.020_Mat_Rigid [48]. The bottom plate is fixed while the top plate impacts the specimen at a constant speed (10 m/s). “*Mat.024_Mat_Piecewise_Linear_Plasticity” [48] is selected to bilinearly approximate the stress–strain curve of elastic-plastic material in Table 1. The impact force is captured by using the *Automatic_Surface_To_Surface contact algorithm [48] applied among specimens and boundaries. In this algorithm, the stiffness of contact elements is penalised by a scale factor [48]. Mesh size is determined, as a result of a sensitivity analysis, as a compromise between accuracy and low computing time. Figure 5 plots the stress–strain curves of the FCC-TO sample calculated by various element sizes, i.e., 0.10~0.15 mm, 0.125~0.200 mm, 0.15~0.25 mm, 0.20~0.30 mm, and 0.25~0.35 mm. In Figure 5, convergence can be obtained when element size is equal to 0.125~0.200 mm. Therefore, this element size is employed for computation throughout this study, which means the main parts of the lattice have an element size of 0.200 mm, while other parts (e.g., joints) are characterised by a smaller element size, i.e., 0.125 mm. The finite element model has been validated by means of experimental results obtained for a body-centred-cubic (BCC) lattice made of 316L stainless steel, taken from [49]. As shown in Figure 5b, a good agreement is observed between experimental and numerical data. It should be noted that the simulation curve in Figure 5b is filtered by using Butterworth Filter with a frequency of 20,000 Hz. The frequency is carefully selected to filter the numerical perturbation while maintaining the characteristics of the stress–strain curve.

4. Results and Discussion

4.1. Deformation Modes

Table 3 reports the Von Mises stress distributions in lattice materials with a relative density of 0.10 up to 50% overall deformation. Generally, each layer of lattice materials collapses almost synchronously, although the middle layer deforms relatively faster than the top and bottom layers, which was also observed in sheet-IWP latice by Al-Ketan et al. [50]. There are strong stress concentrations occurring on some supporting struts and connecting joints for each lattice material. However, the level of equivalent stress is the lowest at the horizontal rods of VC-CI because these struts are orthogonal to the loading direction. The gap between the stresses of vertical and horizontal rods results in unstable deformation in VC-CI at a low relative density, which exhibits a failure band at ε = 0.35. Liu et al. [51] obtained microscopy images of local stress concentrations in VC-CI where slip bands and grain boundaries were found. Comparing the topology-guided and manually generated lattices, FCC-TO and ECC-TO exhibit highly similar deformation modes to the FCC-CI and ECC-CI. However, an obvious difference is found between VC-TO and VC-CI lattices (marked in Table 3) and no shear band is observed in the VC-TO lattice. Thus, the topology-optimised VC lattice undergoes a more stable deforming process.
To study the effect of relative density, the deformation features of lattice materials with a relative density ranging from 0.10 to 0.30 are carefully examined. The stress distributions are similar for a relative density higher than 0.20, although the higher the relative density, the higher the Von Mises stress due to the higher stiffness. Thus, the Von Mises stress distributions in the lattice materials with relative density of 0.20 are presented in Table 4. It can be found that lattice materials deform more uniformly and collectively at a higher relative density. In addition, the shear band disappears in the VC-CI lattice when its relative density is higher than 0.20.

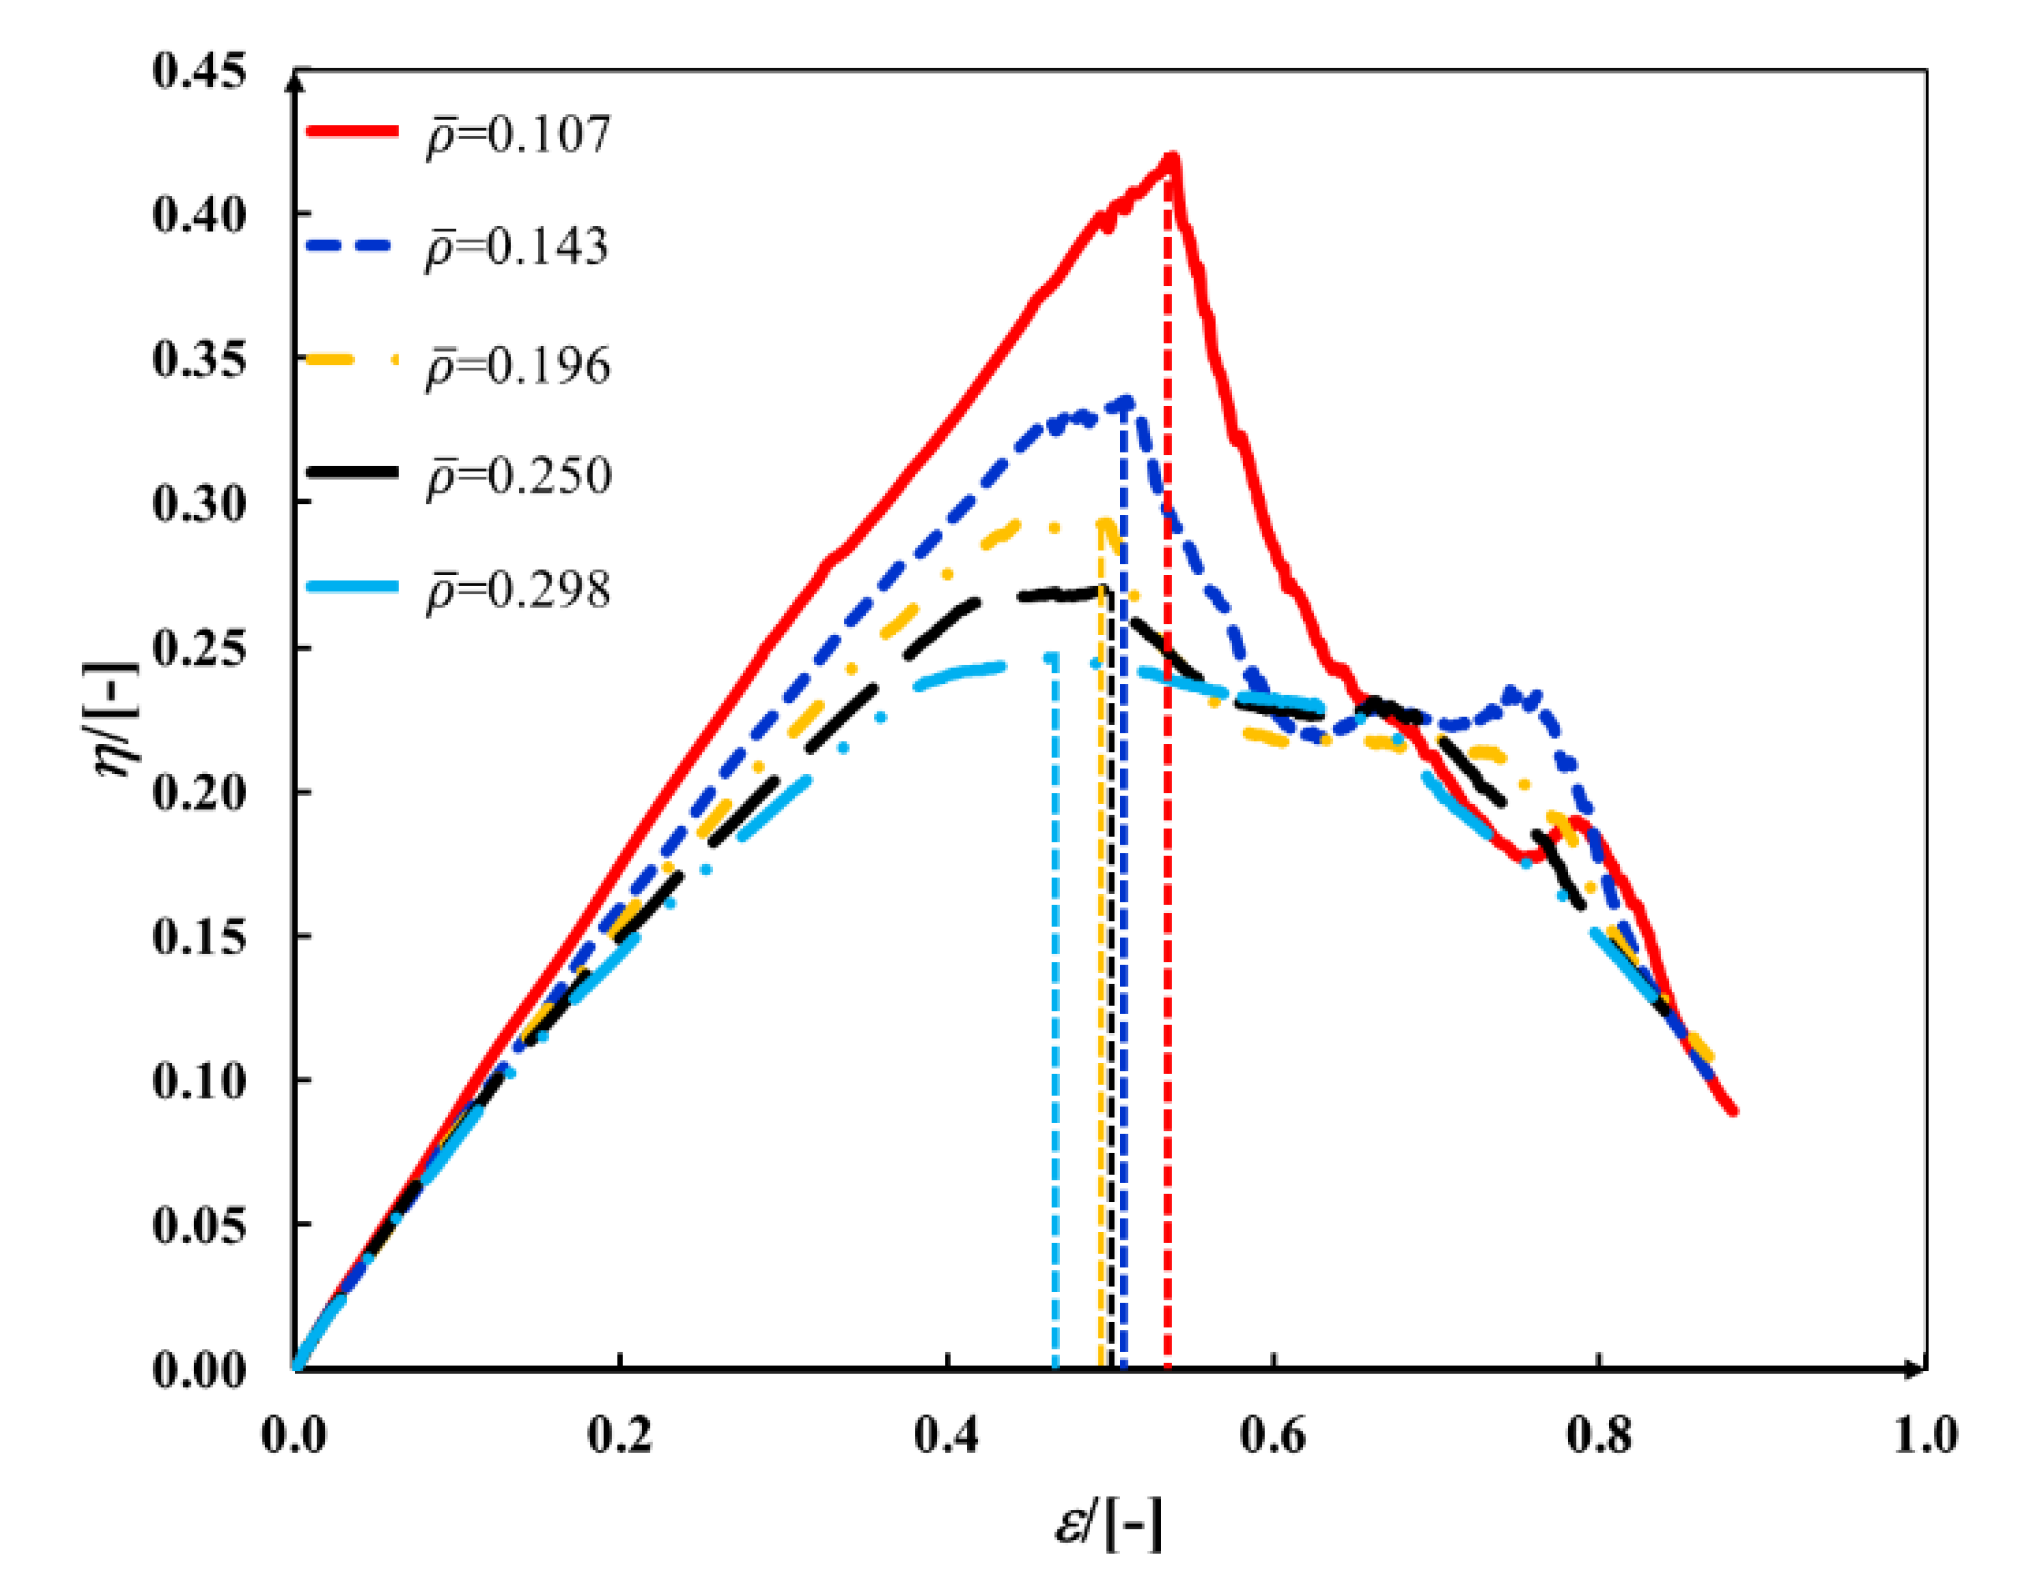
4.2. Stress-Strain Curves

The stress-strain (σ-ε) curves extracted from the impact simulation on the designed lattice materials with various relative densities are shown in Figure 6. Additionally, the initial compression stage with ε < 5 is enlarged. The stress and strain are calculated in accordance with the initial cross-sectional area and length of each specimen, respectively.
The curves are similar to those of common porous or cellular materials [52], which exhibit three ideal regimes under uniaxial compression, i.e., a pre-collapse regime (including the linear elastic stage), followed by a plateau regime with approximately constant stress and a final densification regime with steeply increasing stress. The linear elastic regime is characterized by elastic modulus (EL), which is driven by the bending or stretching for the inclined or vertical cell struts/walls, respectively [53]. The plateau regime due to the plastic hinges at sections or joints can be measured by plateau stress (σpl). The densification regime starts from a densification strain (εcd), where the individual cell strut/wall comes into contact with each other, and exhibits dramatically increasing strength [53].
The modulus EL is defined as the slope of the initial linear elastic region; the initial highest peak stress is defined as the strength σb; and the plateau stress σpl is calculated as the arithmetical mean of the stress at a strain interval between 20% and 40% according to ISO 13314: 2011 [54].
σ p l = 1 ε 2 ε 1 ε 1 ε 2 σ ( ε ) d ε ,
where ε 1 and ε 2 equal 0.2 and 0.4, respectively.
The εcd is identified by using the energy absorption efficiency (η) method.
η ( ε ) = 1 σ ( ε ) 0 ε σ ( ε ) d ε .
The onset of densification is given by using the following equation:
d η ( ε ) d ε | ε = ε c d = 0 ,
for which the η ( ε ) reaches a maximum on the η ( ε ) ε curve. For example, the η ( ε ) ε curves of the FCC-TO lattices are depicted in Figure 7.
Figure 6 shows that the slopes and initial peak stresses of the σ-ε curves go up as the relative density increases and all the curves reach the maximum strength value at about 1‰~5‰ overall deformation. The plateau regime is steady at lower relative density. However, a nearly linear hardening phenomenon is observed in lattice materials with higher relative density due to an increasing stiffness and hardening effect of base material. With an increasing relative density, the onset of densification also occurs earlier, resulting in a decreasing εcd (Figure 7). Comparing the two lattice generation methods, topology-guided lattices generally produce higher σ-ε curves than manually generated structures. Specifically, the gap between TO- and CI- lattices is larger at a higher relative density, although the difference is not obvious at a lower relative density. This is because of the cell walls formed in topology-optimised lattices at high mass fraction, as shown in Table 2. In general, σpl of optimised structures is higher than that of manually designed structures, especially for FCC (see Table 5). However, three cases (i.e., ECC with ρ ¯ 0.15 , VC with ρ ¯ 0.15 and 0.20 ) are excepted, which may be attributed to the slightly lower relative density of topology-optimised lattices comparing with the corresponding crystal-inspired lattices. For example, the ρ ¯ of VC-TO is 0.147, while that of corresponding VC-CI is 0.150 (see Figure 6).

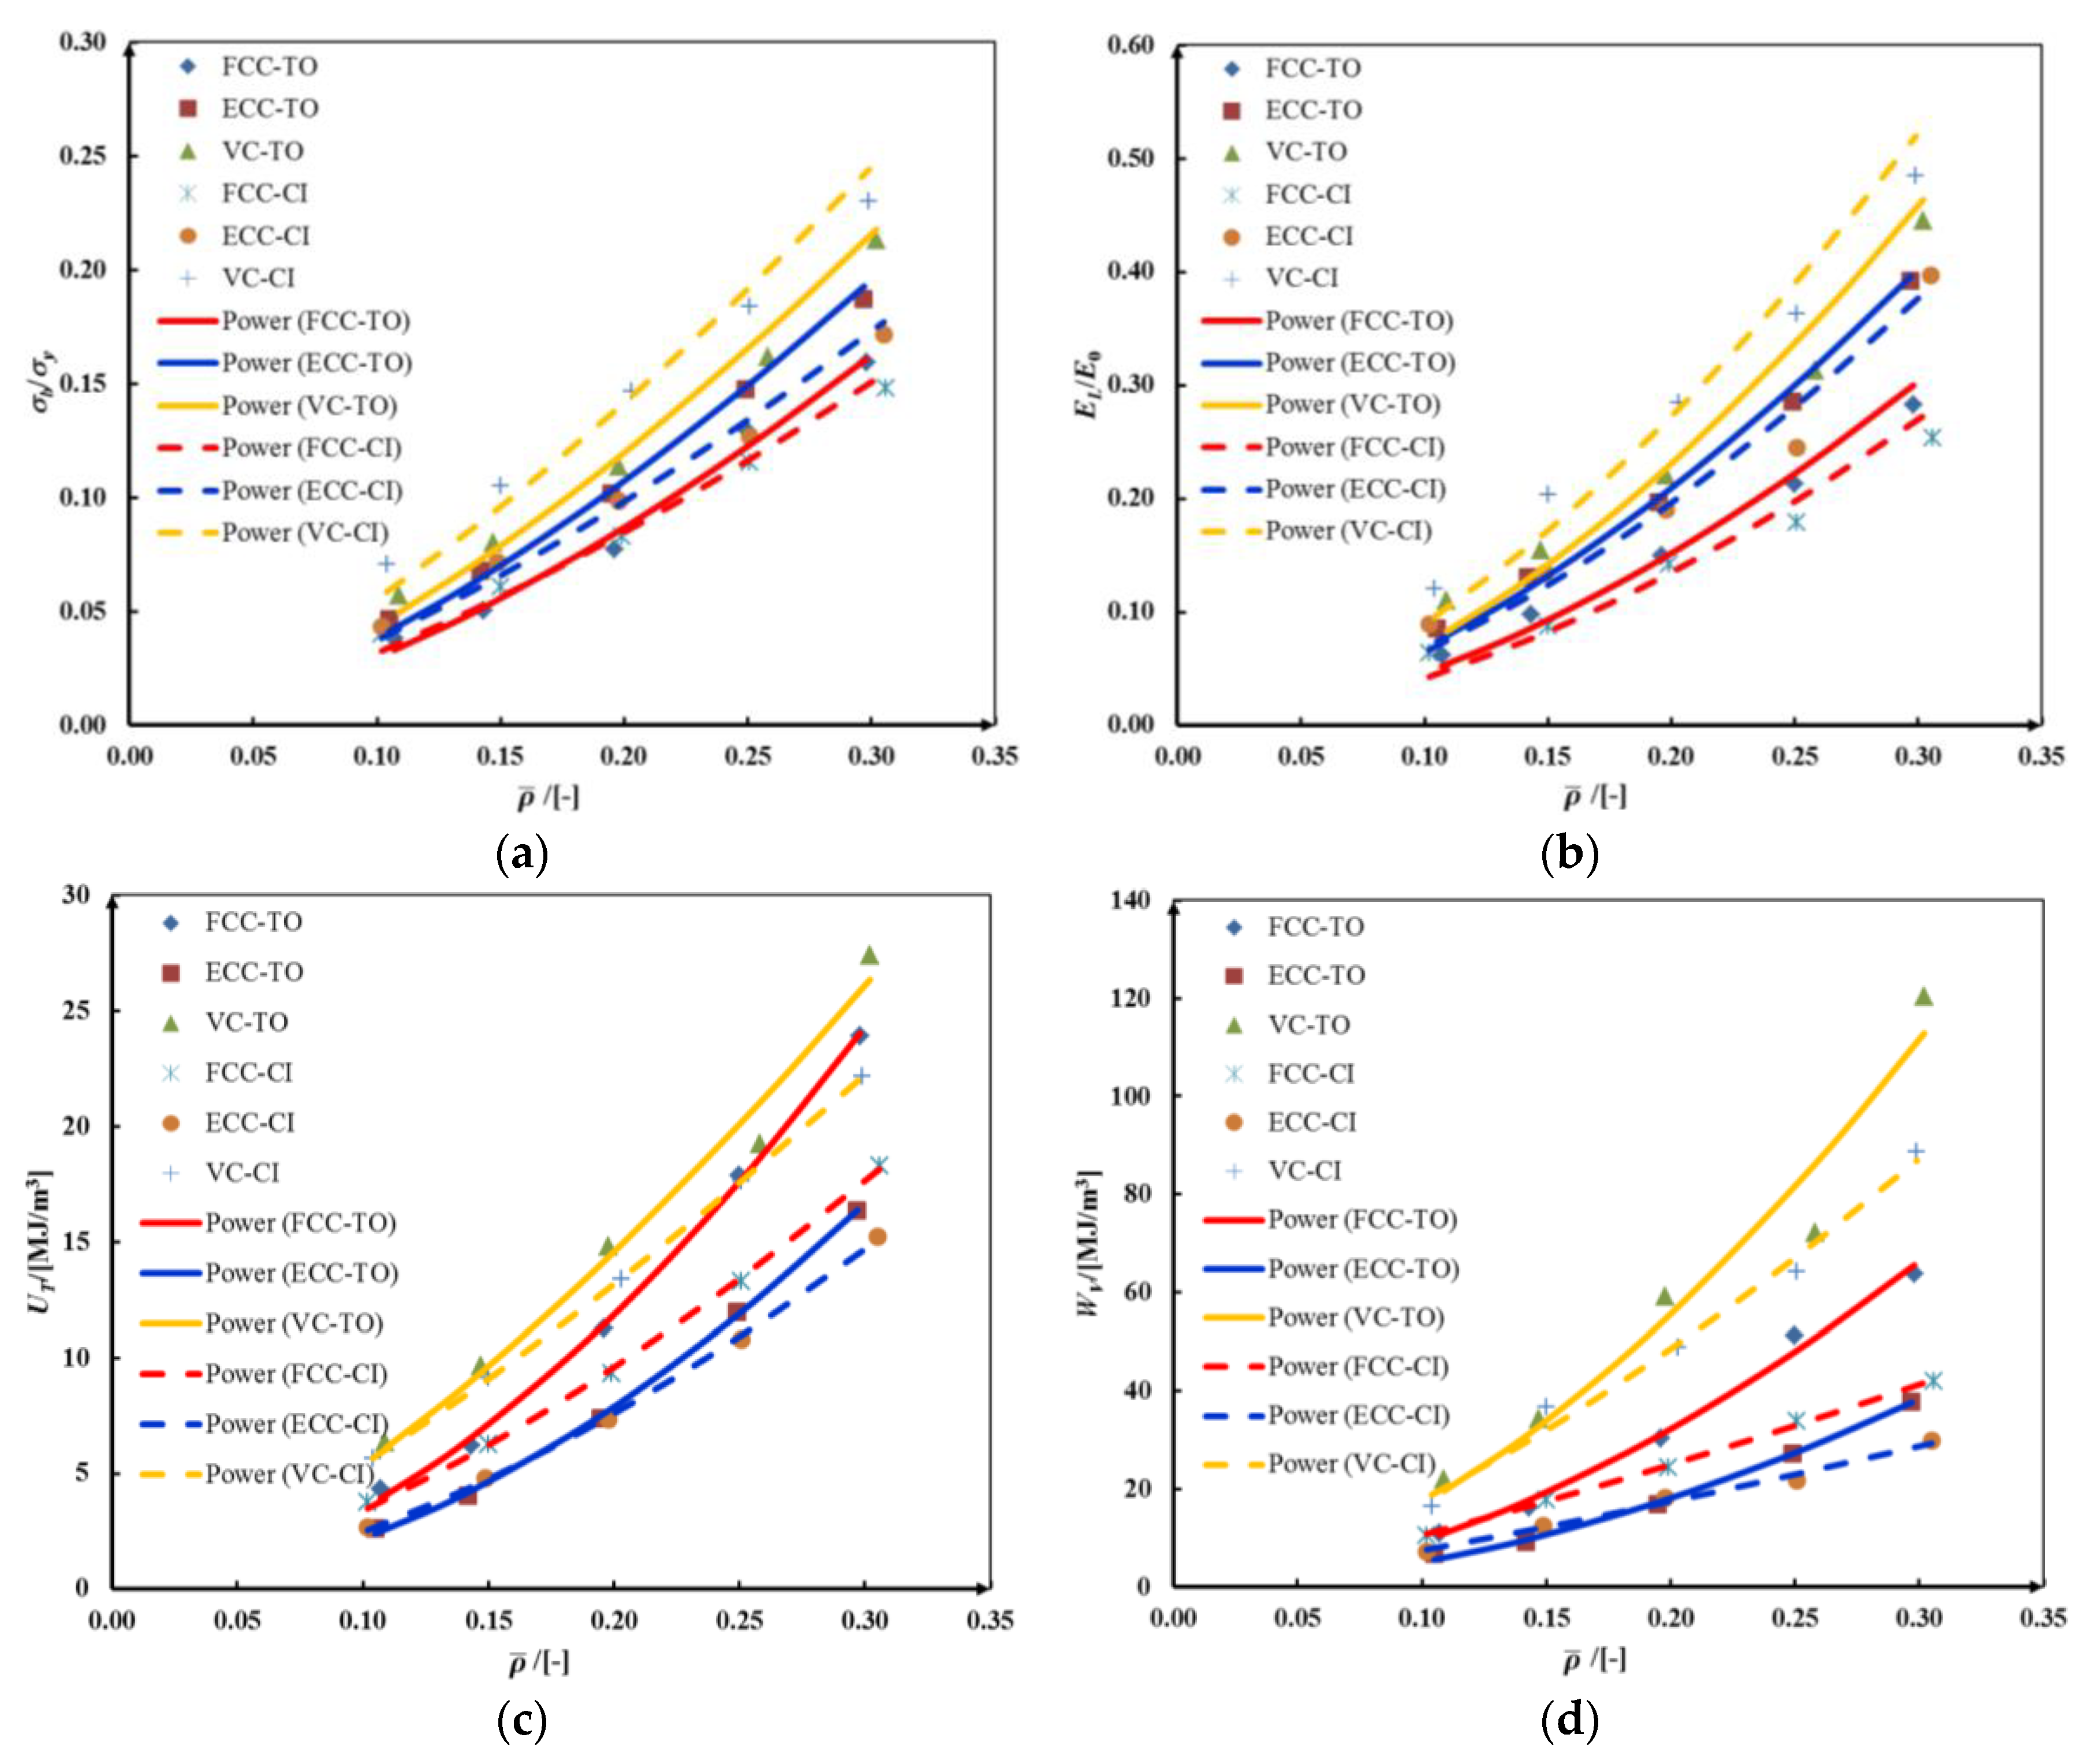
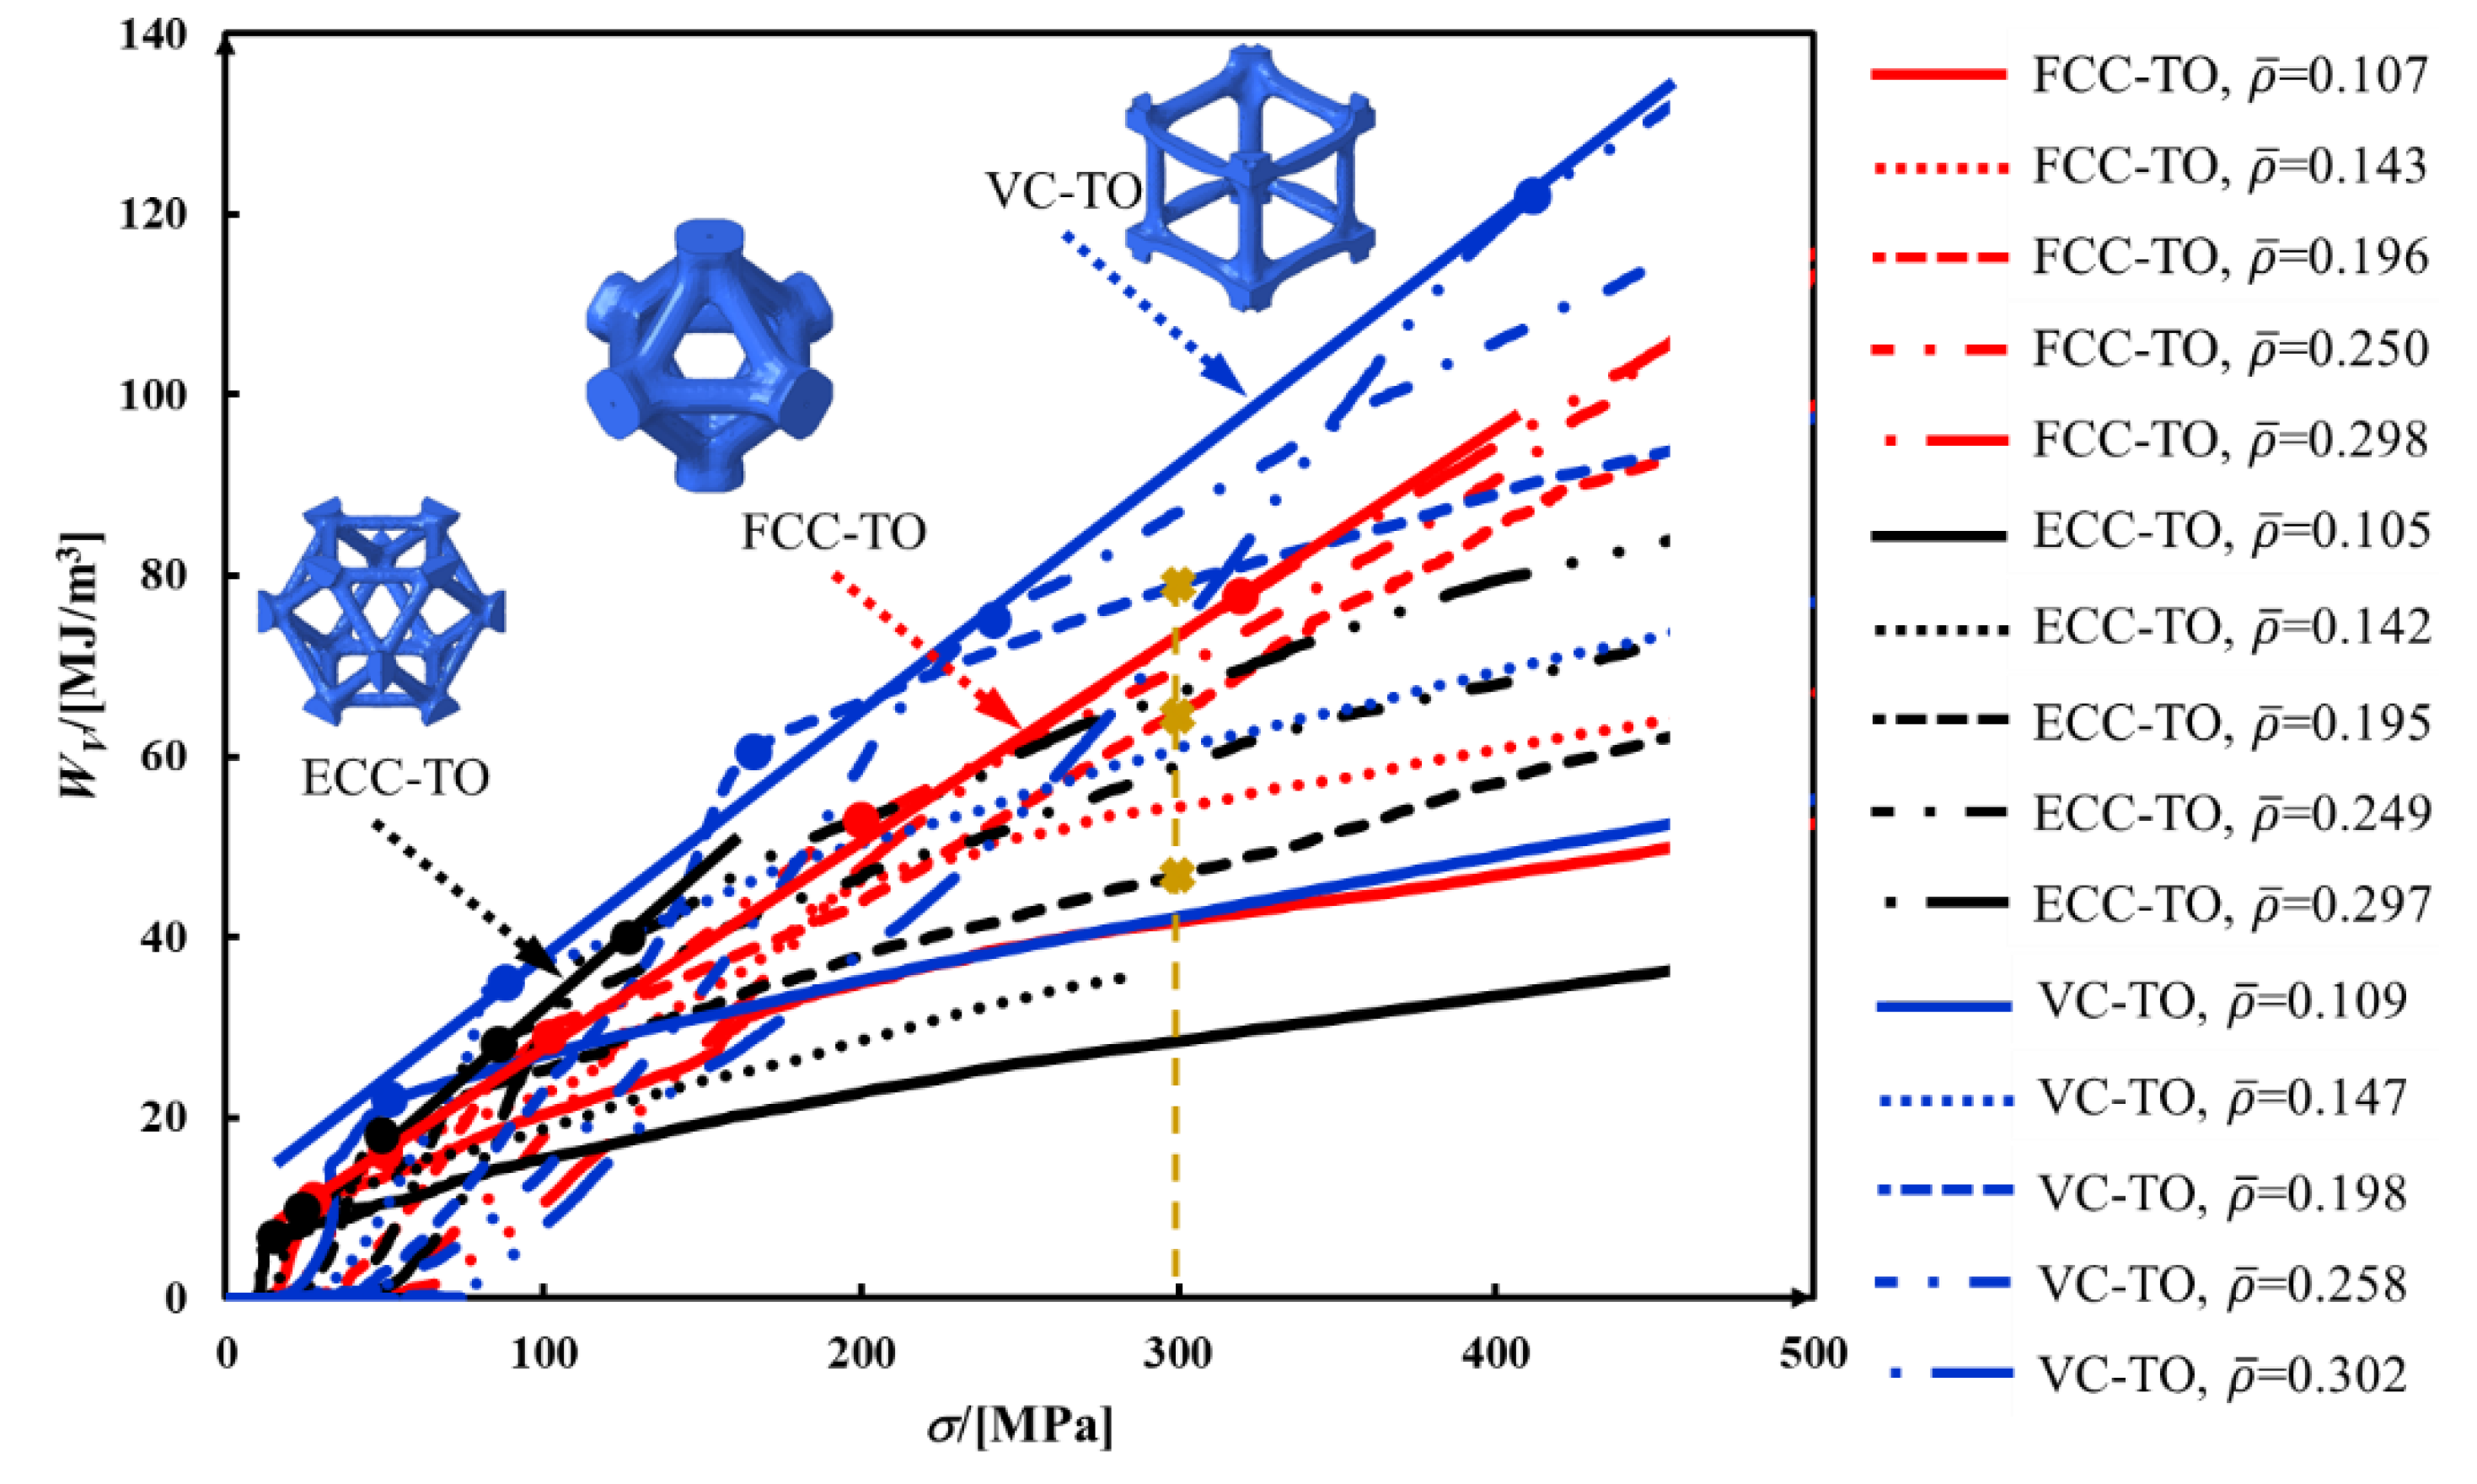
4.3. Mechanical Properties and Energy Absorption

In general, the compressive strength and elastic modulus of lattice materials would increase if the relative density increases because there is a larger amount of material withstanding the impact force. This relationship could be fitted by a power law proposed by Gibson and Ashby [55]. The elastic Modulus, EL, and collapse strength, σb, scale with relative density, ρ ¯ , according to the relationships:
σ b σ y = C 1 ( ρ ¯ ) n 1 ,
E L E 0 = C 2 ( ρ ¯ ) n 2 ,
where n1 and n2 represent the structural bending/stretching dominated mode. For bending-dominated structures (e.g., body-centred lattice), n1 = 1.5, and n2 = 2; for stretching-dominated structures (e.g., Octet-truss lattice), both n1 and n2 are equal to 1. C1 and C2 are constants related to the lattice’s architecture as well as the base material properties.
The power law and simulation data are plotted in Figure 8, reflecting that the results of this study are fitted very well with the formulae. The coefficients of constant C (C1 and C2) and exponent n (n1 and n2) are tabulated in Table 6. It is noticed that the exponents, n1 and n2, of the as-designed lattice materials are respectively close to 1.50 and 1.70, which indicates a bending-dominated behaviour mixed with a light stretching mode. Montemayor and Greer [46] pointed out that the FCC lattice behaves as a bending-dominated structure due to the rotation between and within unit cells, although the unit cell is a stretching-dominated structure. This phenomenon can be observed in Table 3. Gross et al. [13] made it clear that the ECC lattice is also a bending-dominated structure. Compression tests were carried out on the VC-CI lattices by Mei et al. [2], where the power law with n1 = 1.5 and n2 = 2 was used to fit the experimental data.
Comparing the six bending-dominated structures in Figure 8a,b, it is predicted that VC lattices are stronger than ECC lattices, while ECC lattices are superior to FCC lattices. Additionally, the collapse strength and elastic modulus of FCC-TO and ECC-TO are close to those of FCC-CI and ECC-CI at lower relative density. However, the topology-optimised FCC and ECC obviously outperform the corresponding crystal-inspired structures at a higher relative density. Interestingly, the inverse phenomenon is found in VC lattices where the collapse strength and elastic modulus of VC-CI are higher than those of VC-TO.
The energy absorption ability, namely the energy absorbed per unit volume of cellular materials, is defined by the area under the stress-strain curve up to the densification strain.
W V = 0 ε c d σ ( ε ) d ε
Among which, the toughness (UT) is defined as the amount of energy per unit volume up to the strain of 0.25 [50].
U T = 0 ε a σ ( ε ) d ε ,     ε a = 0.25
The UT and WV are also be fitted by the power law.
U T = C 3 ( ρ ¯ ) n 3
W V = C 4 ( ρ ¯ ) n 4
As shown in Figure 8c,d, the toughness and energy absorption of all materials rise with an increasing relative density. The relationship among three kinds of lattice materials keeps as VC > FCC > ECC, and the differences become more distinct at a higher relative density. In addition, topology-optimised lattices are characterised by performances better than those of crystal-inspired lattices and the differences also become more distinct with an increasing relative density.
Engineering application generally requires that an energy absorber ought to absorb impact energy as much as possible while maintaining a low maximum stress [55]. Cellular material with high porosity produces low plateau stress; however, the quantity of absorbed energy may also be low. In contrast, a dense material is able to absorb a large amount of energy, but a high plateau stress may exceed the stress limitation [55]. The plot of energy absorption in Figure 8d misses the information of the maximum allowable stresses. Therefore, Figure 9 shows the diagrams of FCC-TO, ECC-TO, and VC-TO, in which the WV is plotted with respect to the stress (σ) to simplify the relationships of different compressive stages. The maximum allowable stress (σmax) under a certain energy absorption ability can also be obtained. This curve helps to find a cellular material that bears the required σmax by maximising the energy absorption capability [56]. An energy-efficient structure gives a high envelope. In Figure 9, VC-TO lattice is able to absorb more energy than others with the same allowable stress. For instance, if the σmax is 300 MPa, the values of WV for FCC-TO, ECC-TO, and VC-TO with ρ ¯ = 0.196 are 64 MJ/m3, 47 MJ/m3, and 80 MJ/m3, respectively.

5. Conclusions

Three types of lattice materials, i.e., FCC, ECC, and VC, have been separately designed based on two different methods: topology optimisation and crystal inspiration. Numerical compression tests have been conducted to comparatively characterise their deformation modes, mechanical properties, and energy absorption capability. The main conclusions and contributions are summarised as follows:
a)
Topology optimisation-guided lattice materials are highly similar to the corresponding crystal-inspired lattice materials, especially at a low relative density. The topology optimisation-guided lattice materials are generally non-uniform in terms of strut thickness and joints shape, while the crystal-inspired cells are uniform.
b)
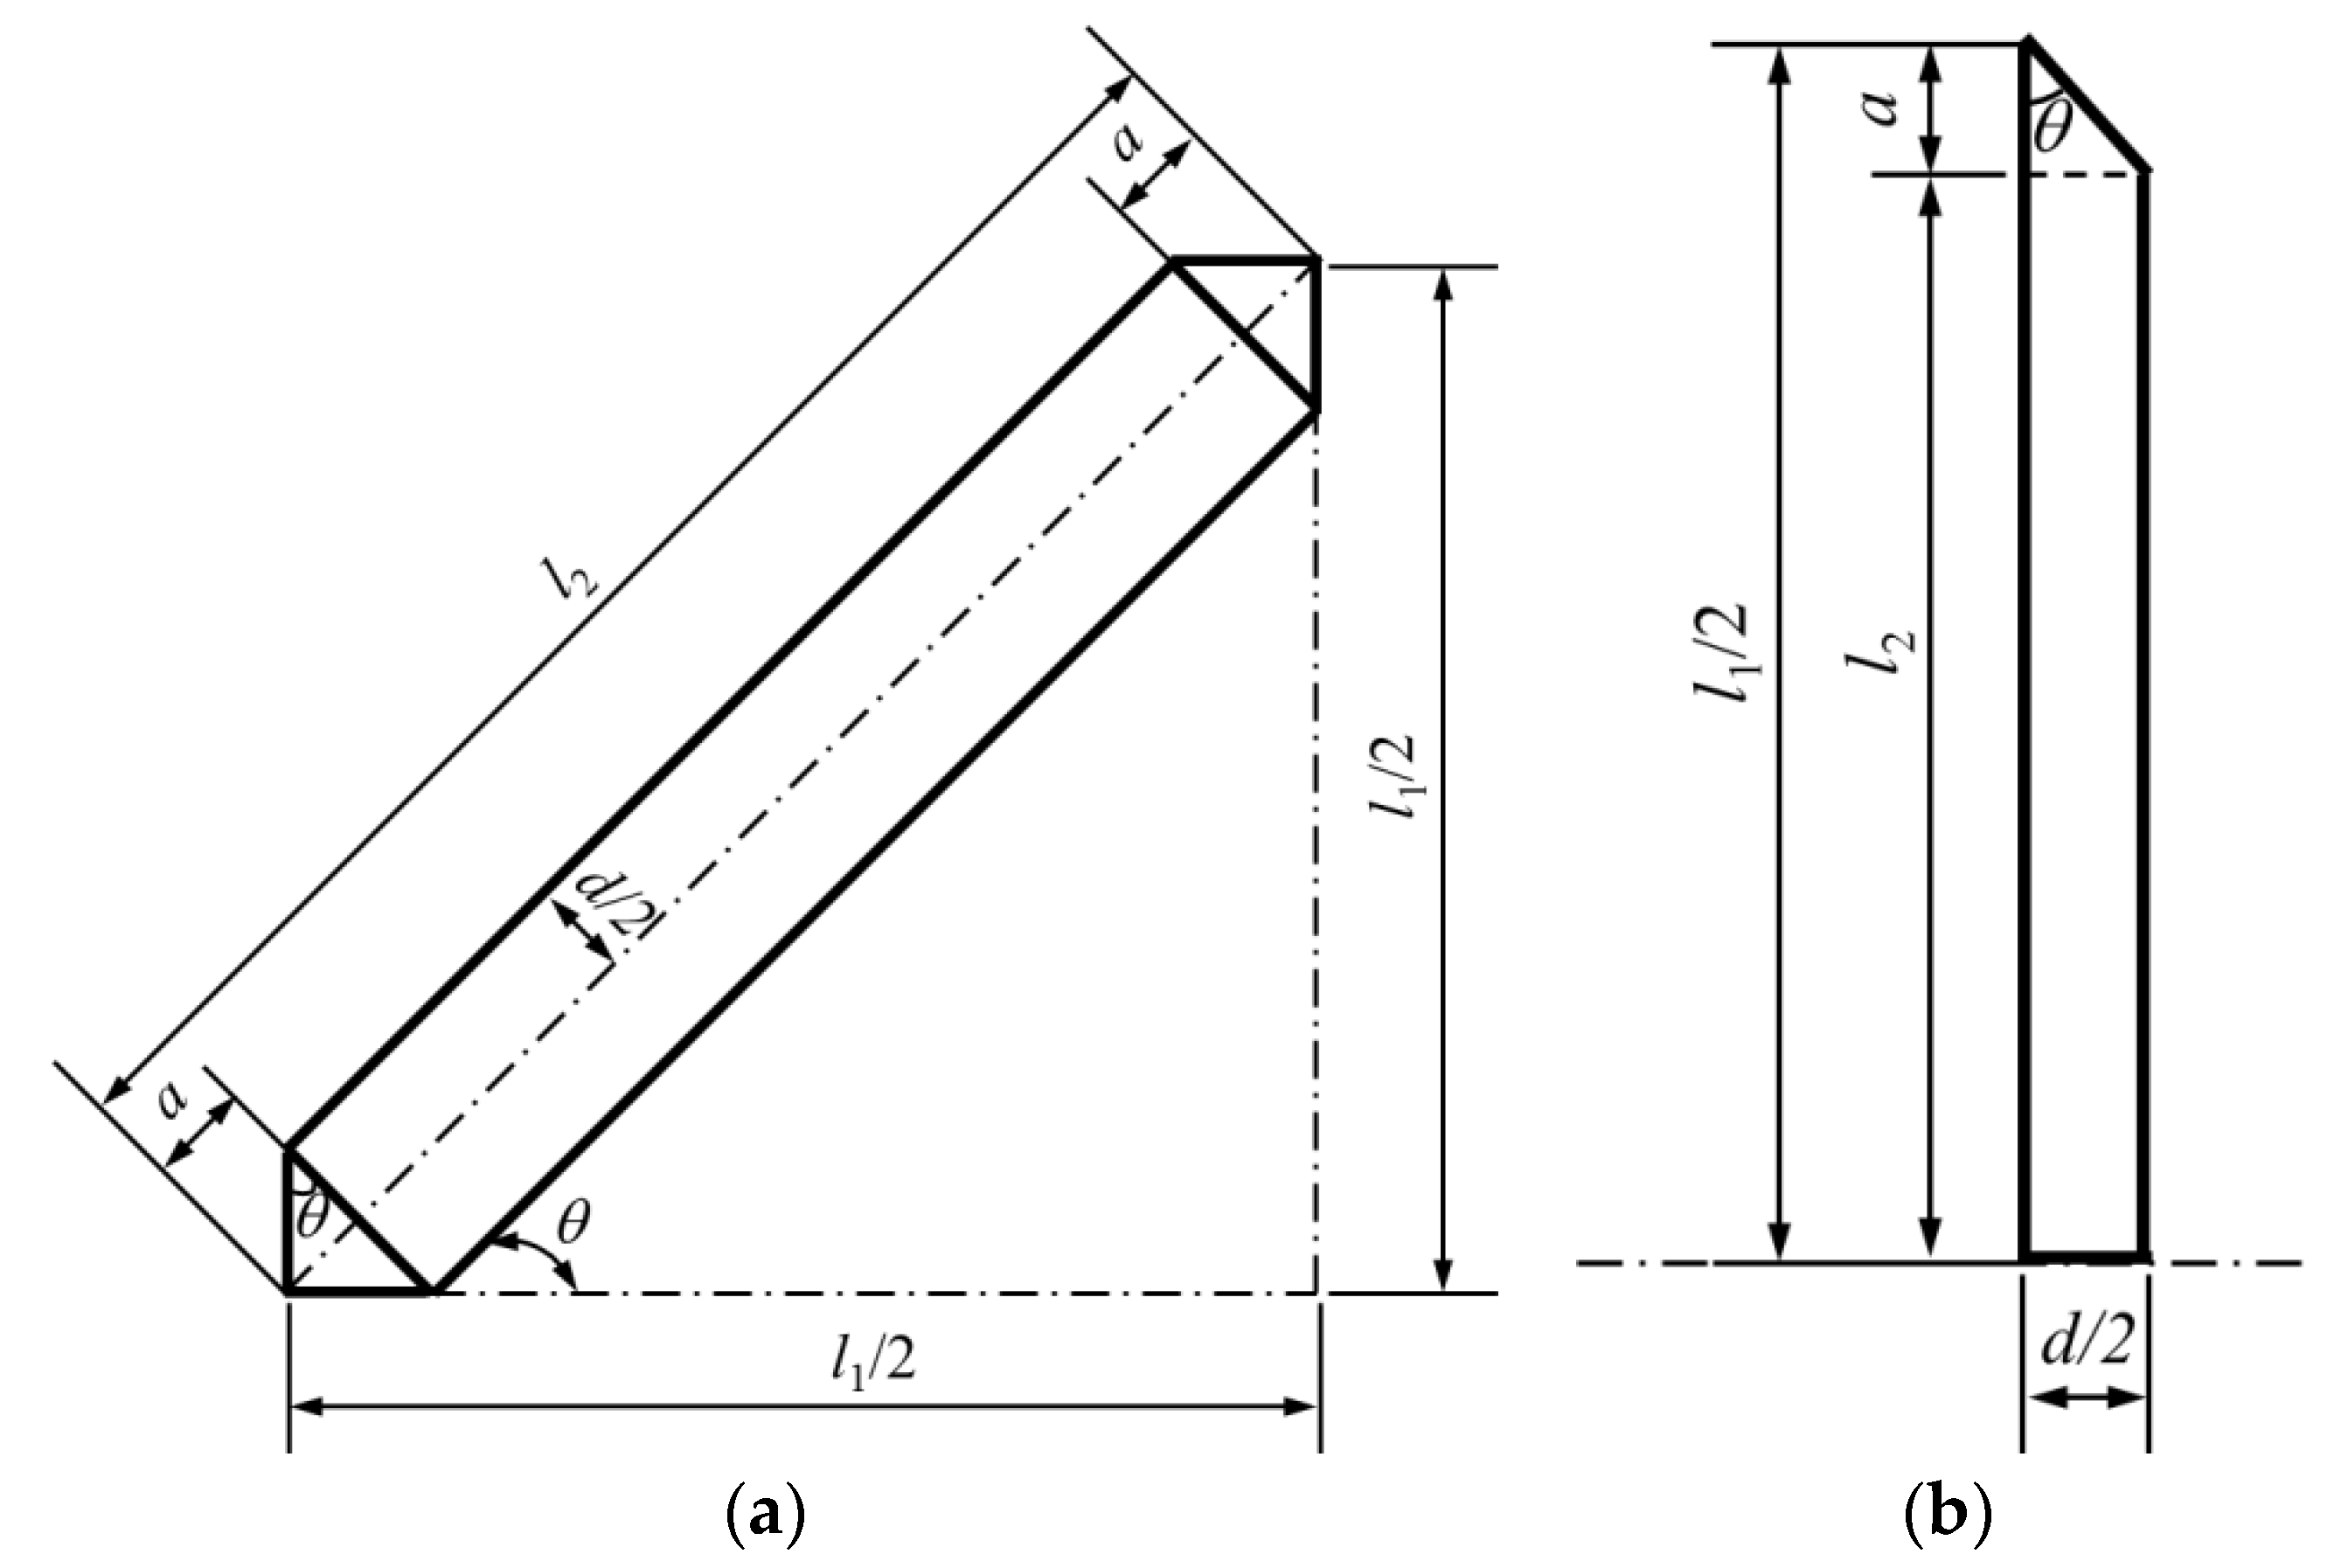
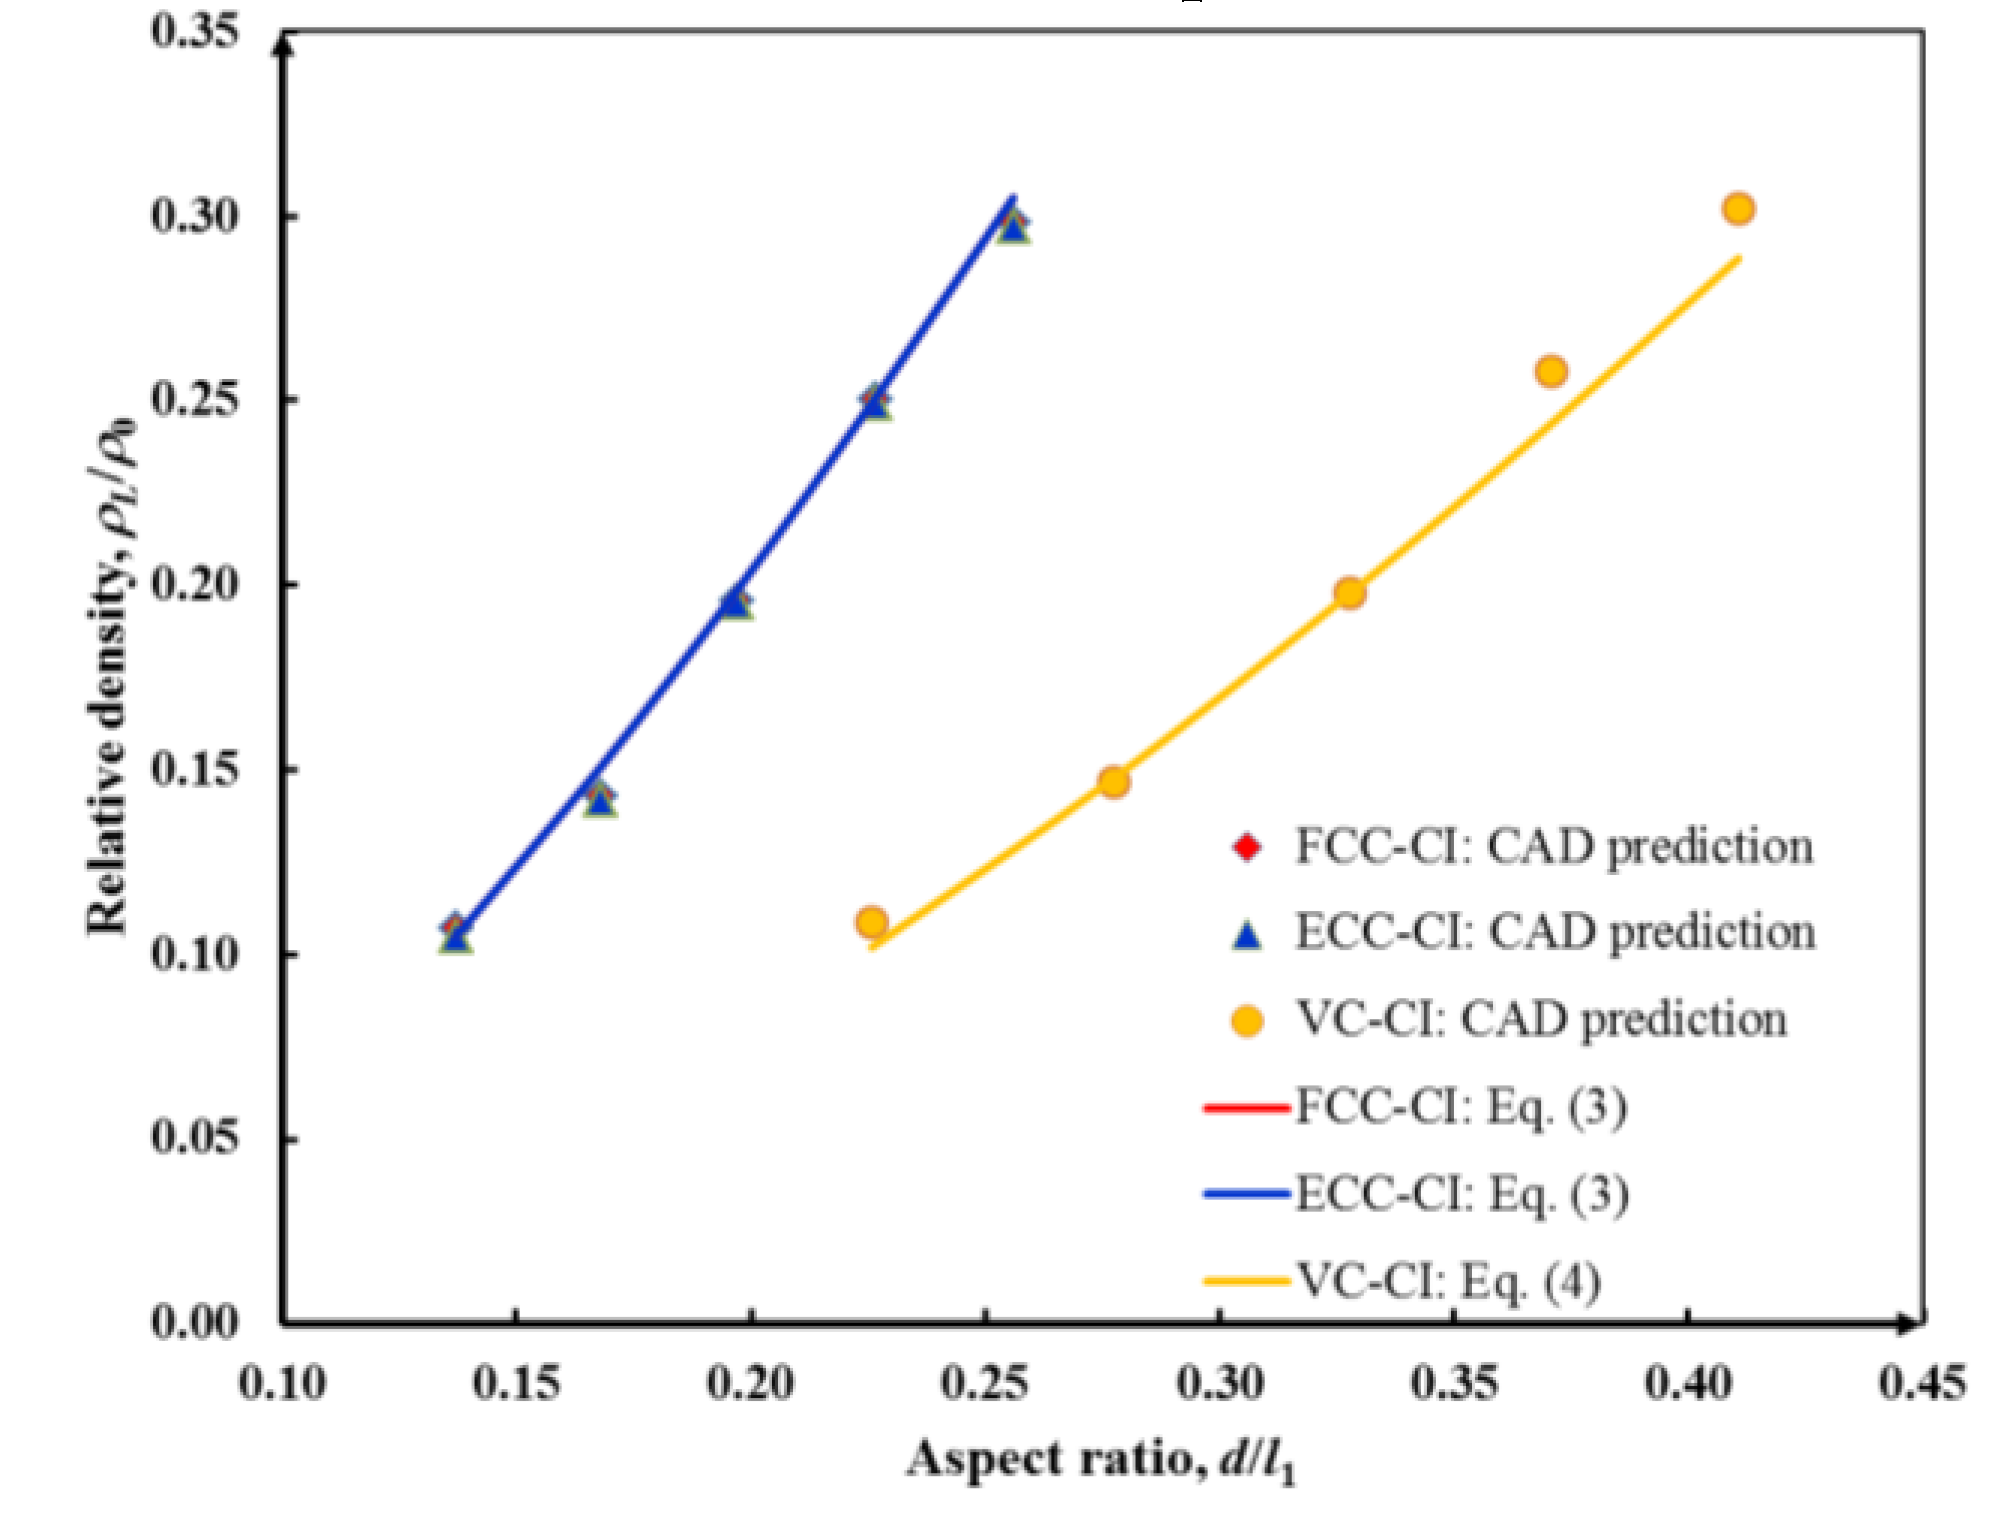
Formulae relating the relative density ( ρ ¯ ) and aspect ratio (d/l1) of crystal-inspired lattices are presented, which has been well validated by CAD predictions.
c)
Comparing the topology-guided and manually generated structures, FCC-TO and ECC-TO exhibit a highly similar bending-dominated deformation mode to FCC-CI and ECC-CI, respectively. However, differences are found between VC-TO and VC-CI lattices. Shear band is observed in VC-CI structures at a low relative density while the VC-TO lattice deforms stably.
d)
In terms of collapse strength and elastic modulus, the VC lattice is stronger than the FCC and ECC lattices because its struts are arranged along the loading direction. On the other hand, topology-generated lattices outperform the corresponding crystal-guided lattices in aspects of toughness and energy absorption per unit volume.

Author Contributions

Conceptualization, C.Y., K.X. and S.X.; methodology, C.Y. and S.X.; software, C.Y. and K.X.; validation, C.Y. and K.X.; formal analysis, C.Y. and S.X; investigation, C.Y., K.X. and S.X.; data curation, C.Y. and K.X.; writing-original draft preparation, C.Y.; writing-review and editing, K.X. and S.X; project administration, S.X.; funding acquisition, S.C.X. All authors have read and agreed to the published version of the manuscript.

Funding

The research was funded by the National Natural Science Foundation of China (No. 51775558) and the Nature Science Foundation for Excellent Youth Scholars of Hunan Province (No. 2019JJ30034).

Acknowledgments

The authors are grateful to Ping Xu and Shuguang Yao at CSU for insightful discussion.

Conflicts of Interest

The authors declare no conflict of interest.

References

  1. Xiao, Z.; Yang, Y.; Xiao, R.; Bai, Y.; Song, C.; Wang, D. Evaluation of topology-optimized lattice structures manufactured via selective laser melting. Mater. Des. 2018, 143, 27–37. [Google Scholar] [CrossRef]
  2. Mei, H.; Zhao, R.; Xia, Y.; Du, J.; Wang, X.; Cheng, L. Ultrahigh strength printed ceramic lattices. J. Alloys Compd. 2019, 797, 786–796. [Google Scholar] [CrossRef]
  3. Kadic, M.; Milton, G.; van Hecke, M.; Wegener, M. 3D metamaterials. Nat. Rev. Phys. 2019, 1, 198–210. [Google Scholar] [CrossRef]
  4. Peng, C.; Tran, P.; Nguyen-Xuan, H.; Ferreira, A.J.M. Mechanical performance and fatigue life prediction of lattice structures: Parametric computational approach. Compos. Struct. 2020, 235, 111821. [Google Scholar] [CrossRef]
  5. Helou, M.; Kara, S. Design, analysis and manufacturing of lattice structures: An overview. Int. J. Comput. Integr. Manuf. 2017, 31, 243–261. [Google Scholar] [CrossRef]
  6. Daynes, S.; Feih, S.; Lu, W.; Wei, J. Design concepts for generating optimised lattice structures aligned with strain trajectories. Comput. Methods Appl. Mech. Eng. 2019, 354, 689–705. [Google Scholar] [CrossRef]
  7. Hazeli, K.; Babamiri, B.; Indeck, J.; Minor, A.; Askari, H. Microstructure-topology relationship effects on the quasi-static and dynamic behavior of additively manufactured lattice structures. Mater. Des. 2019, 176, 107826. [Google Scholar] [CrossRef]
  8. Alaña, M.; Lopez-Arancibia, A.; Pradera-Mallabiabarrena, A.; Ruiz de Galarreta, S. Analytical model of the elastic behavior of a modified face-centered cubic lattice structure. J. Mech. Behav. Biomed. Mater. 2019, 98, 357–368. [Google Scholar] [CrossRef]
  9. Leary, M.; Mazur, M.; Elambasseril, J.; McMillan, M.; Chirent, T.; Sun, Y.; Qian, M.; Easton, M.; Brandt, M. Selective laser melting (SLM) of AlSi12Mg lattice structures. Mater. Des. 2016, 98, 344–357. [Google Scholar] [CrossRef]
  10. Sienkiewicz, J.; Płatek, P.; Jiang, F.; Sun, X.; Rusinek, A. Investigations on the Mechanical Response of Gradient Lattice Structures Manufactured via SLM. Metals 2020, 10, 213. [Google Scholar] [CrossRef] [Green Version]
  11. Gautam, R.; Idapalapati, S. Compressive Properties of Additively Manufactured Functionally Graded Kagome Lattice Structure. Metals 2019, 9, 517. [Google Scholar] [CrossRef] [Green Version]
  12. Al-Saedi, D.; Masood, S.; Faizan-Ur-Rab, M.; Alomarah, A.; Ponnusamy, P. Mechanical properties and energy absorption capability of functionally graded F2BCC lattice fabricated by SLM. Mater. Des. 2018, 144, 32–44. [Google Scholar] [CrossRef]
  13. Gross, A.; Pantidis, P.; Bertoldi, K.; Gerasimidis, S. Correlation between topology and elastic properties of imperfect truss-lattice materials. J. Mech. Phys. Solids 2019, 124, 577–598. [Google Scholar] [CrossRef]
  14. Deshpande, V.; Fleck, N.; Ashby, M. Effective properties of the octet-truss lattice material. J. Mech. Phys. Solids 2001, 49, 1747–1769. [Google Scholar] [CrossRef] [Green Version]
  15. Nguyen, D.S.; Tran, T.T.; Le, D.K.; Le, V.T. Creation of Lattice Structures for Additive Manufacturing in CAD Environment. In Proceedings of the IEEE International Conference on Industrial Engineering and Engineering Management (IEEM), Bangkok, Thailand, 16–19 December 2018; pp. 396–400. [Google Scholar]
  16. Hedayati, R.; Sadighi, M.; Mohammadi-Aghdam, M.; Zadpoor, A. Analytical relationships for the mechanical properties of additively manufactured porous biomaterials based on octahedral unit cells. Appl. Math. Model. 2017, 46, 408–422. [Google Scholar] [CrossRef] [Green Version]
  17. Bonatti, C.; Mohr, D. Mechanical performance of additively-manufactured anisotropic and isotropic smooth shell-lattice materials: Simulations & experiments. J. Mech. Phys. Solids 2019, 122, 1–26. [Google Scholar]
  18. Ling, C.; Cernicchi, A.; Gilchrist, M.; Cardiff, P. Mechanical behaviour of additively-manufactured polymeric octet-truss lattice structures under quasi-static and dynamic compressive loading. Mater. Des. 2019, 162, 106–118. [Google Scholar] [CrossRef]
  19. Lozanovski, B.; Downing, D.; Tran, P.; Shidid, D.; Qian, M.; Choong, P.; Brandt, M.; Leary, M. A Monte Carlo simulation-based approach to realistic modelling of additively manufactured lattice structures. Addit. Manuf. 2020, 32, 101092. [Google Scholar] [CrossRef]
  20. Lozanovski, B.; Leary, M.; Tran, P.; Shidid, D.; Qian, M.; Choong, P.; Brandt, M. Computational modelling of strut defects in SLM manufactured lattice structures. Mater. Des. 2019, 171, 107671. [Google Scholar] [CrossRef]
  21. Peng, C.; Tran, P. Bioinspired functionally graded gyroid sandwich panel subjected to impulsive loadings. Compos. Part B Eng. 2020, 188, 107773. [Google Scholar] [CrossRef]
  22. Tran, P.; Peng, C. Triply periodic minimal surfaces sandwich structures subjected to shock impact. J. Sandw. Struct. Mater. 2020, 1–30. [Google Scholar] [CrossRef]
  23. Bai, L.; Zhang, J.; Chen, X.; Yi, C.; Chen, R.; Zhang, Z. Configuration optimization design of Ti6Al4V lattice structure formed by SLM. Materials 2018, 11, 1856. [Google Scholar] [CrossRef] [PubMed] [Green Version]
  24. Hu, Z.; Gadipudi, V.; Salem, D. Topology Optimization of Lightweight Lattice Structural Composites Inspired by Cuttlefish Bone. Appl. Compos. Mater. 2018, 26, 15–27. [Google Scholar] [CrossRef]
  25. Chiandussi, G. On the solution of a minimum compliance topology optimisation problem by optimality criteria without a priori volume constraint specification. Comput. Mech. 2005, 38, 77–99. [Google Scholar] [CrossRef]
  26. Zhang, W.; Li, D.; Kang, P.; Guo, X.; Youn, S.-K. Explicit topology optimization using IGA-based moving morphable void (MMV) approach. Comput. Methods Appl. Mech. Eng. 2020, 360, 112685. [Google Scholar] [CrossRef]
  27. Bendsoe, M.P.; Sigmund, O. Topology Optimization: Theory, Methods, and Applications, 2nd ed.; Springer Science & Business Media: Berlin, Germany, 2004. [Google Scholar]
  28. Sigmund, O.; Maute, K. Topology optimization approaches. Struct. Multidiscip. Optim. 2013, 48, 1031–1055. [Google Scholar] [CrossRef]
  29. Kentli, A. Topology optimization applications on engineering structures. In Truss and Frames-Recent Advances and New Perspectives; IntechOpen: London, UK, 2019. [Google Scholar]
  30. Zhang, X.; Ramos, A.S.; Paulino, G.H. Material nonlinear topology optimization using the ground structure method with a discrete filtering scheme. Struct. Multidiscip. Optim. 2017, 55, 2045–2072. [Google Scholar] [CrossRef]
  31. Costa, G.; Montemurro, M.; Pailhès, J. A 2D topology optimisation algorithm in NURBS framework with geometric constraints. Int. J. Mech. Mater. Des. 2018, 14, 669–696. [Google Scholar] [CrossRef] [Green Version]
  32. Costa, G.; Montemurro, M.; Pailhès, J. Minimum length scale control in a NURBS-based SIMP method. Comput. Methods Appl. Mech. Eng. 2019, 354, 963–989. [Google Scholar] [CrossRef]
  33. Costa, G.; Montemurro, M.; Pailhès, J. NURBS hyper-surfaces for 3D topology optimization problems. Mech. Adv. Mater. Struct. 2019, 1582826, 1–20. [Google Scholar] [CrossRef]
  34. Lazarov, B.S.; Wang, F.; Sigmund, O. Length scale and manufacturability in density-based topology optimization. Arch. Appl. Mech. 2016, 86, 189–218. [Google Scholar] [CrossRef] [Green Version]
  35. Geoffroy-Donders, P.; Allaire, G.; Pantz, O. 3-d topology optimization of modulated and oriented periodic microstructures by the homogenization method. J. Comput. Phys. 2020, 401, 108994. [Google Scholar] [CrossRef] [Green Version]
  36. Da, D.; Xia, L.; Li, G.; Huang, X. Evolutionary topology optimization of continuum structures with smooth boundary representation. Struct. Multidiscip. Optim. 2017, 57, 2143–2159. [Google Scholar] [CrossRef]
  37. Allaire, G.; Jouve, F.; Toader, A.-M. Structural optimization using sensitivity analysis and a level-set method. J. Comput. Phys. 2004, 194, 363–393. [Google Scholar] [CrossRef] [Green Version]
  38. Yamada, T.; Izui, K.; Nishiwaki, S.; Takezawa, A. A topology optimization method based on the level set method incorporating a fictitious interface energy. Comput. Methods Appl. Mech. Eng. 2010, 199, 2876–2891. [Google Scholar] [CrossRef] [Green Version]
  39. Afrousheh, M.; Marzbanrad, J.; Göhlich, D. Topology optimization of energy absorbers under crashworthiness using modified hybrid cellular automata (MHCA) algorithm. Struct. Multidiscip. Optim. 2019, 60, 1021–1034. [Google Scholar] [CrossRef]
  40. Yang, C.; Xu, P.; Xie, S.; Yao, S. Mechanical performances of four lattice materials guided by topology optimisation. Scr. Mater. 2020, 178, 339–345. [Google Scholar] [CrossRef]
  41. Yang, C.; Xu, P.; Yao, S.; Xie, S.; Li, Q.; Peng, Y. Optimization of honeycomb strength assignment for a composite energy-absorbing structure. Thin-Walled Struct. 2018, 127, 741–755. [Google Scholar] [CrossRef]
  42. Tovar, A. Bone Remodelling as a Hybrid Cellular Automaton Optimization Process. Ph.D. Thesis, University of Notre Dame, Cotabato City, Philippines, 2004. [Google Scholar]
  43. LS-TaSC™. Theory Manual (Version 4.0) of Topology and Shape Computations; Livermore Software Technology Corporation: Livermore, CA, USA, 2018. [Google Scholar]
  44. Tro, N.J. Chemistry: A Molecular Approach, 2nd ed.; Prentice Hall: Upper Saddle River, NJ, USA, 2010. [Google Scholar]
  45. Yuan, S.; Chua, C.; Zhou, K. 3D-Printed Mechanical Metamaterials with High Energy Absorption. Adv. Mater. Technol. 2019, 4, 1800419. [Google Scholar] [CrossRef]
  46. Montemayor, L.; Greer, J. Mechanical Response of Hollow Metallic Nanolattices: Combining Structural and Material Size Effects. J. Appl. Mech. 2015, 82, 071012. [Google Scholar] [CrossRef] [Green Version]
  47. Maskery, I.; Aremu, A.O.; Parry, L.; Wildman, R.D.; Tuck, C.J.; Ashcroft, I.A. Effective design and simulation of surface-based lattice structures featuring volume fraction and cell type grading. Mater. Des. 2018, 155, 220–232. [Google Scholar] [CrossRef]
  48. Ls-dyna. Keyword User’s Manual Volume I (Version 971 R8.0); Livermore Software Technology Corporation: Livermore, CA, USA, 2015. [Google Scholar]
  49. Zhang, L.; Feih, S.; Daynes, S.; Chang, S.; Wang, M.; Wei, J.; Lu, W. Energy absorption characteristics of metallic triply periodic minimal surface sheet structures under compressive loading. Addit. Manuf. 2018, 23, 505–515. [Google Scholar] [CrossRef]
  50. Al-Ketan, O.; Rowshan, R.; Abu Al-Rub, R. Topology-mechanical property relationship of 3D printed strut, skeletal, and sheet based periodic metallic cellular materials. Addit. Manuf. 2018, 19, 167–183. [Google Scholar] [CrossRef]
  51. Liu, Y.; Li, S.; Zhang, L.; Hao, Y.; Sercombe, T. Early plastic deformation behaviour and energy absorption in porous β-type biomedical titanium produced by selective laser melting. Scr. Mater. 2018, 153, 99–103. [Google Scholar] [CrossRef]
  52. Sun, Y.; Li, Q.M. Dynamic compressive behaviour of cellular materials: A review of phenomenon, mechanism and modelling. Int. J. Impact Eng. 2018, 112, 74–115. [Google Scholar] [CrossRef] [Green Version]
  53. Yang, L.; Mertens, R.; Ferrucci, M.; Yan, C.; Shi, Y.; Yang, S. Continuous graded Gyroid cellular structures fabricated by selective laser melting: Design, manufacturing and mechanical properties. Mater. Des. 2019, 162, 394–404. [Google Scholar] [CrossRef]
  54. ISO 13314. Mechanical Testing of Metals-Ductility Testing-Compression Test for Porous and Cellular Metals; International Organization for Standardization: Geneva, Switzerland, 2011. [Google Scholar]
  55. Gibson, L.J.; Ashby, M.F. Cellular Solids: Structure and Properties, 2nd ed.; Cambridge University Press: Cambridge, UK, 1997. [Google Scholar]
  56. Yu, S.; Sun, J.; Bai, J. Investigation of functionally graded TPMS structures fabricated by additive manufacturing. Mater. Des. 2019, 182, 108021. [Google Scholar] [CrossRef]
Figure 1. Schematic illustration of manually designed lattice materials: (a) FCC (face-centre cube); (b) edge-centre cube (ECC); (c) vertex cube (VC).
Metals 10 00491 g001
Figure 2. Individual strut geometries of: (a) FCC and ECC; (b) VC.
Metals 10 00491 g002
Figure 3. Comparison of the relative density predicted by theory and the CAD model.
Metals 10 00491 g003
Figure 4. Finite element model of the FCC-TO with its unit cell enlarged.
Metals 10 00491 g004
Figure 5. (a) Effects of element size on the stress-strain curve of the FCC-TO lattice material; (b) validation of the modelling method by using experimental data reproduced from [49], copyright permission: Elsevier, 2020.
Metals 10 00491 g005
Figure 6. Stress-strain curves of lattice materials generated from two methods with various relative densities: (a) FCC; (b) ECC; (c) VC.
Metals 10 00491 g006
Figure 7. The η ( ε ) ε curves of FCC-TO lattices with various relative densities.
Metals 10 00491 g007
Figure 8. The relationship between the mechanical properties/energy absorption and relative density of lattice materials: (a) normalised collapse strength; (b) normalised elastic modulus; (c) toughness; (d) energy absorption per unit volume.
Metals 10 00491 g008
Figure 9. The energy absorption diagrams of topology-optimised lattice materials.
Metals 10 00491 g009
Table 1. Material properties of the base material, data from [41].
Density, ρ0/(kg·m−3)Young’s Modulus, E0/GPaPoisson’s Ratio, μTangent Modulus, Etan/MPaYield Strength, σy/MPaUltimate Strength σu/MPa
78502060.26517382482
Table 2. Lattice materials with various relative densities generated from topology optimisation and crystal inspiration.
Lattice Material ρ ¯ = 0.10 ρ ¯ = 0.15 ρ ¯ = 0.20 ρ ¯ = 0.25 ρ ¯ = 0.30
FCC-TO
Metals 10 00491 i001
Metals 10 00491 i002 Metals 10 00491 i003 Metals 10 00491 i004 Metals 10 00491 i005 Metals 10 00491 i006
ECC-TO
Metals 10 00491 i007
Metals 10 00491 i008 Metals 10 00491 i009 Metals 10 00491 i010 Metals 10 00491 i011 Metals 10 00491 i012
VC-TO
Metals 10 00491 i013
Metals 10 00491 i014 Metals 10 00491 i015 Metals 10 00491 i016 Metals 10 00491 i017 Metals 10 00491 i018
FCC-CI Metals 10 00491 i019 Metals 10 00491 i020 Metals 10 00491 i021 Metals 10 00491 i022 Metals 10 00491 i023
ECC-CI Metals 10 00491 i024 Metals 10 00491 i025 Metals 10 00491 i026 Metals 10 00491 i027 Metals 10 00491 i028
VC-CI Metals 10 00491 i029 Metals 10 00491 i030 Metals 10 00491 i031 Metals 10 00491 i032 Metals 10 00491 i033
Table 3. Deformation features of lattice materials with ρ ¯ = 0.10 at different compressive strains.
Lattice Materials ε = 0.015 ε = 0.15 ε = 0.35 ε = 0.50
FCC-TO Metals 10 00491 i034 Metals 10 00491 i035 Metals 10 00491 i036 Metals 10 00491 i037
FCC-CI Metals 10 00491 i038 Metals 10 00491 i039 Metals 10 00491 i040 Metals 10 00491 i041
ECC-TO Metals 10 00491 i042 Metals 10 00491 i043 Metals 10 00491 i044 Metals 10 00491 i045
ECC-CI Metals 10 00491 i046 Metals 10 00491 i047 Metals 10 00491 i048 Metals 10 00491 i049
VC-TO Metals 10 00491 i050 Metals 10 00491 i051 Metals 10 00491 i052 Metals 10 00491 i053
VC-CI Metals 10 00491 i054 Metals 10 00491 i055 Metals 10 00491 i056 Metals 10 00491 i057
It should be noted that the stress level related to the colour fringe of each figure in Table 3 and Table 4 varies to have a better visualisation. In general, the blue colour represents the lowest stress level, while the red colour denotes the highest stress level in each figure.
Table 4. Deformation features of lattice materials with ρ ¯ = 0.20 at different compressive strains.
Lattice Materials ε = 0.015 ε = 0.15 ε = 0.35 ε = 0.50
FCC-TO Metals 10 00491 i058 Metals 10 00491 i059 Metals 10 00491 i060 Metals 10 00491 i061
FCC-CI Metals 10 00491 i062 Metals 10 00491 i063 Metals 10 00491 i064 Metals 10 00491 i065
ECC-TO Metals 10 00491 i066 Metals 10 00491 i067 Metals 10 00491 i068 Metals 10 00491 i069
ECC-CI Metals 10 00491 i070 Metals 10 00491 i071 Metals 10 00491 i072 Metals 10 00491 i073
VC-TO Metals 10 00491 i074 Metals 10 00491 i075 Metals 10 00491 i076 Metals 10 00491 i077
VC-CI Metals 10 00491 i078 Metals 10 00491 i079 Metals 10 00491 i080 Metals 10 00491 i081
Table 5. Plateau stress, σpl/[MPa], of the as-designed lattice materials with various relative densities.
Relative   Density ,   ρ ¯ [-]FCC-TOFCC-CIDifferenceECC-TOECC-CIDifferenceVC-TOVC-CIDifference
0.1020.6315.5932.33%11.4310.706.78%32.1928.3613.49%
0.1533.6928.0819.98%18.4521.24−13.13%52.9660.08−11.84%
0.2065.4345.0545.24%36.7634.167.63%90.2693.16−3.12%
0.25110.5369.1359.89%61.0052.6415.89%127.66124.922.19%
0.30156.75100.0956.60%86.6680.377.82%190.38158.4220.18%
Table 6. Values of the parameters of the power laws used in fitting mechanical properties and energy absorption.
Lattice MaterialCollapse Strength, σb [MPa]Elastic Modulus, EL [GPa]Toughness, UT [MJ/m3]Strain Energy, WV [MJ/m3]
C1n1C2n2C3n3C4n4
FCC-TO1.0481.5482.3691.707205.5541.773566.8011.782
ECC-TO1.1651.4822.8071.611154.4561.849354.9511.849
VC-TO1.2421.4533.5121.691147.4021.438884.0251.719
FCC-CI0.8301.4182.1061.705107.5331.502183.8281.241
ECC-CI0.9351.3972.6131.603103.7671.625126.1431.230
VC-CI1.2501.3533.6141.608105.3421.292499.6101.449

