Article

Effect of Stress-Relieving Heat Treatment on the High Strain Rate Dynamic Compressive Properties of Additively Manufactured Ti6Al4V (ELI)

1
Department of Mechanical and Mechatronics Engineering, Central University of Technology, Free State, 20 President Brand St, Bloemfontein Central, Bloemfontein 9301, South Africa
2
Department of Mechanical Engineering, Vaal University of Technology, Andries Potgieter Blvd, Vanderbijlpark 1900, South Africa
*
Author to whom correspondence should be addressed.
Metals 2020, 10(5), 653; https://doi.org/10.3390/met10050653
Submission received: 16 April 2020 / Revised: 8 May 2020 / Accepted: 11 May 2020 / Published: 18 May 2020

Abstract

:
A study was undertaken on the compressive high strain rate properties and deformation behaviour of Direct Metal Laser-Sintered (DMLS) Ti6Al4V (ELI) parts in two separate forms: as-built (AB) and stress relieved (SR). The high strain rate compression tests were carried out using a Split Hopkinson Pressure Bar test system at ambient temperature. The average plastic strain rates attained by the system were 400 s−1 and 700 s−1. Comparative analyses of the performance (flow stresses and fracture strains) of AB and SR specimens were carried out based on the results obtained at these two plastic strain rates. Microstructural analyses were performed to study the failure mechanisms of the deformed specimens and fracture surfaces. Vickers microhardness test values were obtained before and after high strain rate compression testing. The results obtained in both cases showed the strain rate sensitivity of the stress-relieved samples to be higher in comparison to those of as-built ones, at the same value of true strain.

1. Introduction

Direct metal laser sintering (DMLS) is a technology that has been available commercially since 1995. This technology was developed by EOS GmbH of Münich, Germany [1]. In DMLS, material is added one cross-sectional layer at a time to create a three-dimensional object [1]. The process, therefore, makes solid 3D objects of almost any shape from a computer-aided design (CAD) model. The CAD model, which constitutes the part geometry, is created, and, once optimised, is then “sliced numerically” into the layers of thickness at which the additive manufacturing (AM) machine will build it. Next, the file is transferred to the DMLS machine’s software, allowing file-based building to begin. Layers of powder are laid down successively and fused selectively by a laser, with each fused layer corresponding to a particular two-dimensional slice of the CAD file. Through repetition of this process, and by fusing layers onto each other, these successive layers form a shape conforming to the 3D CAD model [2].
Varieties of metal and alloy powders can be used, as long as they conform to the DMLS process in terms of atomised particle size and shape. Some potential materials that have been developed for DMLS include, but are not limited to, aluminium alloys, steels and titanium alloys [3]. However, Ti6Al4V has been the main alloy used in DMLS processes. This is mainly due to its application in the medical and aerospace industries [1,2,3,4]. The alloy offers good characteristics, such as specific strength and ductility, low thermal conductivity and corrosion resistance, making it a preferred alloy for use in the aerospace industry. In airframes, it is used for general structural components such as undercarriages, fuselages, wings and fasteners [3]. Due to its relatively moderate maximum allowable temperature being between 347 °C and 417 °C [5], it is used for the manufacturing of fan blades, fan cases and compressor blades in the intake sections of aircraft turbo-engines [4]. Other applications include biomedical devices and implants, and high-performance automotive engine parts for racing cars [4]. The opportunities for use of AM technologies such as DMLS in the aerospace sector has led to a reduction of the required quantities of raw materials used to produce in-service components, known as the “buy-to-fly” ratio [6].
The use of DMLS-produced Ti6Al4V parts in the aforementioned applications is expected to increase in the near future [7]. Therefore, it will be imperative to determine how such manufactured parts respond under dynamic conditions of loading. Residual stresses and high surface roughness developed during the building process are the major challenges facing the DMLS process [8]. While the residual stresses result from the rapid cooling of the process, the surface roughness of the manufactured parts is due to partially melted or un-melted powder from the surrounding powder bed sticking to the surface. Porosity and generation of microstructures that are different from those of wrought or cast materials are other challenges associated with AM processes. The production of parts that are free of from pores requires precise control of a number of process parameters [9]. Therefore, the material properties of the DMLS parts are often very different from those of cast or wrought material with the same composition. For instance, the yield strengths of cast and wrought Ti6Al4V are 885 MPa and 945 MPa, respectively, whereas a value of 1075 MPa has been reported for DMLS-produced parts [10,11,12]. The higher yield strength value in the DMLS process is attributed to the resulting α’-martensitic microstructure as a result of the rapid cooling rate associated with the process.
The behaviour of conventionally manufactured Ti6Al4V under dynamic loading has been the subject of various studies [13,14,15]. Generally, these studies demonstrated the positive strain rate sensitivity of the Ti6Al4V parts made by conventional manufacturing processes. In the recent past, some studies have attempted to demonstrate the dynamic deformation behaviour of AM Ti6Al4V [16,17]. In their research, Peng et al. [16] paid special attention to both the effects of strain rate as well as temperature on the tensile and compressive plastic flow and fracture characteristics of Ti6Al4V alloy produced via 3D laser deposition technology. The study observed that the flow stress under compressive and tensile loading increased with strain rate. However, the flow characteristics of the material decreased with an increase in temperature under both loading conditions. The authors concluded that compressive fracture occurred as a result of adiabatic shear bands (ASBs) that formed and expanded during deformation for all the test high strain rates. Elsewhere, Mohammadhosseini et al. [17] investigated the dynamic compressive properties of Ti6Al4V alloy produced by electron beam melting (EBM). The study concluded that the strain at fracture was lower in dynamic compared to static compression deformation. Microstructure investigation revealed the presence of ASBs in high strain rate samples. ASBs are narrow zones in which considerable local increases of temperature can be experienced due to the degeneration of part of the mechanical work of high strain rate deformation. The ASBs are usually a precursor to the final ductile or brittle fracture as a result of voids and small cracks growing and coalescing within them [18,19].
In a manner similar to convectional manufacturing processes, parts produced by various AM processes may not necessarily show similar mechanical properties and behaviour, due to the differences of processing parameters, as well the variability in individual processes. A comparative study indicated that the tensile strength of DMLS Ti6Al4V is approximately 30% higher than that of EBM [9]. This is due to the fact that the EBM process results in an α + β microstructure, whereas the DMLS process results in an α′ phase, which has a comparatively higher yield strength [11]. The layer-by-layer building process of metal powder in the DMLS process with non-optimal parameters influences the porosity, whereas rapid cooling influences the formation of the resulting microstructure. Together, these two factors determine the mechanical properties of the part produced.
The DMLS-produced parts are functional and can be used for different applications experiencing wide ranges of strain rate loadings, such as biomedical implants (low strain rate loading), and in high-performance parts, such as in automotive engine, aircraft engine and structural components (high strain rate loading). Table 1 shows the reported values of strain rate reached under various environmental conditions.
Aircraft turbo-engine frontal components are prone to impact by foreign objects, such as what is commonly known as a “bird strike” [25]. Bird strikes may occur during take-off, climb, approach and landing. A typical case that recently occurred in South Africa is that of Mango Airlines Flight JE 147, which had to turn around after one of the aircraft’s turbo-engines was damaged by a bird strike a few minutes after take-off from O.R. Tambo International Airport, Johannesburg [26]. Therefore, it is critical to design structures and components to withstand such eventuality. Data on the response of materials to high strain rates is necessary to analyse problems related to foreign object damage (FOD), and also in modelling and numerical simulation. Fan casings, compressor casings and turbine casings are designed for containment of debris as a result of blade release. In such an event, a loose/broken blade has to be contained within the casing to avoid further damages to other components, such as controls, which may lead to a loss of control of the aircraft, in turn leading to tragic losses or even an unsafe landing.
The aim of the work reported on in this paper was to develop an understanding of the mechanical behaviour of DMLS-fabricated Ti6Al4V (ELI) parts under high strain rate compressive loading using a Split Hopkinson Pressure Bar (SHPB). The two forms of as-built (AB) and stress-relieved (SR) DMLS specimens were used in this testing. Stress relieving was done to reduce the residual stresses developed during fabrication through the DMLS process. The variations of microhardness, stress–strain behaviour and microstructural characteristics of the two forms of alloy under high strain rate compressive loading were studied in this work, and are reported here.

2. Materials and Methods

2.1. Materials

Table 2 shows the chemical composition of the Ti6Al4V (ELI) powder used for the production of specimens for high strain rate tests. The powder complied with the ASTM F3001-14 standard and was supplied by TLS Technik GmbH & Co. Spezialpulver KG (Bitterfeld–Wolfen, Germany).
The Ti6Al4V (ELI) experimental high strain rate compression specimens were built in a DMLS EOSINT M280 system (EOS GmbH, Munich, Germany) with a 200 W ytterbium fibre laser that has a laser diameter of 80 μm. The samples were fabricated with a laser power setting of 175 W, a hatch distance (the distance between two adjacent scan vectors) of 100 μm and a layer thickness of 30 μm. The Ti6Al4V (ELI) powder particle size was an average of ≤40 μm diameter. A back-and-forth raster scanning pattern with shift angle of 67° for each pass was used in the production of the specimens. Argon gas was used as a protective inert atmosphere in the manufacturing process. Thirty-two cylindrical specimens, with a diameter of 6 mm, were fabricated, and half of them were stress relieved in an argon gas atmosphere at 650 °C, with a soaking period of three hours, and then cooled down in this protective atmosphere. These specimens are herein referred to as “stress-relieved (SR) specimens”. The rest of the specimens are herein referred to as “as-built (AB) specimens”. The AB and SR specimens were cut off the base plate by electrical discharge machining (EDM) wire cutting. The cylindrical compression test specimens were made in two sets: one with a height of 10 mm and diameter of 6 mm, and the other with a height of 6 mm and diameter of 6 mm. Sixteen specimens (8 AB and 8 SR specimens) were built for each of the two heights. Two specimens in each category (AB and SR) were used for the calibration of the test equipment. Two different heights of specimens were used during SHPB compression testing in order to attain two different strain rates using the same equipment setting (striker velocity). The specifications of the SHPB test require a height-to-diameter ratio of at most 2, in order to facilitate equilibrium of the dynamic forces during testing [27]. The ends of the specimens were faced off on a lathe machine to ensure that they were flat and parallel within a tolerance of 0.02 mm. The parallel ends of specimens are normally required to ensure best possible contact between the specimen and the pressure bars of the SHPB apparatus during impact loading.

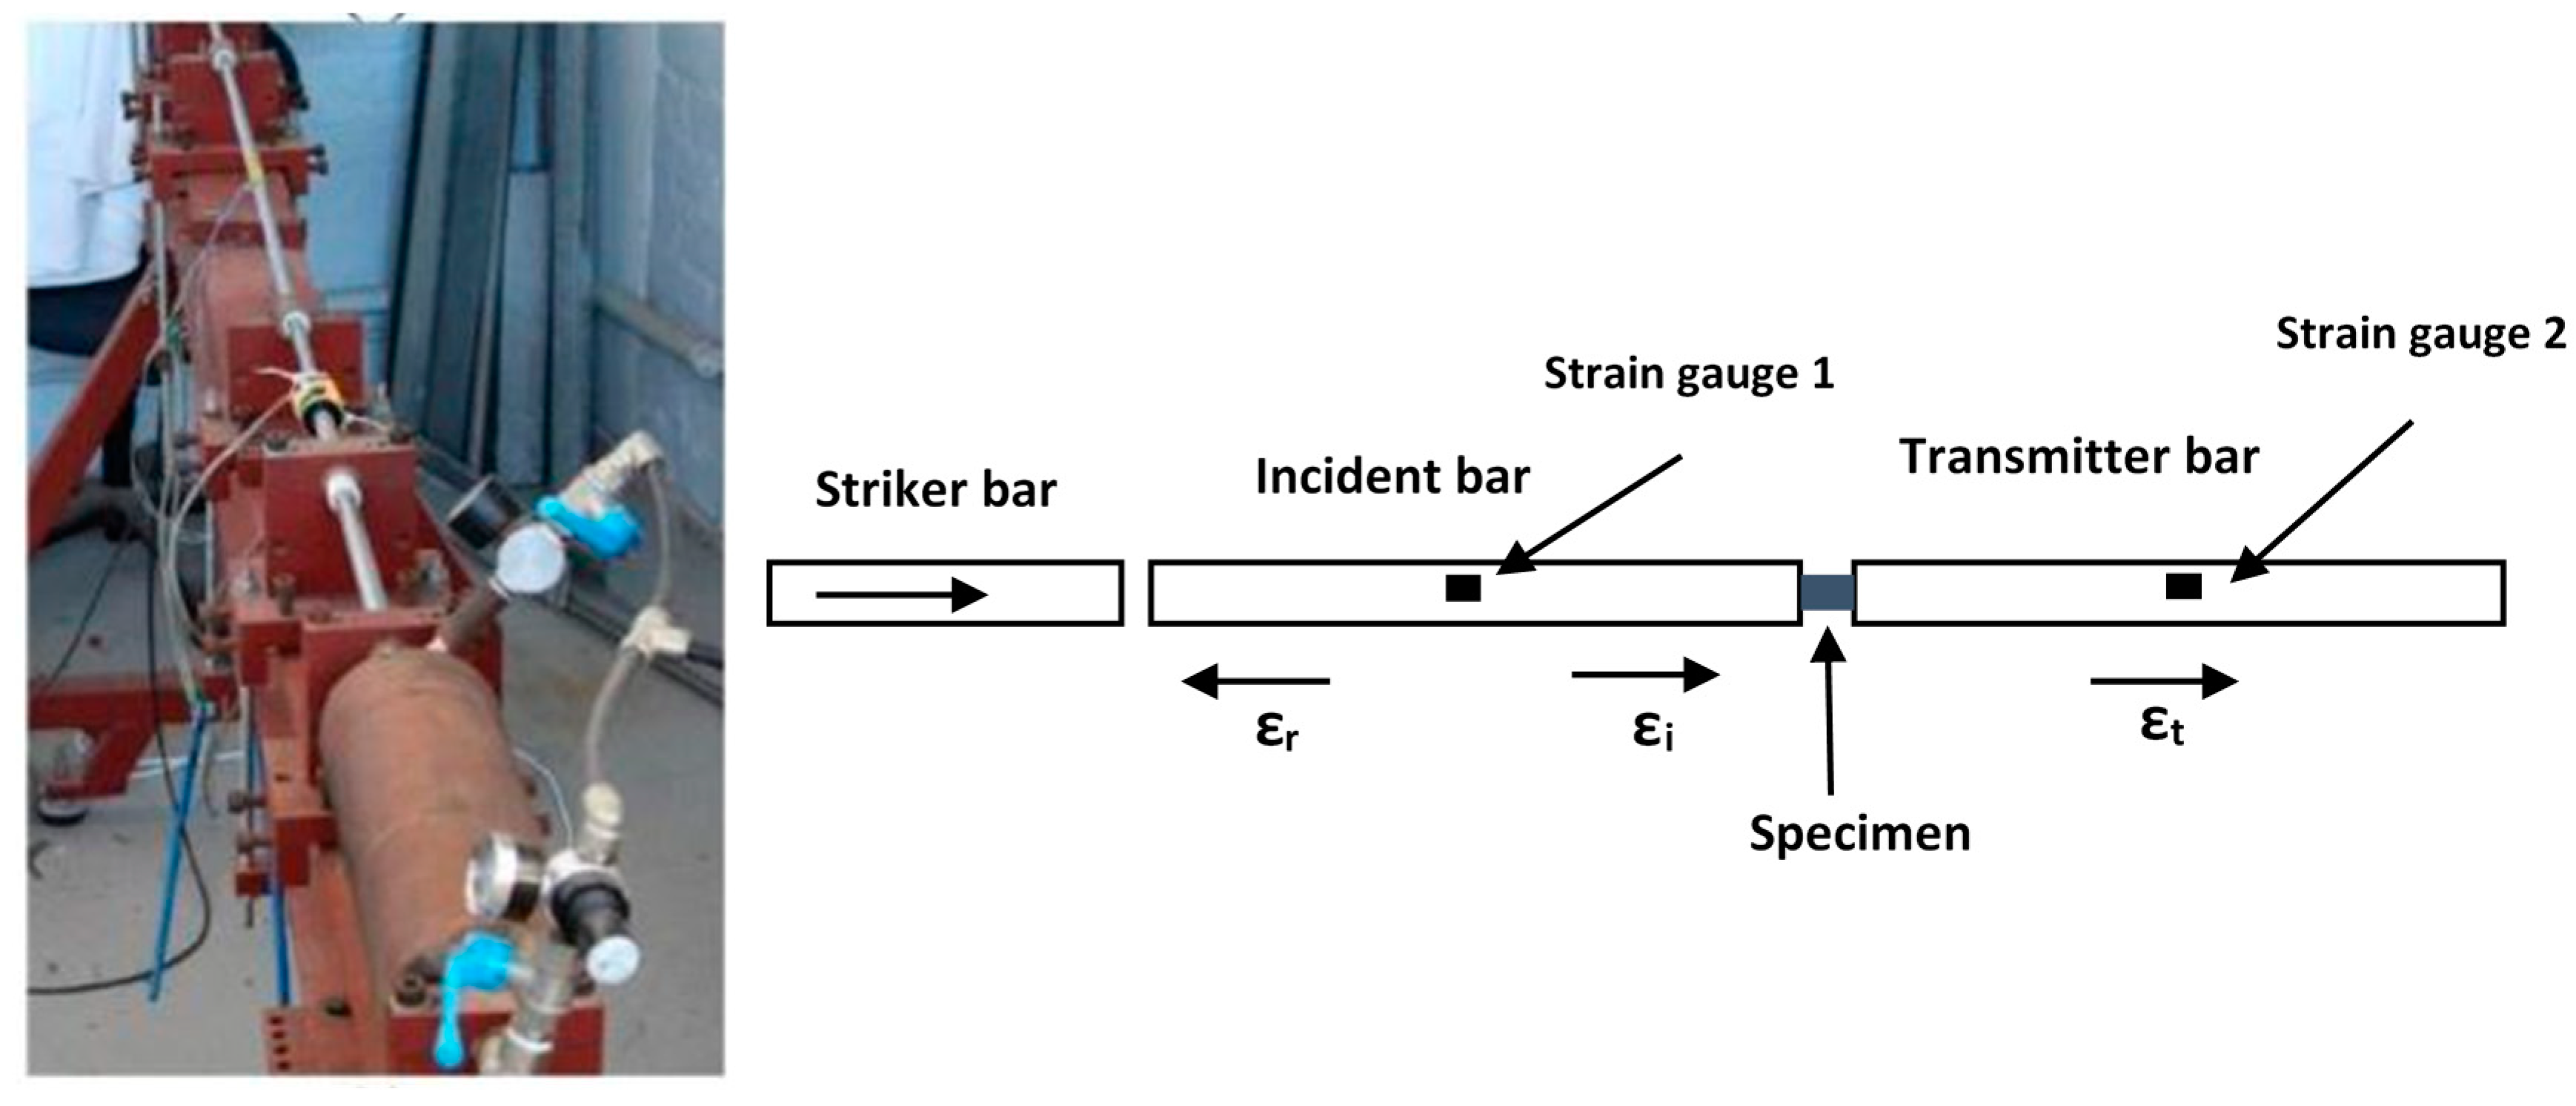
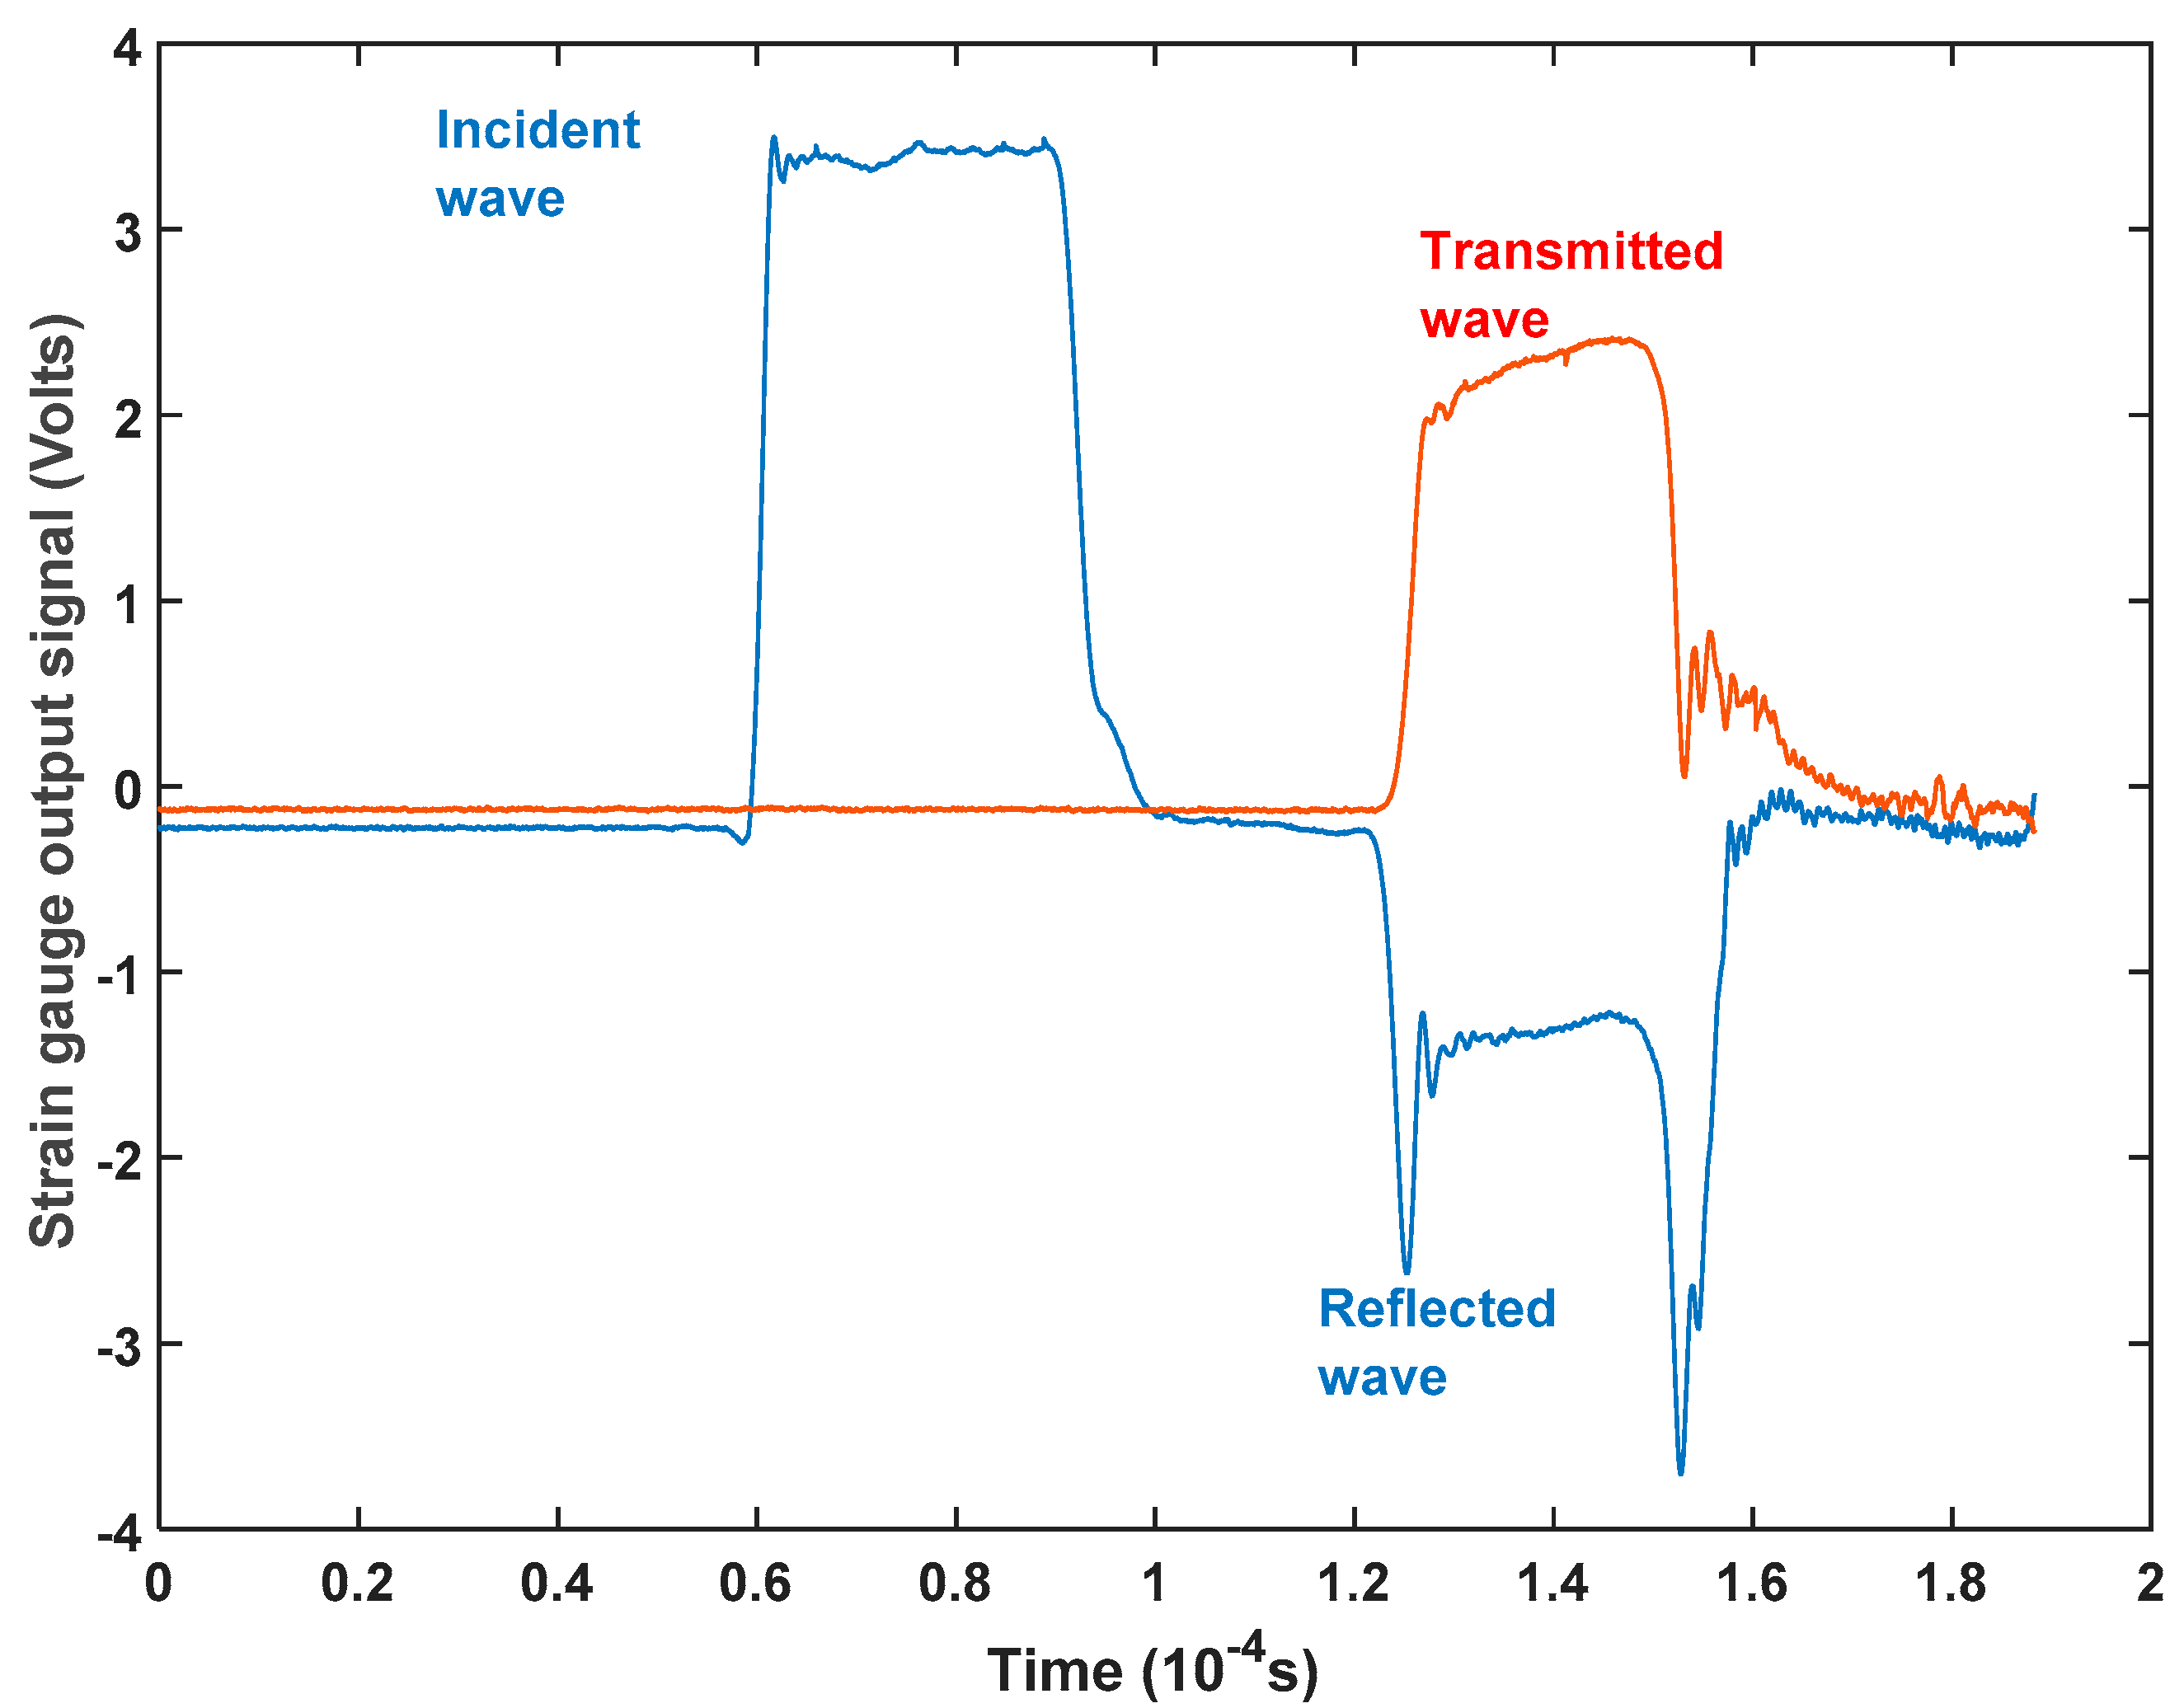
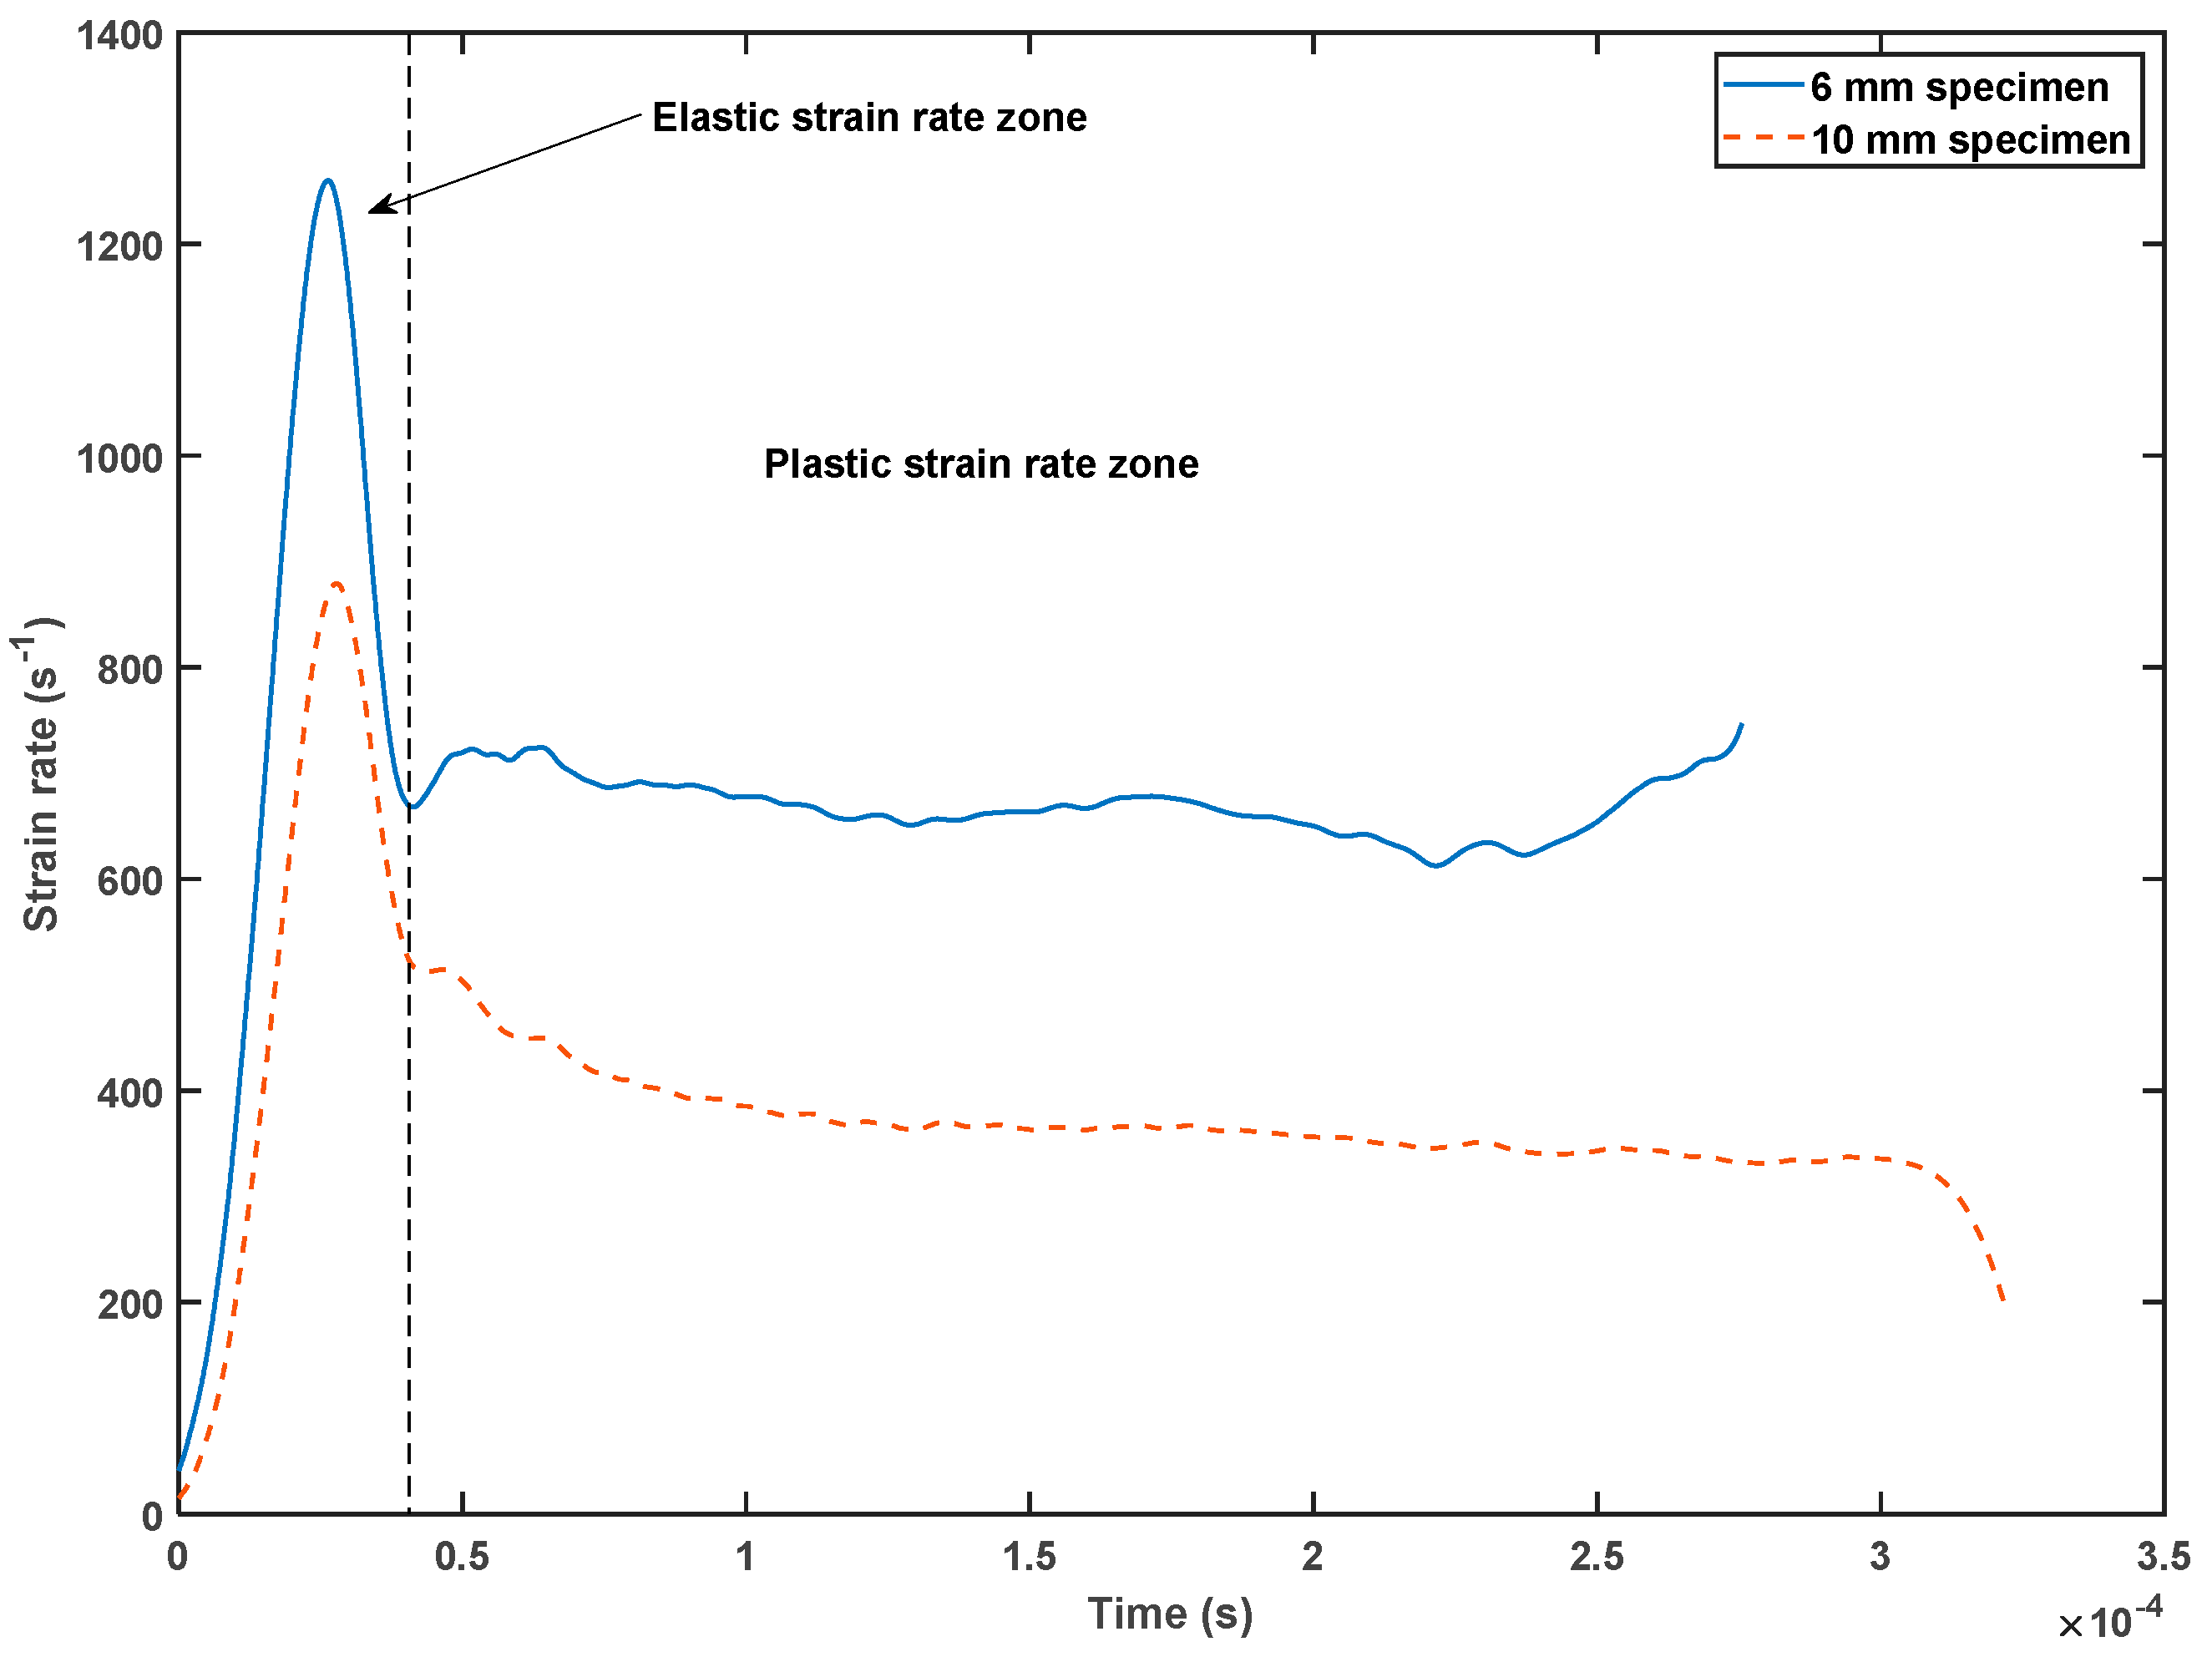
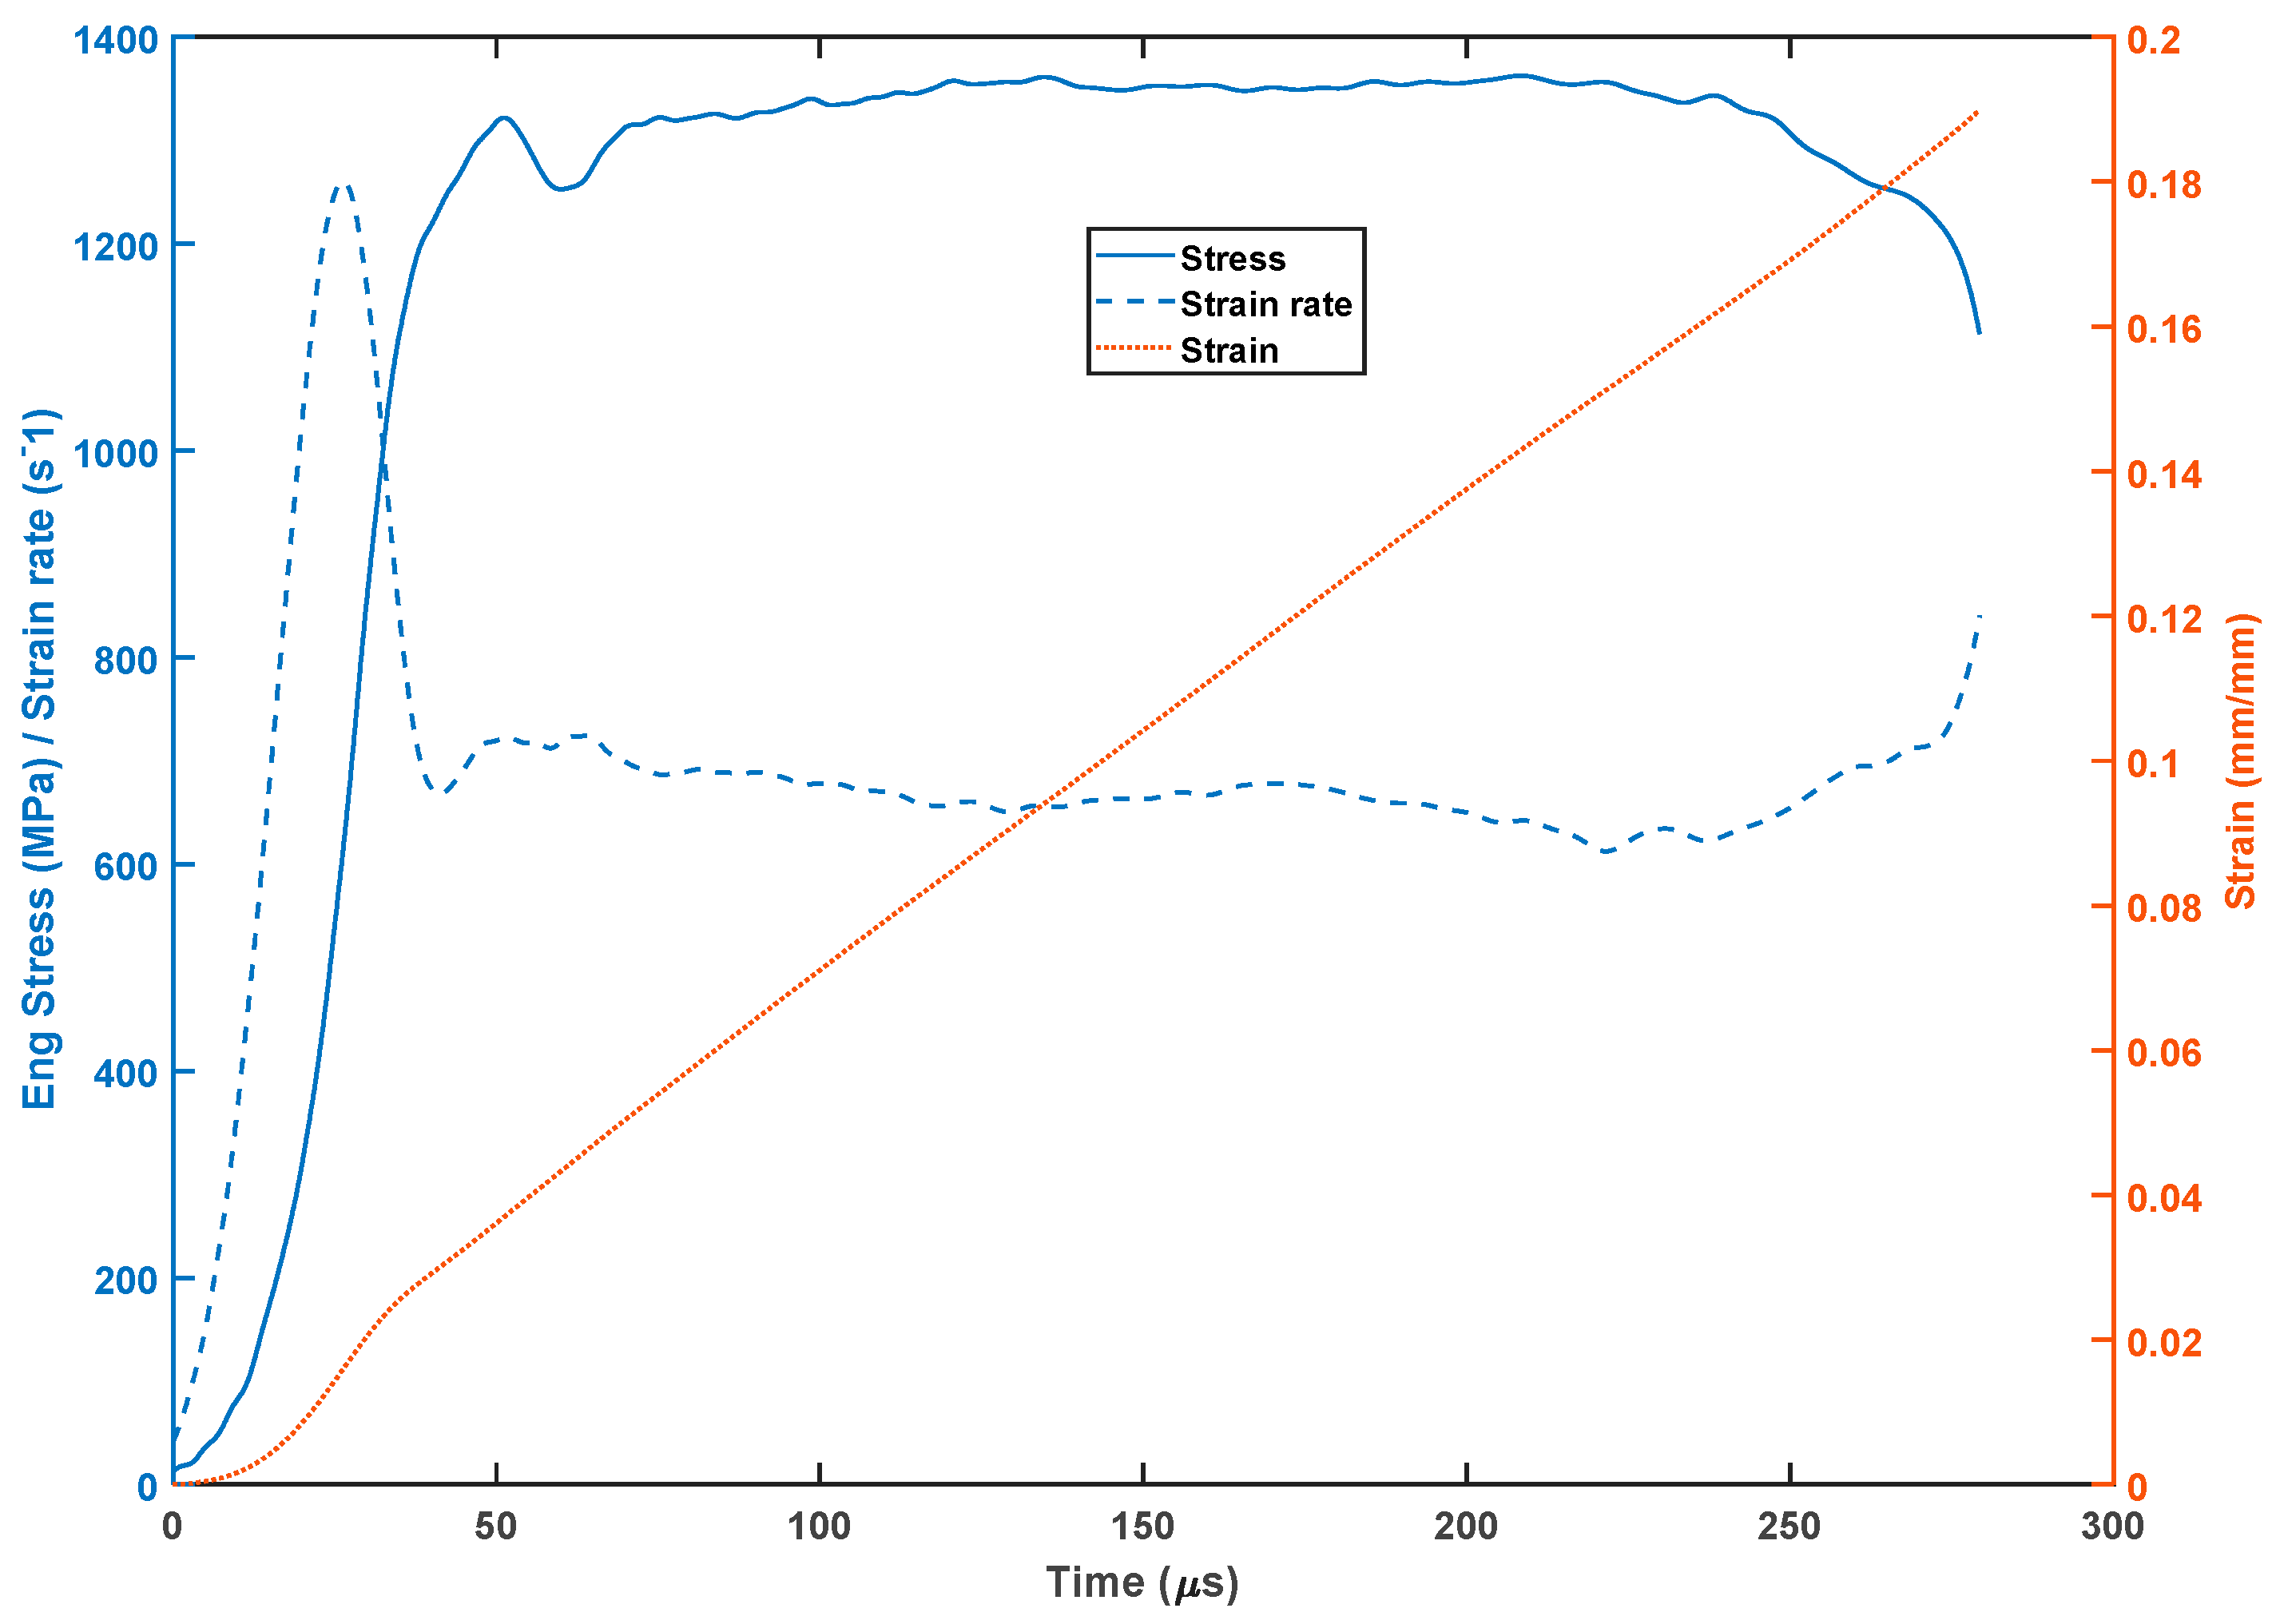
2.2. Dynamic Compression Test

The classical SHPB is used to characterise high strain rate behaviour of materials in compression, tension and shear. The device is capable of attaining strain rates ranging from 102 s−1 to 104 s−1 [28]. Such range of strain rates is sufficient to simulate high-speed crashes and high strain rate impacts. The typical compression SHPB test set-up is as shown in Figure 1. The incident and the transmitter bars were made of high-strength 4340 steel. The incident and transmitter bars were 3000 mm long, with a diameter of 20 mm. The striker bar was 710 mm long, and was fired into the incident bar at velocity of approximately 11 m/s.
Strains in the incident and the transmitter bars were measured with strain gauges in a full Wheatstone bridge configuration. The bridge was constructed from four Micro-Measurement (Raleigh, North Carolina, USA), ED-DY-125AC10C 1000 strain gauges placed at the centre of both the incident and transmitter bars. An excitation voltage of 1.50 V was provided through two Agilent E 2630A power supplies. To reduce the friction and maintain uniaxial compression in the sample, molybdenum disulphide grease was used to lubricate the interface between the bars and the specimen. The changes in resistance on the strain gauge as the striker bar struck the incident bar were converted to proportional changes in voltage, and then amplified, digitally sampled and stored as numerical data. The strain gauge readings in volt were then converted into strain using the Equation (1), where the strain gauge data (resistance, gauge factor and voltage) were known [28].
S t r a i n = V o l t a g e   r e a d i n g   x   G a u g e   r e s i s t a n c e C a l i b r a t e d   v o l t a g e x G a u g e   f a c t o r   ( G a u g e   r e s i s t a n c e + C a l i b r a t e d   r e s i s t a n c e )
Figure 2 shows a typical output signal from the strain gauges on the bars of the SHPB test rig in a typical high strain rate compression test, obtained for DMLS Ti6Al4V (ELI).
It is clear that the time at which the waves start picking up in magnitude is not the same for the transmitted and the reflected wave. The estimated picking up times in Figure 2 for the reflected and the transmitted wave are 0.0001214 s and 0.0001229 s, respectively. The reason for this difference in time between these two waves is that the incident wave is immediately reflected at the incident bar/specimen interface, while the transmitted wave occurs upon the wave travelling through the specimen. The reflected signal ε r (t) was captured from the strain wave of the incident bar, whereas the transmitted strain signal ε t (t) was captured from the strain wave of the transmitter bar for the same time range as the reflected strain wave. These signals were converted into strain using Equation (1), before input into an existing MatLab programme that converts such signal in stress ( σ s ) , strain ( ε s ) and strain rate ( ε ˙ s ) using Equations (2)–(4):
σ s = E A 0 ε t / A s
ε s = 2 C 0 / l s 0 t ε r d t
ε s ˙ = 2 ε r C 0 / l s =   v s 1 v s 2 / l s
where E is the Young’s modulus of the incident and transmitter bars; A 0 and A s are the cross-sectional areas of the bars and the specimen, respectively;   l s is the length of the specimen; and C 0 is the longitudinal wave velocity in the incident and transmitter bars.
Therefore, during the experiment, testing at each strain rate range was repeated seven times, and in all instances the stress and strain data captured were averaged using MatLab codes in order to enhance the credibility of data used. This was to reduce uncertainties that could affect the recorded pulse, leading to spurious results.

2.3. Preparation of Fractured and Cut Surfaces (in the Unfractured Specimens)

In order to study and characterise the deformed surfaces of those specimens that did not fracture after compressive high strain rate testing, they were first sectioned along their respective longitudinal loading axes. The cut was done using EDM wire cutting. Before grinding and polishing of the cut surfaces, the specimens were mounted in conductive Bakelite/Epoxy using a Struers Citopress-1 mounting machine (Cleveland, Ohio, USA). Grinding and polishing of the specimens then followed, and were performed in accordance with the suggested protocol by Struers for titanium alloys. The polished parts were then cleaned individually under tap water, and thereafter dried using a strong stream of compressed air. Metallographic samples were then etched using a solution of Kroll’s reagent, a dilute aqueous solution containing HF and HNO3 that is commonly used for commercial titanium alloys.
The surfaces of those specimens that fractured upon testing were first cleaned with an ultrasonic cleaner for a period of three minutes, using ethanol as the cleaning solvent. The surfaces were then rinsed under running water, before being dried using a strong stream of compressed air. An optical microscope (OM) and a scanning electron microscope (SEM) were used to examine the fracture surfaces and the cut surfaces of the aforementioned loaded DMLS Ti6Al4V (ELI) specimens.
Microhardness testing of the DMLS Ti6Al4V (ELI) wire cut specimens that were exposed to compression high strain rates without fracturing was performed using a Future Tech Vickers hardness tester. A 200 g load, with a dwell time of 10 s, was used, and a minimum of 30 indentations were made on the polished cut surfaces of each sample. The indentations were made approximately 0.5 mm from the edges of the cut surfaces, in both the transverse and longitudinal directions, and a set of indentations were made along the middle in the loading direction, as illustrated in Figure 3. To study the hardness in the regions of critical deformation (adiabatic shear zones), a smaller load of 10 g, with a dwelling time of 10 s, was used. A smaller load was used because the regions were too narrow to accommodate a load of 200 g.

3. Results and Discussion
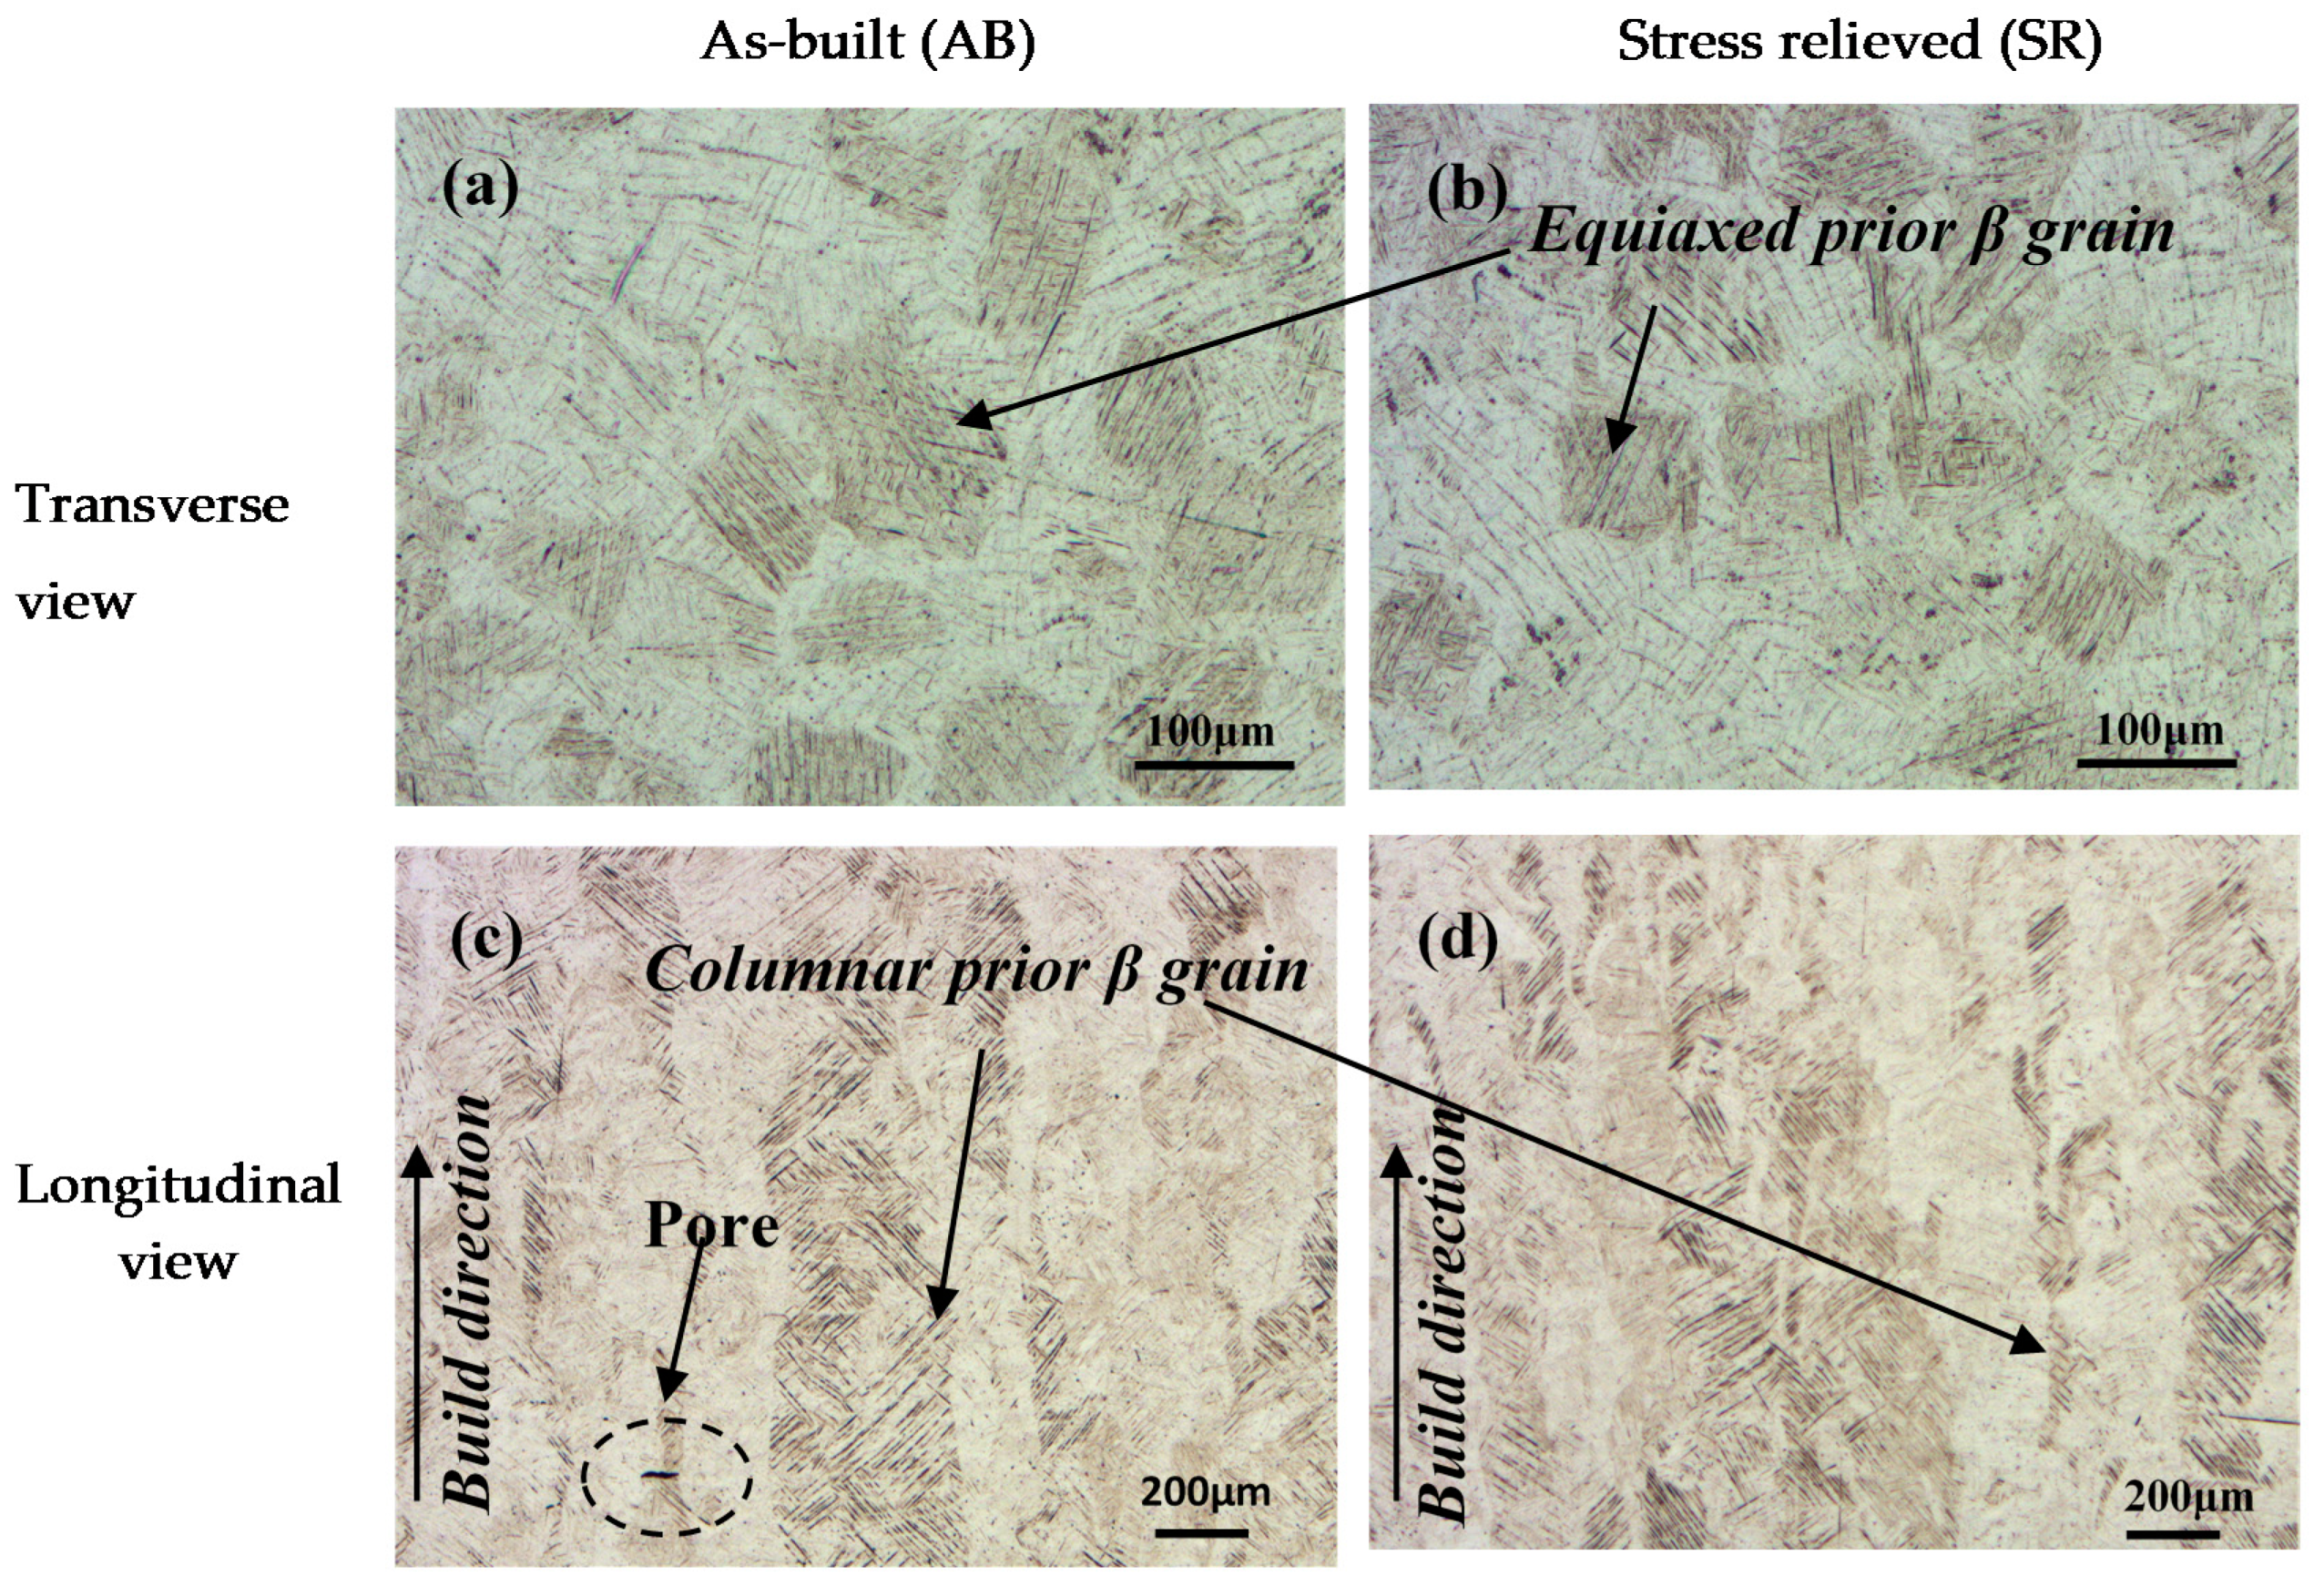
3.1. Microstructure

The optical microstructural observations of the longitudinal sections of the two forms of the alloy shown in Figure 4, revealed prior β-grains elongated approximately parallel to the build direction, before and after stress-relieving heat treatment. An almost equiaxed grain morphology of β-grains on the transverse sections were observed for both the AB- and SR-sectioned samples. The diameters of these grains were approximately 100 μm, which corresponds with the hatch spacing, a DMLS process parameter mentioned in Section 2.1. The interior of the elongated and equiaxed prior β-grains shown in Figure 4 consist of fine acicular-type structures referred to as “α′-martensite”. Previous X-ray diffraction (XRD) and transmission electron microscopy (TEM) analyses of AB and SR specimens by Yadroitsev et al. [30] confirmed them to consist of fine acicular-type structures with no traces of β-grain precipitation, even upon stress-relieving heat treatment for the latter.

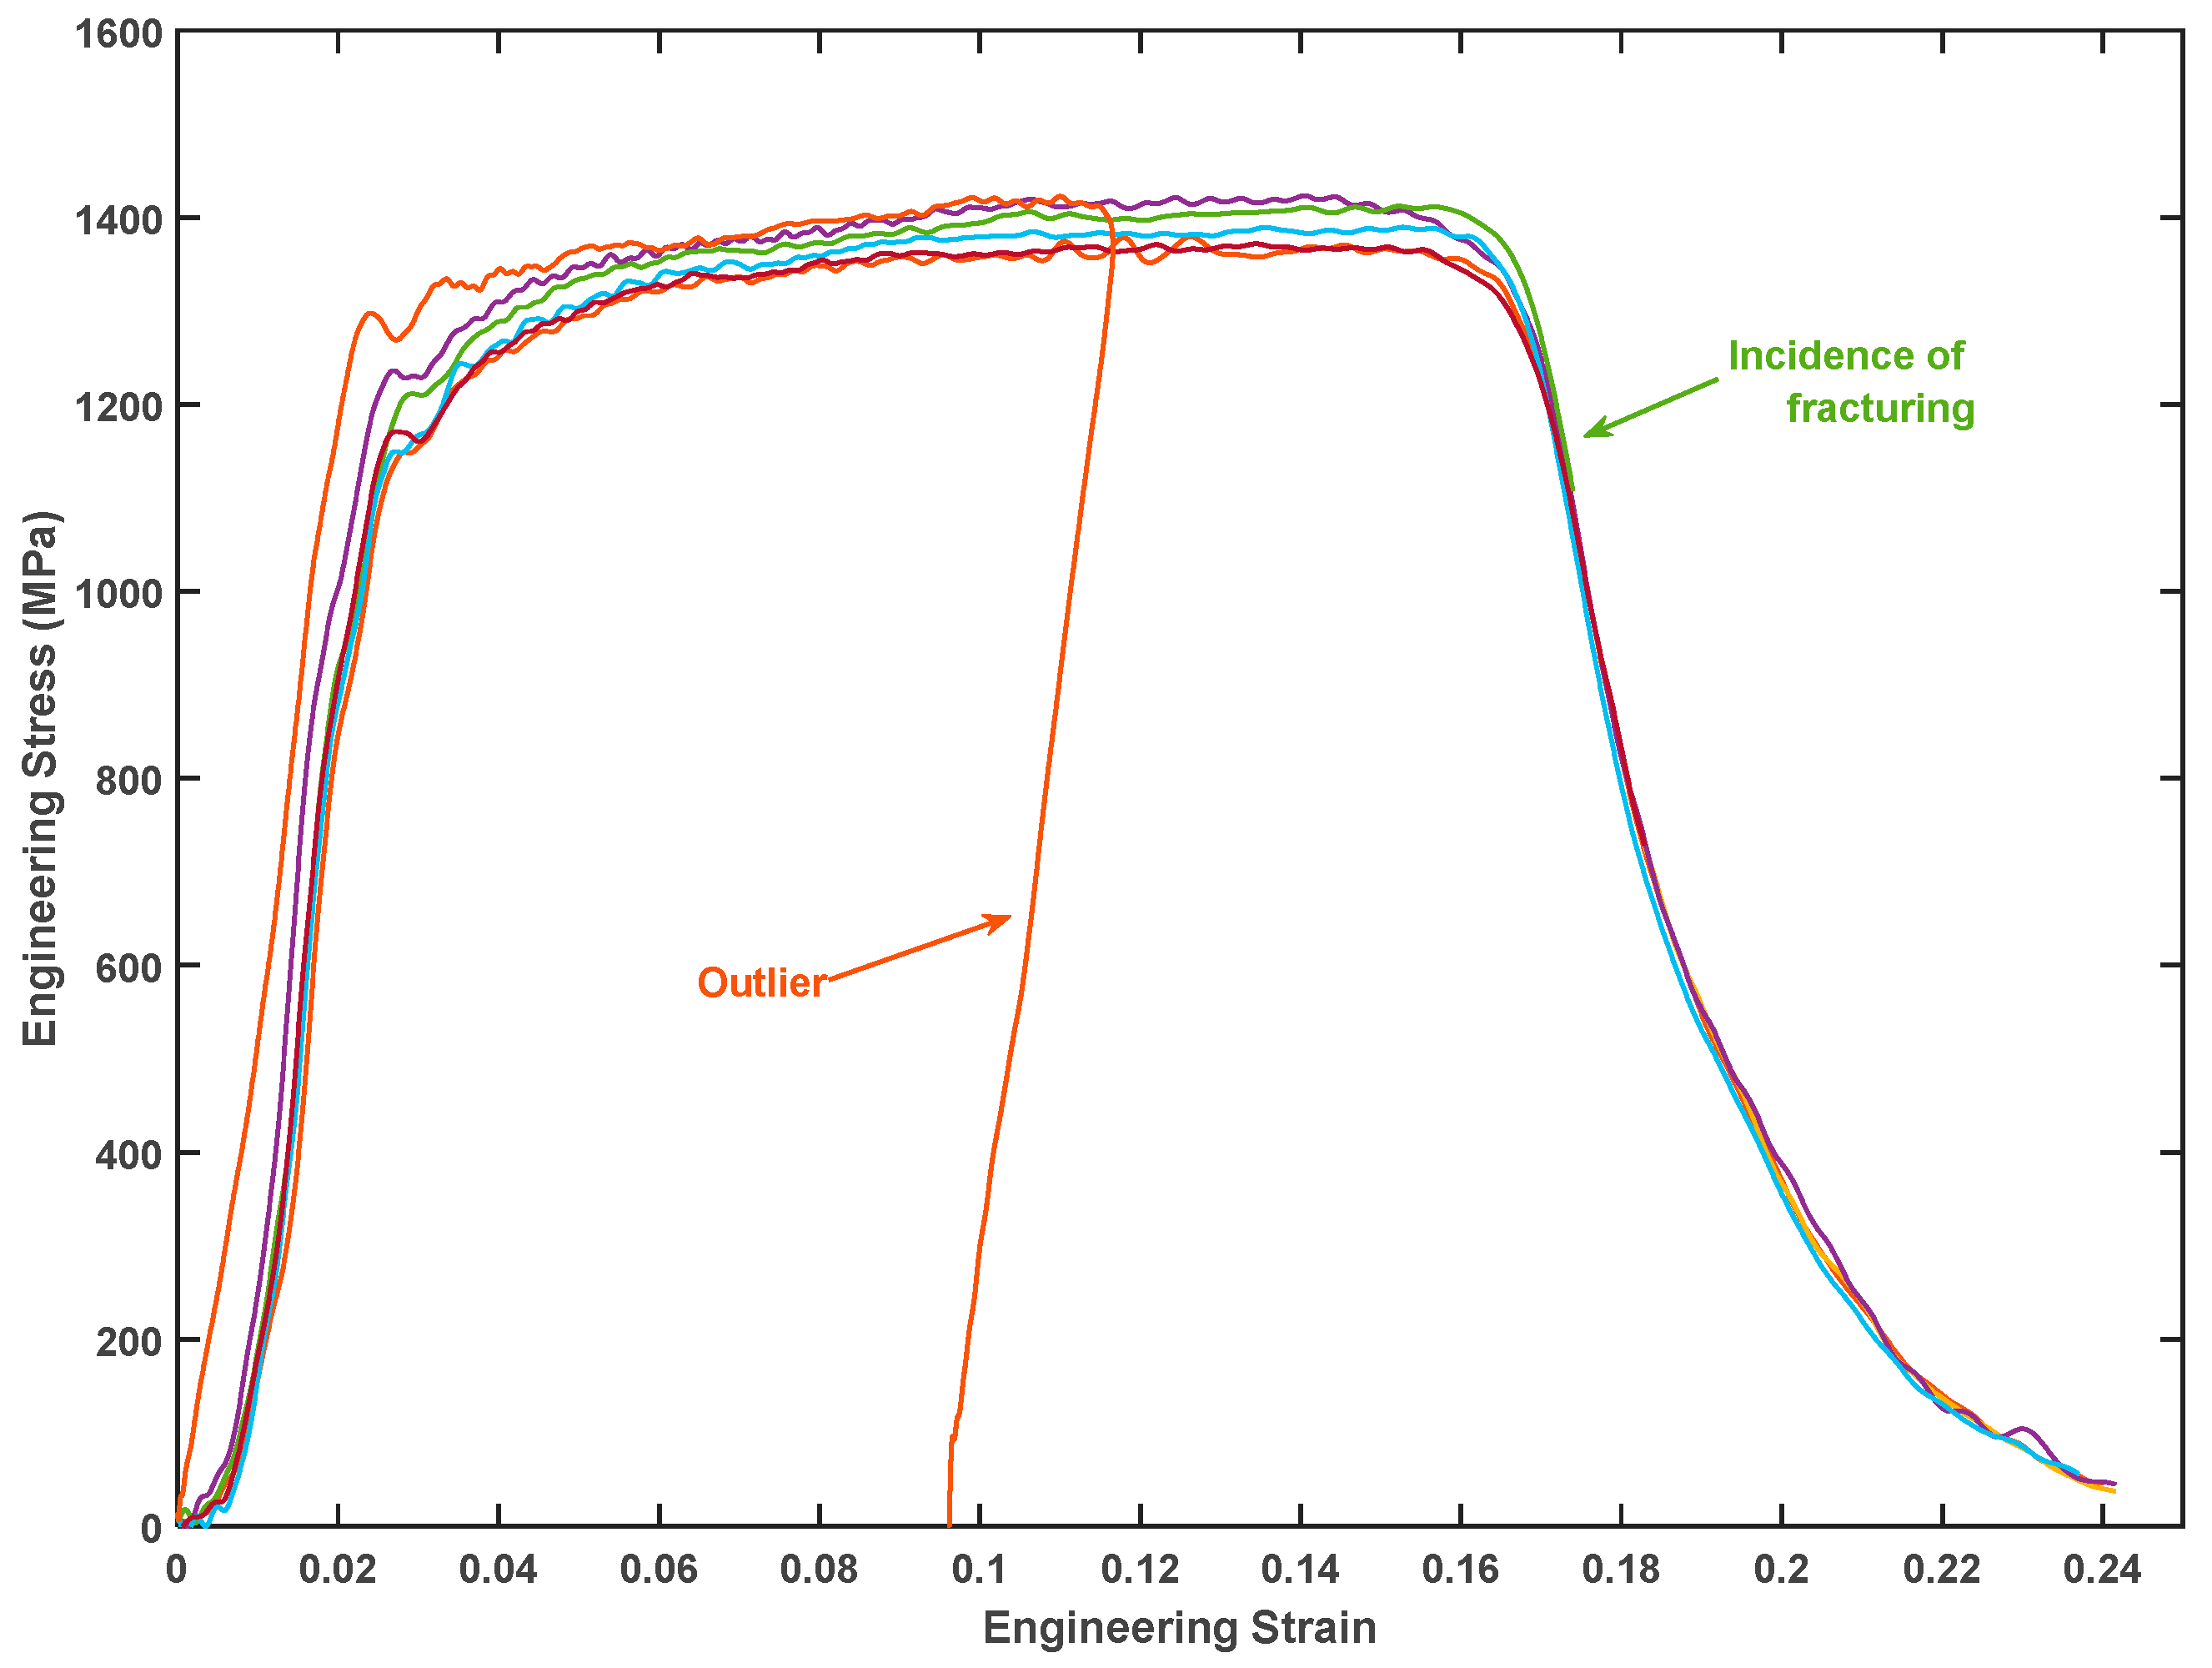
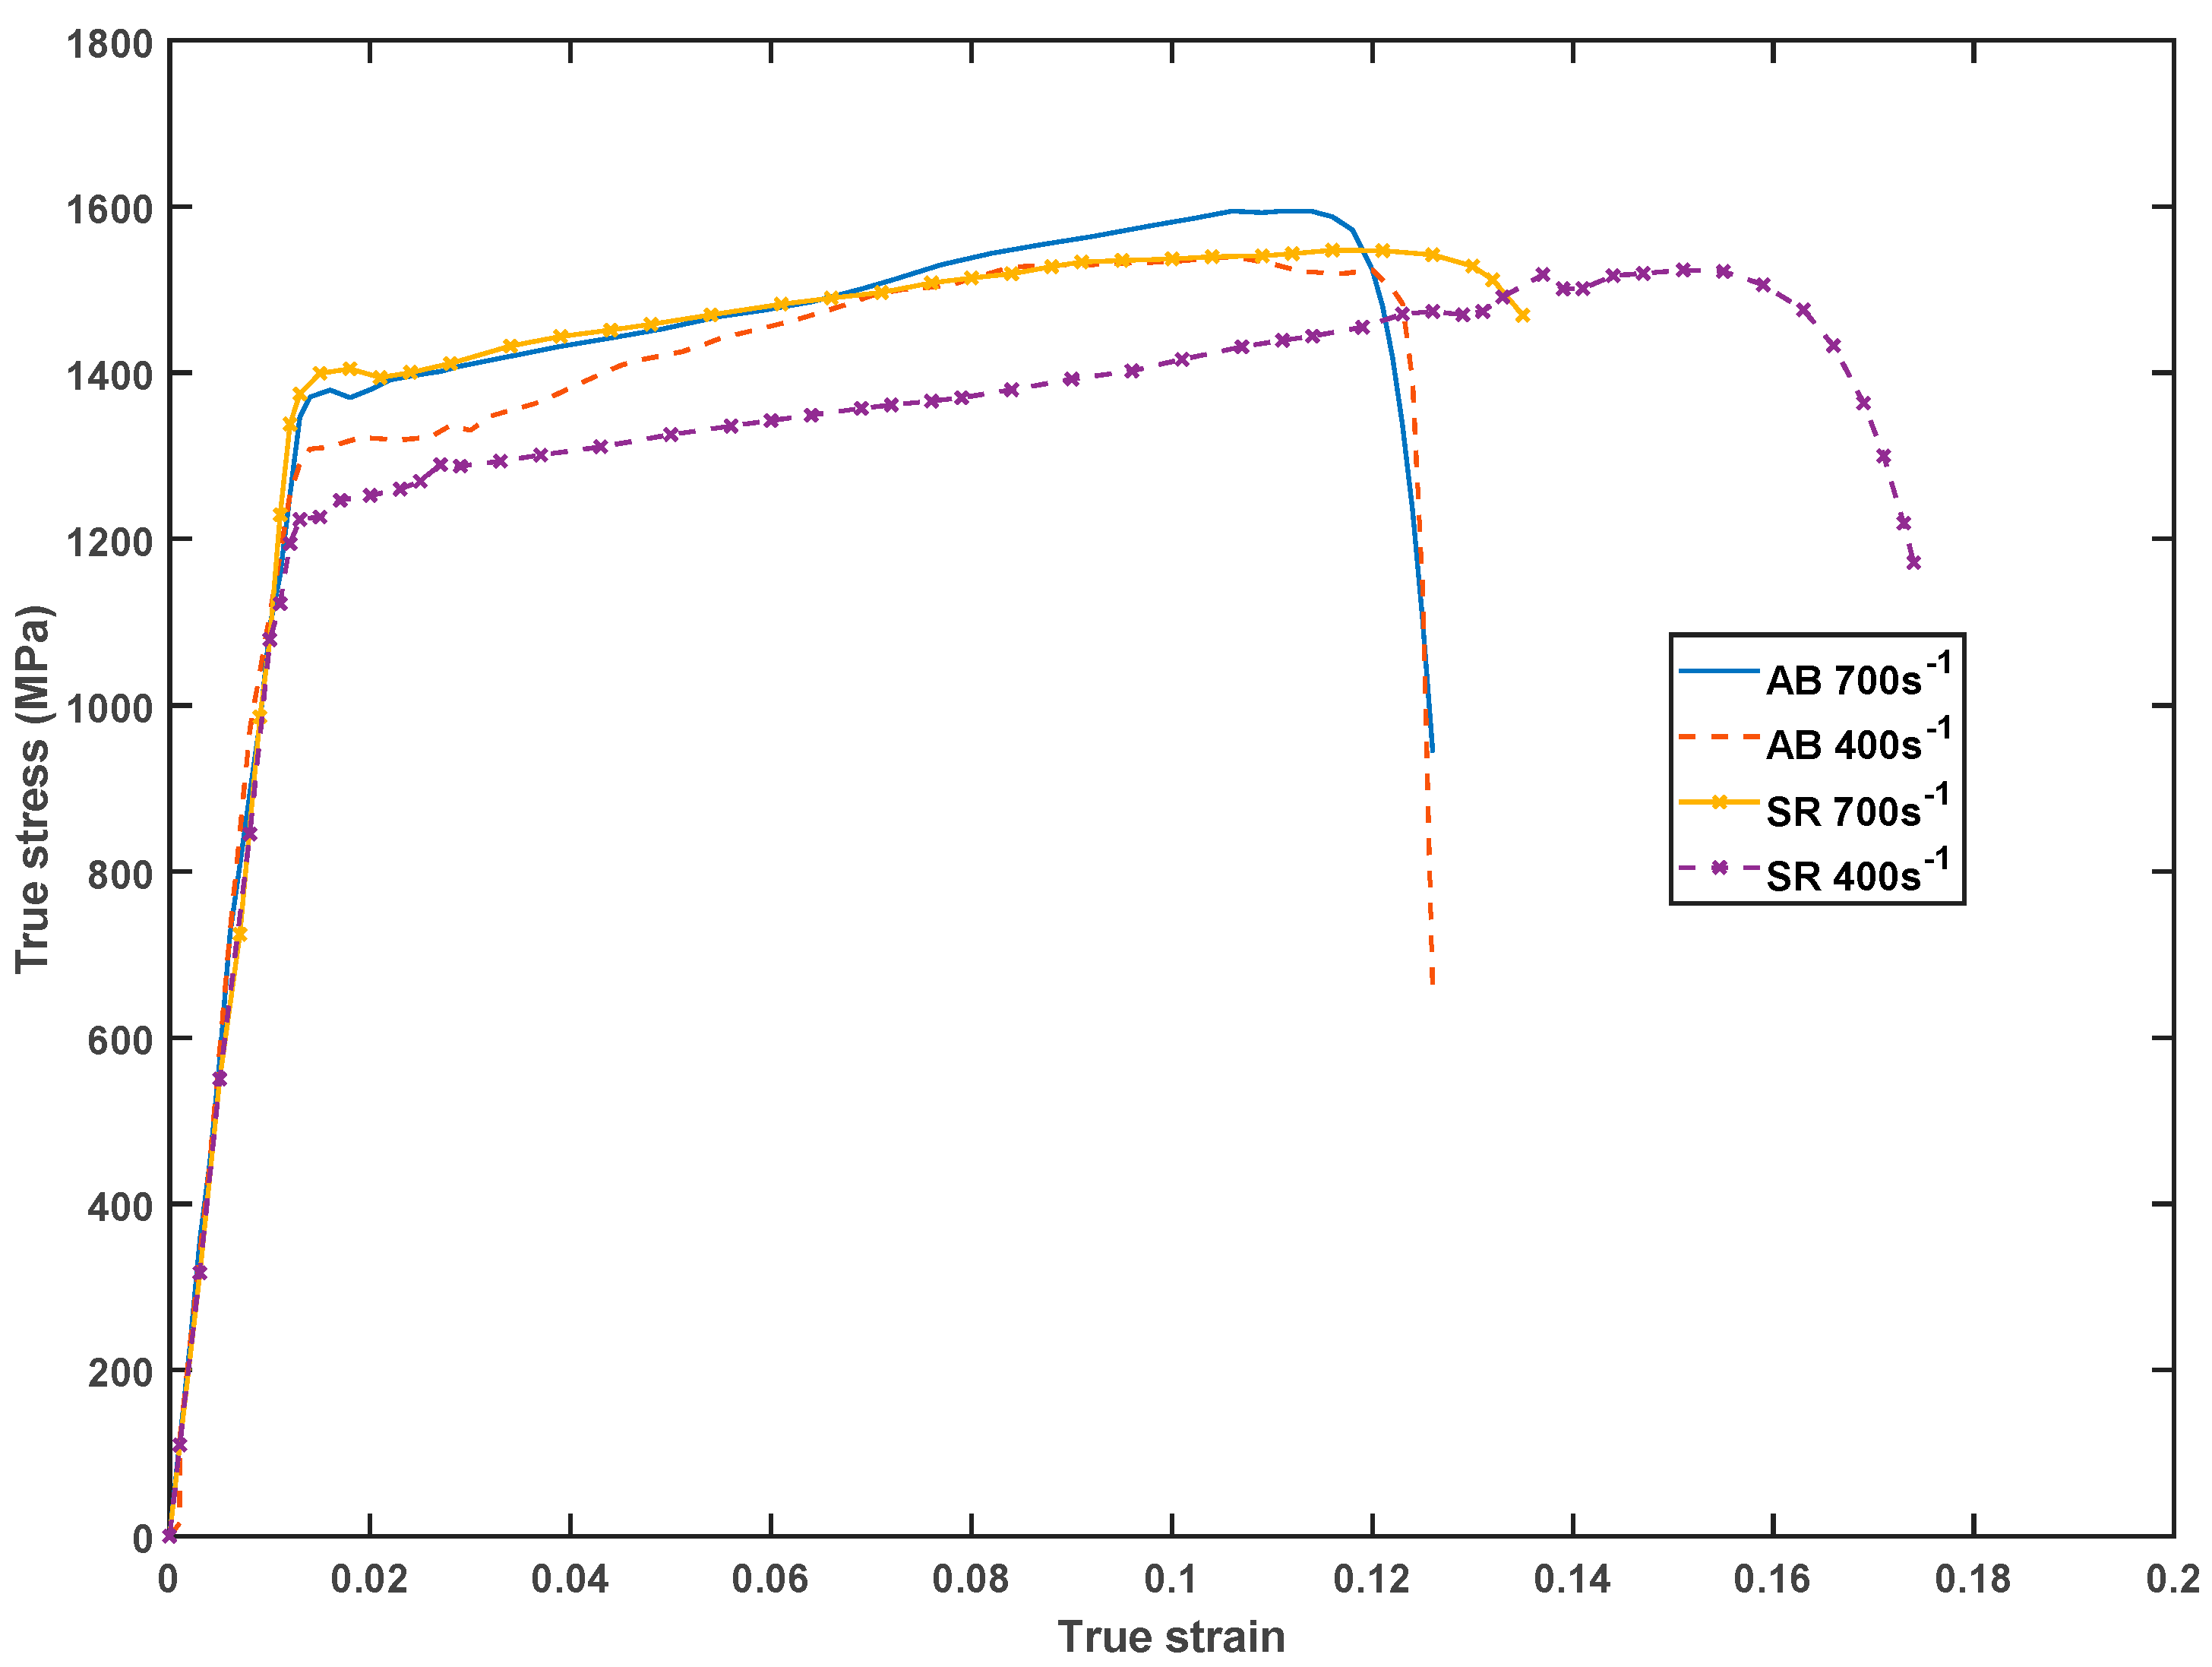
3.2. Flow Stress and Strain Rate Dependency

The 6 mm and 10 mm long compression specimens for the two forms of alloy, AB and SR, yielded two different high strain rates. Figure 5 shows the strain rate against time history for the two dimensions of the specimen used.
This figure shows that the length of the compression specimen has an effect on the strain rate for the same striker velocity, which further confirms Equation (4) in Section 2.2. From the figure, it is seen that the strain rate varied significantly with time, particularly during elastic deformation of the specimens, and remained relatively constant during plastic deformation. The 6 mm and 10 mm specimen for the two forms of alloy yielded average plastic strain rates of approximately 700 s−1 and 400 s−1, respectively, for the same applied impact velocity of approximately 11 m/s.
Based on the strain signal obtained, the typical computed strain, strain rate and stress graphs for Ti6Al4V (ELI) as a function of time are shown in Figure 6. Over most of the test period, the specimens experienced linearly increasing strains as the period of testing increased, as is clear from Figure 6. It is also evident from the figure that the compressive stresses induced in the specimens increased more or less linearly with time, up to a certain value (elastic limit). Beyond this point, the change in compressive stress is seen in Figure 6 to become nonlinear (plastic deformation). The compressive strain rate is seen in Figure 6 to rise rapidly, and then drop sharply, before levelling off in the zone of plastic deformation, as previously shown in Figure 5. Like most stress–time curves of metals and alloys during deformation, the curves in this figure exhibit three distinct regions: the initial region of elastic deformation; the second region of uniform plastic deformation, which terminates in the ultimate strength of the material; and the third region of unloading, referred to as a region of non-uniform plastic deformation.
The curves shown in Figure 7 also exhibit the three regions of elastic and plastic deformation discussed above. After dissipation of the effect of the applied impact, the stresses induced in the specimens dropped. Most reported cases of fracture occurred in this region, after which the stress dropped to zero, as shown in Figure 7.
At least seven specimens were tested in each category (AB and SR) and at each strain rate (400 and 700 s−1). However, due to instability of the SHPB equipment data acquisition system, some tests failed to record results, even though the specimens were loaded. For instance, in Figure 7, although all seven specimens were loaded, only six of them recorded results. All specimens tested experienced plastic deformation, as shown in Figure 7. Moreover, as shown in Table 3, 14% and 29% of the AB and SR specimens, respectively, fractured during testing conducted at a plastic strain rate of approximately 400 s−1. It was noted that 42% and 71% of AB and SR specimens, respectively, failed during testing conducted at a plastic strain rate of approximately 700 s−1. It is apparent, therefore, that more specimens fractured during testing that was conducted at the higher strain rate. The compressive fracture strength of as-built (AB) Ti6Al4V (ELI) is expected to decrease upon stress-relieving heat treatment, while ductility is expected to improve resulting in the higher numbers of fractured SR specimens, as seen in Table 3. Generally, this is due to the reduction of residual stress of the AB microstructure as a result of heat treatment.
The average values of compressive stresses and strains for the seven specimens, less outliers, tested at each strain rate were computed using MatLab codes, up to the point where the first incidence of fracture was reported in each case, at average plastic strain rates of 400 s−1 and 700 s−1 for both the AB and SR specimens. The curves for engineering stress ( σ e n g ) and strain ( ε e n g ) were converted into curves for true stress–strain using the following relationships.
  σ t r u e ( t ) = σ e n g ( t ) ( 1 ε e n g ( t ) )
  ε t r u e ( t ) = I n ( 1 ε e n g ( t ) )
The high strain rate average compression stress–strain curves for the AB and SR samples, such as the set of curves shown in Figure 7, are presented in Figure 8.
The sudden impact on the specimens during the SHPB test loaded the material out of the elastic limit, thus leading to instantaneous strain hardening (pile up of dislocations). The result of this was higher values of stress than the normal yield stress of 1080 MPa for the alloy required to initiate plastic deformation, as seen in Figure 8. The yield point varied for the two forms of the alloy tested at the two strain rates. At the higher strain rate of 700 s−1, the yield stresses of the AB and SR specimens are seen in the two figures to be 1384 MPa and 1402 MPa, respectively. Both forms of alloy yielded at lower values of stresses of 1304 MPa and 1225 MPa for the AB and SR specimens, respectively, at a strain rate of 400 s−1.
Further increase of the applied strain initiated plastic deformation for both forms of the alloy. For all the specimens that were tested, the true flow stresses are seen in Figure 8 to have increased after yielding up to a maximum flow stress, which is known to be due to strain hardening, and then decreased thereafter. Most of the plastic work done during this period is dissipated as heat. However, as materials are rarely pure and without flaws, inhomogeneities in the material form areas of stress concentration, and therefore centres of concentration for plastic deformation [31]. The heat generated in such areas is likely to be more than the heat dissipated for high strain rates, even more so for materials with a low thermal conductivity, such as Ti6Al4V. This would then give rise to higher temperatures in the alloy at such areas, which in turn may lead to thermal softening. Thermal softening stops further strain hardening by enhancing the motion of dislocations, leading to flow localisation. The decrease in flow stresses with increasing strain is due to the effect of unstable deformation caused by such flow localisation, which then leads to the development of voids and microcracks. This unstable deformation occurs at the maximum true stress (σmax), and the strain at this stress is defined as the strain of unstable deformation. As is evident from Figure 8, the value of maximum true stress obtained in the present work was higher for the AB samples, at 1596 MPa, compared to a value of 1550 MPa for the SR samples at the same strain rate of 700 s−1. At the lower strain rate of 400 s−1, the values of maximum true stress for the AB and SR still show the same trend, although with smaller differences, namely, 1539 MPa and 1525 MPa, respectively.
The curves in Figure 8 were plotted up to the points at which fracture occurred. The strain at such points is therefore a fracture strain. The fracture strains were higher at the lower strain rate of 400 s−1. At the lower strain rate, the AB specimens fractured at an average strain of 0.126, compared to that of the SR specimens at 0.174. At the higher strain rate of 700 s−1, the strains at fracture were 0.124 and 0.135 for the AB and SR specimens, respectively.
At fixed strain and temperature, the effect of strain rate on the flow stress (σ) can be described by the power-law expression [32]:
σ = C ε ˙ m
where C is the material constant exponent, m is the strain rate sensitivity and ε ˙ the strain rate. For material deforming at two levels of strain rate, Equation (7) can further be expressed as [32]
σ 2 / σ 1 = ( ε ˙ 2 / ε ˙ 1 ) m
The computed values of the relative strain rate sensitivity m for the AB and SR samples from the average true stress–strain curves at the same strain are as shown in Table 4.
The relative strain rate sensitivity is seen from Table 4 to be higher for the stress-relieved samples in comparison to the as-built ones. This could suggest that the stress-relieved DMLS Ti6Al4V (ELI) material becomes more work hardened under high strain rate loading conditions in comparison to the as-built parts under the same loading.
It is common practice to expose the DMLS parts to stress relieving heat treatment in order to relieve the residual stresses that develop during the build process. Therefore, a comparison of the results obtained in the present study for the SR samples and those of Ti6Al4V (ELI) commonly used in industry and manufactured via the conventional methods is presented in Table 5.
The materials in the table are of different microstructures: martensitic, lamellar and equiaxed. The yielding stresses and ultimate compressive strength for stress-relieved DMLS Ti6Al4V (ELI) parts are seen in this table to be higher than those of the wrought material, even though the latter were tested at higher strain rates than in the SR specimens in the present study. The fracture strains on the other hand are lower for the DMLS parts compared with those of the wrought materials tested at higher strain rates. An increase in the strain rate of materials generally causes an increase in flow stress and a decrease in fracture strain due to greater multiplication of dislocations. The observation made with reference to these two parameters in this table, in comparing their values for SR and wrought specimens, suggests that the microstructure plays a significant role in the mechanical properties of the materials at high strain rate. Thus, the higher flow stresses and lower fracture strains for SR, DMLS Ti6Al4V (ELI) samples with fine martensitic microstructure, compared to lamellar and equaxied structures of wrought Ti6Al4V. This suggests a need for further heat treatment of DMLS Ti6Al4V (ELI) parts to optimize the strength and ductility for industrial applications.

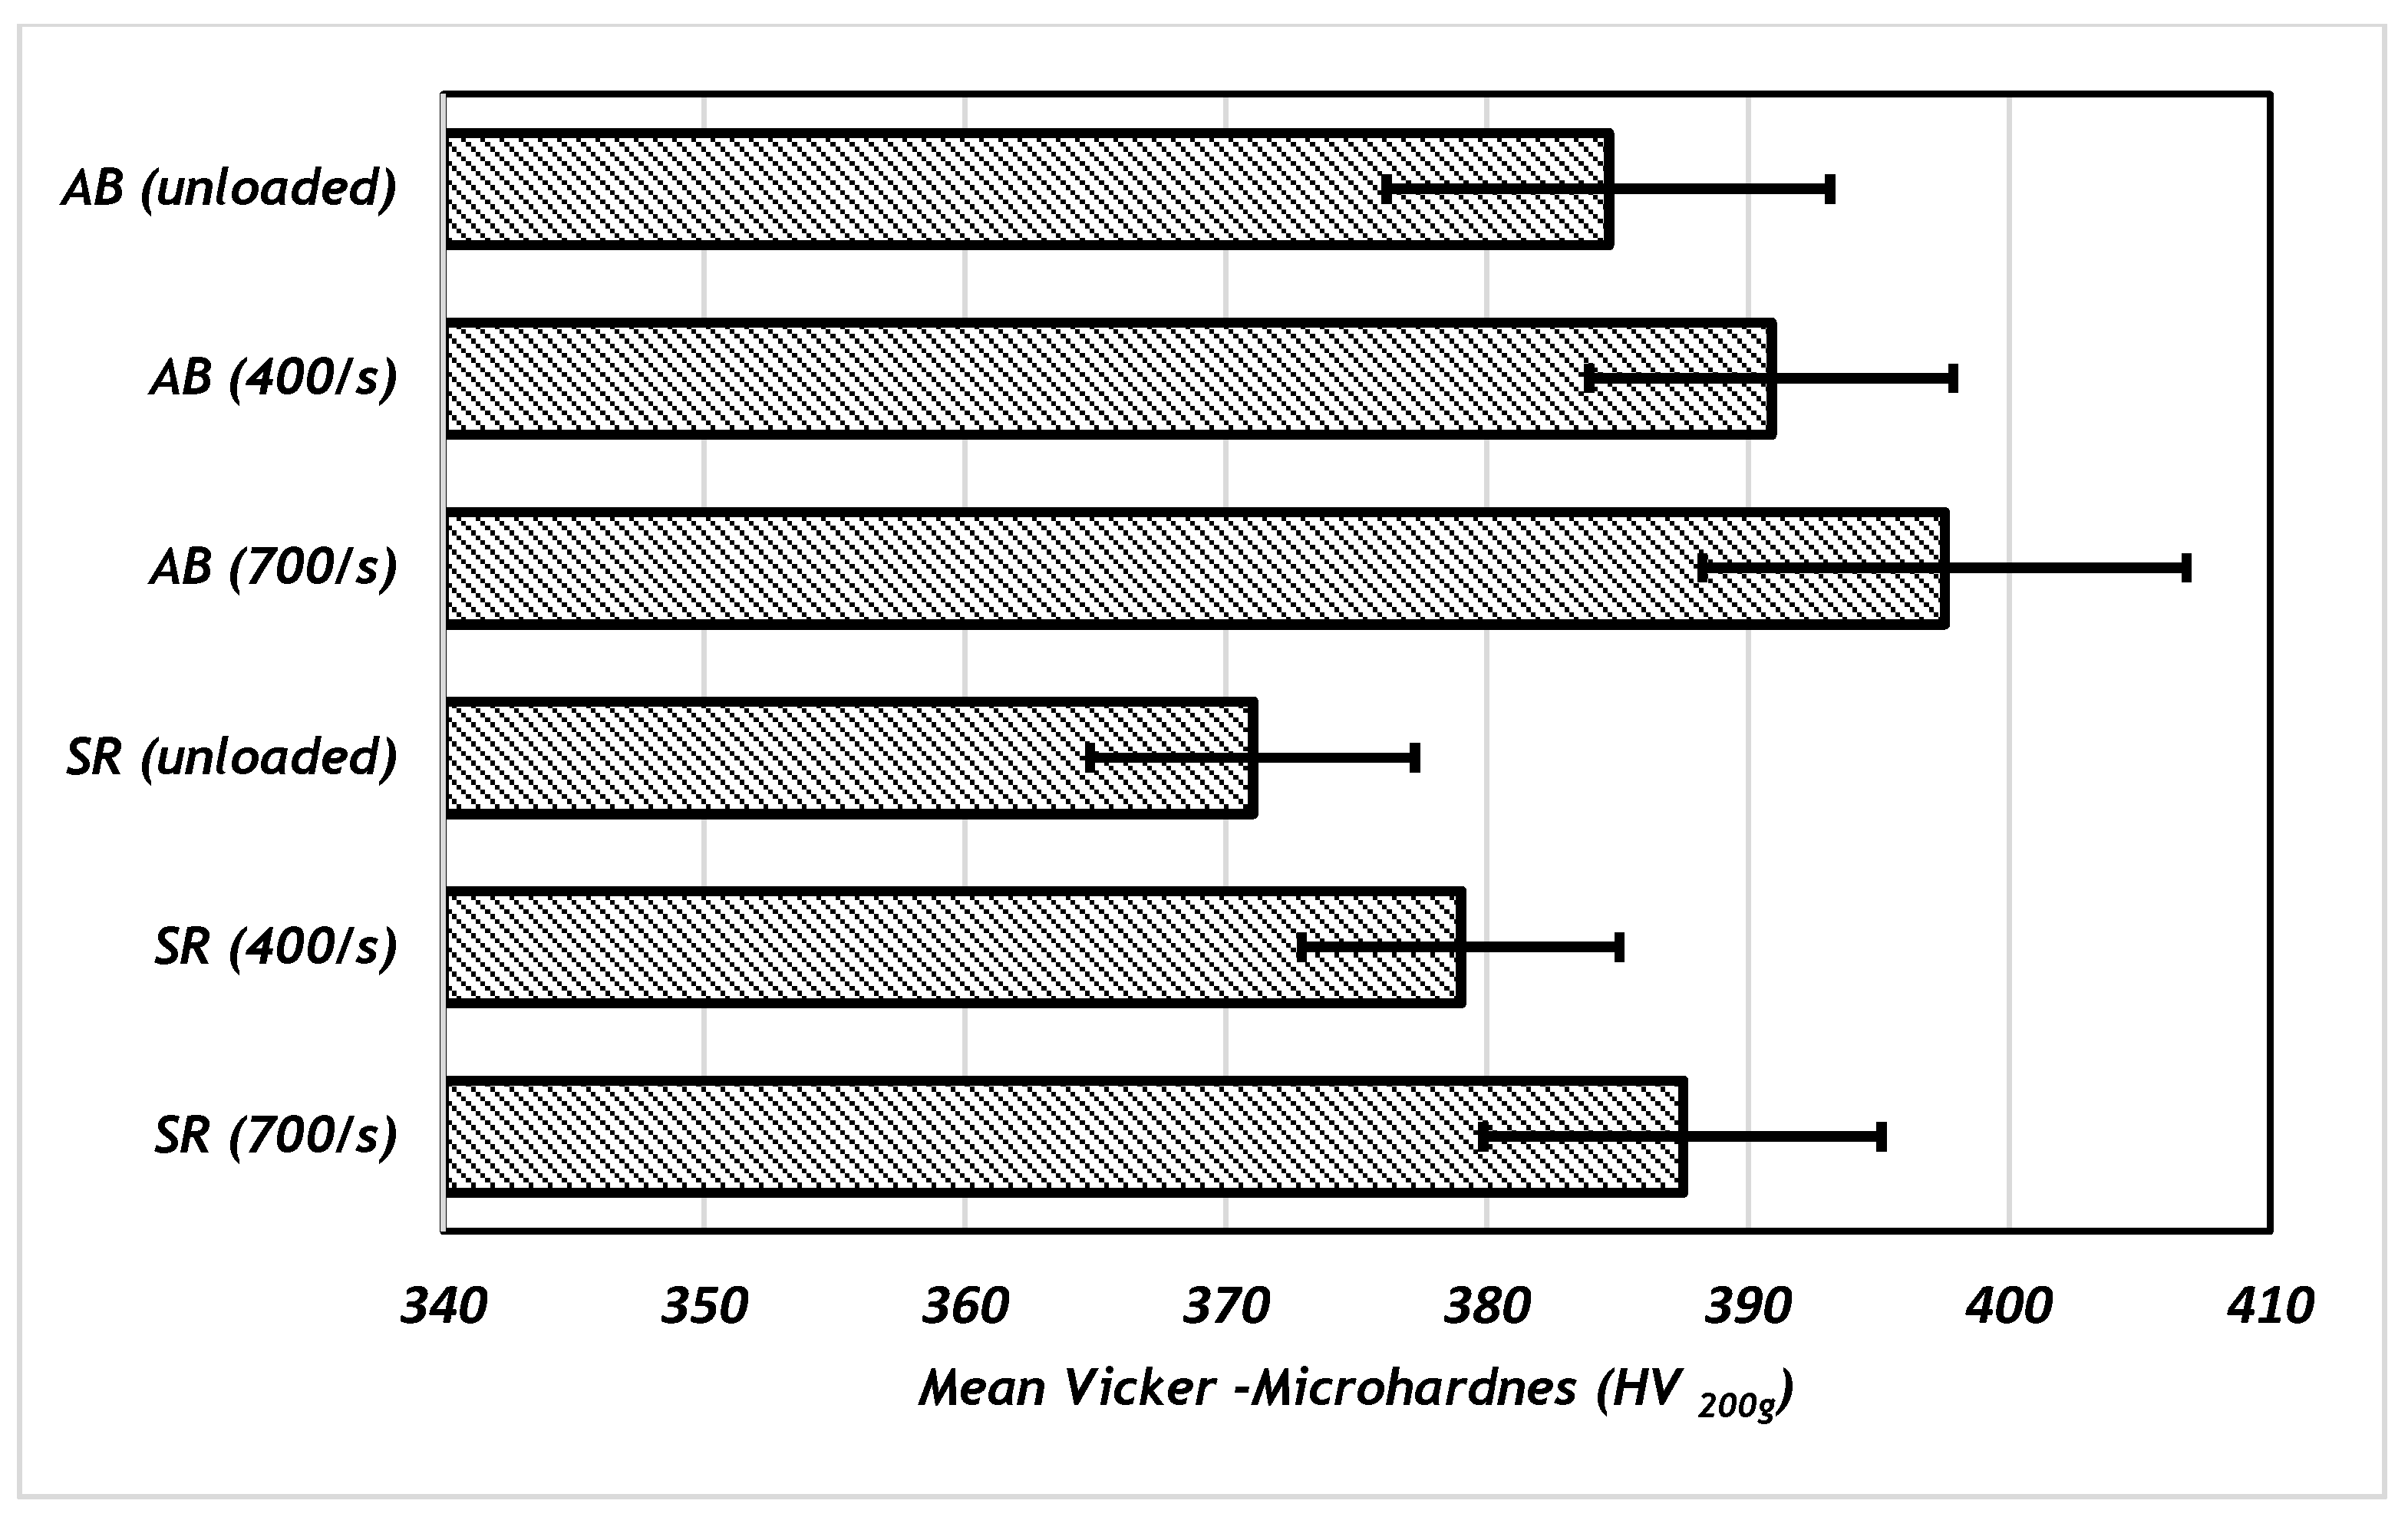
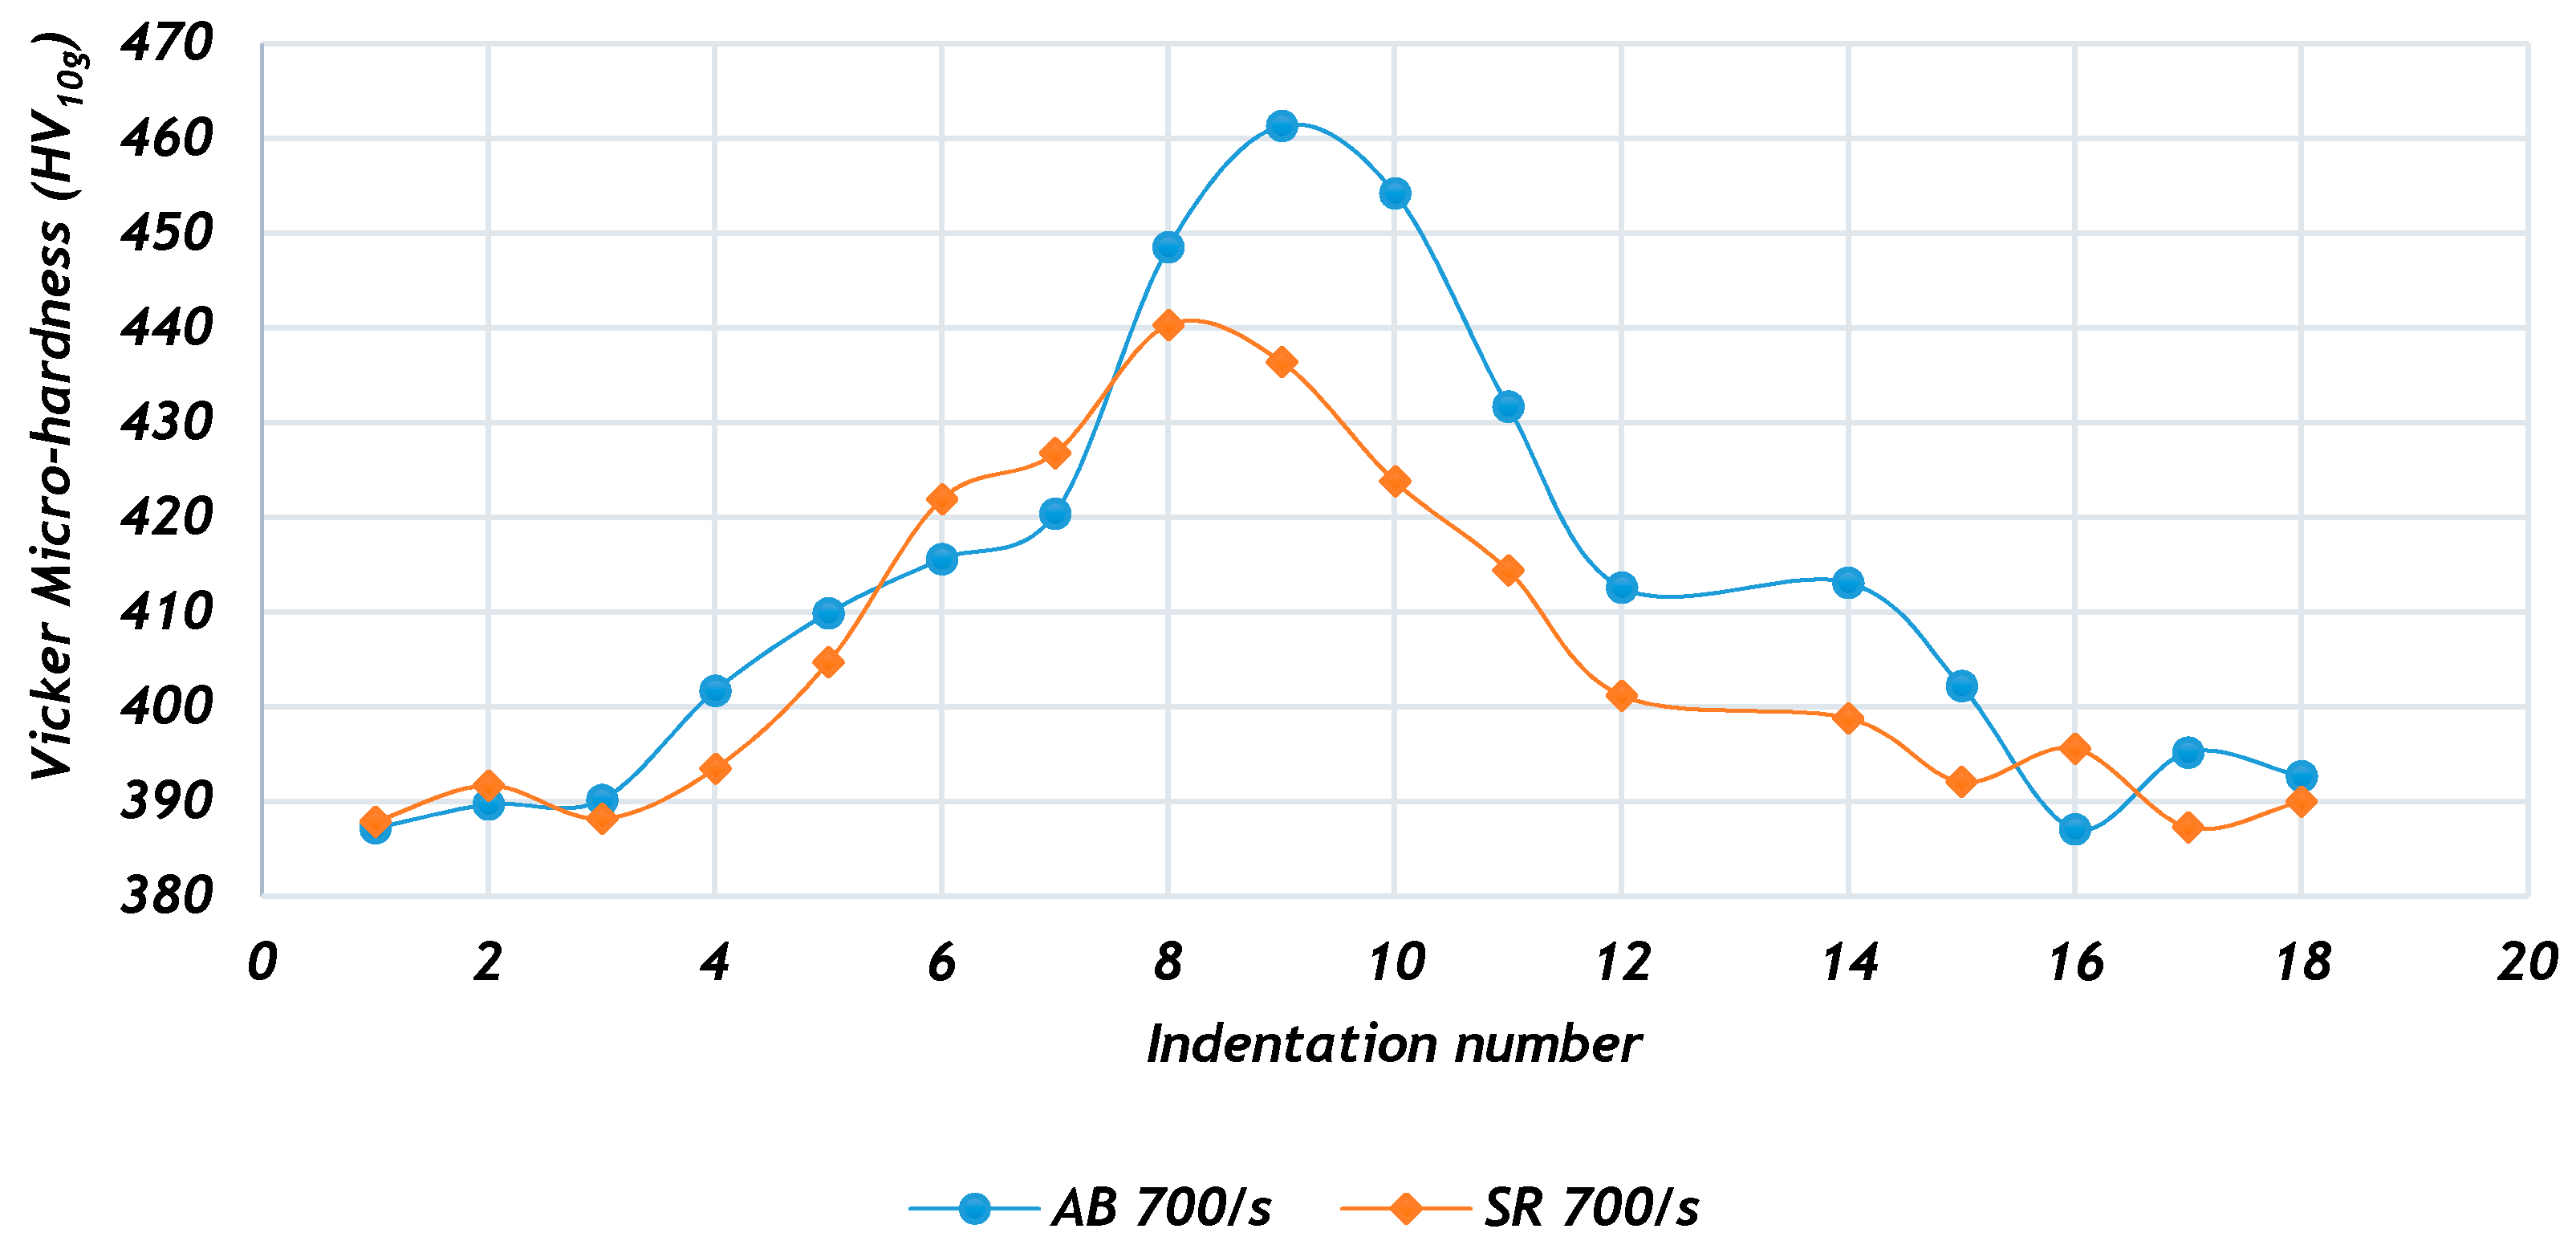
3.3. Hardness Test Result

The obtained values of the Vickers microhardness test for the unloaded samples and the two sets of specimens (AB and SR) that were exposed to compressive high strain rate testing at the average plastic strain rates of 400 s−1 and 700 s−1 showed variations over the range of indentations done. The average values (bars) and standard deviation (error bars) of Vickers microhardness for the unloaded and loaded AB and SR samples are presented in Figure 9.
The stress-relieving heat treatment resulted in a decrease in micro-hardness of the as-built parts as seen in this figure. A hypothesis of the reduction in a large amount of tensile residual stress created in DMLS process due to rapid solidification can be proposed to have resulted in the observed higher values of micro hardness of the AB specimens. The values of Vickers microhardness for both the AB and SR specimens were higher on the average for the higher compressive strain rate. It is evident from Figure 10 that the change in compressive high strain rate from 400 s−1 to 700 s−1 does not lead to significant changes in the mean values of microhardness for both the AB (6.63 HV200g) and SR (8.50 HV200g) specimens. However, the change is greater for the cases of the unloaded and loaded samples at the higher strain rate, giving a mean difference of 12.87 HV200g and 16.47 HV200g for AB and SR specimens, respectively. It is noteworthy that, in view of preceding statements on the relative hardness of AB and SR specimens and the possible causes of the difference of values for the two forms of alloy, the change is higher for the SR than for the AB specimens.
The increase in the values of microhardness with increasing strain rate seen here can be attributed to barriers to the movement of dislocations created by strain rate deformation that increases with the increasing strain rate. This phenomenon can further be investigated for specimens loaded under a wider range of strain rates. As the hardness of material is known to be proportional to the yield strength, determination of the Johnson and Cook (JC) model parameters is useful in studying this phenomenon [33].
Careful consideration of the values of microhardness using a small load (HV10g) for the area near, within and far from the ASBs for the specimens loaded at a strain rate of 700 s−1 indicated some significant variations. The microhardness was greater near the ASBs, and gradually faded away towards the regions far from them, as shown in Figure 10.
Two key aspects are proposed here to explain this phenomenon: First, the strain hardening of the microstructure within and in the regions neighbouring the ASBs, which are conjectured as being more plastically deformed sections of the shear-strained samples due to shear–strain failure. This increases the dislocation density in such regions, resulting in interaction of dislocation strain fields, which hinders motion of dislocations. The second proposal is related to the higher temperature gradient occurring between the regions of ASBs and the rest of the material. Corresponding higher cooling rates upon removal of load, and therefore strain in such regions, cause the ASBs to develop hard and brittle structures, which result in lower resistance to fracture, but higher values of hardness.

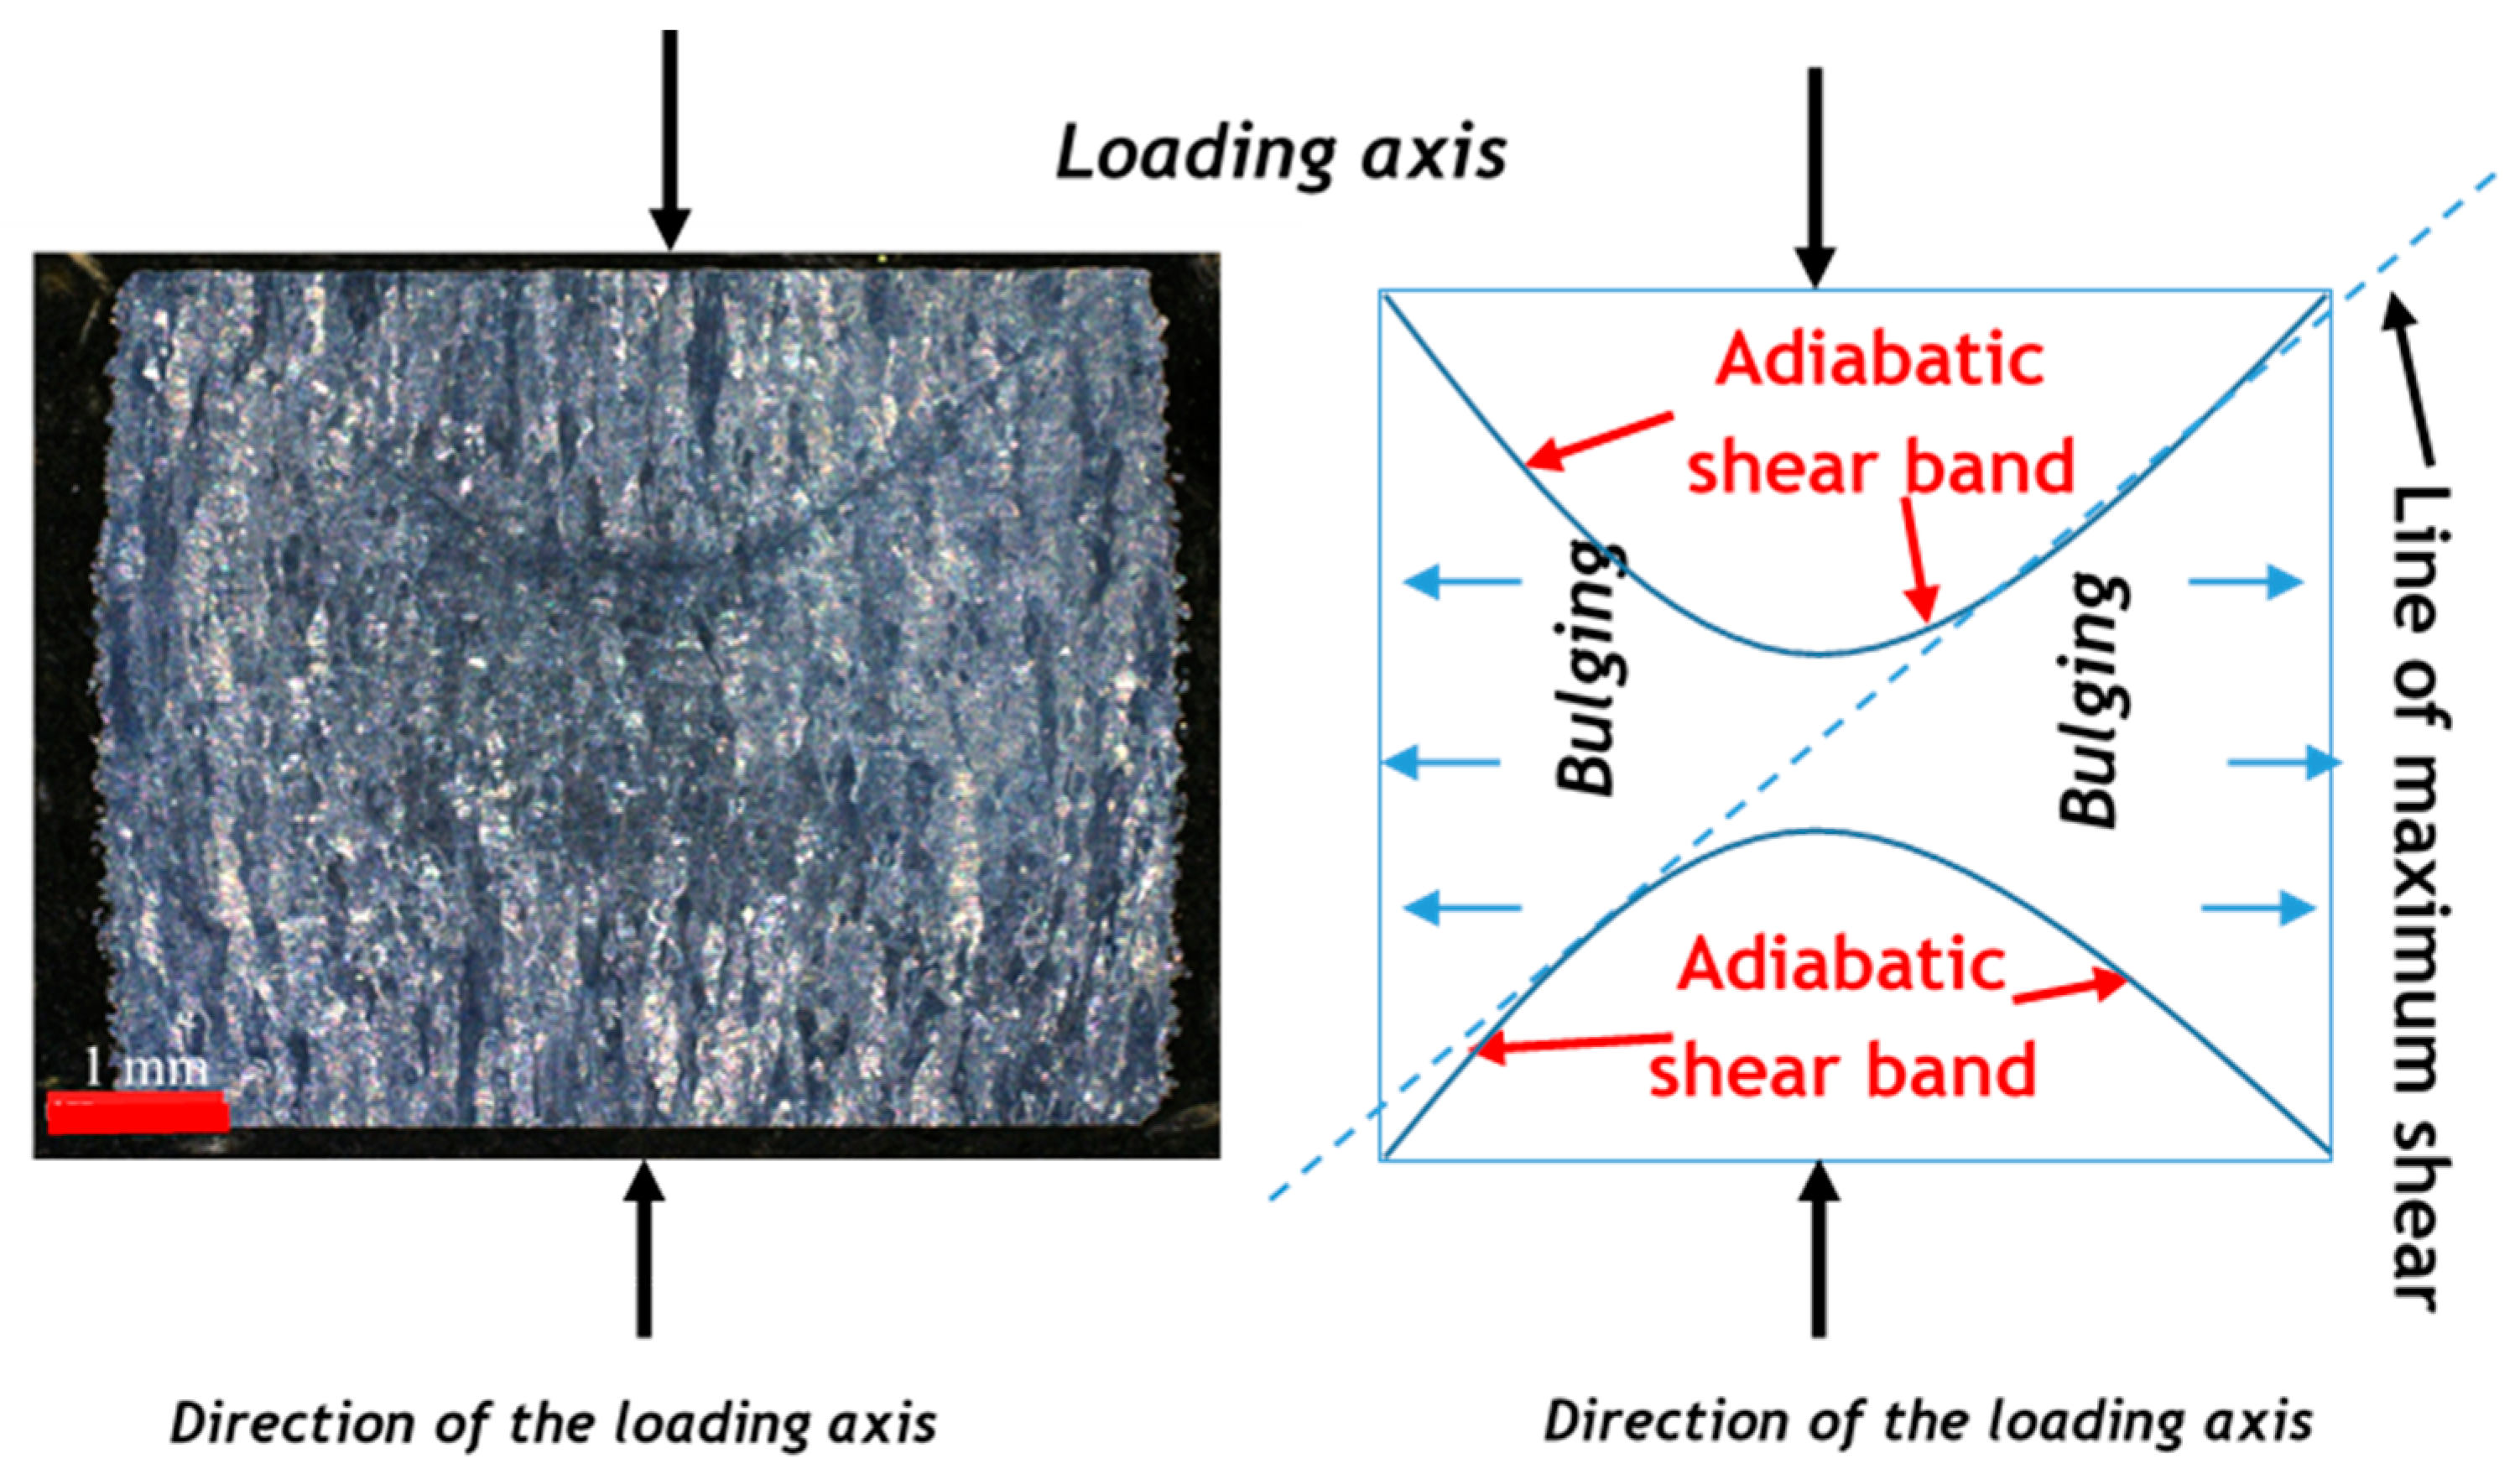
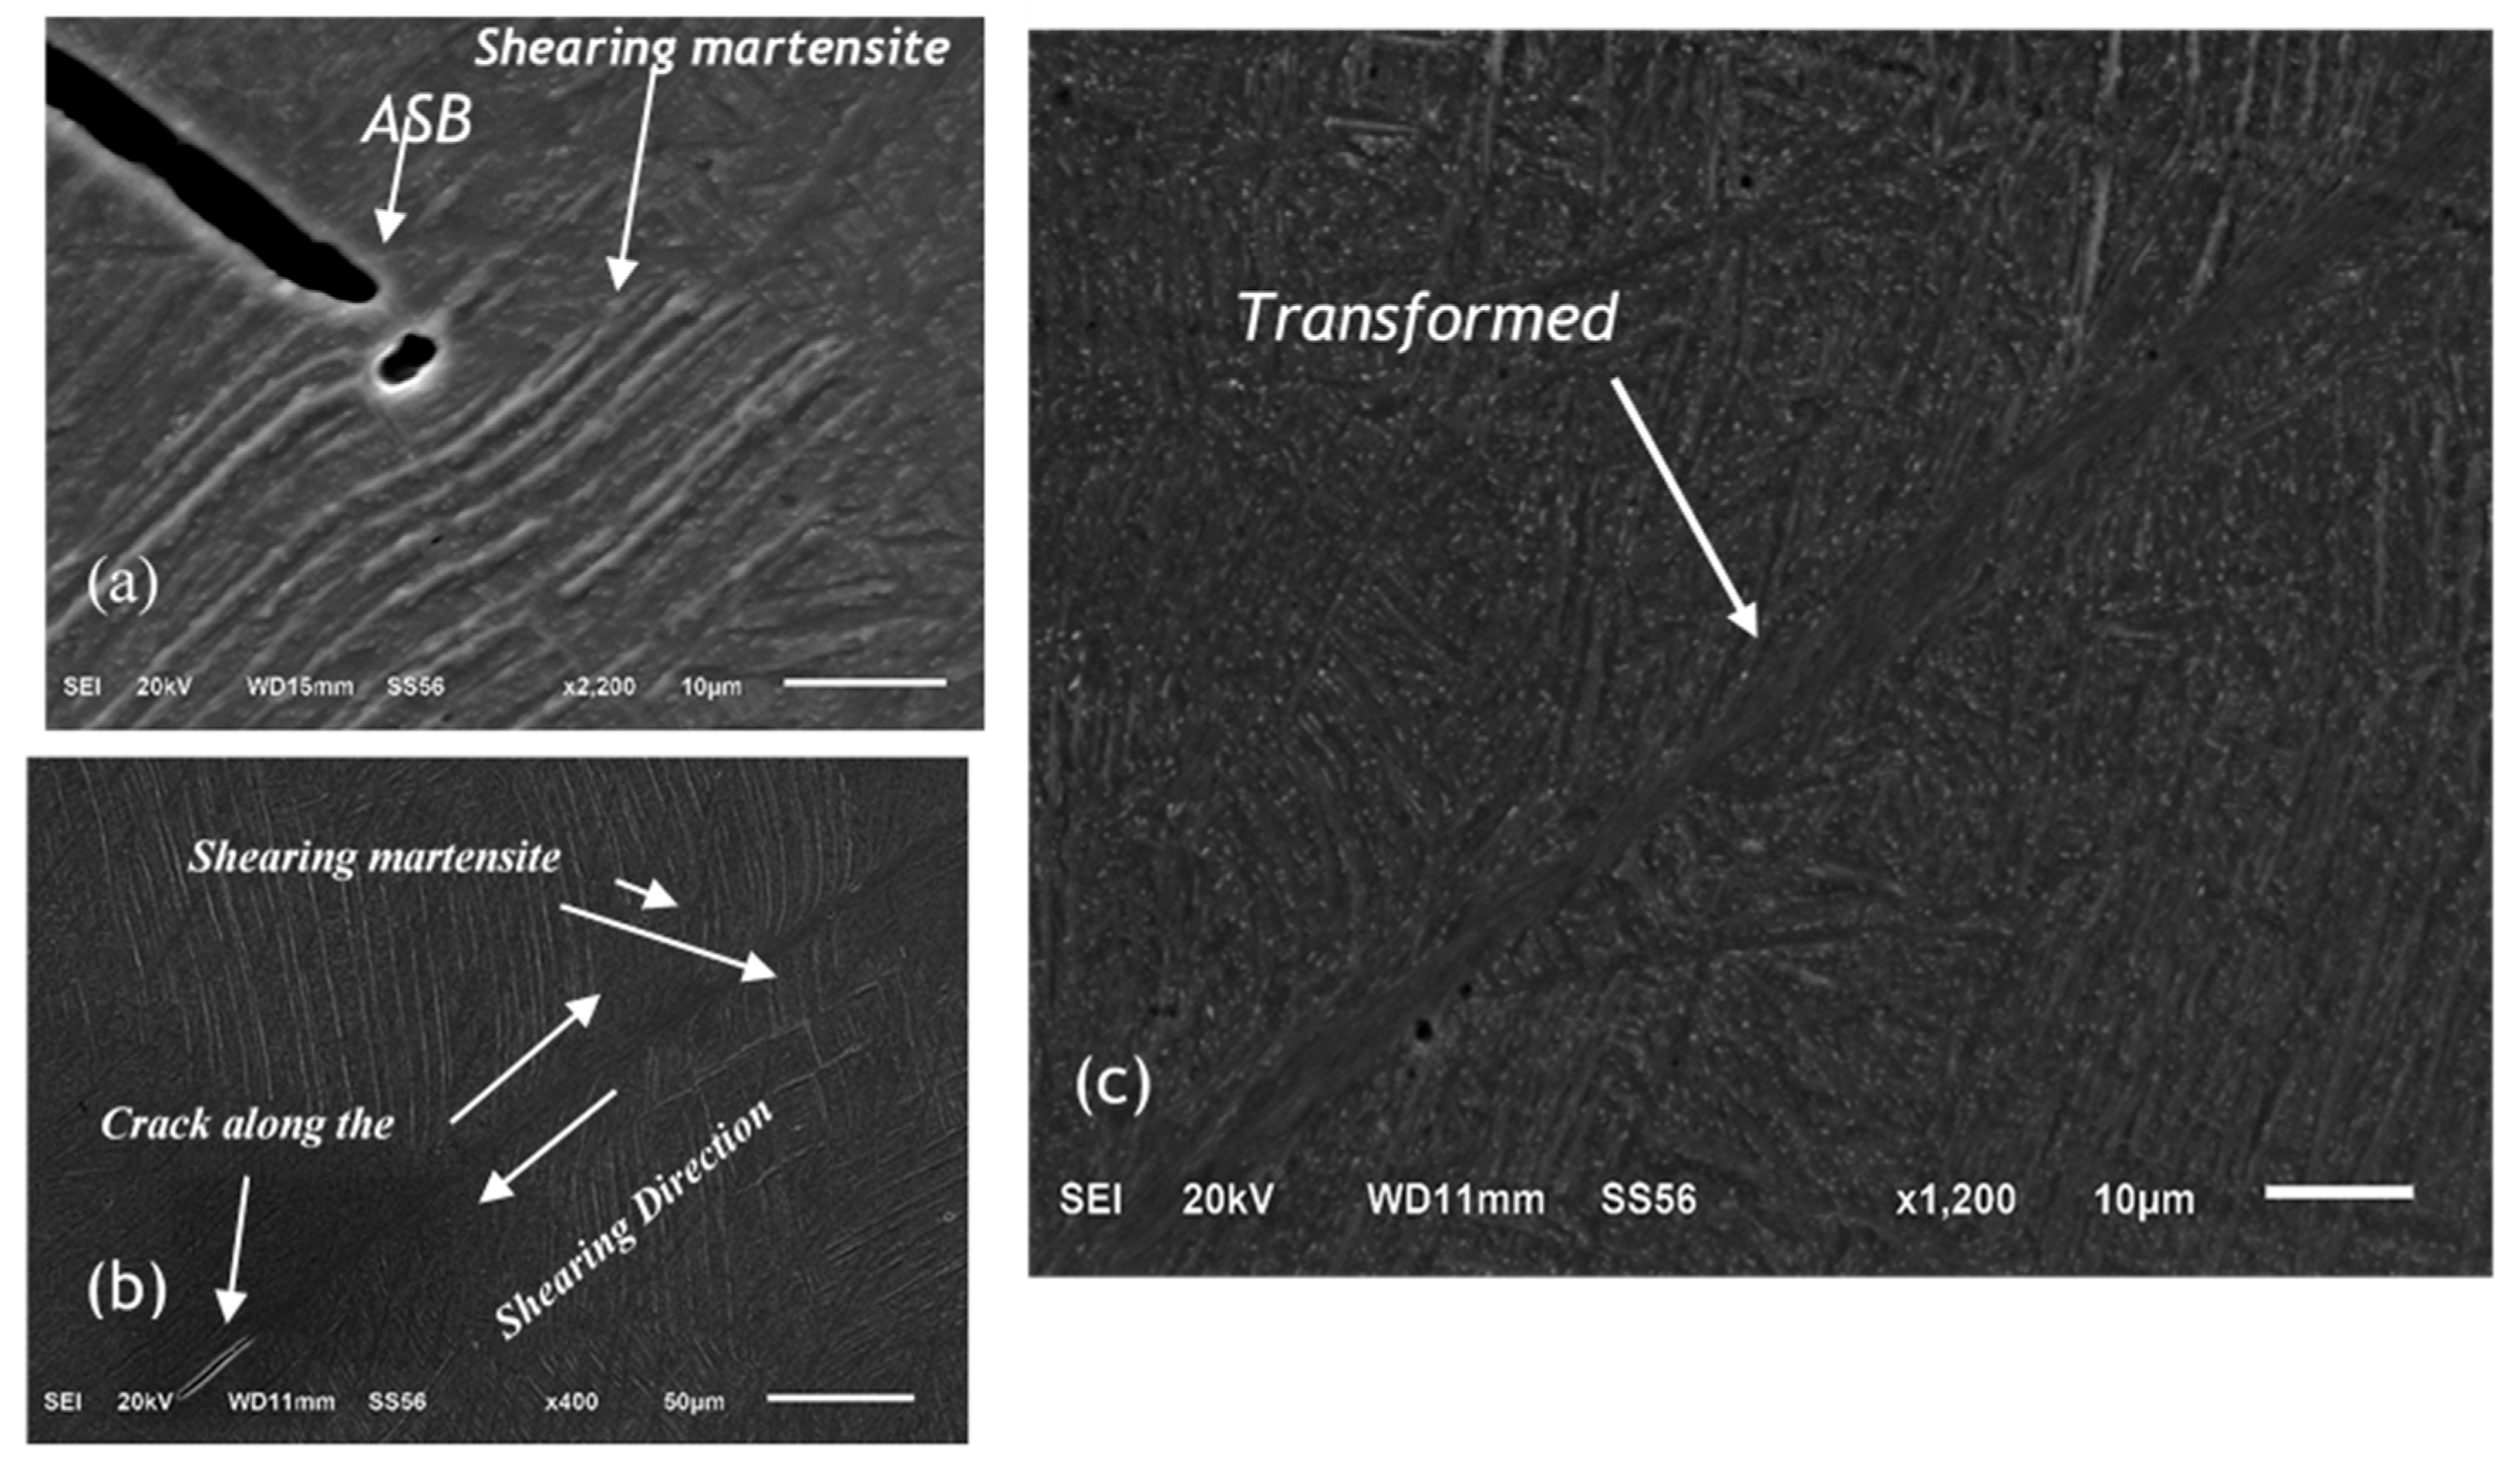
3.4. Observation and Analysis of Sectioned and Fractured Surfaces

The fractured features of the specimens that were impacted at strain rates of 400 s−1 and 700 s−1 were studied using both optical and scanning electron microscopy. The analysis showed that localised shear dominates the fracture behaviour of the two forms of the Ti6Al4V (ELI) alloy. Narrow transformed ASBs running across the specimens, were observed using optical microscopy in all cases of the sectioned specimens. A typical optical micrograph of a fractured specimen and a schematic description of its features are shown in Figure 11.
In a secondary electron image (SEI) mode of a SEM, deformed and transformed ASBs zones were observed on the longitudinal surfaces of the two forms of specimen that did not fracture. The micrographs, for the specimens that were deformed under either one of the two strain rate regimes of 400 s−1 and 700 s−1 are shown in Figure 12 and Figure 13. The deformed ASBs are considered as zones of intense concentration of shear strain with no definite boundaries, whereas dynamic recrystallisation or phase transformation does occur in transformed ASBs, and they also have clear boundaries [31]. In Figure 12a, the martensitic structures are seen to be under shear strain, with no definite boundaries observed between the matrix and ASBs. Shear zones, as well as the transformed ASBs, with definite boundaries forming at the centre of the deformed zones, are observable in Figure 12b. Figure 12c shows the transformed ASB under high magnification. The narrow zones pointed to as transformed ASBs are known to be areas of dynamic recrystallisation [18].
In Figure 13, voids and cracks are apparent, with clear signs of coalescence within the formed ASBs. It is evident from the micrographs in Figure 13 that the locations of ASBs can be considered as sites for further damage and future failure when the voids and cracks coalesce along them. Figure 13a,b shows a typical array of coalesced voids in well-developed ASBs. Initially, the voids can typically be considered spherical or elliptical, as shown in Figure 13b. However, upon their growth, and therefore their diameters reaching the thickness of the shear bands, the voids merged, and extended along the shear bands, forming into elongated cavities. The width of these resulting cavities may therefore be considered to be the same as the width of the transformed shear band. The widths of these transformed shear bands are seen to be narrower in the case of AB specimens (Figure 13a,c) in comparison to those of SR specimens (Figure 13b,d) at the same test strain rate. The measured average width along the transformed shear bands for the AB and SR specimens at the strain rate of approximately 400 s−1, are seen in the figure to be 2 μm and 5 μm, respectively. Those at a strain rate of approximately 700 s−1 are slightly higher, at 3 μm and 7 μm for AB and SR specimens, respectively.
The work of Wang [35] demonstrated that, at higher strain rates, the peak stress and the relative average plastic shear strain are higher, transformation occurs earlier and the shear stress relative to this transformation is higher. Therefore, a wider transformed ASB may be expected. Moreover, at high strain rates, high peak temperatures in the ASBs, and steeper profiles of temperature in ASBs, are expected. The variation of the width of the transformed ASBs at the same strain rate for the AB and SR specimens may be considered a result of the difference in hardness of the two forms of the alloy. The research of Dodd and Bai [18] showed that the width of the shear bands is primarily determined by the material hardness, and it diminishes with increasing hardness of the material. This ties in with the observations made in Section 3.2 that stress relieving at a temperature of 650 °C and a soaking period of 3 h led to a decrease in the values of Vickers microhardness, from an average value of 384 ± 8.49 HV200 for AB specimens, to 371 ± 6.23 HV200 for SR specimens.
Studies of fractographs of DMLS AB and SR Ti6Al4V (ELI) that were loaded at compressive high strain rates highlighted the fact that the fracture surfaces consisted of both shiny and fibrous zones, as shown in Figure 14. It is evident in the images shown in Figure 14 that the tension and the shear deformation regions coexist, and form an x-shape on the fracture surface, defining the shear bands. Deformation under compressive loading is initially homogenous, with no induced radial or circumferential stresses. As seen in Figure 11, Figure 12 and Figure 13, plastic instability, which occurs at given magnitudes of load, leads to deformation that is localised in narrow zones: the ASBs. A further increase in compressive strain causes a transverse bulging of the specimens and circumferential/hoop stresses appear at the equatorial plane of a cylindrical specimen. This creates a tensile loading state, characterised by fibrous tearing zones with elongated dimples on the sides of the loaded specimens. The shiny, smooth zone is a result of shearing action between the two opposing halves of the loaded specimen.

4. Conclusions

The experimental high strain rate behaviour of as-built (AB) and stress-relieved (SR) DMLS Ti6Al4V (ELI) presented here lead to the following conclusions.
(a)
The compressive fracture strength of the AB DMLS Ti6Al4V (ELI) decreased as a result of stress-relieving heat treatment, while ductility increased for both forms of the alloy.
(b)
The flow stress under the compressive loading increased, while the fracture strain decreased with a higher strain rate for both forms of the alloy.
(c)
The strain rate sensitivity of the SR specimens was higher in comparison to that of AB specimens at the same true strain, implying that SR DMLS Ti6Al4V (ELI) specimens are strengthened much faster under dynamic loading conditions than AB specimens under the same loading.
(d)
Stress-relieving heat treatment resulted in the reduction of the microhardness of the specimens. This is thought to be due to the reduction in tensile residual stresses created in the DMLS process.
(e)
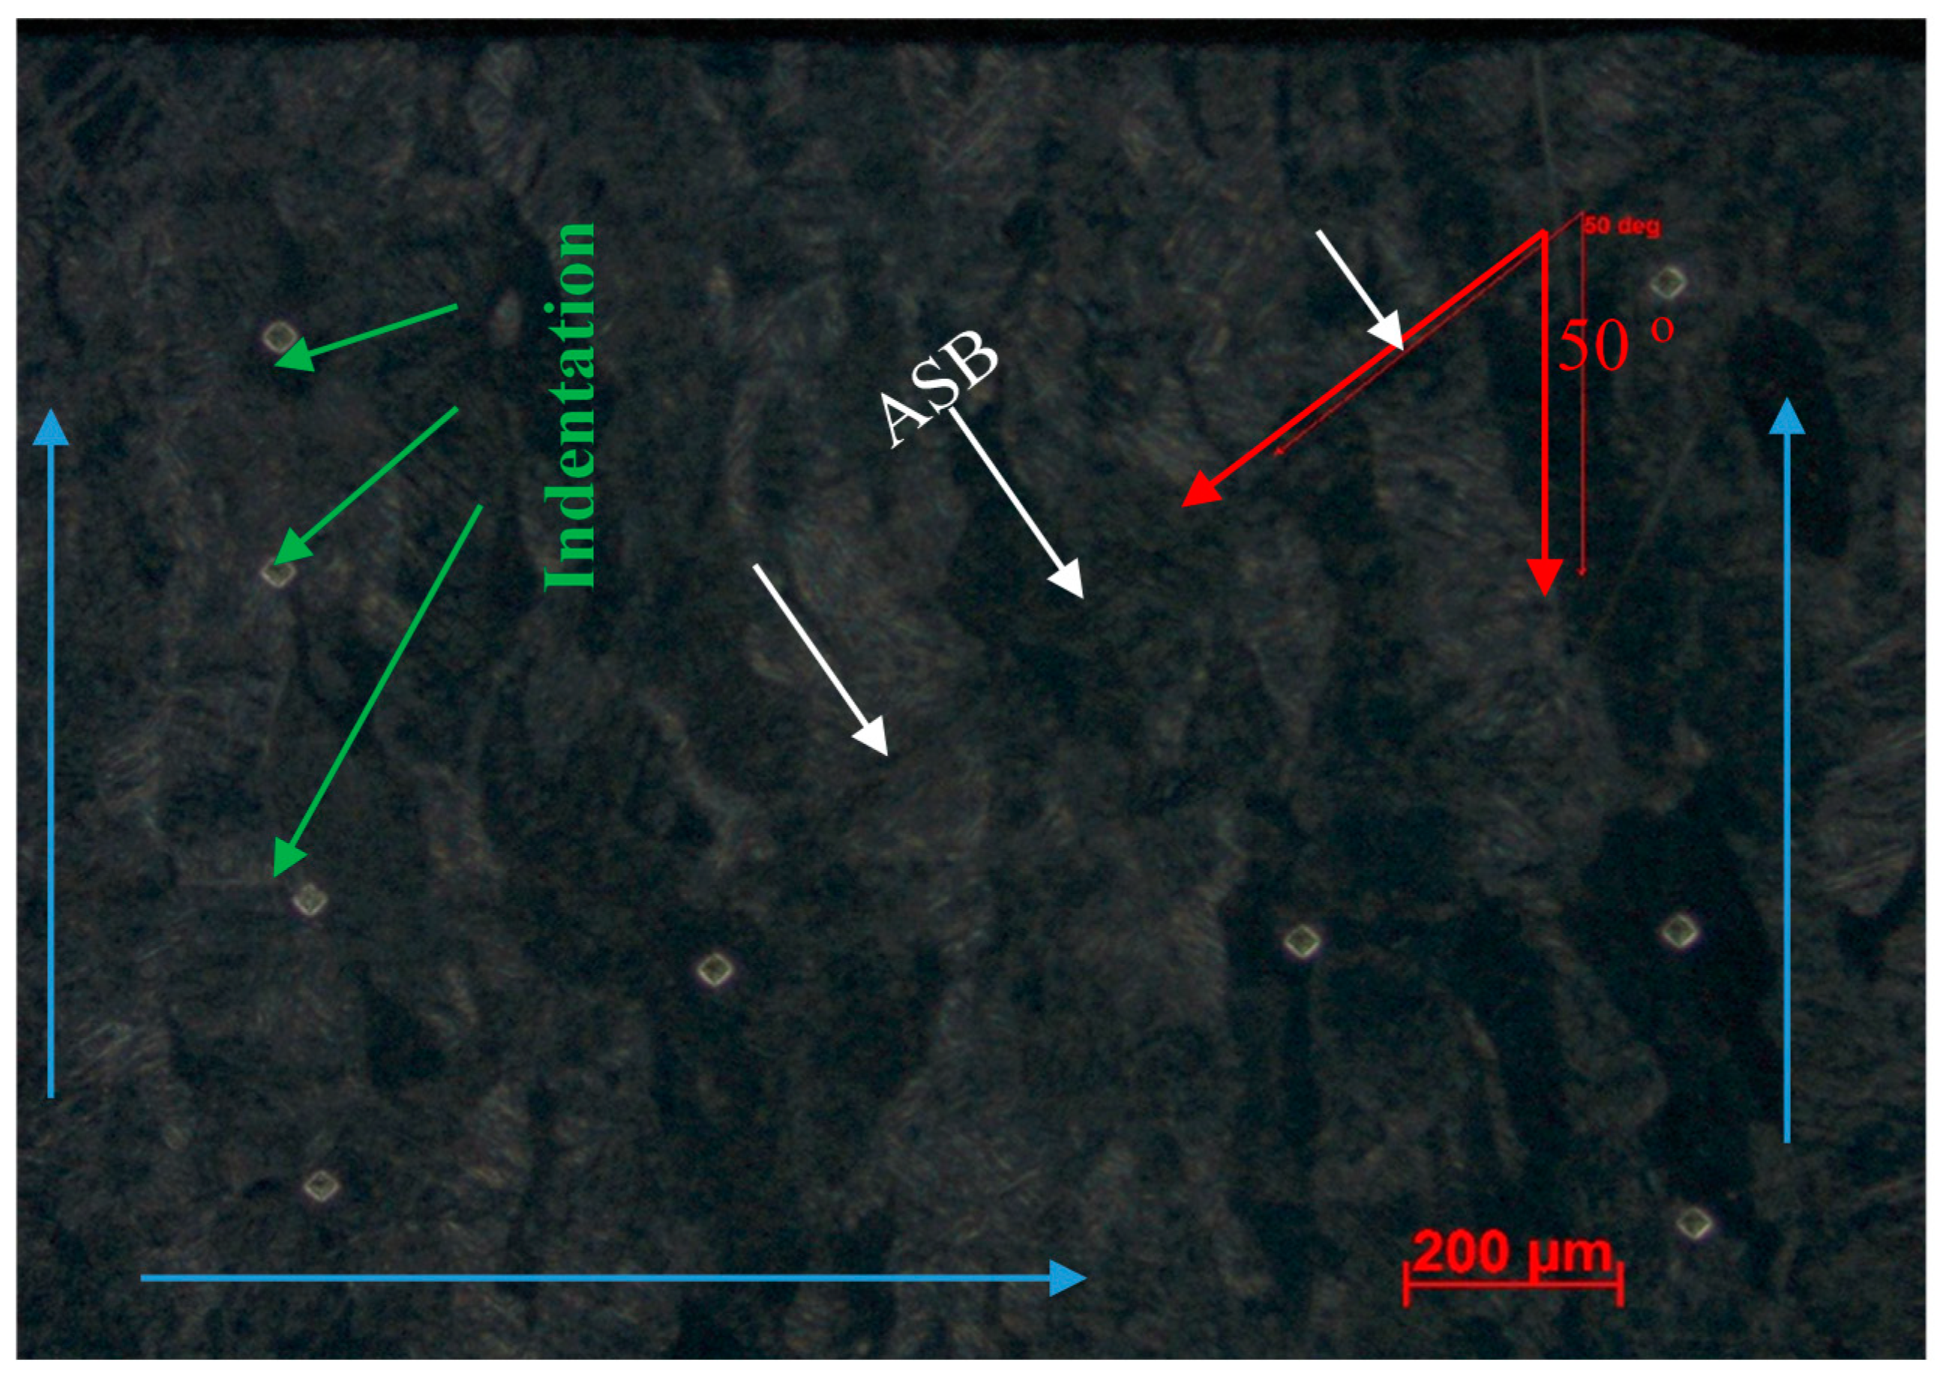
The values of microhardness for both the AB and SR specimens were higher for the higher compressive strain rates. However, microhardness was greater near the ASBs, and declined gradually towards the regions far from the ASBs.
(f)
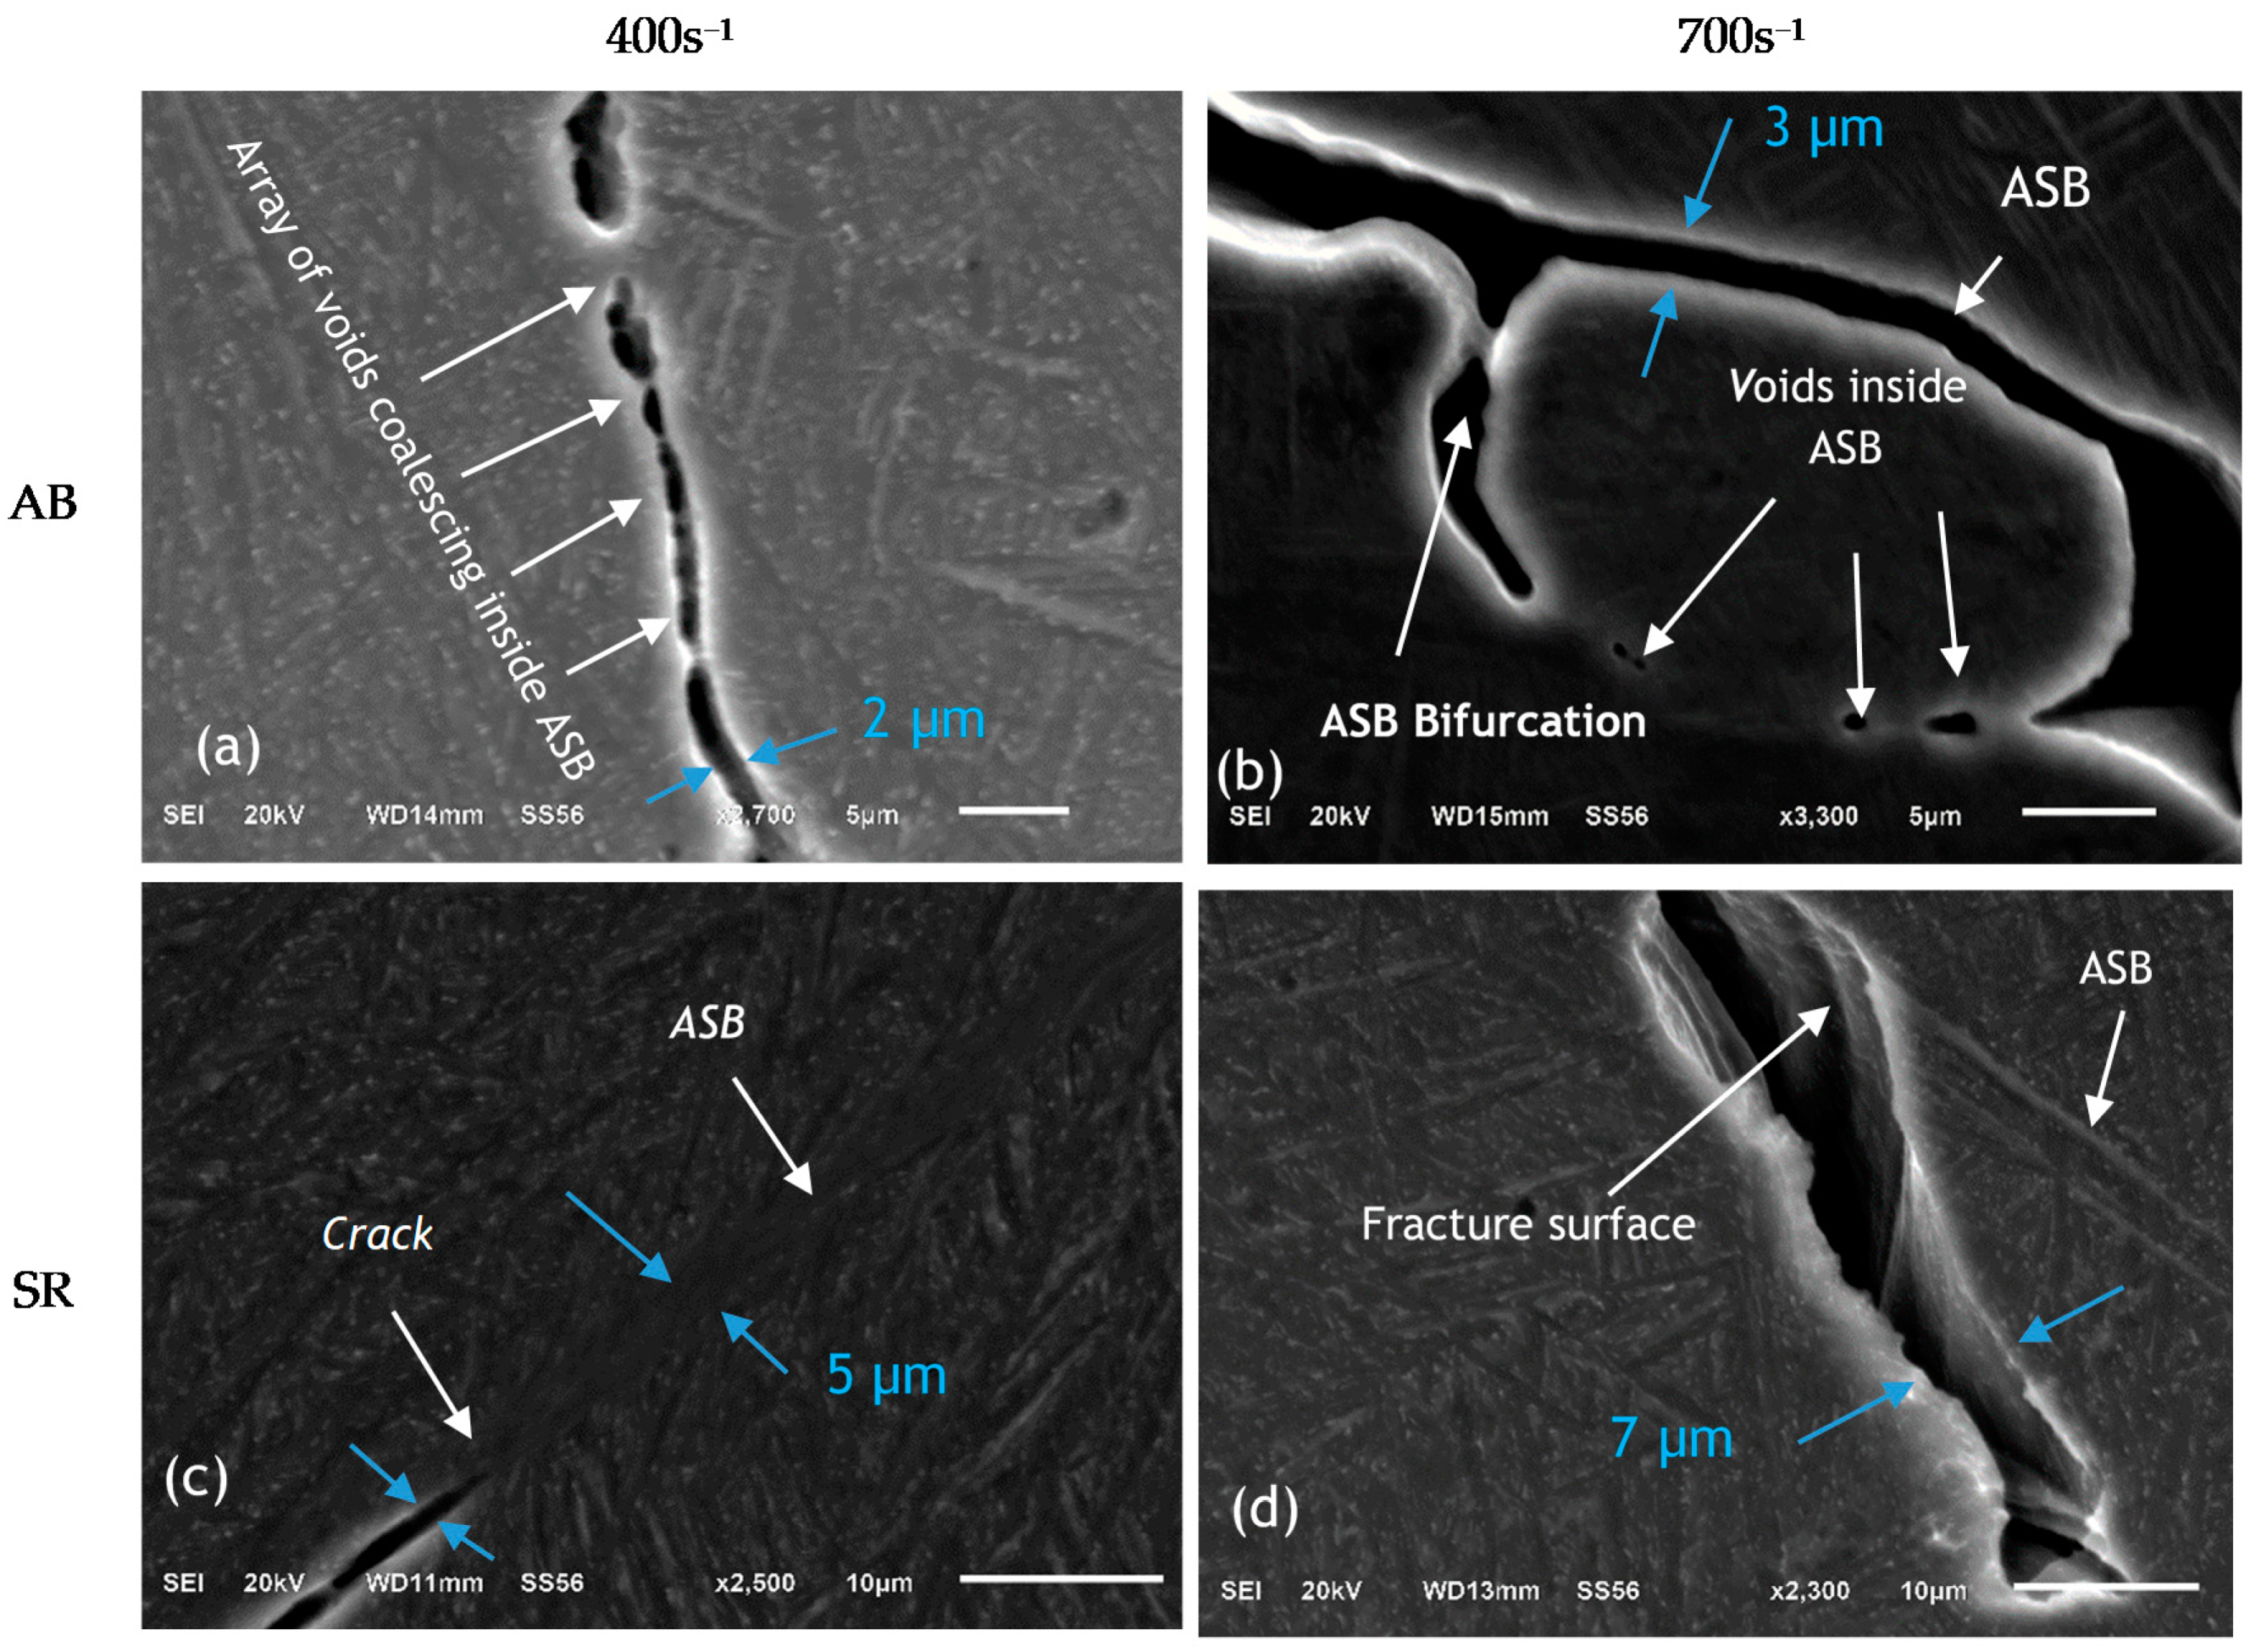
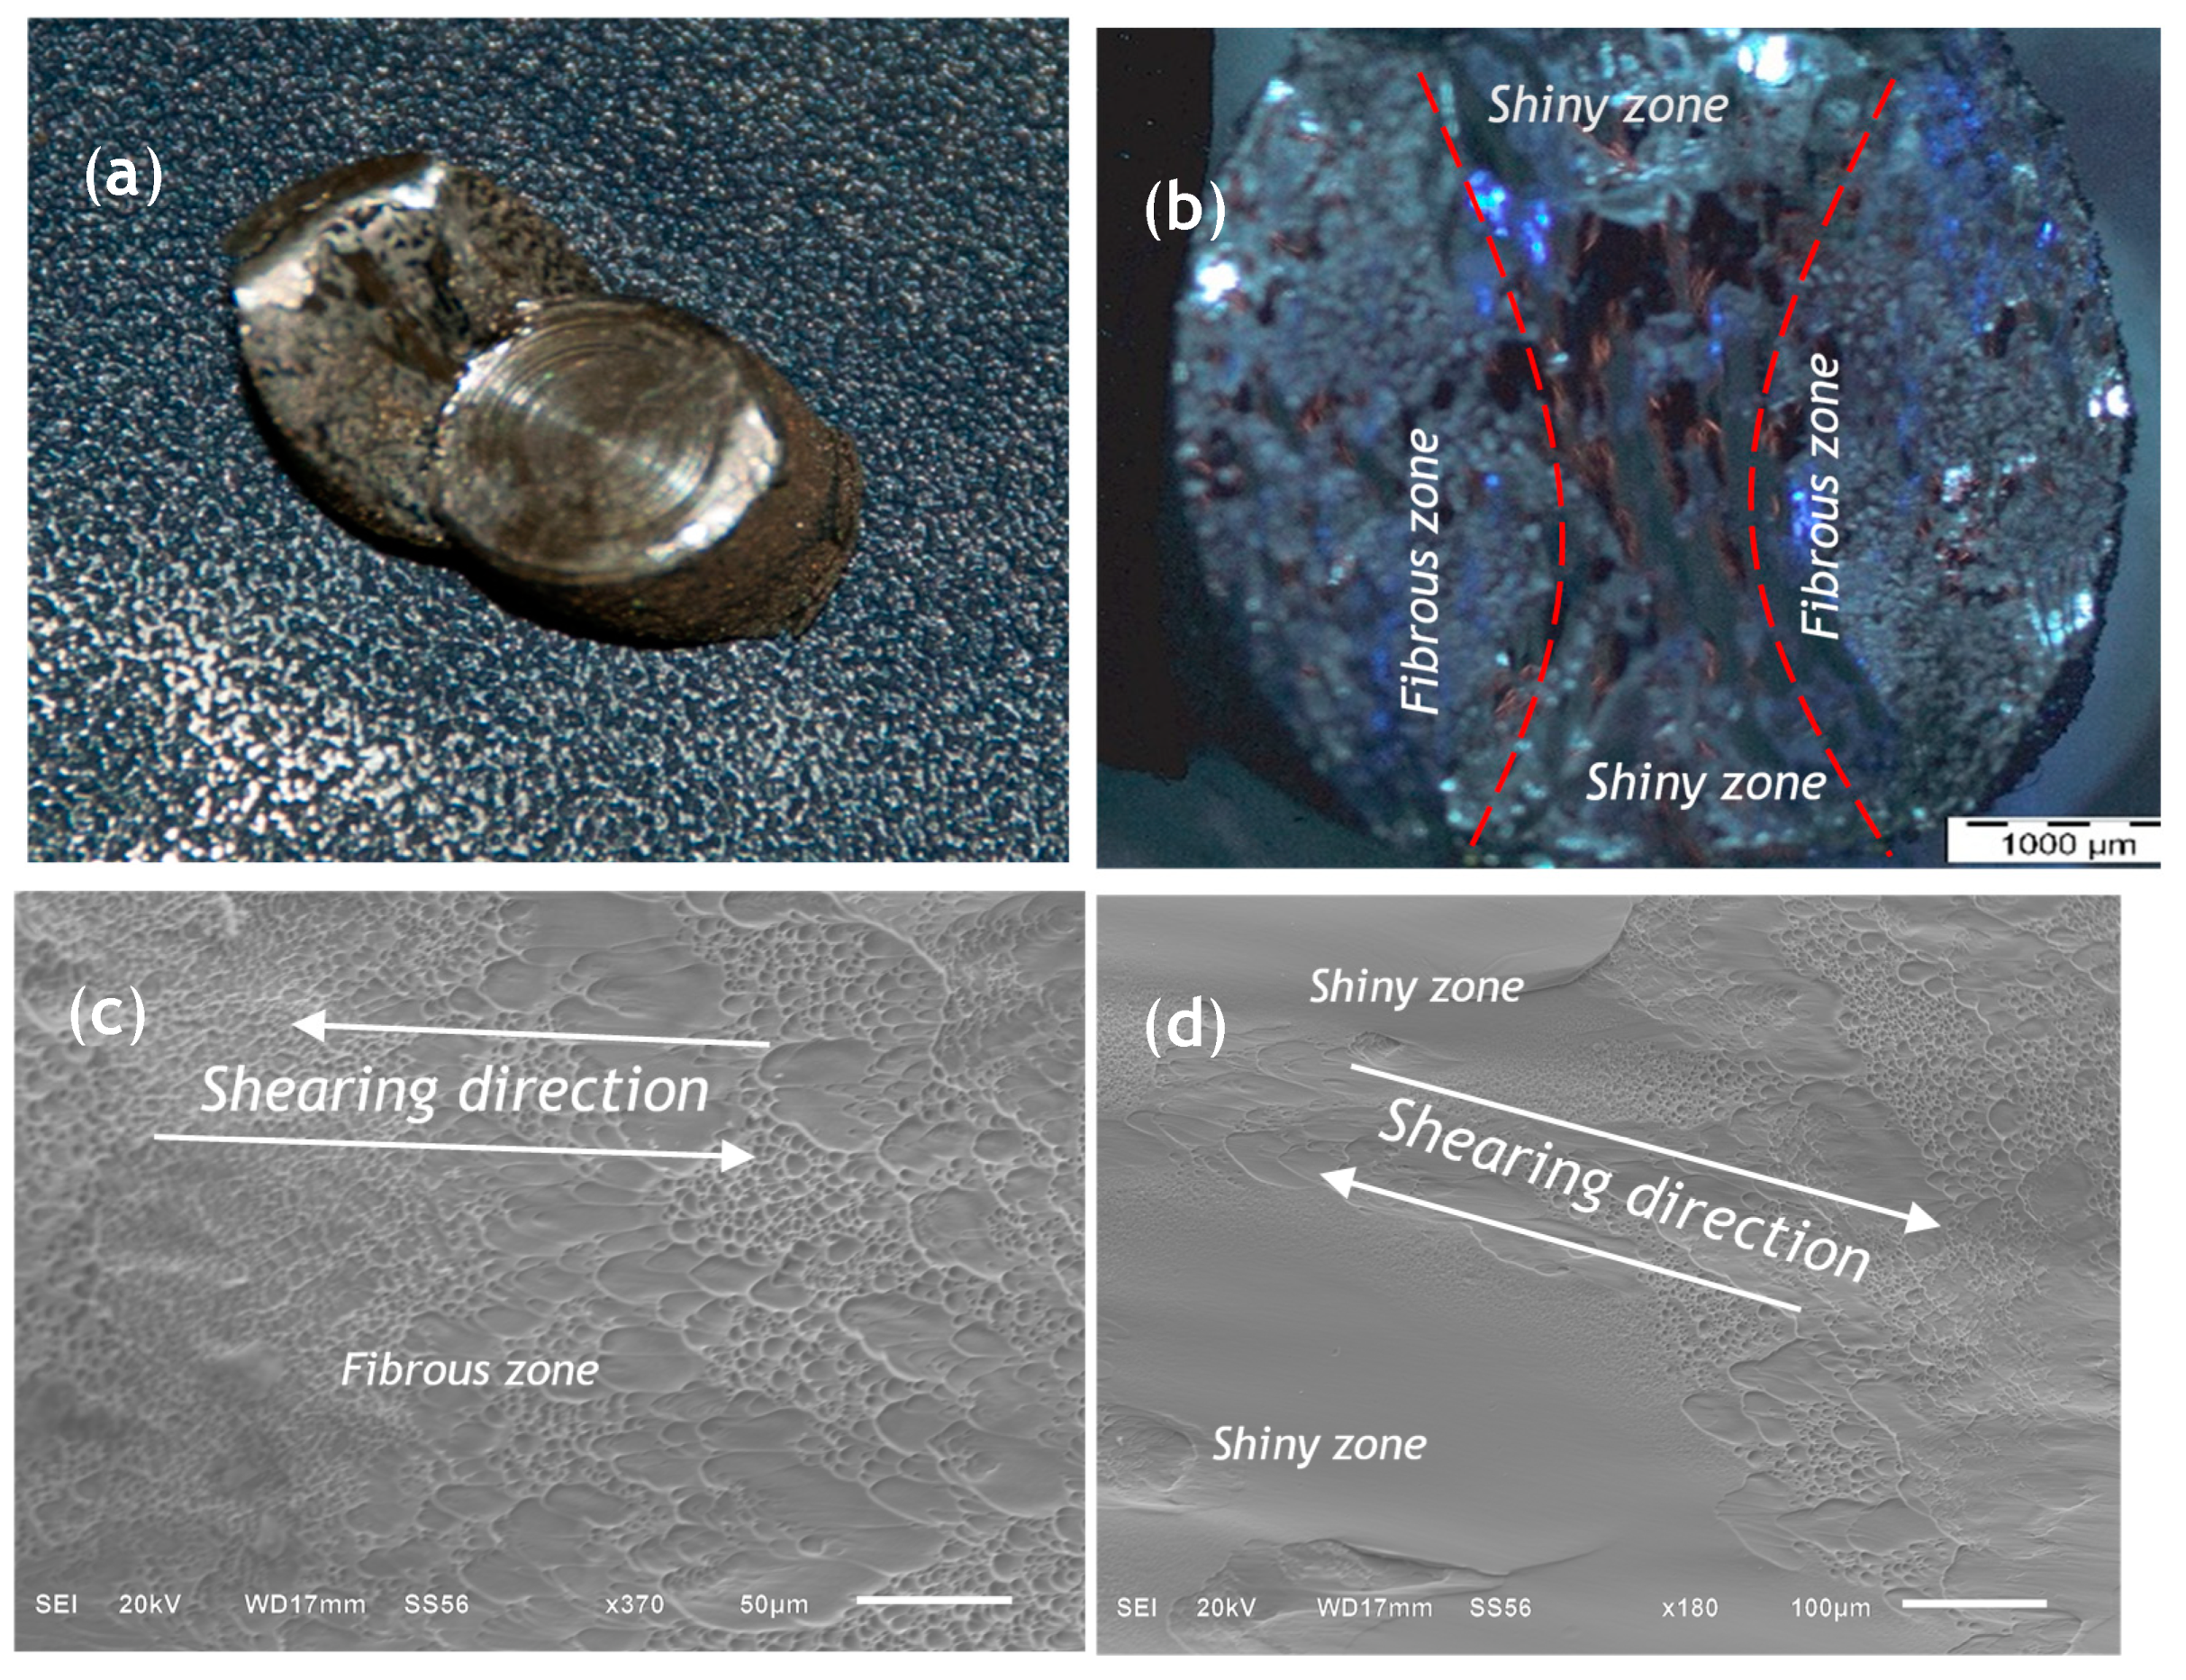
SEM image analysis indicated that the compressive fracturing of both forms of the alloy was a result of the development of ASBs for the two test strain rates.
(g)
At the same strain rate, the transformed ASBs for AB samples were narrower than those for the SR specimens.
Future work will be aimed at developing an ideal microstructure of DMLS-produced Ti6Al4V (ELI), with optimal strength and ductility, thereby enhancing high strain rate properties, for application in the aerospace sector, where such mechanical properties are vital for the reliability of parts.

Author Contributions

Conceptualisation, A.M., M.M., and W.d.P. and L.M.; methodology, A.M.; formal analysis, A.M.; writing—original draft preparation, A.M.; writing—review and editing, A.M., M.M., and W.d.P. and L.M.; supervision, M.M., W.d.P., and L.M.; funding acquisition, W.d.P. All authors have read and agreed to the published version of the manuscript.

Funding

This research was funded by the South African Department of Science and Technology (DST) through the Council for Scientific and Industrial Research (CSIR), for the Collaborative Program in Additive Manufacturing, Contract No.: CSIR-NLC-CPAM-18-MOA-CUT-01.

Acknowledgments

All Ti6Al4V (ELI) specimens were produced by the Centre for Rapid Prototyping and Manufacturing (CRPM) of the Central University of Technology, Free State (CUT), for which the authors express their gratitude. The Department of Mechanical Engineering of the University of Cape Town (UCT), through the Blast Impact & Survivability Research Unit (BISRU), is acknowledged for providing the facilities that were used for testing.

Conflicts of Interest

The authors declare no conflict of interest.

References

  1. Ivanova, O.; Williams, C.; Campbell, T. Additive manufacturing (AM) and nanotechnology: Promises and challenges. Rapid Prototyp. J. 2013, 19, 353–364. [Google Scholar] [CrossRef] [Green Version]
  2. Ralf, C.; Claus, A.; Coube, O.; Keith, M. Introduction to Additive Manufacturing Technology: A Guide for Designer and Engineers, 2nd ed.; European Powder Metallurgy Association: Shrewsbury, UK, 2015. [Google Scholar]
  3. DebRoy, T.; Wei, L.; Zuback, S.; Mukherjee, T.; Elmer, W.; Milewski, O.; Zhang, W. Additive manufacturing of metallic components–process, structure and properties. Prog. Mater. Sci. 2018, 2, 112–224. [Google Scholar] [CrossRef]
  4. Ikuhiro, I.; Tsutomu, T.; Yoshihisa, S.; Nozomu, A. Application and Features of Titanium for Aerospace Industry; Technical Review—Nippon Steel Technical Report No 106; Nippon Steel Corporation: Osaka, Japan, 2014. [Google Scholar]
  5. Properties: Titanium Alloys—Ti6Al4V Grade 5—AzoM.com. Available online: https://www.azom.com/properties.aspx?ArticleID=1547 (accessed on 28 April 2020).
  6. Reducing the Buy-to-Fly Ratio with Metal 3D Printing. Available online: http://www.materialise.com/en/manufacturing/whitepaper-buy-to-fly-ratio-cutting-costs-metal-3d-printing (accessed on 19 April 2018).
  7. Uriondo, A.; Esperson-Miguez, M.; Perinpanyangam, S. The present and future of additive manufacturing in aerospace sector: A review of important aspects. Proc. Inst. Mech. Eng. Part G J. Aerosp. Eng. 2015, 229, 1–16. [Google Scholar] [CrossRef]
  8. Patterson, E.; Sherri, L.; Messimer, L.; Farrington, P. Overhanging features and the SLM/DMLS residual stresses problem. Review and future research need. Addit. Manuf. Tech. 2017, 5, 15. [Google Scholar] [CrossRef]
  9. Rafi, H.K.; Karthik, N.V.; Gong, H.L.; Starr, S.E. Microstructures and mechanical properties of Ti6Al4V parts fabricated by selective laser melting and electron beam melting. Mater. Eng. Perf. 2013, 22, 3372–3383. [Google Scholar] [CrossRef]
  10. Todd, M.M.; Long, M.J. Mechanical behaviour of additive manufactured, powder-bed laser-fused materials. Mater. Sci. Eng. A 2015, 651, 198–213. [Google Scholar] [CrossRef]
  11. Moletsane, G.; Krakhmalev, P.; Du Plessis, A.; Yadroitsava, I.; Yadroitsev, I.; Kazantseva, I. Tensile properties and microstructure of direct metal laser-sintered Ti-6Al-4V (ELI) alloy. SAJIE 2016, 27, 110–121. [Google Scholar] [CrossRef] [Green Version]
  12. Du Plessis, A.; Ina Yadroistava, I.; Roux, S.; Yadroitsev, I.; Fieres, J.; Reinhart, C.; Rossouw, P. Prediction of mechanical performance of Ti6Al4V cast alloy based on microCT-based load simulation. J. Alloys Compd. 2017, 724, 267–274. [Google Scholar] [CrossRef]
  13. Yatnalkar, R. Experimental Investigation of Plastic Deformation of Ti-6Al-4V under Various Loading Conditions. Master’s Thesis, The Ohio State University, Columbus, OH, USA, 2010. [Google Scholar]
  14. Wulf, G.L. High strain rate compression of titanium and some titanium alloys. IJMSCI 1976, 21, 713–718. [Google Scholar] [CrossRef]
  15. Lee, W.-S.; Lin, M.-T. The effects of strain rate and temperature on the compressive deformation behaviour of Ti6Al4V alloy. J. Mater. Process. Technol. 1997, 71, 235–246. [Google Scholar] [CrossRef]
  16. Li, P.H.; Guo, W.G.; Huang, W.D.; Su, Y.; Lin, X.; Yuan, K.B. Thermomechanical response of 3D laser-deposited Ti–6Al–4V alloy over a wide range of strain rates and temperatures. Mater. Sci. Eng. 2015, 647, 34–42. [Google Scholar] [CrossRef]
  17. Mohammadhosseini, A.; Masood, S.; Fraser, D.; Jahedi, M. Dynamic compressive behaviour of Ti-6Al-4V alloy processed by electron beam melting under high strain rate loading. Adv. Manuf. 2015, 3, 232–243. [Google Scholar] [CrossRef]
  18. Bradley, D.; Yilong, B. Introduction to Adiabatic Shear Localization, Revised ed.; Imperial College Press: London, UK, 2015; pp. 29–32. [Google Scholar]
  19. Lee, W.-S.; Lin, C.-F. Plastic deformation and fracture behaviour of Ti–6Al–4V alloy loaded with high strain rate under various temperatures. Mater. Sci. Eng. 1998, 241, 48–56. [Google Scholar] [CrossRef]
  20. Lanyon, L.E.; Hampson, W.G.; Goodship, A.E.; Shah, J.S. Bone deformation recorded in vivo from strain gauges attached to the human tibial shaft. Acta Orthop. Scand. 1975, 46, 256–268. [Google Scholar] [CrossRef] [PubMed]
  21. Burr, D.B.; Milgrom, C.; Fyhrie, D.; Forwood, M.; Nyska, M.; Finestone, A.; Hoshaw, S. In vivo measurement of human tibial strains during vigorous activity. Bone 1996, 18, 405–410. [Google Scholar] [CrossRef]
  22. Hansen, U.; Zioupos, P.; Simpson, R.; Currey, D.; Hynd, D. The effect of strain rate on the mechanical properties of human cortical bone. J. Biomed. Eng. 2008, 130, 11–18. [Google Scholar] [CrossRef]
  23. Wood, P.K.; Schley, C.A. Strain Rate Testing of Metallic Materials and Their Modelling for Use in CAE Based Automotive Crash Simulation Tools (Recommendations and Procedures); Ismithers: Shrewsbury, UK, 2009. [Google Scholar]
  24. Wiesner, C.; McGillivray, H. Loading Rate Effects on Tensile Properties and Fracture Toughness of Steel; TAGSI Seminar; Imperial College: London, UK, 1999; Available online: https://www.twi-global.com/technical-knowledge/published-papers/loading-rate-effects-on-tensile-properties-and-fracture-toughness-of-steel (accessed on 3 April 2018).
  25. Wang, X.; Feng, Z.; Wang, F.; Yue, Z. Dynamic response analysis of bird strike on aircraft windshield based on damage-modified nonlinear viscoelastic constitutive relation. Chin. J. Aeronaut. 2007, 20, 511–517. [Google Scholar]
  26. Mango Planes Engine Damaged in Bird Strike at OR Tambo. Available online: http://www.traveller24.com/News/Flights/watch-mango-planes-engine-damaged-in-bird-strike-after-or-tambo-take-off-20171119 (accessed on 19 May 2018).
  27. Noori, S.A. Dimension effect on dynamic stress equilibrium in SHPB tests. IJMP 2014, 5, 15–26. [Google Scholar]
  28. Gray, G.T., III. Classic split-Hopkinson pressure bar testing. In ASM Handbook: Mechanical Testing and Evaluation; ASM International: Materials Park, OH, USA, 2008; Volume 8, pp. 462–476. [Google Scholar]
  29. Kariem, M.A.; Santiago, R.C.; Govender, R.; Shu, D.W.; Ruan, D.; Nurick, G.; Alves, M.; Lu, G.; Langdon, G.S. Round-Robin test of split Hopkinson pressure bar. Int. J. Impact Eng. 2019, 126, 62–75. [Google Scholar] [CrossRef]
  30. Yadroitsev, I.; Krakhmalev, P.; Yadroitsava, I.; Du Plessis, A. Qualification of Ti6Al4V ELI alloy produced by laser powder bed fusion for biomedical applications. JOM 2007, 70, 372–377. [Google Scholar] [CrossRef]
  31. Xue, Q.; Meyers, M.; Nesterenko, V. Self–organization of shear bands in Titanium and Ti6Al4V alloy. Acta Mater. 2002, 50, 575–596. [Google Scholar] [CrossRef]
  32. William, F.H. Mechanical Behaviour of Materials, 2nd ed.; Cambridge University Press: New York, NY, USA, 2010; p. 92. [Google Scholar]
  33. Sudhanshu, S.; Anuradha, N.M.; Chavan, V.M. Deformation response of Titanium alloy under static and dynamic loading. Procedia Eng. 2007, 173, 1894–1900. [Google Scholar]
  34. Kim, J.Y.; Shim, I.O.; Kim, H.K.; Hong, S.S.; Hong, S.H. Dynamic deformation and high velocity impact behaviors of TI-6Al-4V Alloys. Mater. Sci. Forum. 2007, 539, 2269–2274. [Google Scholar] [CrossRef]
  35. Wang, X.B. Effects of temperature and strain rate on the evolution of thickness of transformed adiabatic shear band. Solid State Phenom. 2008, 138, 385–392. [Google Scholar] [CrossRef]
Figure 1. The SHPB compression test setup, reproduced from [29], with permission from Elsevier, 2019.
Metals 10 00653 g001
Figure 2. The voltage output from the strain gauges after filtering out noise in a typical compression test.
Metals 10 00653 g002
Figure 3. Illustration of typical indentations made on the cut surfaces of the specimens. The blue and red arrows show the direction of indentation and inclination of adiabatic shear bands (ASB), respectively.
Metals 10 00653 g003
Figure 4. Typical optical micrographs of the as-built (AB) (a,c) and stress-relieved (SR) (b,d) transverse and longitudinal sections of the specimens in relation to the build direction, respectively.
Metals 10 00653 g004
Figure 5. Typical imposed strain rate vs. time history for the 6 mm and 10 mm AB specimens.
Metals 10 00653 g005
Figure 6. Typical stress, strain rate and the strain against time graph for a 6 mm long SR Direct Metal Laser-Sintered (DMLS) Ti6Al4V specimen.
Metals 10 00653 g006
Figure 7. Stress–strain curves for the six SR specimens of 6 mm length, tested at a strain rate of approximately 400 s−1.
Metals 10 00653 g007
Figure 8. The resultant average compressive true stress–strain curves for the AB and SR samples at two different strain rates.
Metals 10 00653 g008
Figure 9. The values of mean Vickers microhardness for DMLS Ti6Al4V (ELI) for different load conditions in HV200g.
Metals 10 00653 g009
Figure 10. Variation in the microhardness of a typical section of the ASB at a small load of 10 g.
Metals 10 00653 g010
Figure 11. Typical optical micrograph and schematic description of the failure surfaces of a loaded specimen.
Metals 10 00653 g011
Figure 12. SEM-SEI of deformed (shearing martensite) (a,b) and transformed adiabatic shear bands (b,c) in DMLS Ti6Al4V (ELI).
Metals 10 00653 g012
Figure 13. SEM-SEI of deformed adiabatic shear bands for AB samples (a,b), while panels (c,d) show the SR samples (a,c) tested at a strain rate of 400 s−1 and (b,d) at 700 s−1.
Metals 10 00653 g013
Figure 14. Typical photograph (a), optical micrograph (b) and secondary electron images (c,d) of the fracture surfaces of DMLS Ti6Al4V (ELI), showing fibrous and shiny zones.
Metals 10 00653 g014
Table 1. Actual levels of strain rate in the human body, and structural parts under various conditions.
Strain Rates (s−1)ConditionsStrained PartsRef.
0.004WalkingTibia and cortical bones[20]
0.05Sprinting and downhill runningHuman bones[21]
1–50Traumatic fracture events (accidents)Human bones[22]
1–500Automotive crashAutomobile body parts[23]
10–1000Aircraft undercarriageLanding gears[24]
Table 2. Chemical composition of TLS Technik GmbH Ti6Al4V (ELI) alloy powder (wt. %).
MaterialsAlVFeCONHTi
Wt. %6.343.9440.250.0060.0820.0060.001Bal.
Table 3. Conditions of the specimens after dynamic compression testing.
SpecimensAs-built (AB)Stress Relieved (SR)
Plastic strain rates (s−1)400700400700
No. of fractured specimens1325
No. of unfractured specimens6452
Total7777
Table 4. Experimental values of relative strain rate sensitivity.
Strain0.020.040.080.12
Form of samplesStrain rate sensitivity (m)
AB0.0740.0640.001−0.04
SR0.1830.1820.150.09
Table 5. A comparison of the flow properties of SR DMLS Ti6Al4V (ELI) samples in the present work with those reported in the literature for wrought Ti6Al4V (ELI).
Ti6Al4VMicrostructureStrain Rate (s−1)YS (MPa)UCS (MPa) ε f Ref.
DMLS-SRMartensitic400122515250.174Present study
DMLS-SRMartensitic700140215500.135Present study
WroughtΑ + β lamellar1100113011800.180[33]
Wroughtα + β lamellar4100137614000.300[33]
Wroughtα + β Equaxied2630121013460.320[34]
WroughtΑ + β Equaxied6400138514100.270[34]
YS: Yield Strength, UCS: Ultimate Compressive Strength: ε f -fracture strain.

