Abstract
A honeycomb impact attenuator for a Formula SAE (FSAE) prototype vehicle is examined using both experimental and numerical analyses. Two common FSAE impact attenuators were compared to a new design concept, combining four layers of hexagonal honeycomb. The comparison aimed to obtain the combination of the lowest mass and highest energy absorption. The attenuator must comply with both the FSAE championship rules and further internally-defined design constraints. The work continues addressing the numerical-experimental correlation of the applied materials. Finally, the finite element models for virtual crash testing are presented and were validated through the experimental tests.
1. Introduction
In an open-wheel racing car, the impact attenuator system is the most important passive safety component. It consists of an impact attenuator (IA) and an anti-intrusion plate (AIP). The IA has to absorb most of the kinetic energy during a frontal crash event and simultaneously contain the acceleration peak, while the AIP needs to protect the driver’s legs from any intrusion in the cockpit zone.
Aluminum alloys are widely employed as thin-walled structures for crashworthy applications in the automotive field (e.g., crash absorbers, bumpers, and sills [1]). Munusamy and Barton [2] proposed a front IA made of an array of thin-walled aluminum tubes that were either empty or filled with honeycomb. A similar solution was investigated by theoretical analyses and numerical simulations in [3], showing that filling the box column with aluminum honeycomb may be preferable to thickening the column wall. Zarei and Kröger [4] proposed an optimization method to maximize the energy absorption of a honeycomb-filled crash absorber.
The mechanical properties and crashworthiness of honeycomb structures are well-known. These properties were extensively studied by adopting theoretical [5,6], numerical [7,8], and experimental [9] approaches. Fahland et al. [10] presented an analytical and experimental evaluation of aluminum honeycomb cubic IAs by varying their impact area. The experimental results were in good agreement with the analytical ones, and the best solutions satisfied the design constraints prescribed by FSAE.
The elasto-plastic response of aluminum alloys is strain-rate dependent. This effect plays an important role in the material energy absorption capability [11]. The strain rate sensitivity of aluminum alloys has been studied using dynamic tension and compression tests in [11,12,13] and a different material model has been implemented in numerical analyses.
The effect of strain-rate on the out-of-plane compression of aluminum honeycomb structures and foams has been extensively studied [9,10,11,12,13,14,15]. The plateau stress of the honeycomb increases as the strain rate increases. Tao et al. [16] developed a strain-rate dependent theoretical model in order to simulate the mechanical response of honeycomb cells during impact loading.
Finite Element (FE) modeling of honeycomb structures have been performed using a detailed representation of the hexagonal cells by shell elements [7,17] or by an orthotropic solid continuum based on its homogenized elasto-plastic properties [18,19,20,21].
In order to maximize both energy absorption and specific energy absorption, Ghamarian and Zarei [22] performed a multi-objective optimization on aluminum conical thin-walled crash absorbers. The optimal solution was a hollow cone with a wall thickness of 1.1 mm, a semi-apical angle of 9.4 degrees, and a base diameter of 69.4 mm. Conical shapes are very common for crash absorbers in sports cars such as Formula 1 [23] and FSAE [21].
Nowadays, carbon fiber reinforced polymers (CFRPs) are a promising alternative to conventional metals due to their extraordinary specific energy absorption capability [24,25]. Applications in the automotive field are also reported in [26]. Obradovic et al. [27] and Wang et al. [28] investigated truncated pyramidal IAs with an almost rectangular cross-section in CFRPs. Obradovic et al. [27] proposed a design with three different thicknesses across the longitudinal axis. Wang et al. [28] introduced ribs on the cone surface and performed a numerical optimization of the stacking sequence. The CFRPs showed a brittle failure mechanism, which was more complex than its metal counterpart to correlate with numerical failure models.
This work presents the design of an IA and AIP in a single-seater open-wheel racing car. After a literature review, three solutions were investigated: (i) a honeycomb crash-box and carbon fiber-reinforced polymer(CFRP) composite laminate such as AIP; (ii) an aluminum hollow truncated pyramid welded onto an aluminum plate; and (iii) four layers of honeycomb in a pyramidal shape, linked together between thin CFRP plates. The design method was applied to the impact attenuation system of a Formula SAE racing car. The IA was designed according to the rules of the competition, and internally defined criteria.
The design process brings together numerical simulations with experimental campaigns. The quasi-static compression behavior of a honeycomb structure and the elastic-plastic behavior of the CFRP laminates were evaluated. These tests were carried out to ensure a good predictivity of the FE models of the three IA designs. Finally, experimental tests were carried out to validate the designed IA configurations.
2. Materials and Methods
2.1. Target Setting
The rules of the competition prescribe an experimental validation of the frontal passive safety system of the prototype (see T2.25 in [29]), which reproduces the frontal crash of a standardized FSAE prototype.
In accordance with the prescriptions given by the rules, the test was performed by sending a sledge toward a rigid wall at a velocity (v) of 7 m/s.
The experimental setup is shown in Figure 1: A test bulkhead was mounted at the front of the sledge made of steel tubes and plates, and provided the holes on which the AIP was mounted. The mass of the sledge, the test bulkhead, and the IA system (Mtot) was 300 kg. The sledge was bounded to translate in the longitudinal direction and was pushed toward the rigid wall with bungee cords. Two accelerometers were mounted at the back of the sledge to measure the acceleration during the impact test and the kinetic energy (Ek) was measured by weighing the sledge and measuring its speed with photocells placed close to the wall (Equation (1)). The position of the photocells was adjusted to measure the speed of the sledge right before the beginning of the impact. A sensor was placed at the front of the impactor to determine the exact moment at which the impact began.
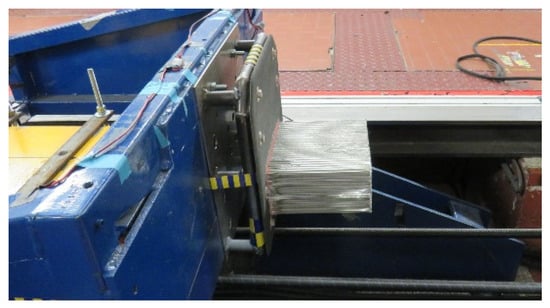
Figure 1.
Experimental crash test.
The initial velocity of the test determined the initial strain rate at which IAs were compressed, which was between 33 and 35 s−1. At the end of the impact test, the permanent deflection of the AIP as well as the total axial deformation of the IA were measured.
The rules [29] established the structural requirements for the IA and are summarized in Table 1.

Table 1.
Type approval parameters.
The impact attenuator system needs to absorb enough kinetic energy through deformation, so an average force Fave was defined considering Equation (2):
where Fave is proportional to the acceleration of the sledge. Elevated accelerations lead to a high risk of injury for the driver [30], thus the crushing behavior of the IA thus needs to be chosen with care.
2.2. Preliminary Analysis
The first step was to identify the requirements of the impact attenuator system. All of the features of the new design constraints were analyzed in terms of compliance with the rules, costs, and performance and defined as the ratio between the absorbed energy and the mass of the attenuator. Respecting the rules of the competition was clearly mandatory, while the performance and costs needed to be maximized and minimized, respectively.
The rules prescribe that the impact attenuator system be composed of two main components: the impact attenuator (IA) and the anti-intrusion plate (AIP). The system must be properly mounted onto the bulkhead at the front of the chassis. The rules establish the minimum dimensions for the IA and the performance targets in terms of deceleration, maximum deflection of the system, and absorbed energy (as described in Table 1). The AIP must protect the driver’s feet by avoiding excessive intrusion at the front of the chassis. The rules also establish which materials are acceptable for the AIP. All of these requirements are mandatory for the IA system to be admitted to the competition.
Aside from the regulations, the first aim is to maximize the performance of the system. Weight reduction is a milestone in the design and development of a race car, as a lower weight guarantees a competitive advantage, and the passive safety systems are not excluded. The aim of this paper was to maximize the specific energy absorption (SEA) of the impact attenuator system. SEA is the energy absorbed during the impact per unit mass.
Another non-secondary aim is containing the costs of the final product. Therefore, the materials and the manufacturing processes need to be chosen carefully.
FSAE teams adopt different layouts and materials for their impact attenuator system. Despite the different configurations, the AIP is usually made of CFRPs. Three of the most popular layouts of the IA were considered in the initial phase of the design development, as shown in Figure 2. All these possible solutions were compared considering the requirements previously mentioned.
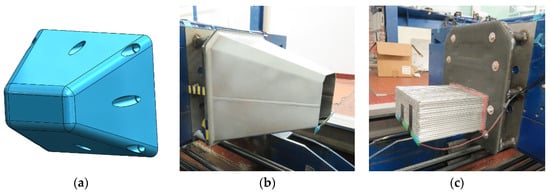
Figure 2.
(a) Standard foam IA (impact attenuator), (b) aluminum hollow truncated pyramid IA, (c) aluminum honeycomb crash-box.
The first IA (Figure 2a) was a truncated pyramid made of several layers of a homogeneous high-density polymeric foam. FSAE proposes this as a standard design for its competitions. Thus, this design fully complies with the regulations. However, this solution has several drawbacks. First, it is shaped like a pyramid, so, as the impact proceeds, it touches the wall with a larger and larger area. As the response of the foam is dependent on its relative density [18], the response of the wall increases as the IA crushes into it. A more efficient way to manage the impact is to keep the wall response constant throughout the impact. Second, while the foam is crushed, the stresses on the AIP surface are at their maximum at the center of the plate. This stress distribution requires a strong AIP to contain its maximum deflection in a frontal crash.
The need for a strong structural AIP is due to the geometry of the front bulkhead (Figure 3a). This section has a frontal opening, which is used for maintenance (i.e., adjustments of the pedal set). To reduce the structural mission of the AIP, the load paths need to be directed toward the stiffest and most resistant zone of the bulkhead (i.e., the external edge). With this setup of the IA, the center of the AIP would be unloaded during a frontal crash, and its weight could be reduced considerably.
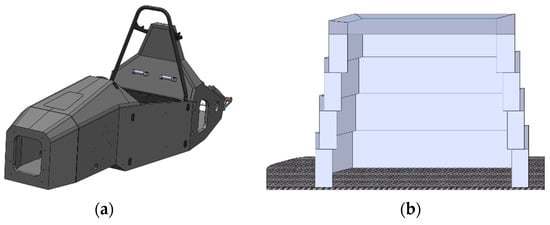
Figure 3.
(a) Isometric view of the FSAE (Formula SAE) prototype chassis (M19-L MoRe Modena Racing Team). (b) Section view of the hybrid IA.
An example of this setup is the thin-walled pyramidal IA (Figure 2b). The choice of the material is delegated to the team, and some FSAE [27,28] and F1 teams have designed a CFRP pyramidal IA [23]. CFRPs present the highest performance in terms of absorbed energy-to-weight ratio. However, the materials and manufacturing processes involved have high financial costs. Herein, a truncated pyramid-shaped IA (Figure 2b) was investigated and obtained by bending and welding three aluminum plates with a thickness of 2 mm. This IA was a fraction of the cost of its CFRP counterpart because of its simple technological process.
The weight of the IA may be reduced considering an aluminum honeycomb (Figure 2c). A hexagonal honeycomb was chosen because of its superior energy-absorption properties among all the other honeycombs. The honeycomb IA has a simple geometry and can be designed according to the minimum dimensions established by the competition rules [29]. Nevertheless, the AIP needs to have a high level of stiffness, strength, and therefore weight, in order to respect the rules of the competition. In fact, when the IA system impacts a wall, the load paths are directed toward the center of the AIP.
A third IA, shown in Figure 3b, was also developed in this study. It integrates the advantages of the two previous designs: hollow geometry of the thin-walled aluminum pyramid absorber, orienting the load paths to the stiffer zone of the bulkhead; and the high specific energy absorption and low weight of the aluminum.
The energy absorber was composed of four aluminum honeycomb layers, each with a thickness of 50 mm. The cross-sectional area of the layers was hollow and varied on the longitudinal direction to guide the load paths to the structural members of the bulkhead. Four CFRP plates were glued to the honeycomb layers to guarantee their proper folding. Finally, the IA was glued to the CFRP AIP, which was bolted to the bulkhead of the CFRP monocoque (Figure 3a).
To the authors’ knowledge, an IA like the one shown in Figure 3b has never been previously presented. In this work, the hybrid IA was dimensioned, simulated, and tested for validation under the FSAE rules. Large use of the finite element (FE) methods was made to obtain a predictive numerical model before the actual impact testing.
2.3. Dimensioning the Impact Attenuator
This section shows some preliminary analytical calculations made to dimension the cross-sectional area of the hybrid impact attenuator.
The maximum acceleration admitted during the impact test (amax) was 20 g. It may be associated to a maximum average crushing force (Fave) as follows:
Fave = Mtot·amax = 300 kg·20·9.81 m/s2 = 58,860 N
In this paper, a hexagonal honeycomb made of an Al5052 aluminum alloy was used. Table 2a shows the specifications of the honeycomb. The data were collected from the manufacturer’s datasheet, except for the crushing stress (σcr), which was obtained from the quasi-static compression tests shown in Section 2.5.
Table 2.
(a) Plascore® PAMG-XR1 5052 honeycomb specifications. (b) Area of the cross section of each layer.
Dividing by leads to the average cross-section of the impact attenuator (). However, is the force developed during an impact, while is related to a quasi-static test. To take into account the dynamic response of the honeycomb, was penalized by multiplying it to a safety factor . The average cross section of the honeycomb is:
Table 2 shows the cross-sectional area chosen for each honeycomb layer. The average of the four areas was close to .
The deflection of the honeycomb due to the impact () was obtained by reversing Equation (2): is the minimum length for the honeycomb IA. However, the overall axial length of the honeycomb was sensibly increased in order to avoid the densification phase during the impact. In fact, when the honeycomb is in the plateau phase of its collapse, it absorbs energy in its most predictable and efficient way.
2.4. Bulkhead Structural Equivalence
The experimental crash test was performed by mounting the IAs on the front test bulkhead made with steel tubes and plates. Since the FSAE vehicle chassis is a CFRP monocoque, the structural equivalence needs to be proven between the actual bulkhead and the steel test bulkhead.
The steel test bulkhead was built according to T.2.5.1 in [29]. Six longitudinal tubes were joined to a hexagonal frame made of welded tubes. A steel plate was then welded to the front hexagonal frame. This plate was used to mount the IAs onto the test bulkhead.
The tubes had an outer diameter of 24 mm and a wall thickness of 1.6 mm. The length of the longitudinal tubes was chosen to guarantee a 50 mm rearward clearance. The steel plate at the front of the test bulkhead had a thickness of 1.50 mm, as prescribed by the rules. The geometry of the steel plate was exactly the same as the bulkhead of the CFRP monocoque prototype, so the IAs could be mounted with the same mounting system either on the monocoque or on the test bulkhead.
The front bulkhead of the race car prototype was a simple sandwich panel, in which two CFRP laminates with a thickness of 1.61 mm were separated by a honeycomb core with a thickness of 19.5 mm. This frontal sandwich panel was supported from its back by the panels of the primary structure.
Table 3 shows the main dimensions of the two bulkhead structures as well as the Young’s modulus and shear strength of the materials involved in the two structures. The mechanical properties of the CFRP laminates (EFront, EBack, and UTSCFRP) were obtained with experimental tests performed by the FSAE team, while the homologous properties of the steel were suggested by the rules [29].
Table 3.
Structural equivalence data.
The rules prescribe that in the structural equivalence, the two bulkhead structures should be treated like two flat panels. The proof of structural equivalence consists of evaluating the flexural modulus (EI) of the two panels subjected to a bending around their neural axes. The section under exam is the A–A section represented in Figure 4a.
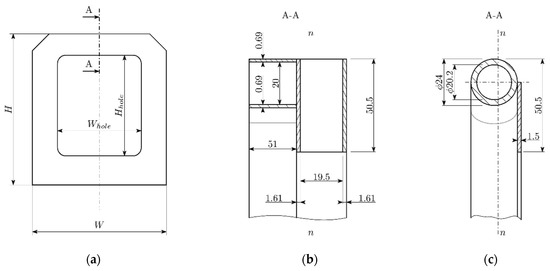
Figure 4.
Front view of bulkhead plate (a), critical section of the carbon fiber reinforced polymer (CFRP) bulkhead (b) and the steel test bulkhead (c). (unit: mm)
For both the steel and the CFRP bulkhead, the critical section has two symmetrical areas working in parallel, thus the EI of the section can be obtained by doubling the EI of one half of that section. Figure 4b,c show the two sections, highlighting the n–n axes, around which the moments of inertia were calculated. For the CFRP structure, the contribution of the honeycomb core was neglected.
The steel and the CFRP bulkhead structures must also have the same strength. This time, the equivalence was proven on the perimeter shear strength (). PSS is the longitudinal force needed to cause a shear rupture on the frontal outer skin of the front bulkhead. is calculated by multiplying the shear strength of the outer shell by its minimum transversal area. The shear strength of the CFRP front laminate (Table 3) was determined with an experimental shear test, performed by the FSAE team according to the prescriptions given in [29]. Once again, the A–A section in Figure 4a was considered as the critical cross-section to calculate the PSS. The of the CFRP lamina of the chassis must be higher or equal to the of the steel plate of the test bulkhead. Equations (9)–(11) show that the bulkhead and the test bulkhead are equivalent.
2.5. Material Characterization
The following design phase concerns the creation of three finite element (FE) models of the three impact attenuators under examination. The FE models were used to give a numerical prediction of the crash tests on the three IA designs before the actual impact tests. Therefore, the elastic and plastic properties of the materials involved must be carefully assessed.
The AIPs of the three IAs were modeled as a single CFRP laminate. A T700 prepreg fabric was employed for all AIPs, adopting a suitable stacking sequence according to the structural requirements. The mechanical properties of the composite were obtained with an experimental characterization, which included tensile tests, compressive tests, in-plane and out-of-plane shear tests, and a low-velocity impact test. All tests followed their relative ASTM standard. The elastic properties resulting from the experimental tests were in close agreement with the corresponding data given in the manufacturer’s data sheet. The crash survivability (CRASURV) criterion was applied to determine the material’s failure, and all the relative parameters were obtained from the results of the experimental tests. More details on the mechanical properties and the failure model are shown in Appendix A.1.
A standard steel alloy was adopted to model the bolts and the parts of the front test bulkhead. The plastic behavior was modeled with the Johnson–Cook model; in this case, the effects of the strain rate on the plastic behavior was neglected.
An experimental campaign was performed to derive the elastic and plastic behavior of the honeycomb material under compression. Six samples were obtained from a hexagonal aluminum honeycomb with a cell size of 4.8 mm and a shell thickness of 0.0508 mm (see also Table 2). Each specimen extended by 50 mm in the out-of-plane direction, and 140 mm and 19.5 mm in the two in-plane directions.
The samples were tested with an Instron® 5567 universal testing machine (Instron, Norwood, MA, USA) (Figure 5) mounting a 30 kN load cell. The tests were performed with a constant crossbar speed of 1 mm/min, leading to a constant strain rate of 3.33 × 10⁻⁴ s−1.
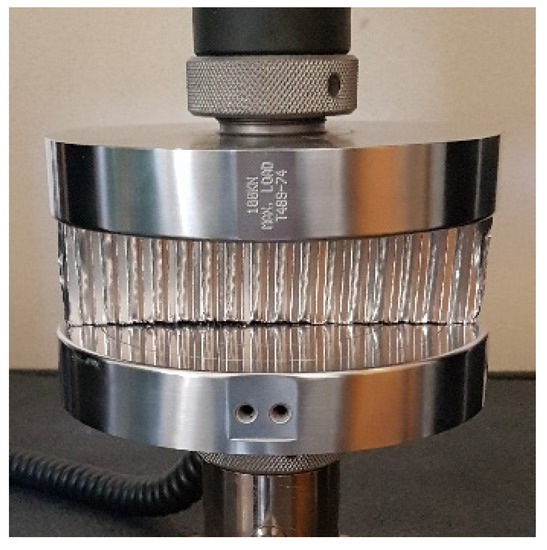
Figure 5.
Test sample under compressive test.
The resulting stress–strain curve was in close agreement with the theory [18]. There are three separate zones: namely the initial linear elastic zone, intermediate plateau zone, and final stress densification zone (Figure 6a). The IA design aims to prevent the densification of the material in order to monitor the average force during the impact event.
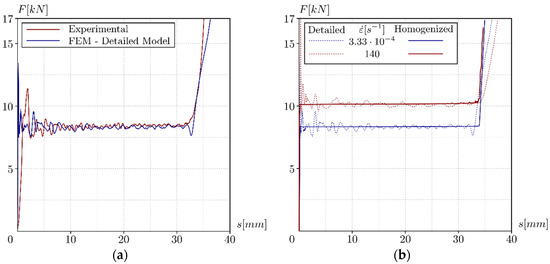
Figure 6.
(a) Numerical-experimental correlation of the quasi-static compression test; (b) correlation of the two compression test simulations at two strain rates.
The results of the experimental tests were exploited to correlate the elasto-plastic behavior of the 5052 aluminum alloy of which the honeycomb was made. The experimental test was reproduced with a FE simulation. The FE model replicated the honeycomb geometry in detail.
The detailed honeycomb model was modeled with 215,500 four-node quadrilateral Mindlin shell elements with a size of 0.2 mm. The mesh size was chosen to seize the local folding mechanisms of the honeycomb cells. The thickness of the elements is in line with the actual foil. The elements at the junction of two foils were doubled in thickness. The honeycomb was put on a rigid plane and compressed with a second rigid plane, moving with a constant velocity. Friction between the plates and the honeycomb were considered by adopting a static Coulomb friction coefficient of 0.6.
The relation between the plastic stress () and plastic strain () of the aluminum Al5052 was modeled by the Cowper–Symonds law:
A, B, and n were adjusted to correlate the crushing response of the FE model with the experimental data (further details are in Appendix A.2). Particular attention was put in correlating the average crushing force (Fave) of the honeycomb, as this property has great importance in the honeycomb’s energy absorption. Figure 6a compares the two stress–strain curves after the correlation, the average force resulting from the numerical simulation was 2.01 percent above the average experimental curve.
In this paper, the dynamic response of the 5052 aluminum was not addressed. An extensive characterization of aluminum alloys under impact loading at various speeds was presented by [11,12,13]. The strain rate sensitivity coefficient (C) and the reference strain rate () proposed in [12] were adopted in this paper. After the characterization on the quasi-static compression test, the FE simulation of the compression test was repeated adopting five different velocities to the moving plane. The resulting stress–strain curves are shown in Figure 6b. Increasing the strain rate () from 20 s−1 to 140 s−1 mm/s increased Fave by 15.6 percent. This result is coherent with the experimental findings obtained by Xu et al. [9]. The simulation also showed a decrease of 10.60 percent of the average force when decreasing the strain rate from 35 s−1, which is the typical strain rate found at the beginning of the impact tests, and to 3.33 × 10⁻⁴ s−1. This is in line with the penalization coefficient we chose in the first IA dimensioning.
This modeling approach involved a long simulation time caused by the high number of elements. Therefore, this honeycomb model was not used to model the real impact attenuators.
A homogenization technique was adopted to simplify the geometry and reduce computational effort. The sample with the homogenized material was modeled with 7830 fully-integrated eight-node hexahedral elements, with an average size of 2.75 mm. The homogenized elastic and plastic properties were assumed as being orthotropic.
The out-of-plane compressive behavior of the material is determined by defining five piece-wise stress-strain laws, corresponding to five strain rates. The response of the honeycomb under a strain rate between two of these five strain rates is obtained by interpolating the values of the curves relative to the two strain rates.
The five strain rates corresponded to the strain rates of the quasi-static compression tests and the numerical simulations made with the previous model. The stress–strain laws were shaped to correlate the results from the experimental tests and the numerical simulations.
Figure 6b shows a comparison between the responses of the two numerical models during two compression tests. Once again, the main focus was put into correlating Fave, and the homogenized honeycomb presented a maximum relative error of 2.16 percent (Table 4). Further details on the material modeling and results are shown in Appendix A.3.
Table 4.
Average force [N] for the numerical and experimental compression tests.
The FE models were correlated with the experimental results as shown in Figure 7. Altair® Hypermesh was used to set up the FE models, while Altair® Radioss was used to perform the simulations.
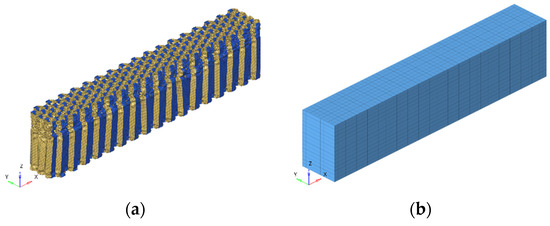
Figure 7.
Global deformation of the honeycomb detailed (a) and homogenized (b) finite element (FE) models.
The homogenized material substantially reduced the computational effort of the simulation, as this time, the computational time was negligible if compared to the time spent to simulate the same test on the detailed model. The homogenized material did not seize the folding mechanisms of the foil, but the global collapse of the structure was coherent with the collapse we observed in the detailed model (see Figure 7a,b). Furthermore, the results presented good accordance with the experimental parameters of interest. The homogenization technique was thus adopted for the non-linear FE models developed to mimic the crash test on the complete IA models.
2.6. Finite Element (FE) Simulations
The materials and the equivalent honeycomb material were used to model the IAs. The models are shown in Figure 8.
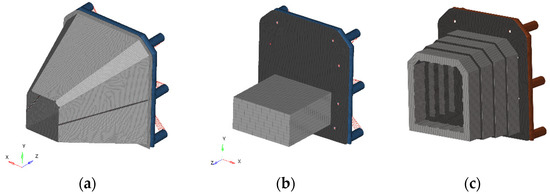
Figure 8.
FE models of the IA systems tested. (a) Hollow truncated pyramid absorber, (b) honeycomb crash-box absorber, and (c) hybrid layout.
The three IAs were mounted on the same steel test bulkhead. The test bulkhead was modeled with 26,602 four-node quadrilateral elements with an average size of 3 mm. A standard steel alloy was assigned to these elements. Eight mounting bolts, modeled with line elements and RBE2 links, connected the IAs to the test bulkhead. The sledge was modeled with a concentrated mass connected to the test bulkhead with a RBE2 link. The sum of the absorber, the test bulkhead, and the concentrated mass was 300 kg in all cases.
The AIP was modeled with 12,385 quadrilateral Mindlin plate elements with an average size of 3 mm. The thickness of the plate varied among the three IAs. The CFRP laminates were modeled stacking a combination of T700 prepreg fabrics, which were oriented at 0 and 45 degrees with respect to the vertical direction.
The AIPs were designed with the help of numerical optimization methods. The framework presented by Lo Presti et al. [26] was followed in this paper where a free-size optimization, a size optimization, and a composite shuffle optimization were chained to identify the best performing combination of prepreg plies as well as their arrangement in each of the three AIPs.
The aluminum hollow truncated pyramid absorber (Figure 8a) was modeled with 28,107 four-node shell elements. The average mesh size of the elements was 3 mm, while the shell had a thickness of 2 mm. The back plate welded at the base of the pyramid was used to mount the IA to the AIP. The welding seam was modeled by collapsing between the node of the pyramid and the back plate. The pyramid itself was made of two shells welded together. This time, the modeling of the welding seam influenced the component’s stiffness. Rotondella et al. [31] modeled the welding seams with eight-node hexahedral elements, connected with rigid links to the connected structures. Herein, the welding seams were modeled with four-node shell elements, sharing the nodes with the elements on the two shells. The thickness of these elements is coherent with the actual welding seam. The material employed was the same 5052 aluminum of which the hollow pyramid is made. The resistance of the welding seam was penalized according to the results reported in [32] for TIG welding of aluminum alloys. The corners at the top of the pyramid were incised to trigger the deformation at the frontal part of the attenuator. The same incisions were made on the IA prototype. The AIP consisted of three plies of T700 prepreg fabrics. The contact between the mounting plate and the AIP as well as the self-contact in the IA were modeled with Coulomb friction.
The homogenized honeycomb material was introduced to model the honeycomb crash-box absorber in Figure 8b. The AIP had a variable thickness across its area. The maximum thickness was 5.58 mm, corresponding to 18 plies of T700 fabric with a thickness of 0.31 mm. The maximum thickness was found at the glued connection between the AIP and the honeycomb, and around the bolts. A minimum thickness of 1.86 mm was found in the center-top region of the AIP. The honeycomb was discretized in 208,542 elements of the same type and size of the elements of the sample in Section 2.5. It was glued to the AIP, and the connection was modeled with a non-sliding contact interface between the two components.
The hybrid IA is shown in Figure 8c. As with the honeycomb crash absorber, its numerical model included the homogenized honeycomb material, which was discretized in 186,665 elements, the same as that for the honeycomb crash-box. The honeycomb layers were glued to the anti-intrusion plate and to the intermediate CFRP laminates. The laminates were discretized in 11,596 four-node quadrilateral elements adopting Mindlin shell theory. Each of the laminates was composed of six fabric plies, and had a total thickness of 2 mm. The AIP had a maximum thickness of 3.1 mm (10 plies of T700), located around the bolts, and where the fourth layer of the IA was glued. The minimum thickness was 1 mm (3 plies) and was found in the middle of the AIP.
The load cases simulated the impact test defined in Section 2.1. The impactors were pushed toward a rigid wall with an initial speed of 7 m/s.
The node at which the mass of the sledge was concentrated was monitored during the simulation. Data on the position, velocity, and acceleration of such node were extracted. The acceleration curve was then filtered using a Channel Filter Class CFC 60 low-pass filter (100 Hz) following the regulation SAE-J211 and checked for its maximum peak and average value. The displacement and velocity curves were left unfiltered and kept for a comparison with the results of the impact tests.
The results of the virtual impact tests are discussed in Section 3, the three IAs fully satisfying the prescribed requirements. Three prototypes were then produced replicating the designs illustrated thus far. Table 5 summarizes the masses of the three IAs and the CFRP plies involved in each AIP.
Table 5.
The features of the test samples.
3. Results
The position, velocity, and acceleration of the sledge were monitored during both the experimental and numerical tests on the three IAs. The impact duration (Δt) is also worth monitoring. The impact starts when the IA first touches the wall and finishes when the kinetic energy of the sledge becomes zero (i.e., when the sledge velocity reaches zero). At the end of the tests, the total deformation (Δs) was calculated measuring the axial extension of the crushed impactor from the plane of the AIP and subtracting it from the initial IA length described in Table 5.
The permanent deflection of the AIP was the last parameter to monitor after the tests (see Table 1). The numerical simulations showed that all of the CFRP laminates worked completely in the linear elastic field, and the simulations showed no plastic strain and no damage between the plies of the laminates. Measurements made on the impactors confirmed the numerical prediction: a negligible AIP permanent deflection was found at the end of the three experimental tests. Furthermore, it could be observed that such deflection was due to the plastic deformation of the steel plate on the test bulkhead, as all the AIPs returned to their original shape when unmounted from the test bulkhead. Thus, this mandatory requirement was fully respected by the three IAs under study.
The results of the experimental and numerical tests on the pyramidal IA are shown in Figure 9. The frontal region of the FE model of the impactor presented a similar deformation as the zone in contact with the wall took on a pentagonal shape. However, the FE model of the impactor had a symmetrical mesh, and its folding mechanism was symmetrical. The aluminum impactor, on the other hand, was not symmetrical and showed a different failure behavior. The dissimilar deformation behavior influenced the acceleration curves in the two tests (see Figure 9). The acceleration in the simulation had an initial peak, followed by a monotonic decrease; on the other hand, the acceleration in the impact test showed a slow decrease after the same initial peak, followed by a second rise.
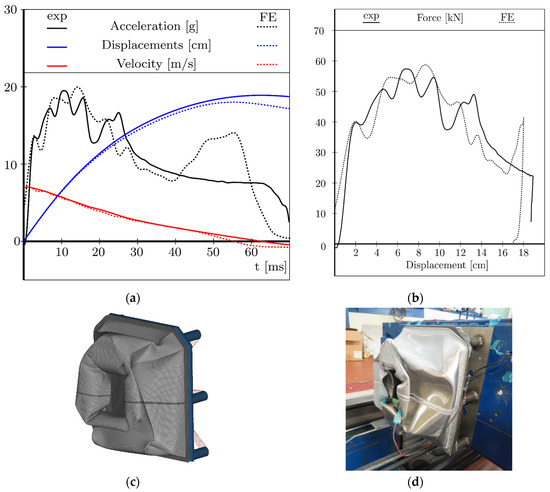
Figure 9.
Comparison between the experimental and numerical results on the hollow, truncated pyramid IA. (a) Force–intrusion curve (b); deformation at the end of the impact test (c); and numerical simulation (d).
The difference in the deformation behavior caused all the differences in the average acceleration, impact duration, and maximum deformation. Table 6a shows an error in the average acceleration of 12.90 percent.
Table 6.
Results of the experimental test compared to the FE simulations. (a) Hollow truncated pyramid layout, (b) honeycomb crash-box layout.
Figure 10 shows the results for the crash-box honeycomb impactor. Here, there was no information on the folding mechanism of the honeycomb as a homogenization technique was used. The numerical model showed a slightly higher average acceleration and a lower maximum intrusion than the real IA. This was due to the modeling of the glued connection between the AIP and the honeycomb, which was assumed as being infinitely rigid. The glue, in fact, has a compliance, which was not introduced in the numerical model for simplicity’s sake. The results of the two IA tests are summarized in Table 6. In both cases, the maximum acceleration peak (apeak) and the average acceleration (aave) remained below the limit prescribed by the regulations. In both cases, the relative error () between the numerical and experimental error was below 9 percent, and the highest was always found at the impact duration Δt. The FE analyses were in both cases on the safe side, as a higher aave leads to a potentially higher injury for the driver [30].
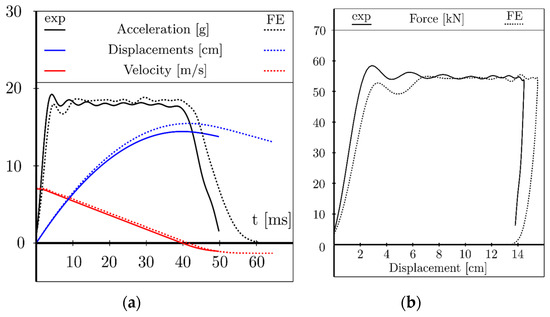
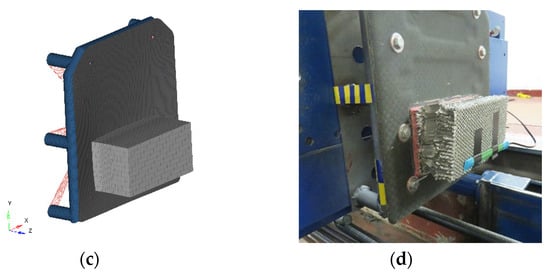
Figure 10.
Comparison between the experimental and numerical results on the honeycomb crash-box IA. (a) Force–intrusion curve (b); deformation at the end of the impact test (c); and numerical simulation (d).
The results of the hybrid IA are summarized in Figure 11 and Table 7. In both the experimental and numerical tests, the results showed that the proposed IA respected the mandatory requirements well as the was just below 20 m/s2 and the was below 40 m/s2.
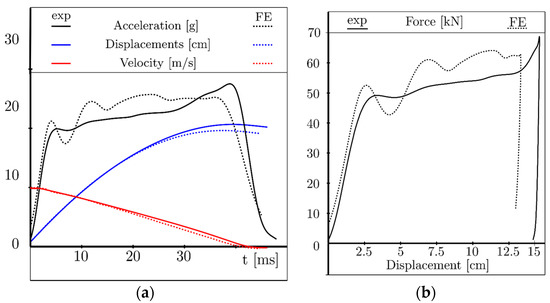
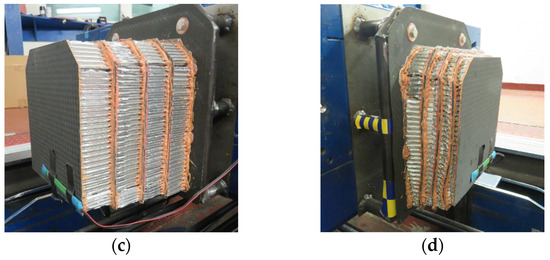
Figure 11.
Comparison between the experimental and numerical results on the hybrid IA. (a) Force–intrusion curve (b), (c,d) images of the actual sample before and after the test.
Table 7.
Comparison of experimental and numerical parameters of interest.
The acceleration curves showed a good correlation between the FE and experimental results, thus the simulations were effective in predicting the behavior of the IA in the impact. The greatest discrepancy was located at the maximum acceleration peak (). The FE simulation presented a lower average acceleration than the experimental test. This led to a higher amount of energy to be absorbed in the last part of the impact. In order to absorb this energy, the impactor in the FE simulation presented a higher intrusion, and a rapid increase in acceleration in the final part. However, the relative errors encountered were in line with that found in the work of Boria [21], in which a FSAE impact attenuator was investigated.
The final part of the acceleration curve showed that the impact ended when the honeycomb was still in its plateau region as it was desired in the first instance.
The three prototypes fulfilled the requests specified by the regulations. The choice of the IA was based only on the component’s mass and on its specific energy absorption (SEA) (i.e., the absorbed energy per unit mass). Table 8 summarizes the experimental results, which revealed that the hybrid IA system outperformed the other tested layouts in terms of both lightness and energy absorption. The hybrid solution was thus chosen for the Formula SAE race car.
Table 8.
Results of the experimental test compared to the FE simulations. (a) Hollow truncated pyramid layout, (b) honeycomb crash-box layout.
4. Conclusions
This paper presents the design of a frontal passive safety system of an open wheel race car. The system needs to satisfy the rules of the competition, and at the same time be as light as possible.
Three solutions involving thin-walled structures, CFRP laminates, and aluminum honeycomb were considered: the first consisted of a thin-walled truncated pyramid that directs the load paths toward the main structural members of the chassis; the second IA consisted of a simple honeycomb crash-box, the dimensions of which were relatively easy to calculate with simple equations; and the third IA was a hybrid solution, designed to integrate the benefits brought by the two previous solutions. The three IAs were mounted on CFRP anti-intrusion plates, designed with the help of numerical optimization techniques.
A numerical model of the three impact attenuation systems was created to predict their energy absorption. Particular attention was paid to the characterization of the honeycomb crushing behavior. The honeycomb was modeled with a numerical homogenization technique to reduce the computational effort.
After a virtual validation of the three designs, three prototypes were produced for the impact test, which was executed following the rules of the competition. The results of the experimental tests were in close agreement with the numerical results.
The three systems satisfied the regulations well, thus the best design was chosen according to the performance results only. The hybrid IA system presented the highest energy absorption and the lowest mass among the three solutions.
The test bulkhead used for the impact test differed from the intended bulkhead structure. Some simple calculations were made to provide proof of the structural equivalence between the two bulkhead structures. These calculations followed the rules of the competition that the car would race in. For a more general purpose, the designer should either use the same bulkhead structure, both in the virtual and in the experimental crash test, or give more detailed proof of the structural equivalence between the two structures.
The predictive numerical simulations could be refined by assessing the mechanical response of the glued contacts. A numerical-experimental correlation is needed to determine the shear properties of the glue film.
The regulations prescribe a purely frontal impact with no offset. The IA designs could be improved by considering a non-purely frontal impact or an offset frontal crash. To do so, the out-of-plane shear properties of the honeycomb need to be determined with a further numerical-experimental correlation.
Author Contributions
Conceptualization, A.V.; Methodology, A.V. and G.A.C.; Validation, A.V. and G.A.C., Formal Analysis, A.V. and M.G.; Investigation A.V. and M.G., Data Curation A.V. and G.G., Writing-Original Draft Preparation, A.V., M.G., and G.G.; Writing—Review and Editing, M.G. and G.G.; Supervision, A.V. All authors have read and agreed to the published version of the manuscript.
Funding
This research received no external funding.
Conflicts of Interest
The authors declare no conflict of interest.
Appendix A—Material Modeling
Appendix A.1. Composite Lamina
The CFRP lamina was modeled as a homogenized orthotropic shell. The constitutive equations (Equation (A1)) in the linear elastic field are:
The coefficients of the compliance matrix are calculated according to the classical theory of laminates, starting with the properties of the constituent materials. A T700 plane fabric and an epoxy resin were considered.
The crash survivability (CRASURV) criterion, available in Altair® Radioss, was used to determine the CFRP failure. CRASURV is a modified Tsai–Wu failure criterion (Equation (A2)), based on a definition of a yield surface F:
The and coefficients depend on the plastic deformation work and on the strain rate . They are defined in Equations (A3)–(A6):
where i is the orthotropic direction (i = 1,2).
When F > 1, the post-yield behavior depends on the strain rate coefficient (c) and the hardening coefficient and hardening exponent (b,n) defined for each direction (longitudinal, transversal, and in plane shear Equation (A7)), both in compression (Equation (A8)) and in tension (Equation (A9)).
The reduction coefficient should be determined with a biaxial tensile test. Without this experimental test, the most common value of is 1 to enable the Tsai–Wu criterion to degenerate to the Von Mises criterion, considering an isotropic material with equal tensile and compressive strength.
The plastic behavior was assumed to be dependent only on the (b,n) parameters, neglecting the influence of the strain rate.
In the out-of-plane direction (direction 3), the material was assumed to be linear-elastic. The lamina was assumed to be in a plane strain state.
Two different types of intra-ply failure are available in the CRASURV formulation, the brittle tensile failure, and the plastic failure, if the cumulated plastic work () reaches the maximum value (both in tensile and compression, Equation (A10)).
where is a constant that scales the cumulated plastic work function.
A softening phase and a residual stress could be set before failure and element removal. A representation of the softening parameters and residual stress is presented in Figure A1 for an orthotropic i direction. In this work, a residual stress was set equal to the tensile/compression strength of epoxy resin before the element removal (Figure A1).

Figure A1.
Softening parameters and residual stress.
Figure A1.
Softening parameters and residual stress.

Table A1.
Mechanical properties of composite laminates.
Table A1.
Mechanical properties of composite laminates.
| Parameter | Reference Test | ||
|---|---|---|---|
| 52 GPa | ASTM D3039 0° | Elastic Properties | |
| 51 GPa | ASTM D3039 90° | ||
| 3.5 GPa | ASTM D3518 | ||
| 0.045 | ASTM D3039 | ||
| 33 | ASTM D3410 0° | Hardening Parameters | |
| 0.55 | |||
| 27 | ASTM D3410 90° | ||
| 0.51 | |||
| 21 | ASTM D3518 | ||
| 0.44 | |||
| 1.3% | ASTM D3039 0° | Ultimate Strains | |
| 1.2% | ASTM D3039 90° | ||
| 1.3% | ASTM D3410 0° | ||
| 1.3% | ASTM D3410 90° | ||
| 15% | ASTM D3518 | ||
| 40 MPa | Deltapreg® DT120 resin datasheet | Residual Stress | |
The mechanical properties of the laminates are reported in Table A1. These data were obtained performing an experimental campaign, which was carried out according to the ASTM standards. Tensile and compressive tests were performed along the two orthotropy axes of the laminate, assuming 0° and 90° as the directions of the first and second axis, respectively. Hardening parameters were calculated in order to fit the experimental results in term of stress–strain diagram. The material exhibited brittle failure in tension for both orthotropic directions, so hardening parameters (,) were zero.
The initial softening strain value in the material model was set equal to the ultimate strain reported in Table A1 for tension, compression, and in-plane shear test, respectively.
Maximum strain softening was set in order to correlate the energy absorption due to low-velocity impact in a drop weight test (ASTM D7136).
The residual stress was set equal to the ultimate stress of epoxy resin both in tension than compression.
Appendix A.2. 5052 Aluminum
The elastic-plastic behavior of aluminum was simulated using the Cowper–Symonds model. The material was isotropic linear elastic when the equivalent stress was lower than the yield stress: . For , the true stress was calculated as reported in Equation (A11):
where (B,n) are the hardening parameters and is the plastic true strain of the element. The effects of the strain rate on the plastic response of the metal depends on the hardening parameters (C,p).
Failure occurs when the element reaches the maximum value of defined in the FE model. As soon as the element reaches failure, it is deleted from the model.
The material parameters are briefly summarized in Table A2, and the true stress–true strain curve is presented in the Figure 6a.
Table A2.
5052 Aluminum law material and elastic properties.
Table A2.
5052 Aluminum law material and elastic properties.
| E [GPa] | ν | [MPa] | [MPa] | [s−1] | |||
|---|---|---|---|---|---|---|---|
| 70.3 | 0.33 | 207.6 | 221.5 | 0.63 | 6500 | 4 | 0.2 |
Appendix A.3. Homogenized Honeycomb Material
The honeycomb crash box was modeled using LAW50, available in Altair® Radioss, and used to model honeycomb and foam structures, taking into account the effects of the strain rate on the response of the material. This material law was used to model the different nonlinear elasto-plastic behavior in the three orthotropic directions. All degrees of freedom were uncoupled, and the constitutive elastic equation is Equation (A12):
In the FE simulation, direction 1 was the out-of-plane direction, where the properties were higher in terms of stiffness. The in-plane Young’s moduli were neglected in relation to the loading conditions. The plastic behavior was defined by the five user-defined true stress–true strain curves shown in Figure A2a. These curves refer to a value of true strain rate for the material. The first value of strain rate was 3.33 × 10⁻³ s−1, equal to the strain rate of the quasi-static compression test. The maximum strain rate was 140 s−1, which was meant to be above the maximum true strain rate occurring in the impact test simulation.
Whenever the honeycomb was compressed at a strain rate below 3.33 × 10⁻³ s−1, the plastic response followed the first stress–strain curve. On the other hand, when the honeycomb was compressed at any strain rate, its plastic response was obtained from the interpolation (or extrapolation) of the stress–strain curves relative to the two nearest strain rates.
The curves were obtained based on the results of the compression tests performed on the detailed honeycomb FE model. The resulting stress–strain curves for the two honeycomb models at the five strain rates are shown in Figure A2b.
All of the elastic constants are shown in Table A3:

Figure A2.
(a) Piece-wise stress–strain laws for various strain rates; (b) correlation between the detailed and the homogenized FE models.
Figure A2.
(a) Piece-wise stress–strain laws for various strain rates; (b) correlation between the detailed and the homogenized FE models.

Table A3.
Honeycomb law material and elastic properties.
Table A3.
Honeycomb law material and elastic properties.
| E1 | E2 = E3 | G12 | G31 | G23 | Density |
|---|---|---|---|---|---|
| [MPa] | [MPa] | [MPa] | [MPa] | [MPa] | |
| 1999 | 1 | 416 | 193 | 1 | 91 |
References
- Baroutaji, A.; Sajjia, M.; Olabi, A.G. On the crashworthiness performance of thin-walled energy absorbers: Recent advances and future developments. Thin-Walled Struct. 2017, 118, 137–163. [Google Scholar] [CrossRef]
- Munusamy, R.; Barton, D.C. Lightweight impact crash attenuators for a small formula SAE race car. Int. J. Crashworthiness 2010, 15, 223–234. [Google Scholar] [CrossRef]
- Santosa, S.; Wierzbicki, T. Crash behavior of box columns filled with aluminum honeycomb or foam. Comput. Struct. 1998, 68, 343–367. [Google Scholar] [CrossRef]
- Zarei, H.; Kröger, M. Optimum honeycomb filled crash absorber design. Mater. Des. 2008, 29, 193–204. [Google Scholar] [CrossRef]
- Zhang, J.; Ashby, M.F. The out-of-plane properties of honeycombs. Int. J. Mech. Sci. 1992, 34, 475–489. [Google Scholar] [CrossRef]
- Wierzbicki, T. Crushing analysis of metal honeycombs. Int. J. Impact Eng. 1983, 1, 157–174. [Google Scholar] [CrossRef]
- Partovi Meran, A.; Toprak, T.; Muǧan, A. Numerical and experimental study of crashworthiness parameters of honeycomb structures. Thin-Walled Struct. 2014, 78, 87–94. [Google Scholar] [CrossRef]
- Ivañez, I.; Fernandez-Cañadas, L.M.; Sanchez-Saez, S. Compressive deformation and energy-absorption capability of aluminium honeycomb core. Compos. Struct. 2017, 174, 123–133. [Google Scholar] [CrossRef]
- Xu, S.; Beynon, J.H.; Ruan, D.; Lu, G. Experimental study of the out-of-plane dynamic compression of hexagonal honeycombs. Compos. Struct. 2012, 94, 2326–2336. [Google Scholar] [CrossRef]
- Fahland, J.; Hoff, C.; Brelin-Fornari, J. Evaluating Impact Attenuator Performance for a Formula SAE Vehicle. SAE Int. J. Passeng Cars Mech. Syst. 2011, 4, 836–847. [Google Scholar] [CrossRef]
- Yang, C.; Li, D.; Zhu, T.; Xiao, S. Special dynamic behavior of an aluminum alloy and effects on energy absorption in train collisions. Adv. Mech. Eng. 2016, 8, 1–9. [Google Scholar] [CrossRef]
- Tian, T.; Huang, L.; Ma, H.; Li, J. Establishment and comparison of four constitutive models of 5A02 aluminium alloy in high-velocity forming process. Mater. Des. 2014, 54, 587–597. [Google Scholar] [CrossRef]
- Peixinho, N.; Doellinger, C. Characterization of Dynamic Material Properties of Light Alloys for Crashworthiness Applications. Mater. Res. 2010, 13, 471–474. [Google Scholar] [CrossRef]
- Alavi Nia, A.; Sadeghi, M.Z. An experimental investigation on the effect of strain rate on the behaviour of bare and foam-filled aluminium honeycombs. Mater. Des. 2013, 52, 748–756. [Google Scholar] [CrossRef]
- Tan, P.J.; Reid, S.R.; Harrigan, J.J.; Zou, Z.; Li, S. Dynamic compressive strength properties of aluminium foams. Part I—Experimental data and observations. J. Mech. Phys. Solids 2005, 53, 2174–2205. [Google Scholar] [CrossRef]
- Tao, Y.; Chen, M.; Pei, Y.; Fang, D. Strain Rate Effect on Mechanical Behavior of Metallic Honeycombs Under Out-of-Plane Dynamic Compression. J. Appl. Mech. 2015, 82. [Google Scholar] [CrossRef]
- Aktay, L.; Johnson, A.F.; Kröplin, B.H. Numerical modelling of honeycomb core crush behaviour. Eng. Fract. Mech. 2008, 75, 2616–2630. [Google Scholar] [CrossRef]
- Gibson, L.J.; Ashby, M.F. Cellular Solids: Structure and Properties, 2nd ed.; Cambridge University Press: Cambridge, UK, 1997. [Google Scholar]
- Heimbs, S.; Middendorf, P.; Maier, M. Honeycomb Sandwich Material Modeling for Dynamic Simulations of Aircraft Interior Components. In Proceedings of the 9th International LS-DYNA Users Conference, Dearborn, MI, USA, 4–6 June 2006. [Google Scholar]
- Heimbs, S.; Strobl, F. Crash Simulation of an F1 Racing Car Front Impact Structure. In Proceedings of the 7th European LS-DYNA conference, Salzburg, Austria, 14–15 May 2009. [Google Scholar]
- Boria, S. Behaviour of an impact attenuator for formula SAE car under dynamic loading. Int. J. Veh. Struct. Syst. 2010, 2, 45–53. [Google Scholar] [CrossRef]
- Ghamarian, A.; Zarei, H. Crashworthiness investigation of conical and cylindrical end-capped tubes under quasi-static crash loading. Int. J. Crashworthiness 2012, 17, 19–28. [Google Scholar] [CrossRef]
- Bisagni, C.; Di Pietro, G.; Fraschini, L.; Terletti, D. Progressive crushing of fiber-reinforced composite structural components of a Formula One racing car. Compos. Struct. 2005, 68, 491–503. [Google Scholar] [CrossRef]
- Ramakrishna, S. Microstructural design of composite materials for crashworthy structural applications. Mater. Des. 1997, 18, 167–173. [Google Scholar] [CrossRef]
- Mamalis, A.G.; Robinson, M.; Manolakos, D.E.; Demosthenous, G.A.; Ioannidis, M.B.; Carruthers, J. Crashworthy capability of composite material structures. Compos. Struct. 1997, 37, 109–134. [Google Scholar] [CrossRef]
- Lo Presti, I.; Cavazzoni, L.; Calacci, F.; Mantovani, S. Optimization methodology for an automotive cross-member in composite material. Key. Eng. Mater. 2017, 754, 291–294. [Google Scholar] [CrossRef]
- Obradovic, J.; Boria, S.; Belingardi, G. Lightweight design and crash analysis of composite frontal impact energy absorbing structures. Compos. Struct. 2012, 94, 423–430. [Google Scholar] [CrossRef]
- Wang, J.; Yang, N.; Zhao, J.; Wang, D.; Wang, Y.; Li, K.; He, Z.; Wang, B. Design and experimental verification of composite impact attenuator for racing vehicles. Compos. Struct. 2016, 141, 39–49. [Google Scholar] [CrossRef]
- SAE International. Formula SAE Rules 2019. July 2018 Issue. Available online: https://www.fsaeonline.com/cdsweb/gen/DownloadDocument.aspx?DocumentID=607667ea-bec6-4658-92c4-fff59dbb5c0e (accessed on 10 September 2018).
- Croft, A.C.; Herring, P.; Freeman, M.D.; Haneline, M.T. The neck injury criterion: Future considerations. Accid. Anal. Prev. 2002, 34, 247–255. [Google Scholar] [CrossRef]
- Mabuwa, S.; Msomi, V. Review on Friction Stir Processed TIG and Friction Stir Welded Dissimilar Alloy Joints. Metals 2020, 10, 142. [Google Scholar] [CrossRef]
- Rotondella, V.; Merulla, A.; Baldini, A.; Mantovani, S. Dynamic Modal Correlation of an Automotive Rear Subframe, with Particular Reference to the Modelling of Welded Joints. Adv. Acoust. Vibr. 2017. [Google Scholar] [CrossRef]


© 2020 by the authors. Licensee MDPI, Basel, Switzerland. This article is an open access article distributed under the terms and conditions of the Creative Commons Attribution (CC BY) license (http://creativecommons.org/licenses/by/4.0/).