2. Materials and Methods
The material used in this study was Al 99.5% (EN AW1050A), provided in the form of a bar with 30 mm diameter. The chemical composition of the Al-bar is given in
Table 1.
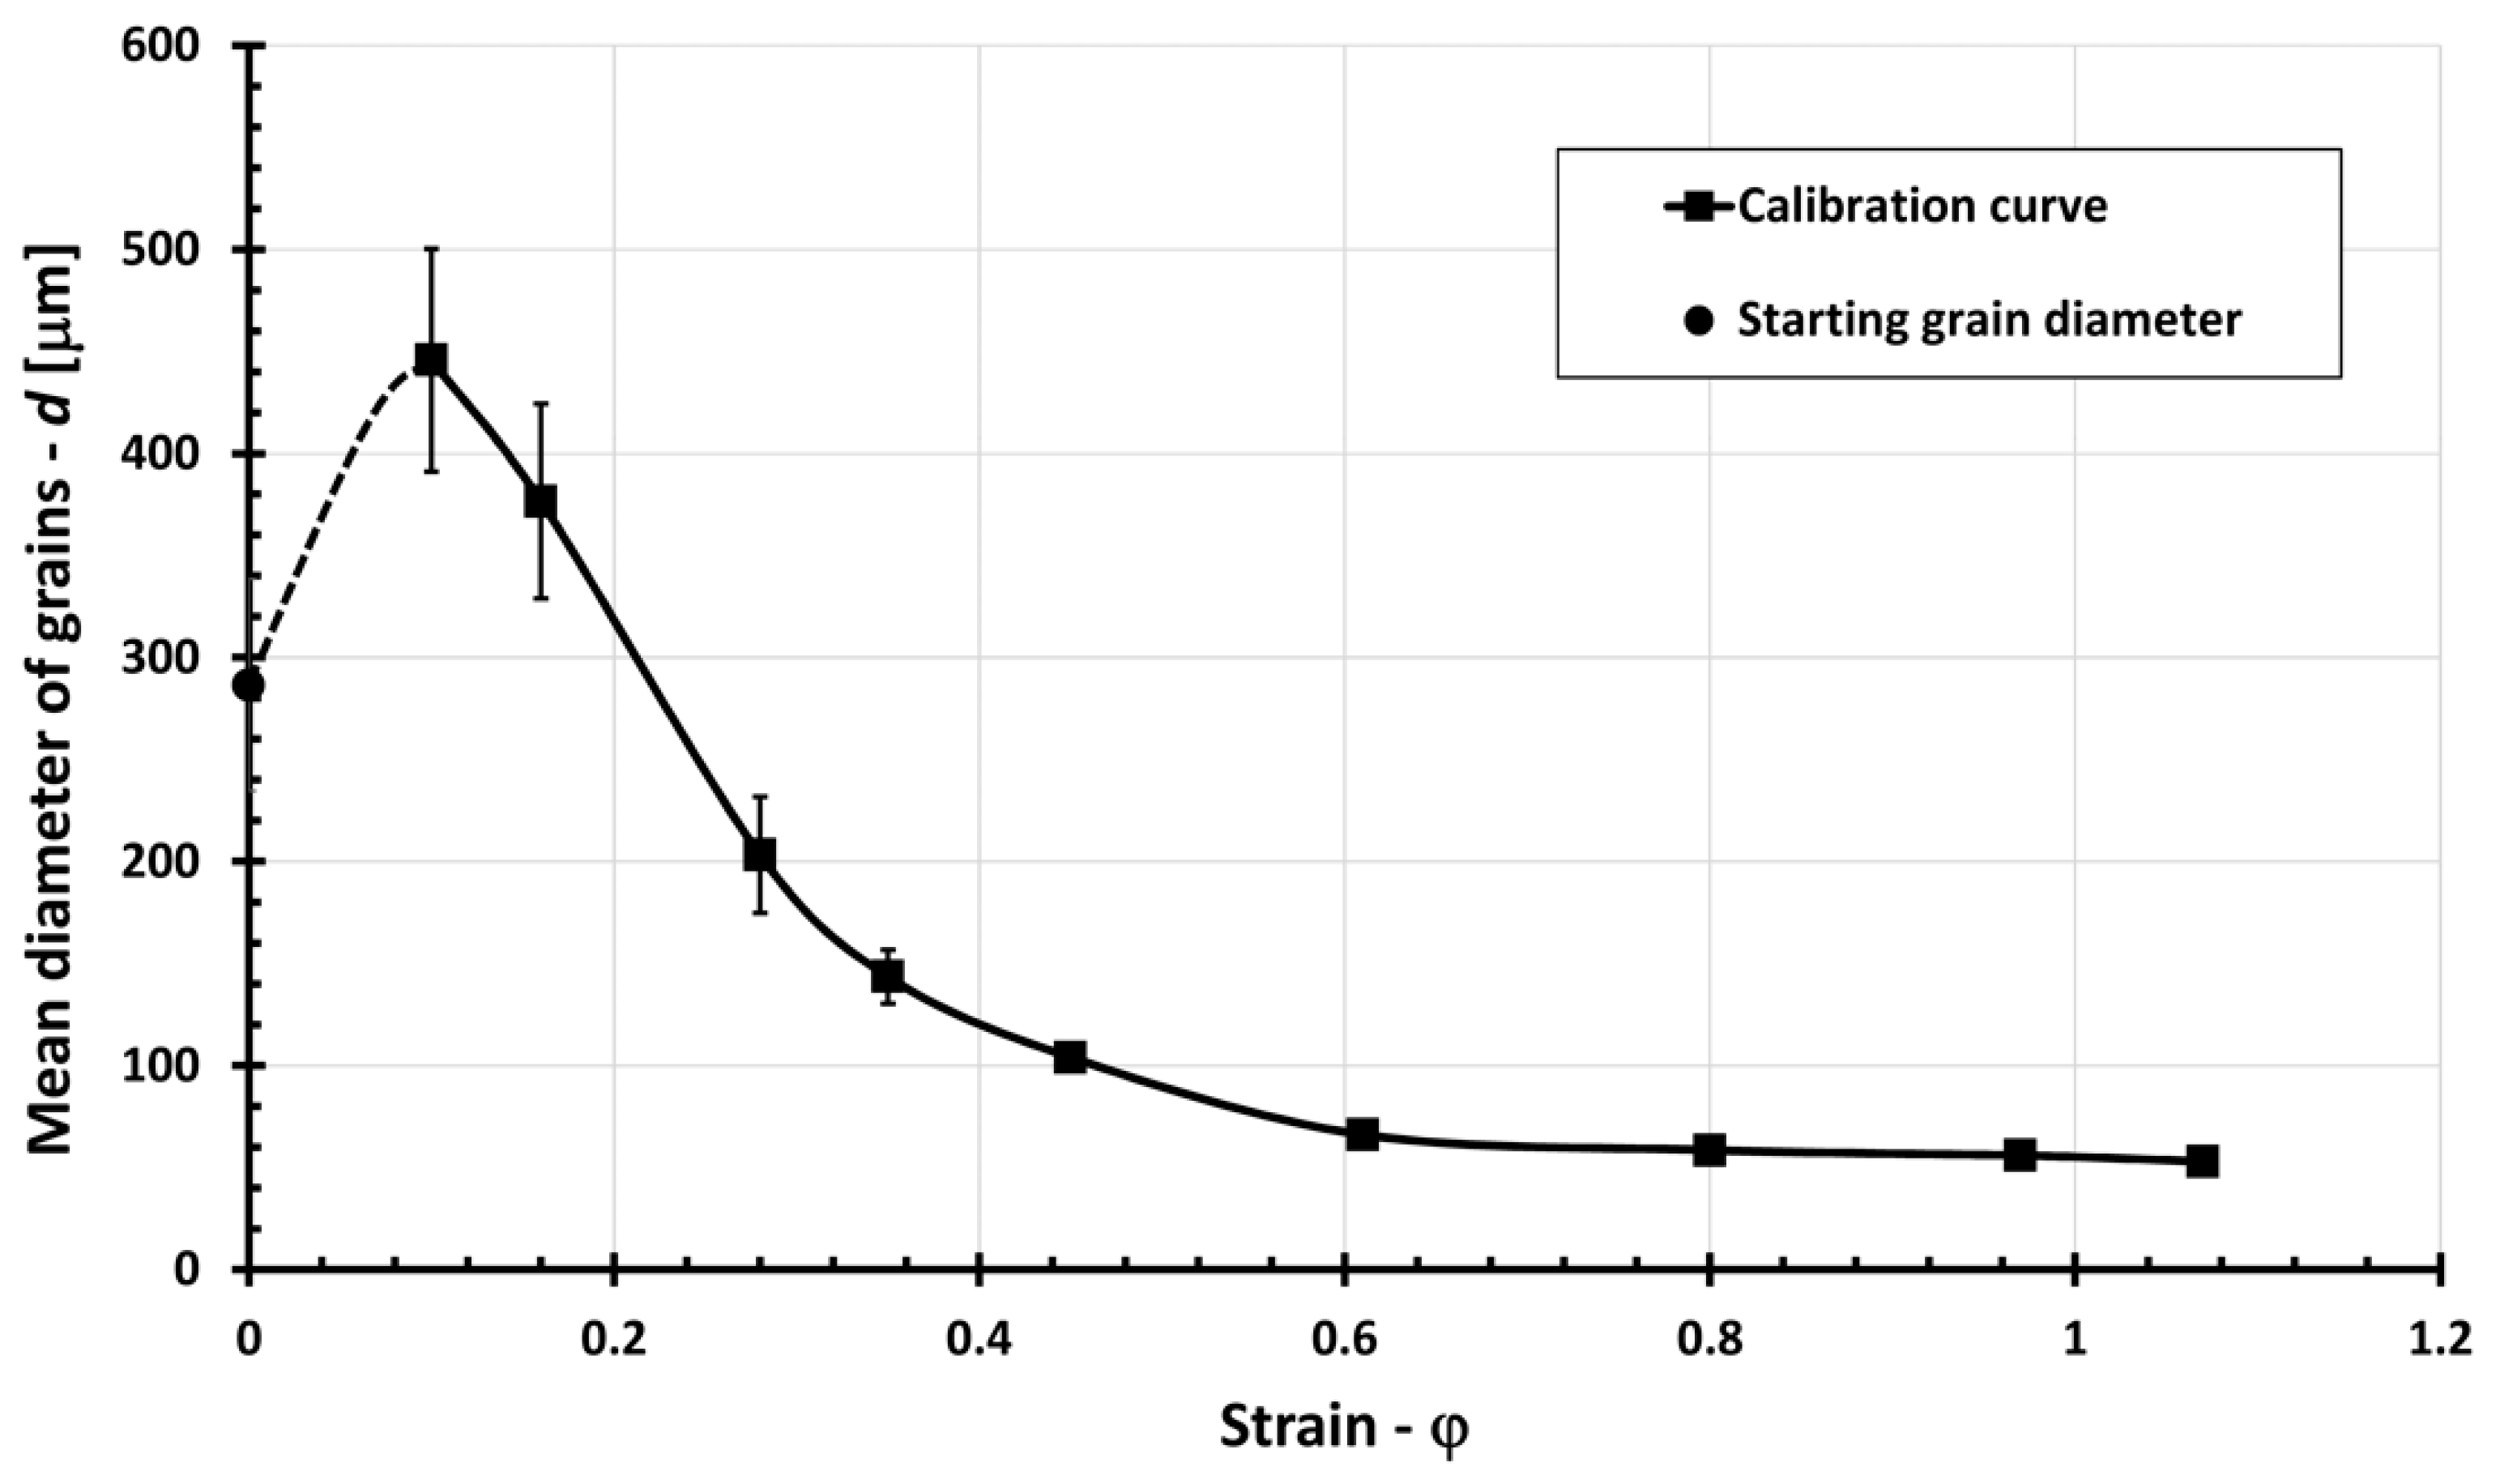
The specimens for the extrusion, the calibration curve, and flow curve have to undergo the same procedure to achieve the same initial microstructure. According to that, all specimens were first heat-treated for 16 h at 600 °C, followed by air cooling. After an initial heat treatment, the specimens were deformed with an effective strain φ = 0.25, and then again heat-treated at 500 °C for 1 h. As a result, the uniform grain size and chemical homogenization of material were obtained, resulting in uniform grain size of the average d = 287 ± 52 μm (
Figure 1) and microhardness of 27.7 HV0.1 (the experimental procedure used is described subsequently).
To obtain the calibration curve and flow curve, the Rastegaev method [
21] was carried out. The Rastegaev method produced a uniform distribution of deformation through the specimen. In this process, uniaxial compression was achieved due to friction elimination on the contact surfaces between tool and specimens. Upset specimens had a cylindrical shape (no barreling occurred) which indicated that uniaxial stress state was achieved, and that strain distribution was uniform.
The flow curve was determined after specimen deformation with logarithmic strain φ between 0.1 and 1.2, at an increment of 0.1. Three repetitions on different specimens were performed. According to the Rastegaev method, the flow curve was obtained with a final analytical form:
where:
k is true stress (MPa), and
φ is the logarithmic strain.
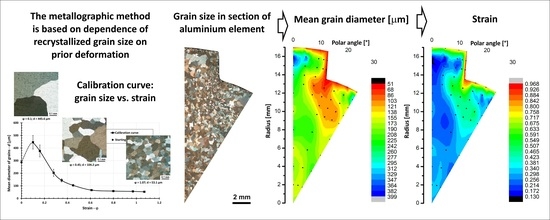
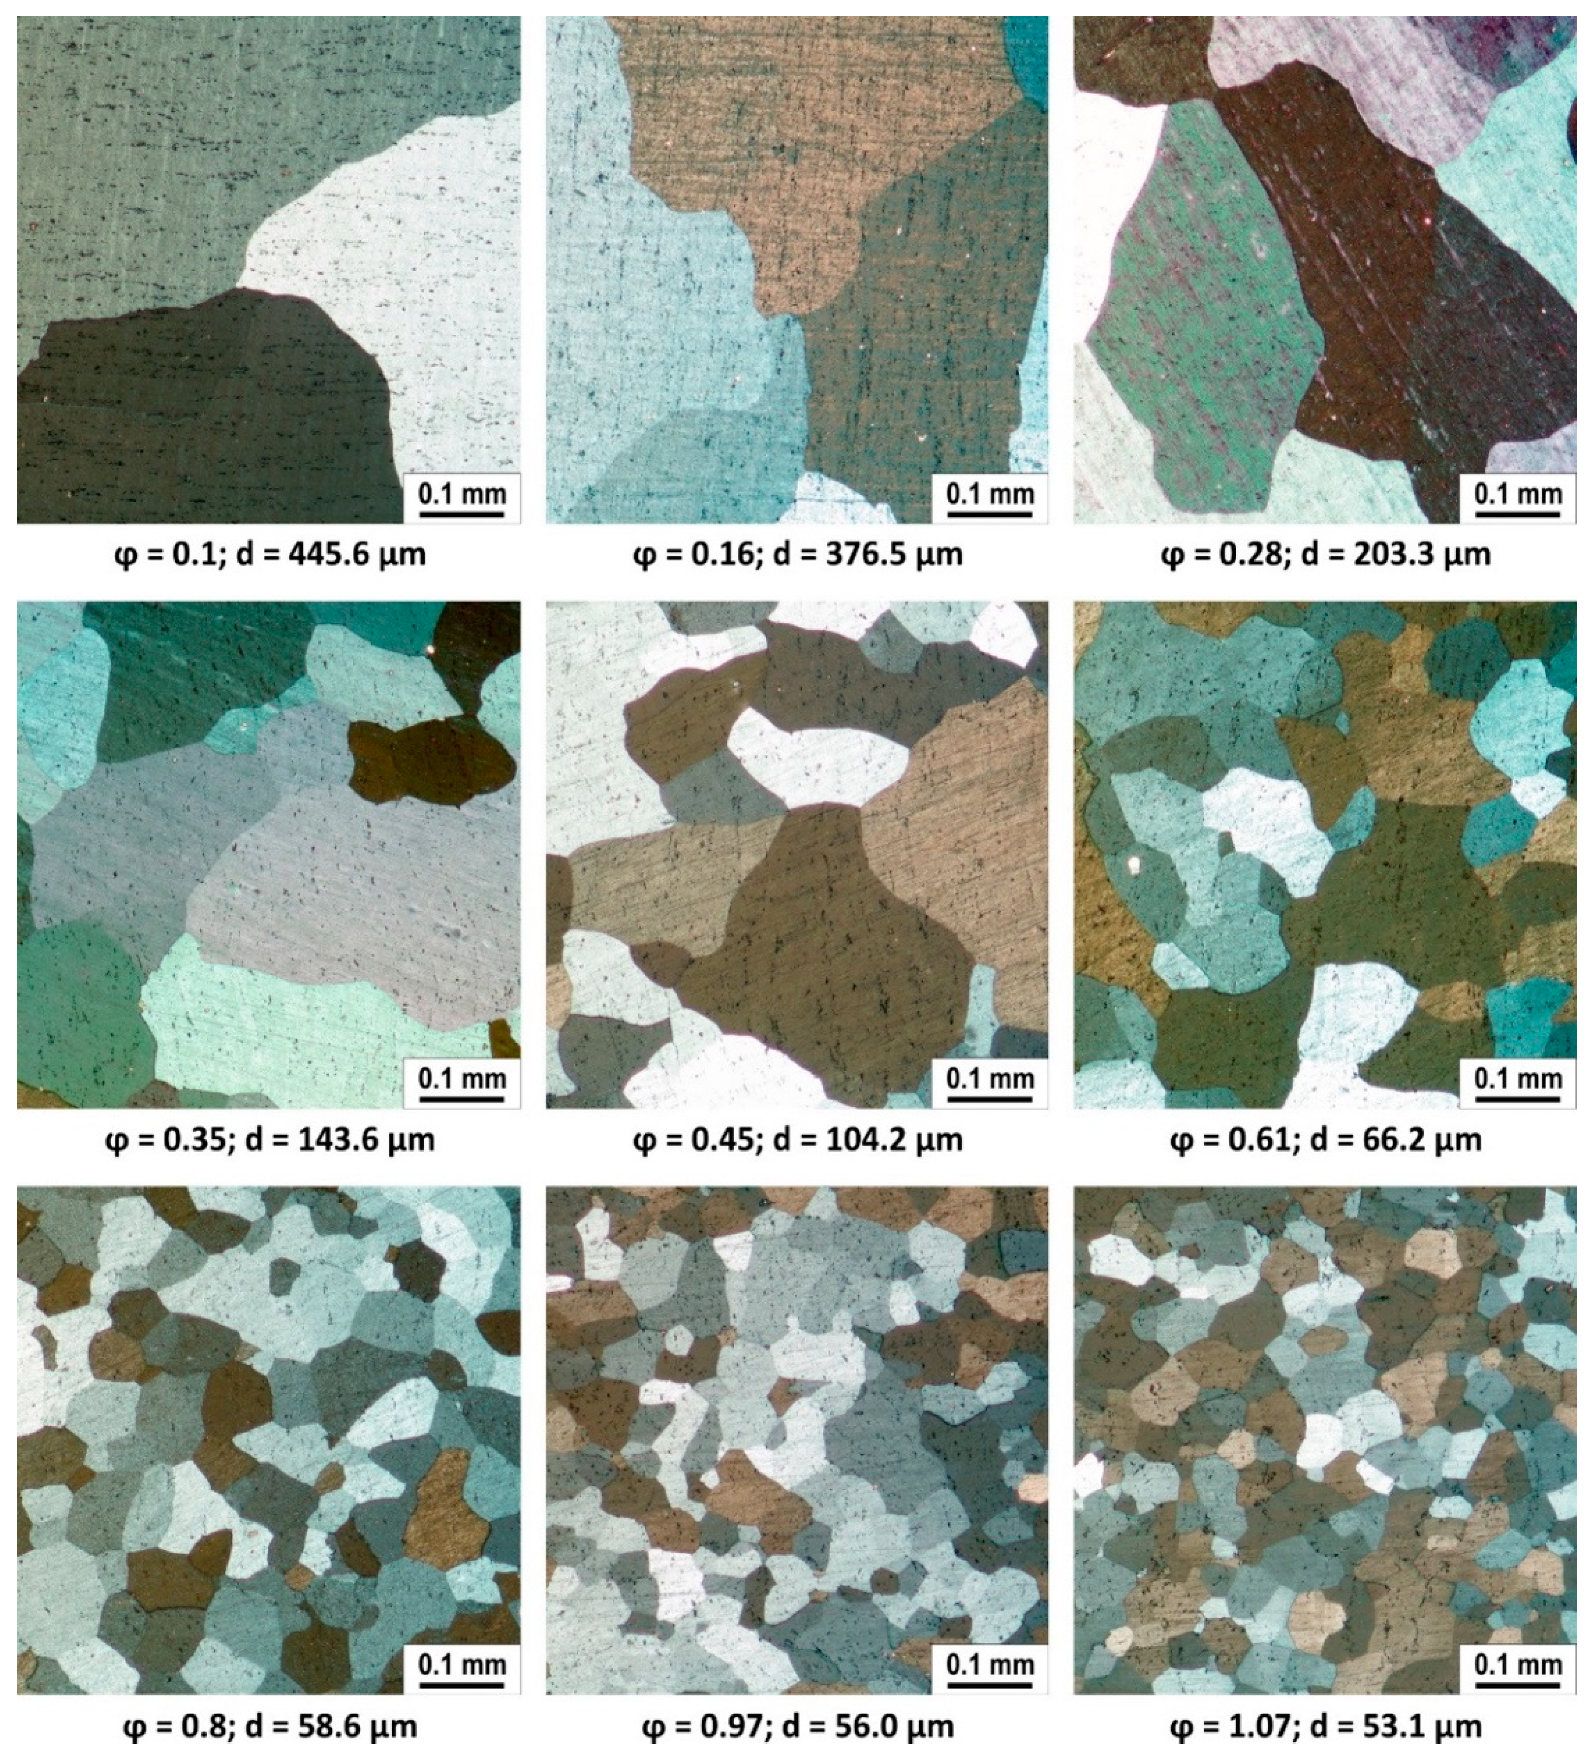
In order to evaluate the strain state within a cold extruded aluminum workpiece, it was necessary to determine the calibration curve which gives a relationship between the recrystallized grain size and the strain. For that purpose, the upsetting by the Rastegaev method was used, also. The logarithmic strain φ was between 0.1 and 1.07, in nine steps. Before, metallographic specimen preparation the heat treatment at 500 °C for 1 h was used again in order to achieve recrystallization of grains. After that, the metallographic examination and grain size measurement were carried out (the procedure of metallographic preparation and grain size measurement is described later).
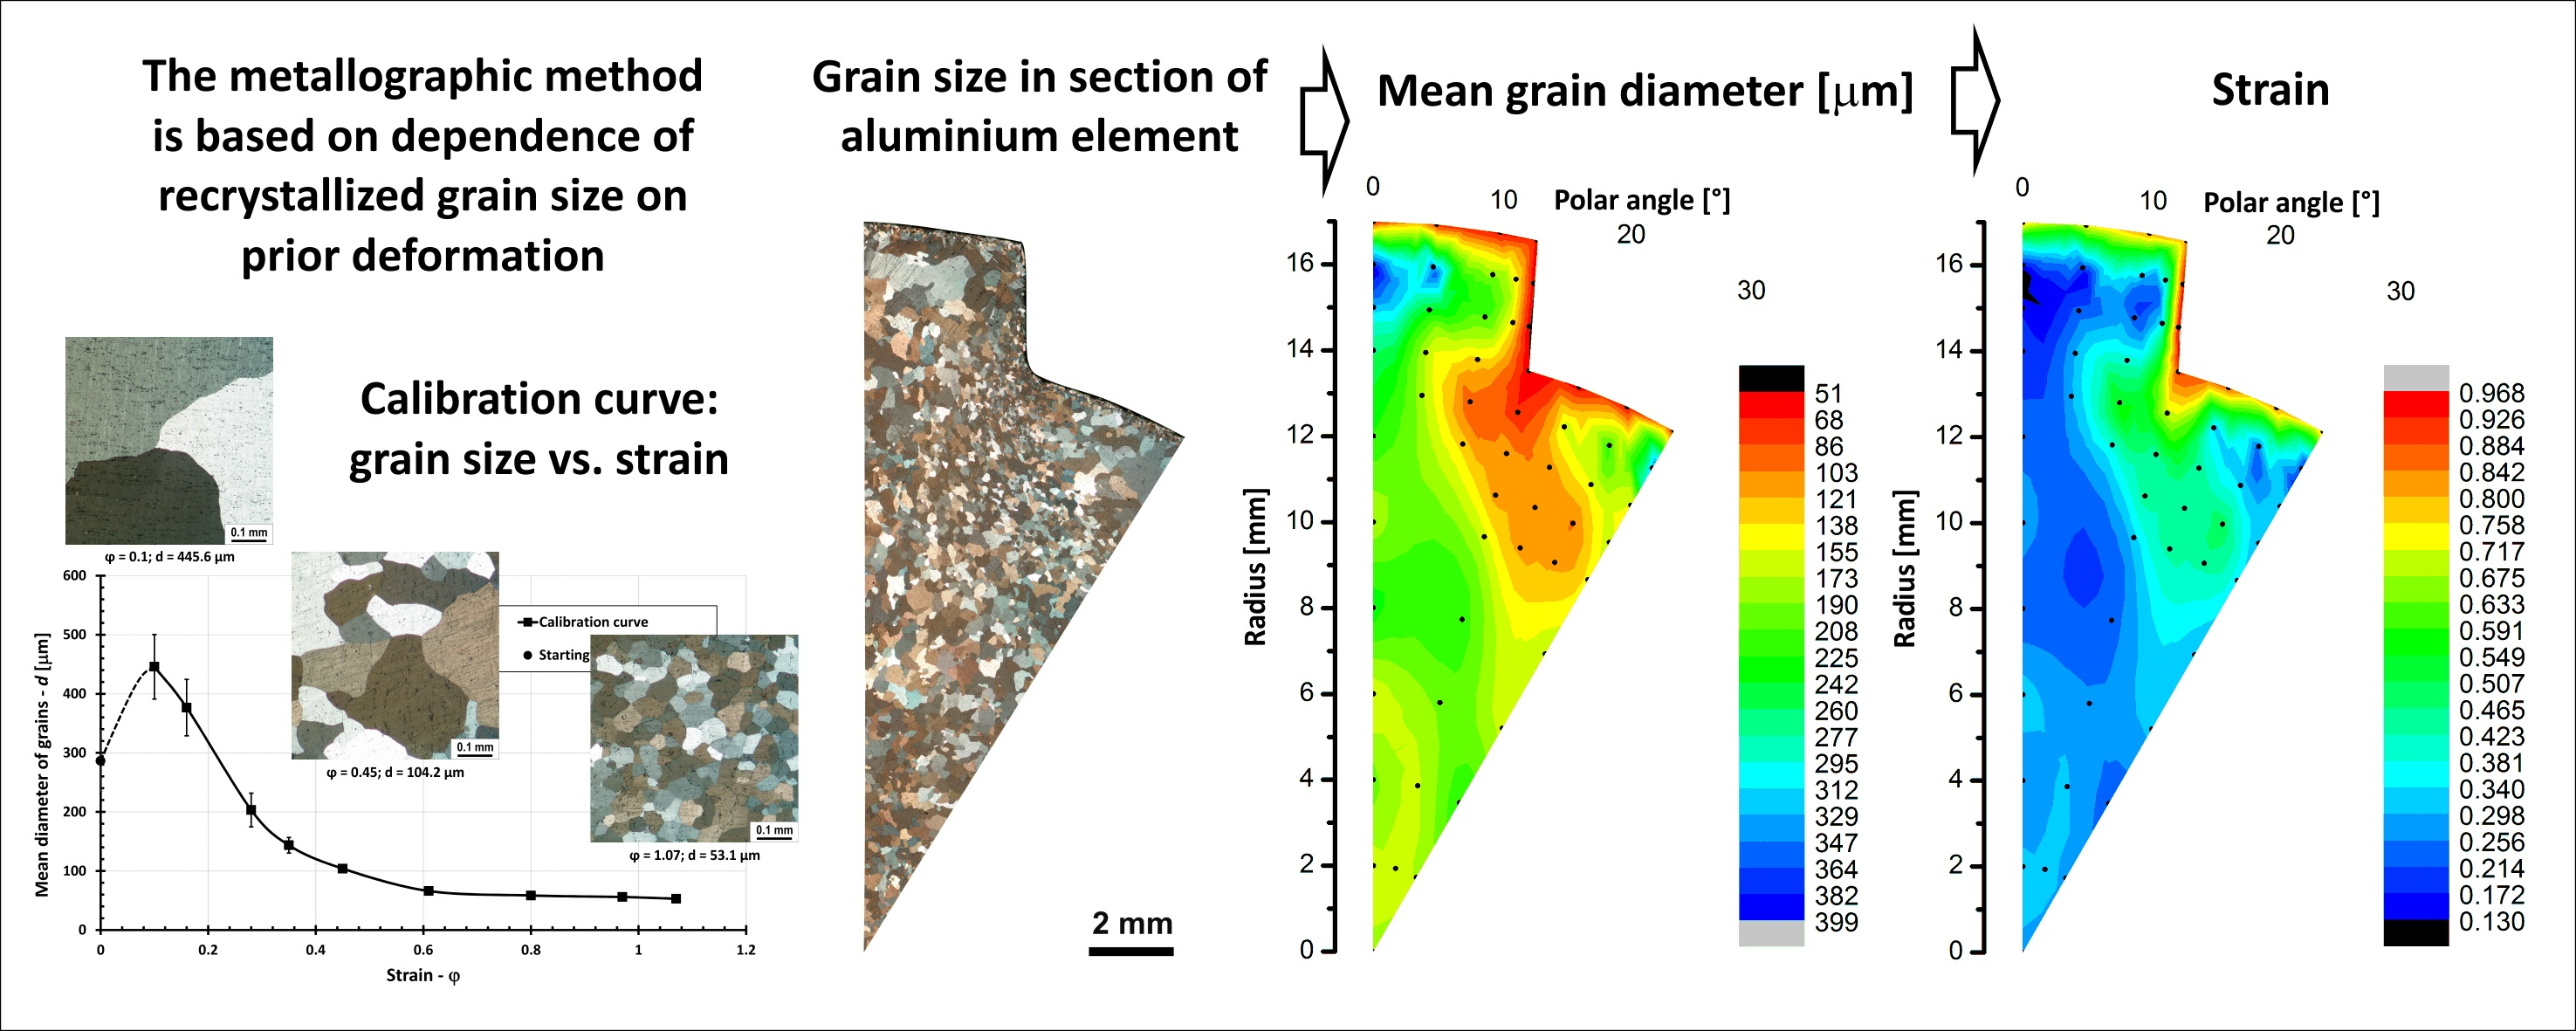
The extrusion experiment was performed by special tooling (
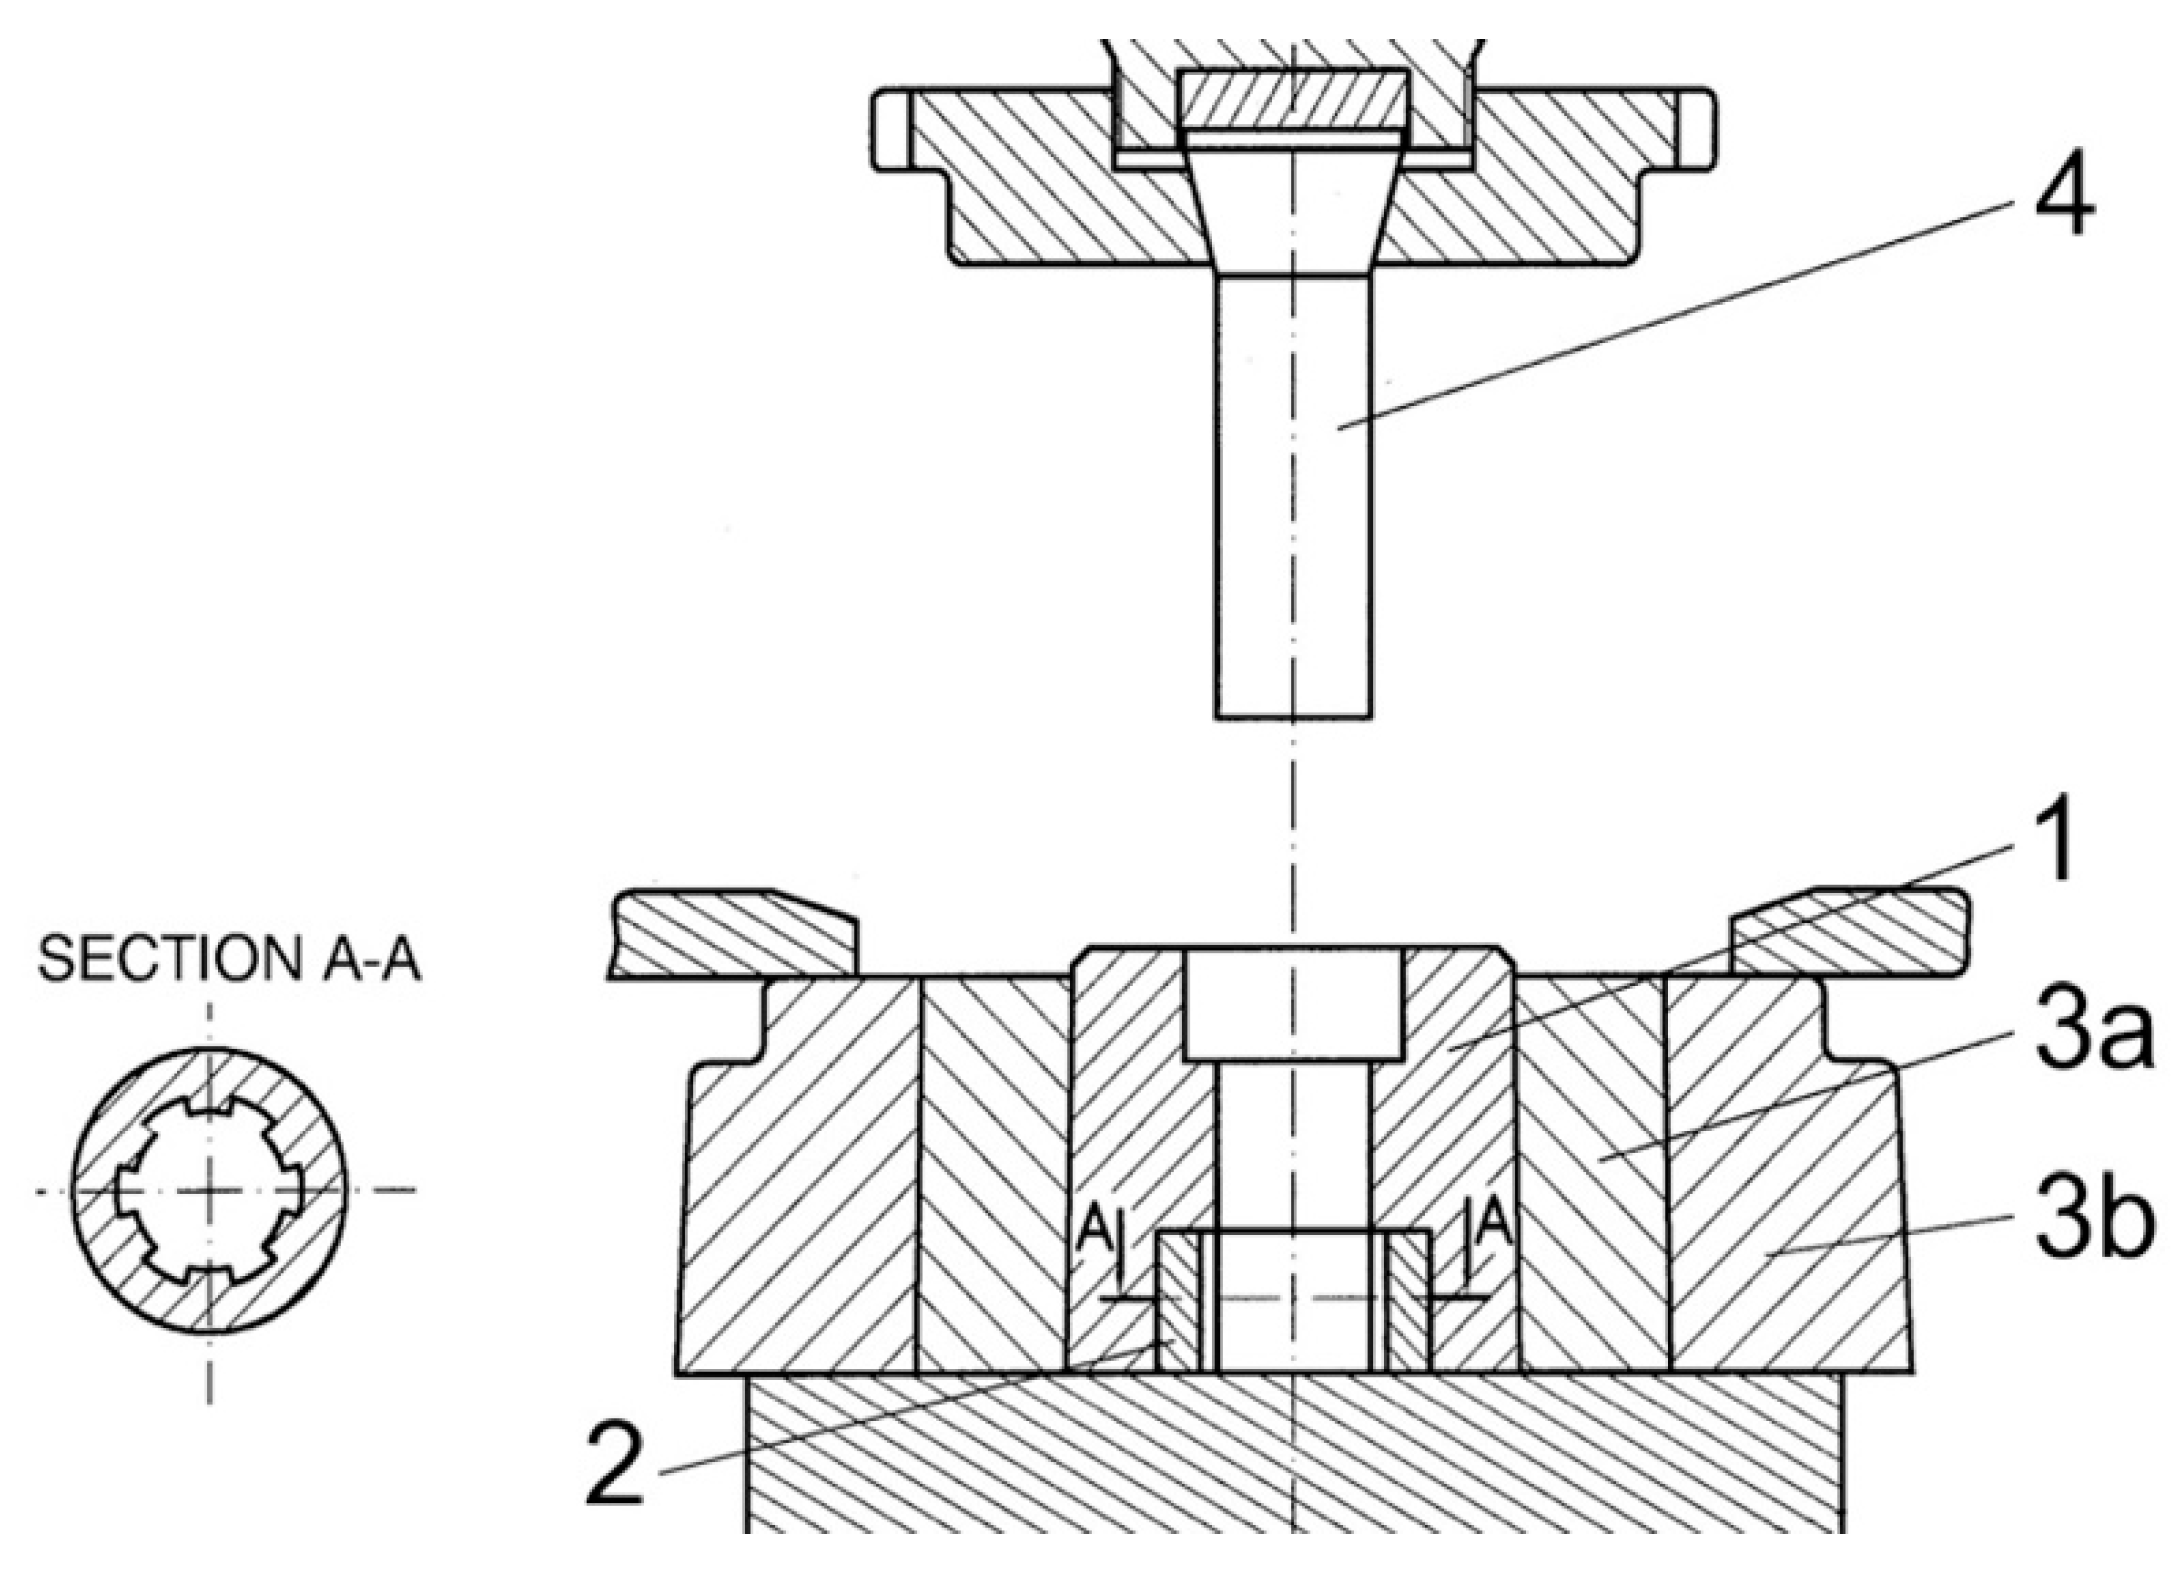
Figure 2), which was mounted on the hydraulic press model 630T (Sack and Kiesselbach, Germany), with a maximum force of 6.3 MN. The billet was placed into the die and the punch pressed it downwards. In this way, the material was forced to flow into the geared profile of the die insert. The die insert was replaceable, in order to enable extrusion of different gear-like elements. The extruded gear-like element with a replaceable die insert is presented in
Figure 3.
The metallographic examinations for all specimens were done after the standard metallographic preparation: (i) grinding with SiC papers (from 220 up to 2500 grid); (ii) polishing with diamond suspension (6, 3, 1 and ¼ μm grain size); and finally (iii) polishing with colloidal silica polishing suspension. To develop the Al grains the anodic oxidation etching in Barkers reagent HBF4 (5 mL HBF4 + 200 mL distilled H2O) was applied. All specimens were examined with an Orthoplan (Leitz, Germany) light microscope under polarized light (polarized LM).
In addition to a qualitative analysis of a microstructure, a quantitative analysis of the apparent grain size according to procedure EN ISO 643:2012 was done. To obtain the apparent grain size, a circular intercept method was used (EN ISO 643:2012) which averages out variations in the shape of equiaxed grains and avoids the problem of lines ending within grains. For the measurement, the three concentric circles were used on the five randomly selected fields of view with appropriate magnification (from 20 to 100 times), in order to achieve at least 40 to 50 intercepts on one field of view. The obtained mean intersected segment (l) was multiplied with 1.106 (the average ratio of the mean diameter of grain and mean intersected segment according to standard EN ISO 643:2012) to obtain the mean diameter of grains (d).
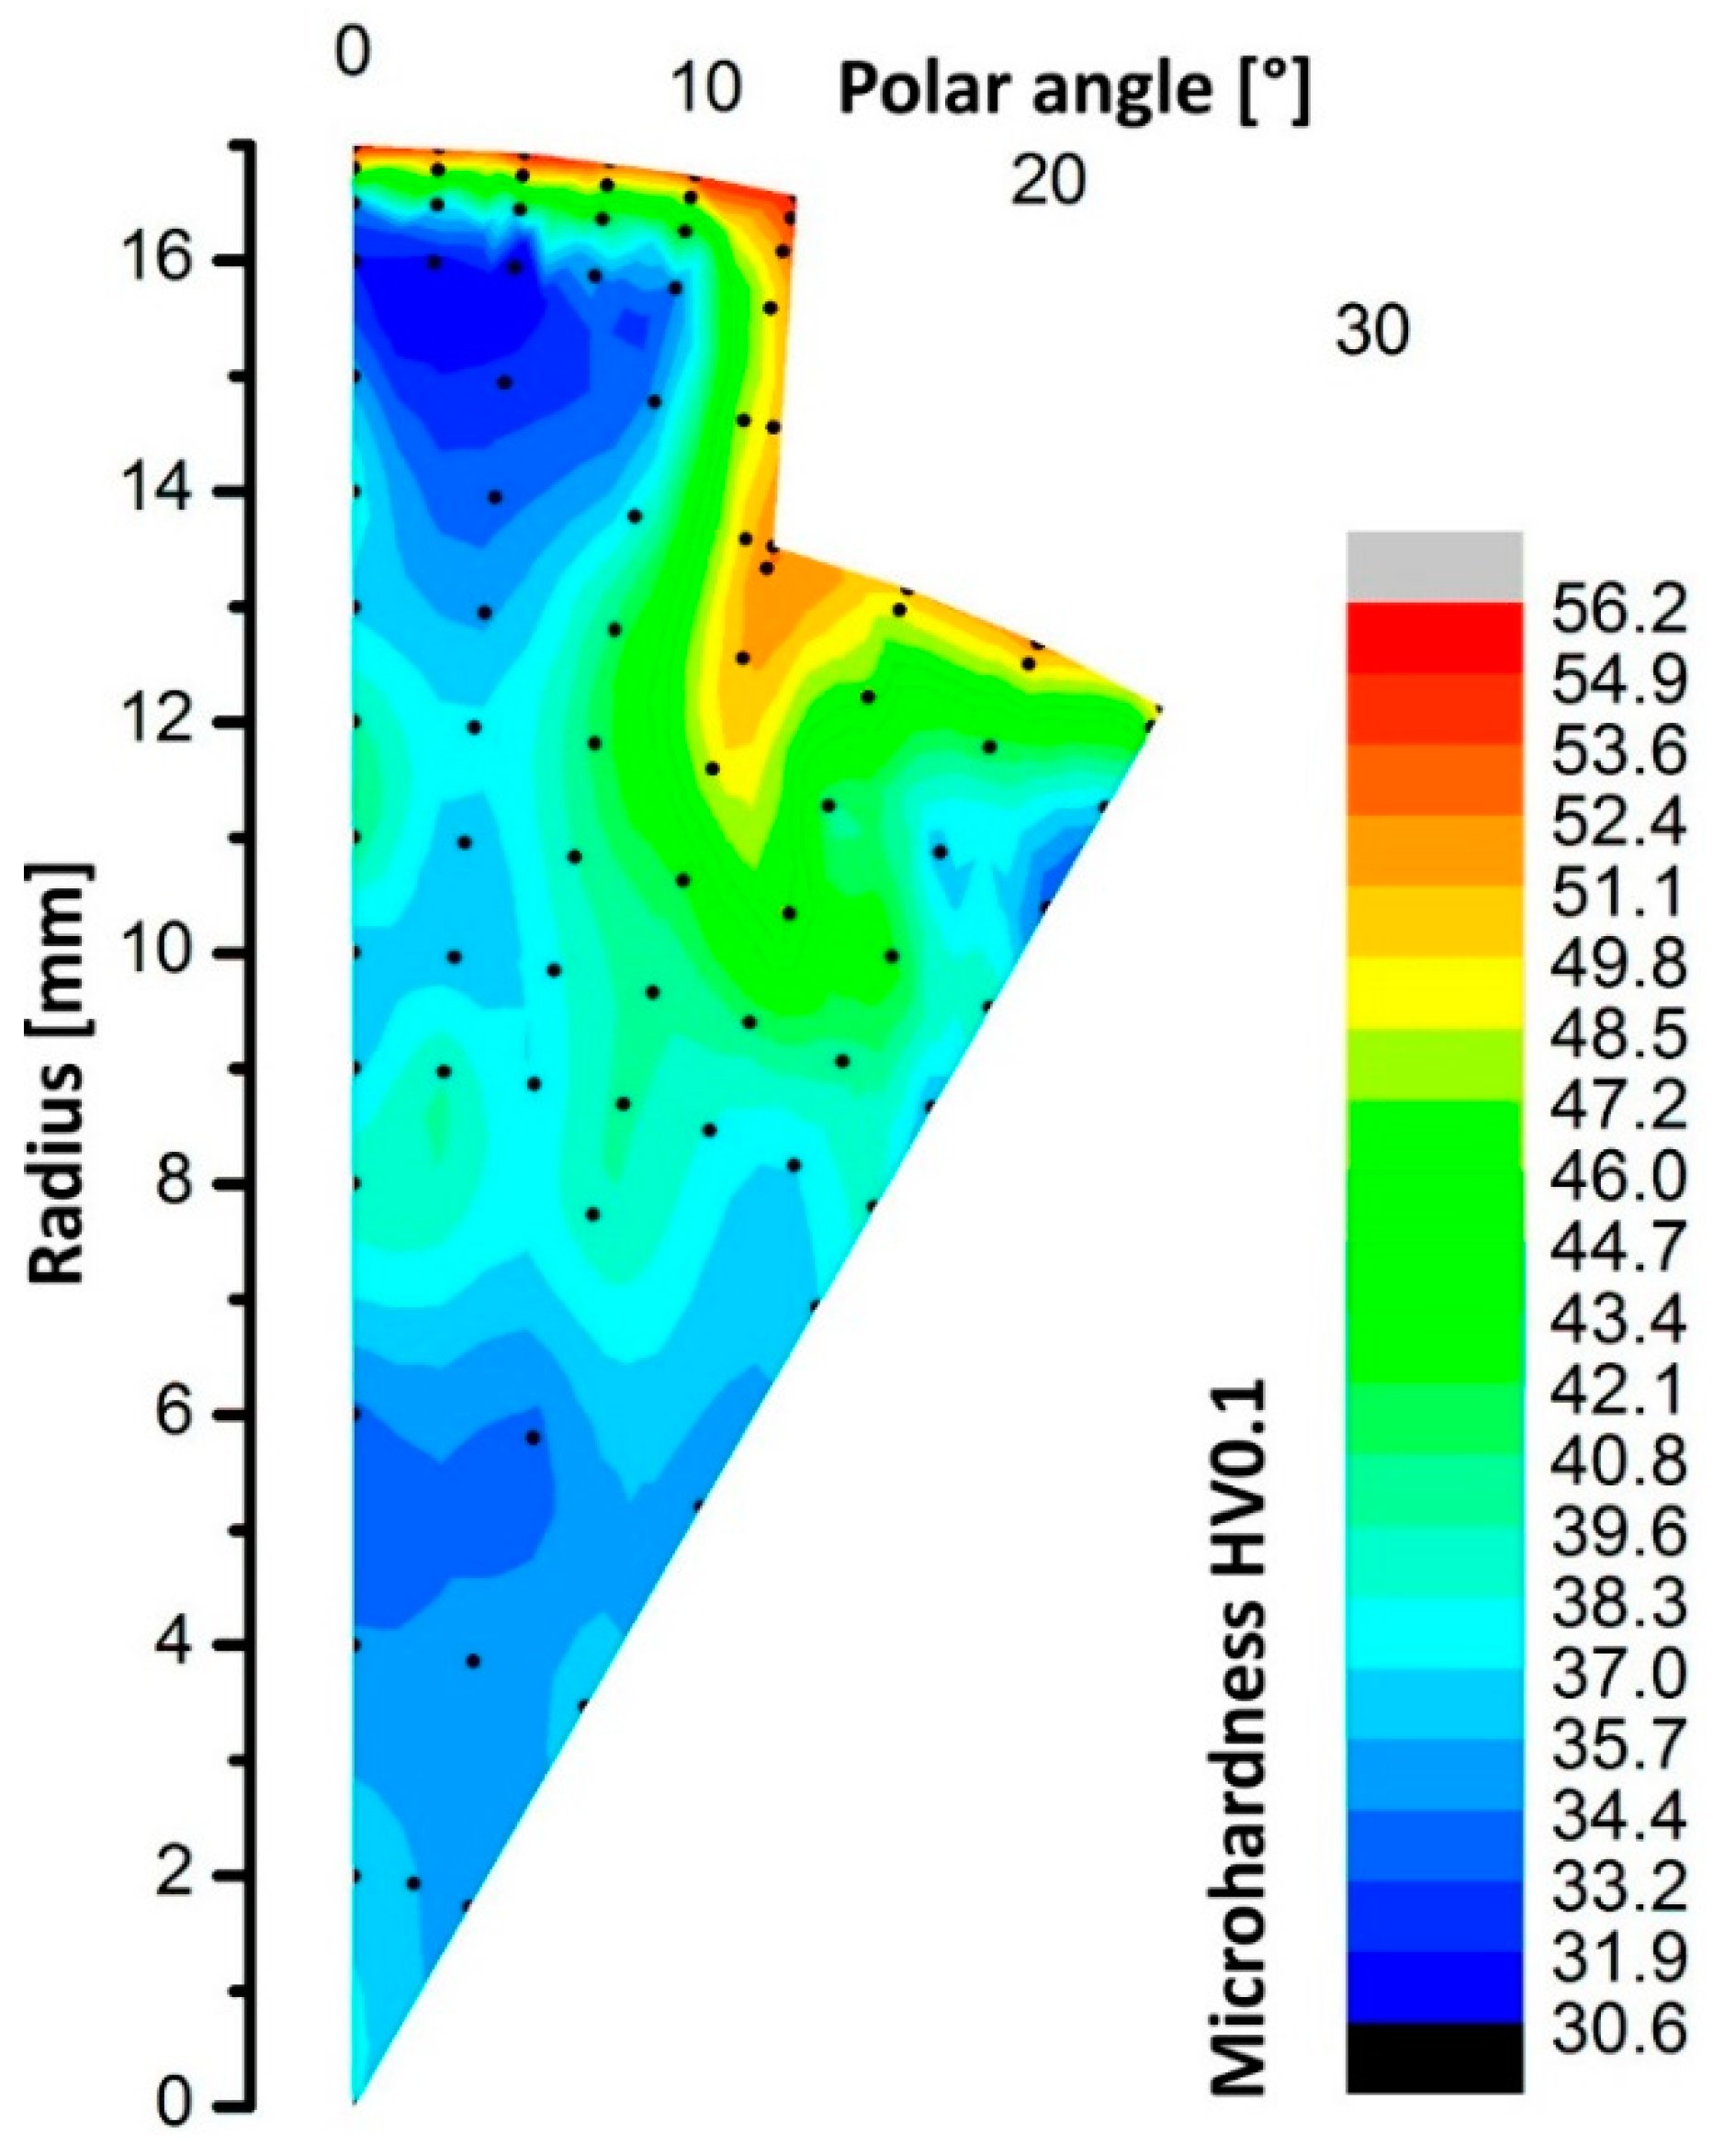
The Vickers microhardness measurements were performed according to standard EN ISO 6507-1:2018, on a Wilson Tukon 1102 (Buehler, Lake Bluff, IL, USA) hardness testing device with 0.1 kgf (0.9807 N) load and 30 s dwell time. The measurements were done at the outer surface of the extruded gear-like specimen and trough cross-section.
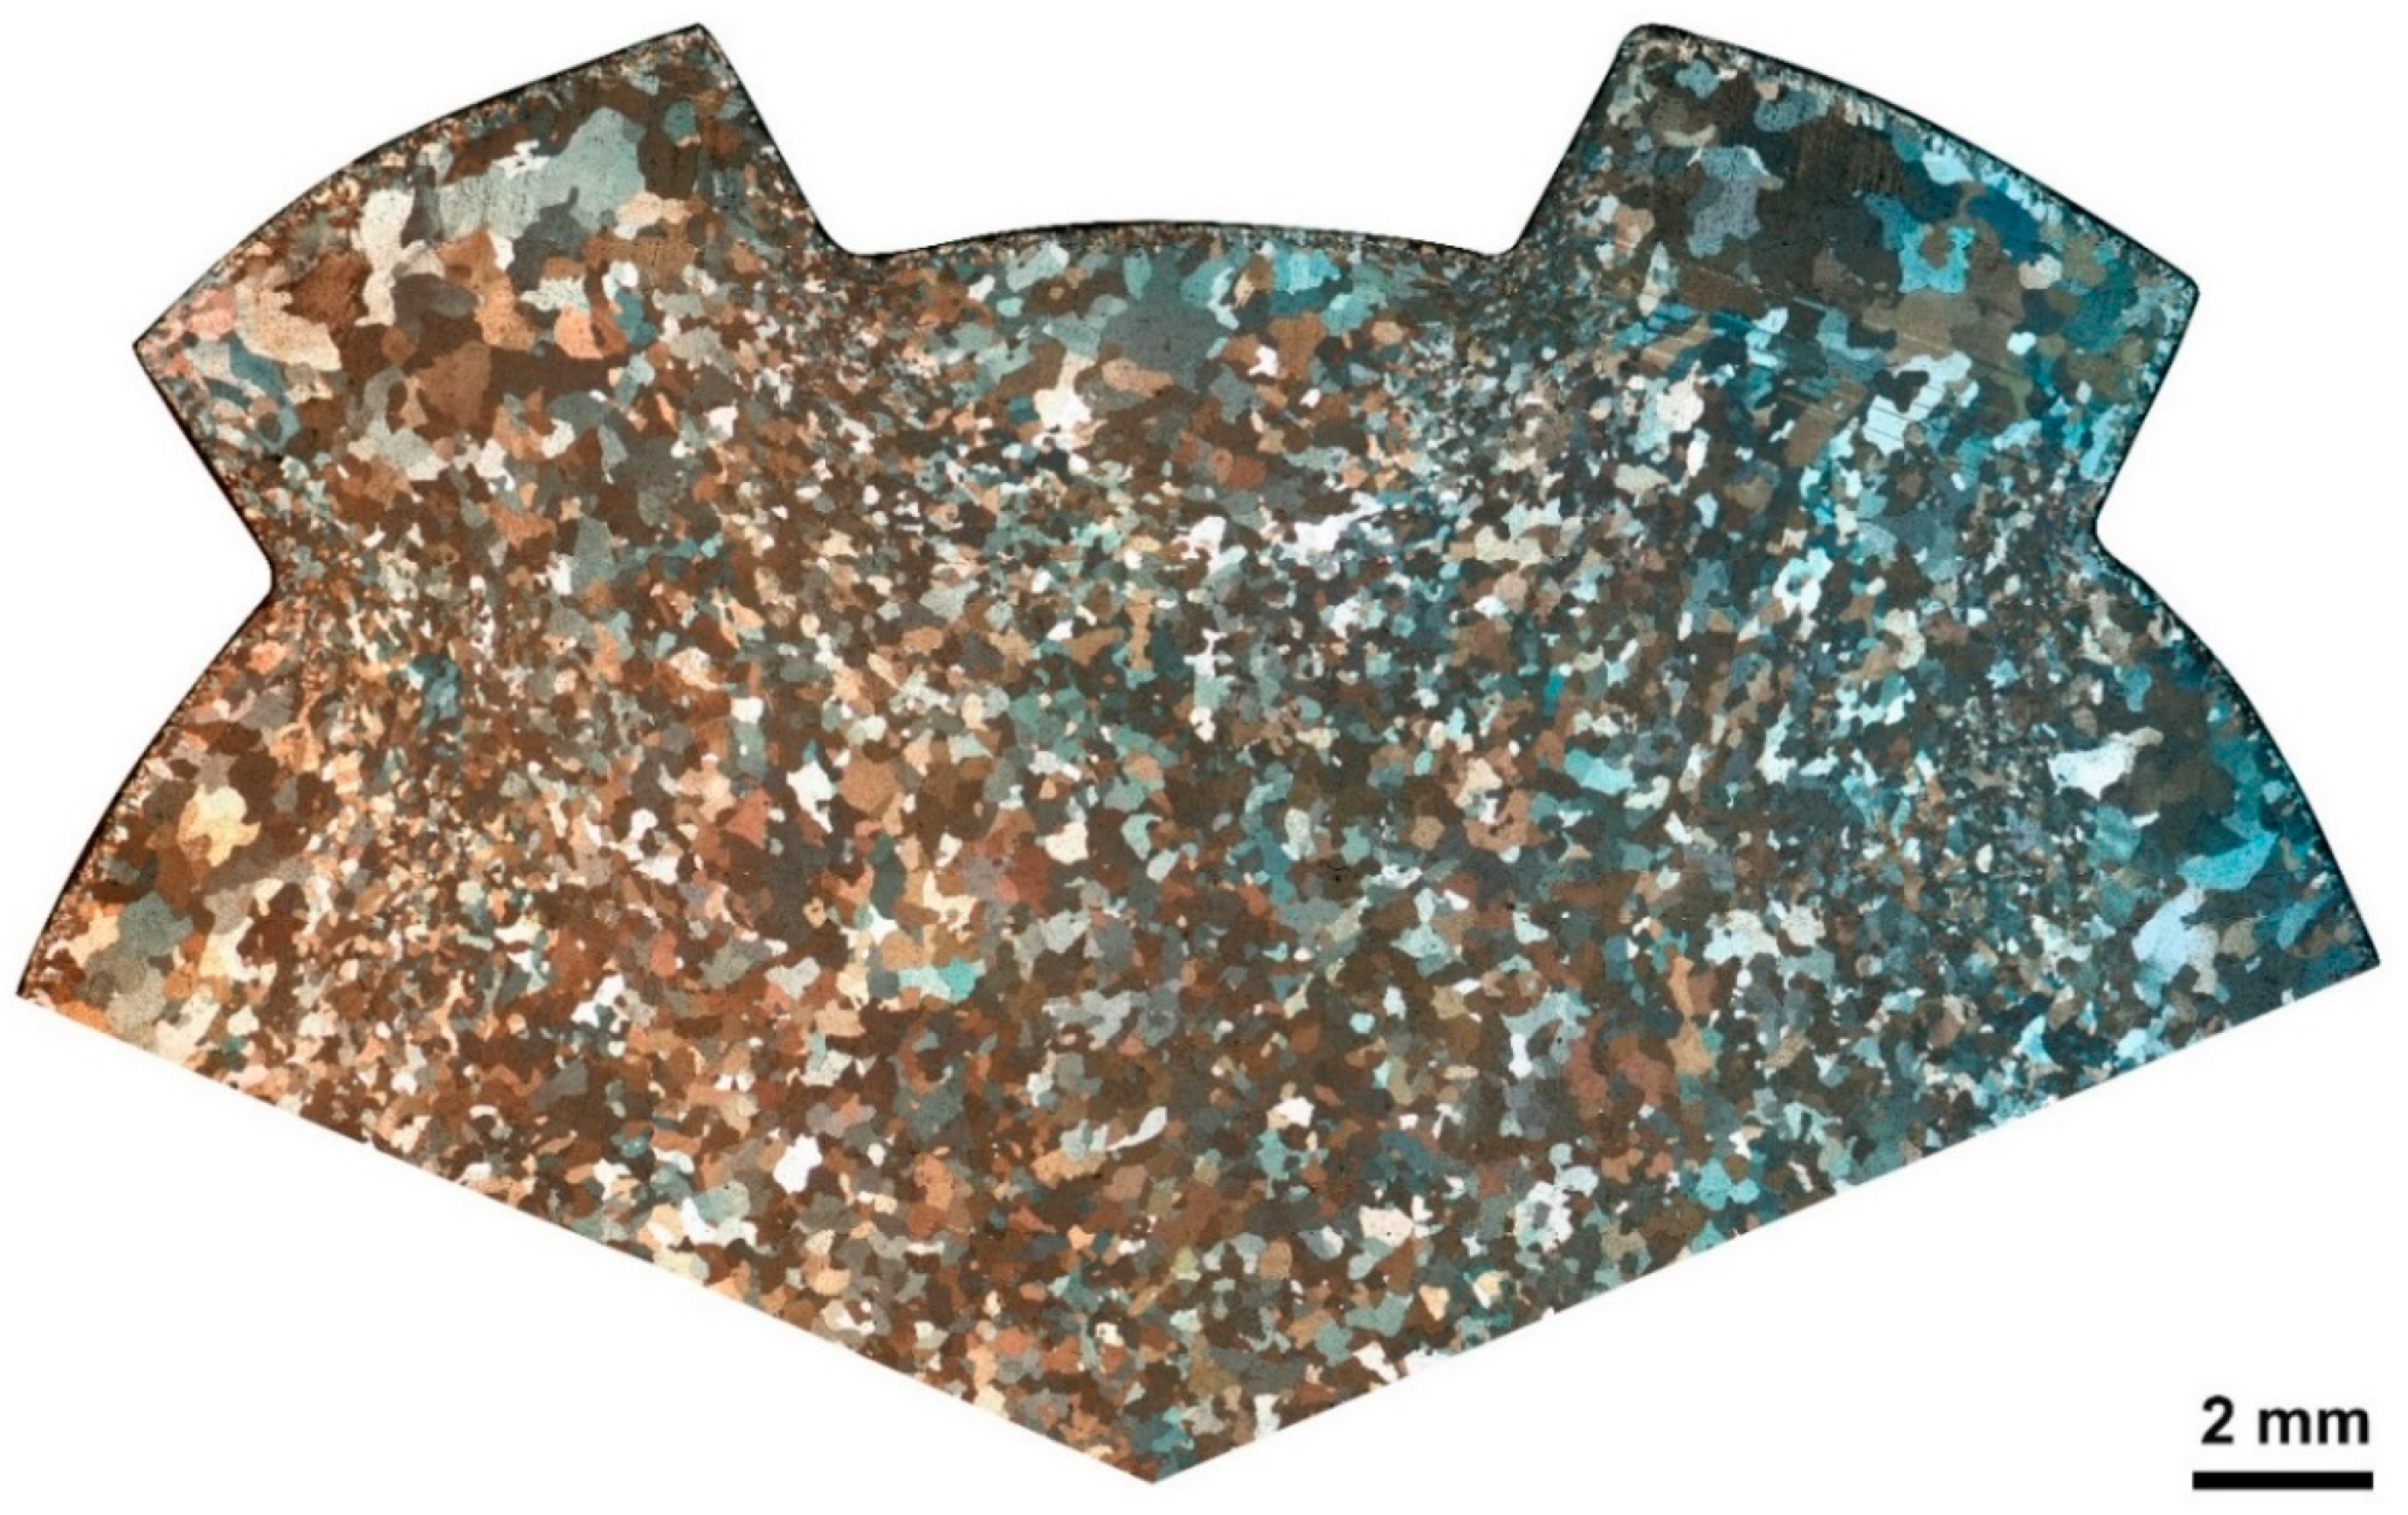
The section of the extruded gear-like element used for microstructure analysis and microhardness measurement is schematically shown in
Figure 4. The positions of measurements, later shown on figures, are given in polar coordinates for angles 0–30°, and for radius from the center of element 0–17 mm.
4. Discussion
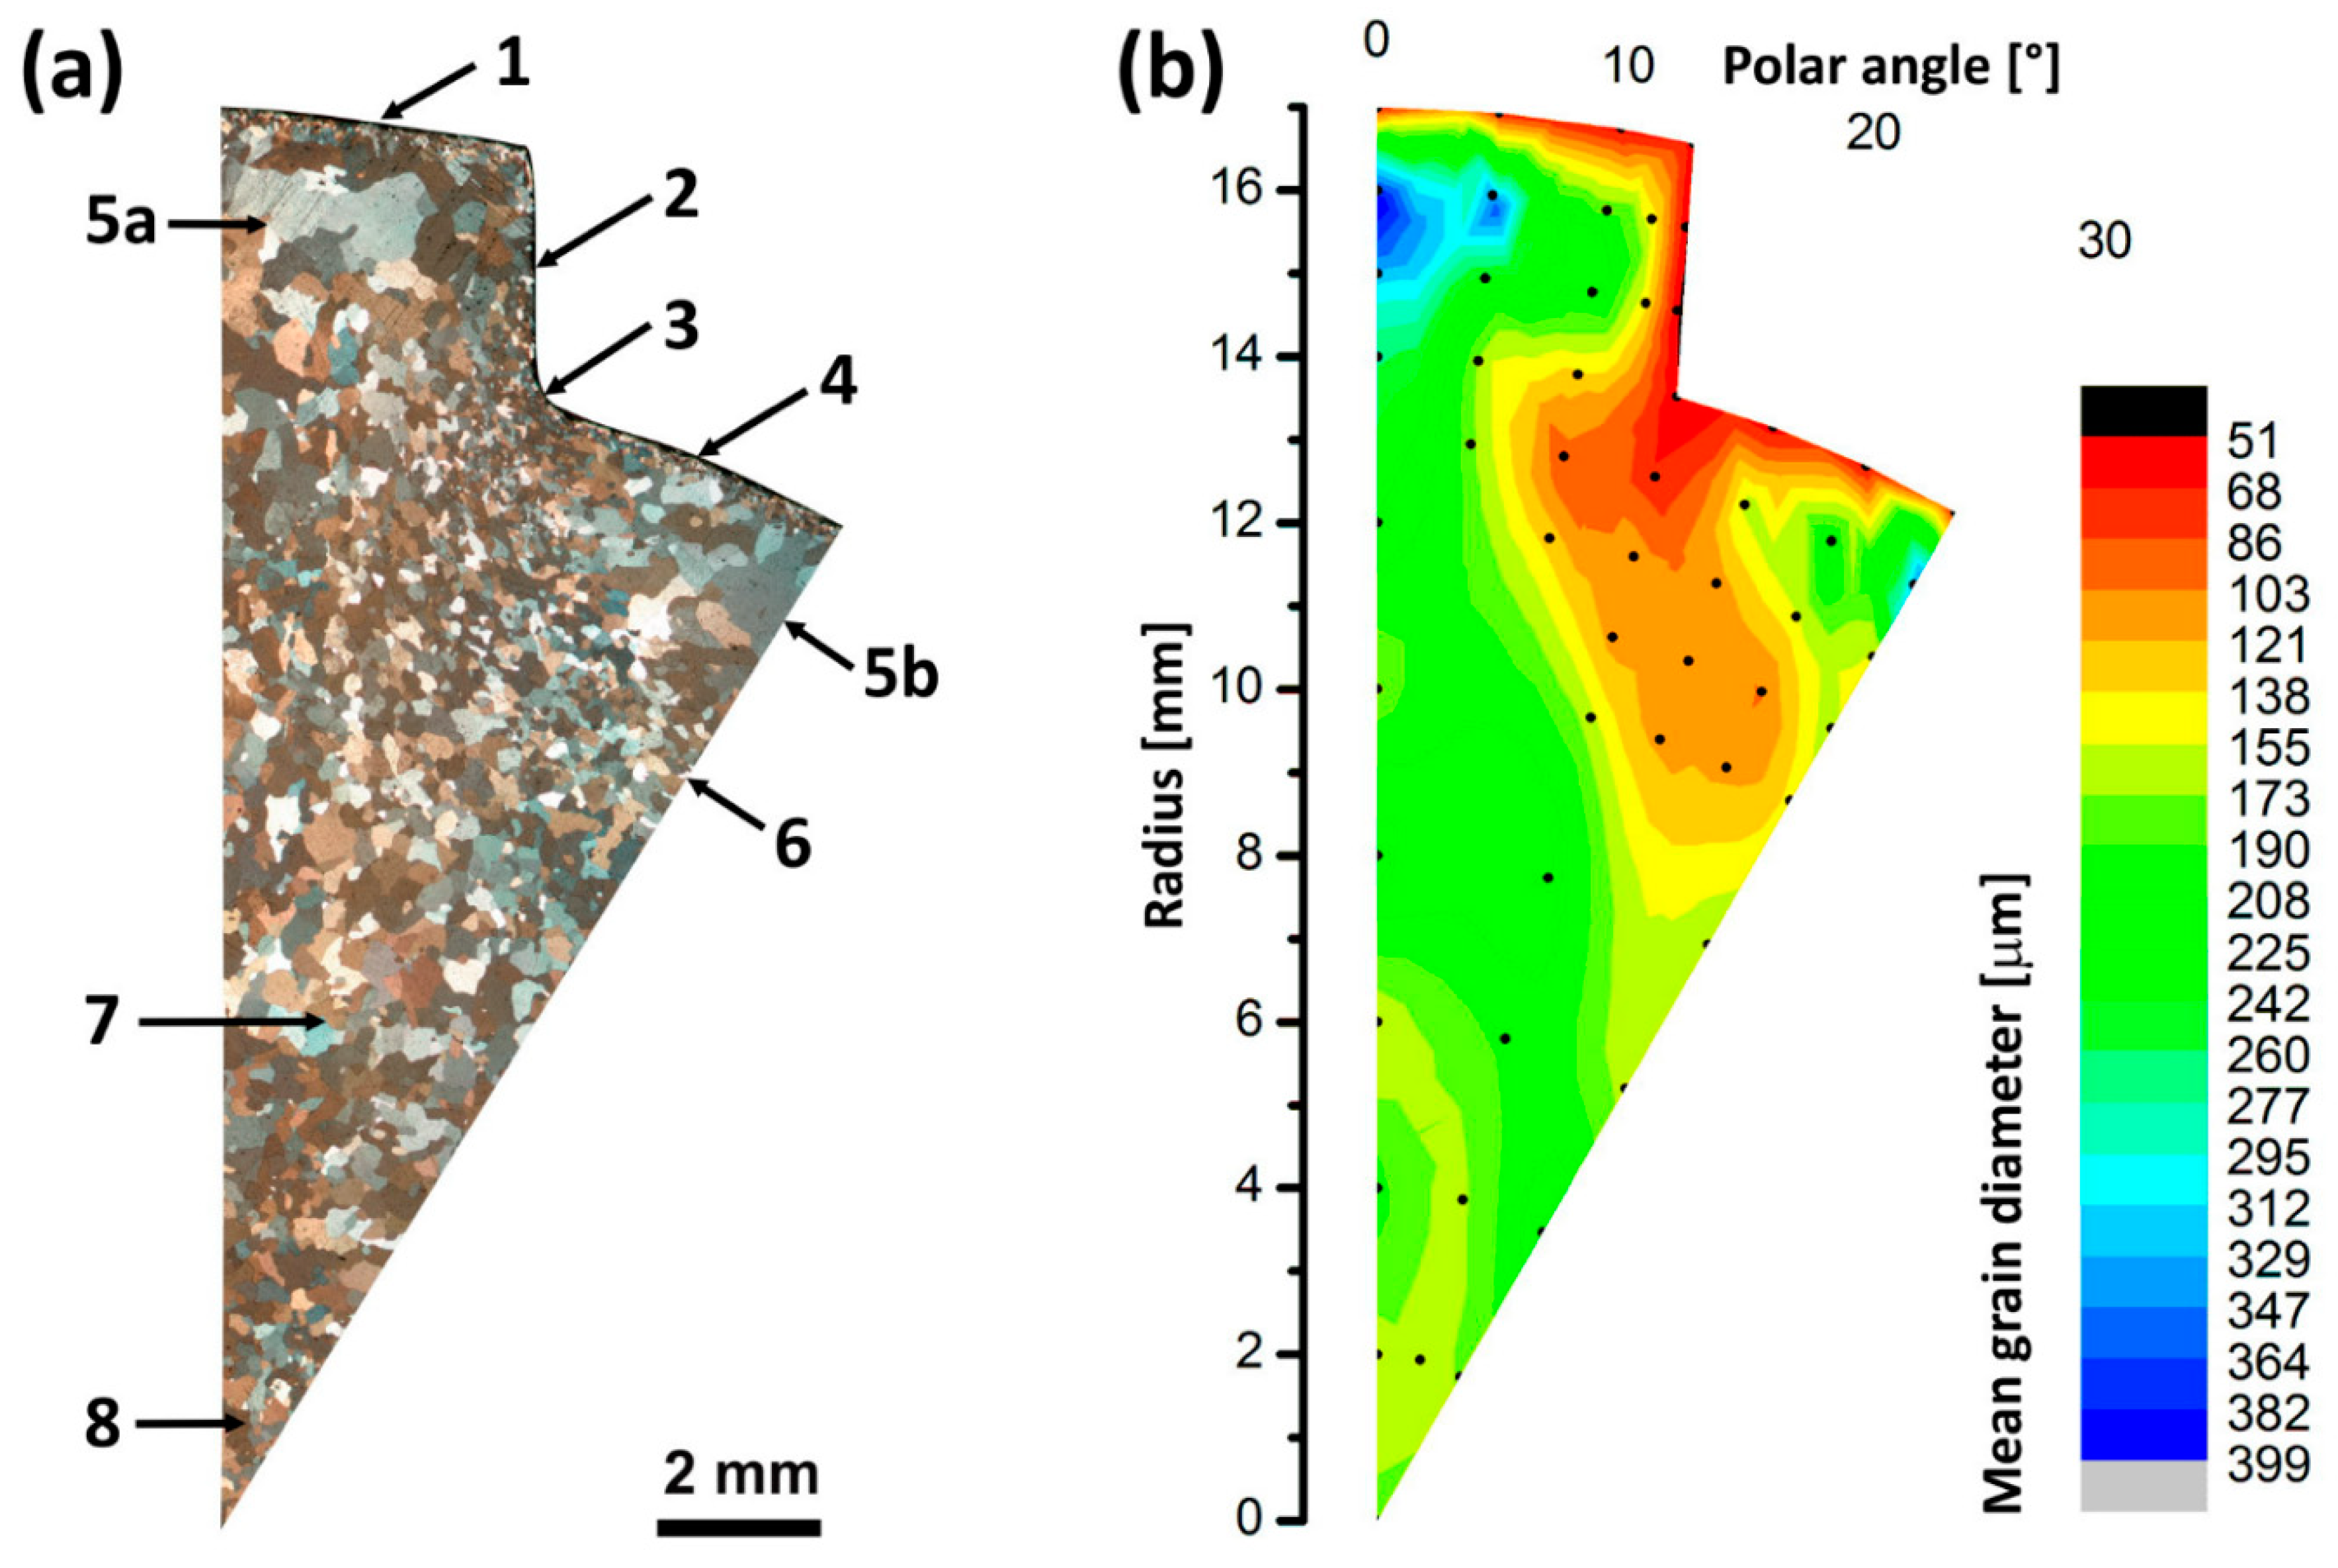
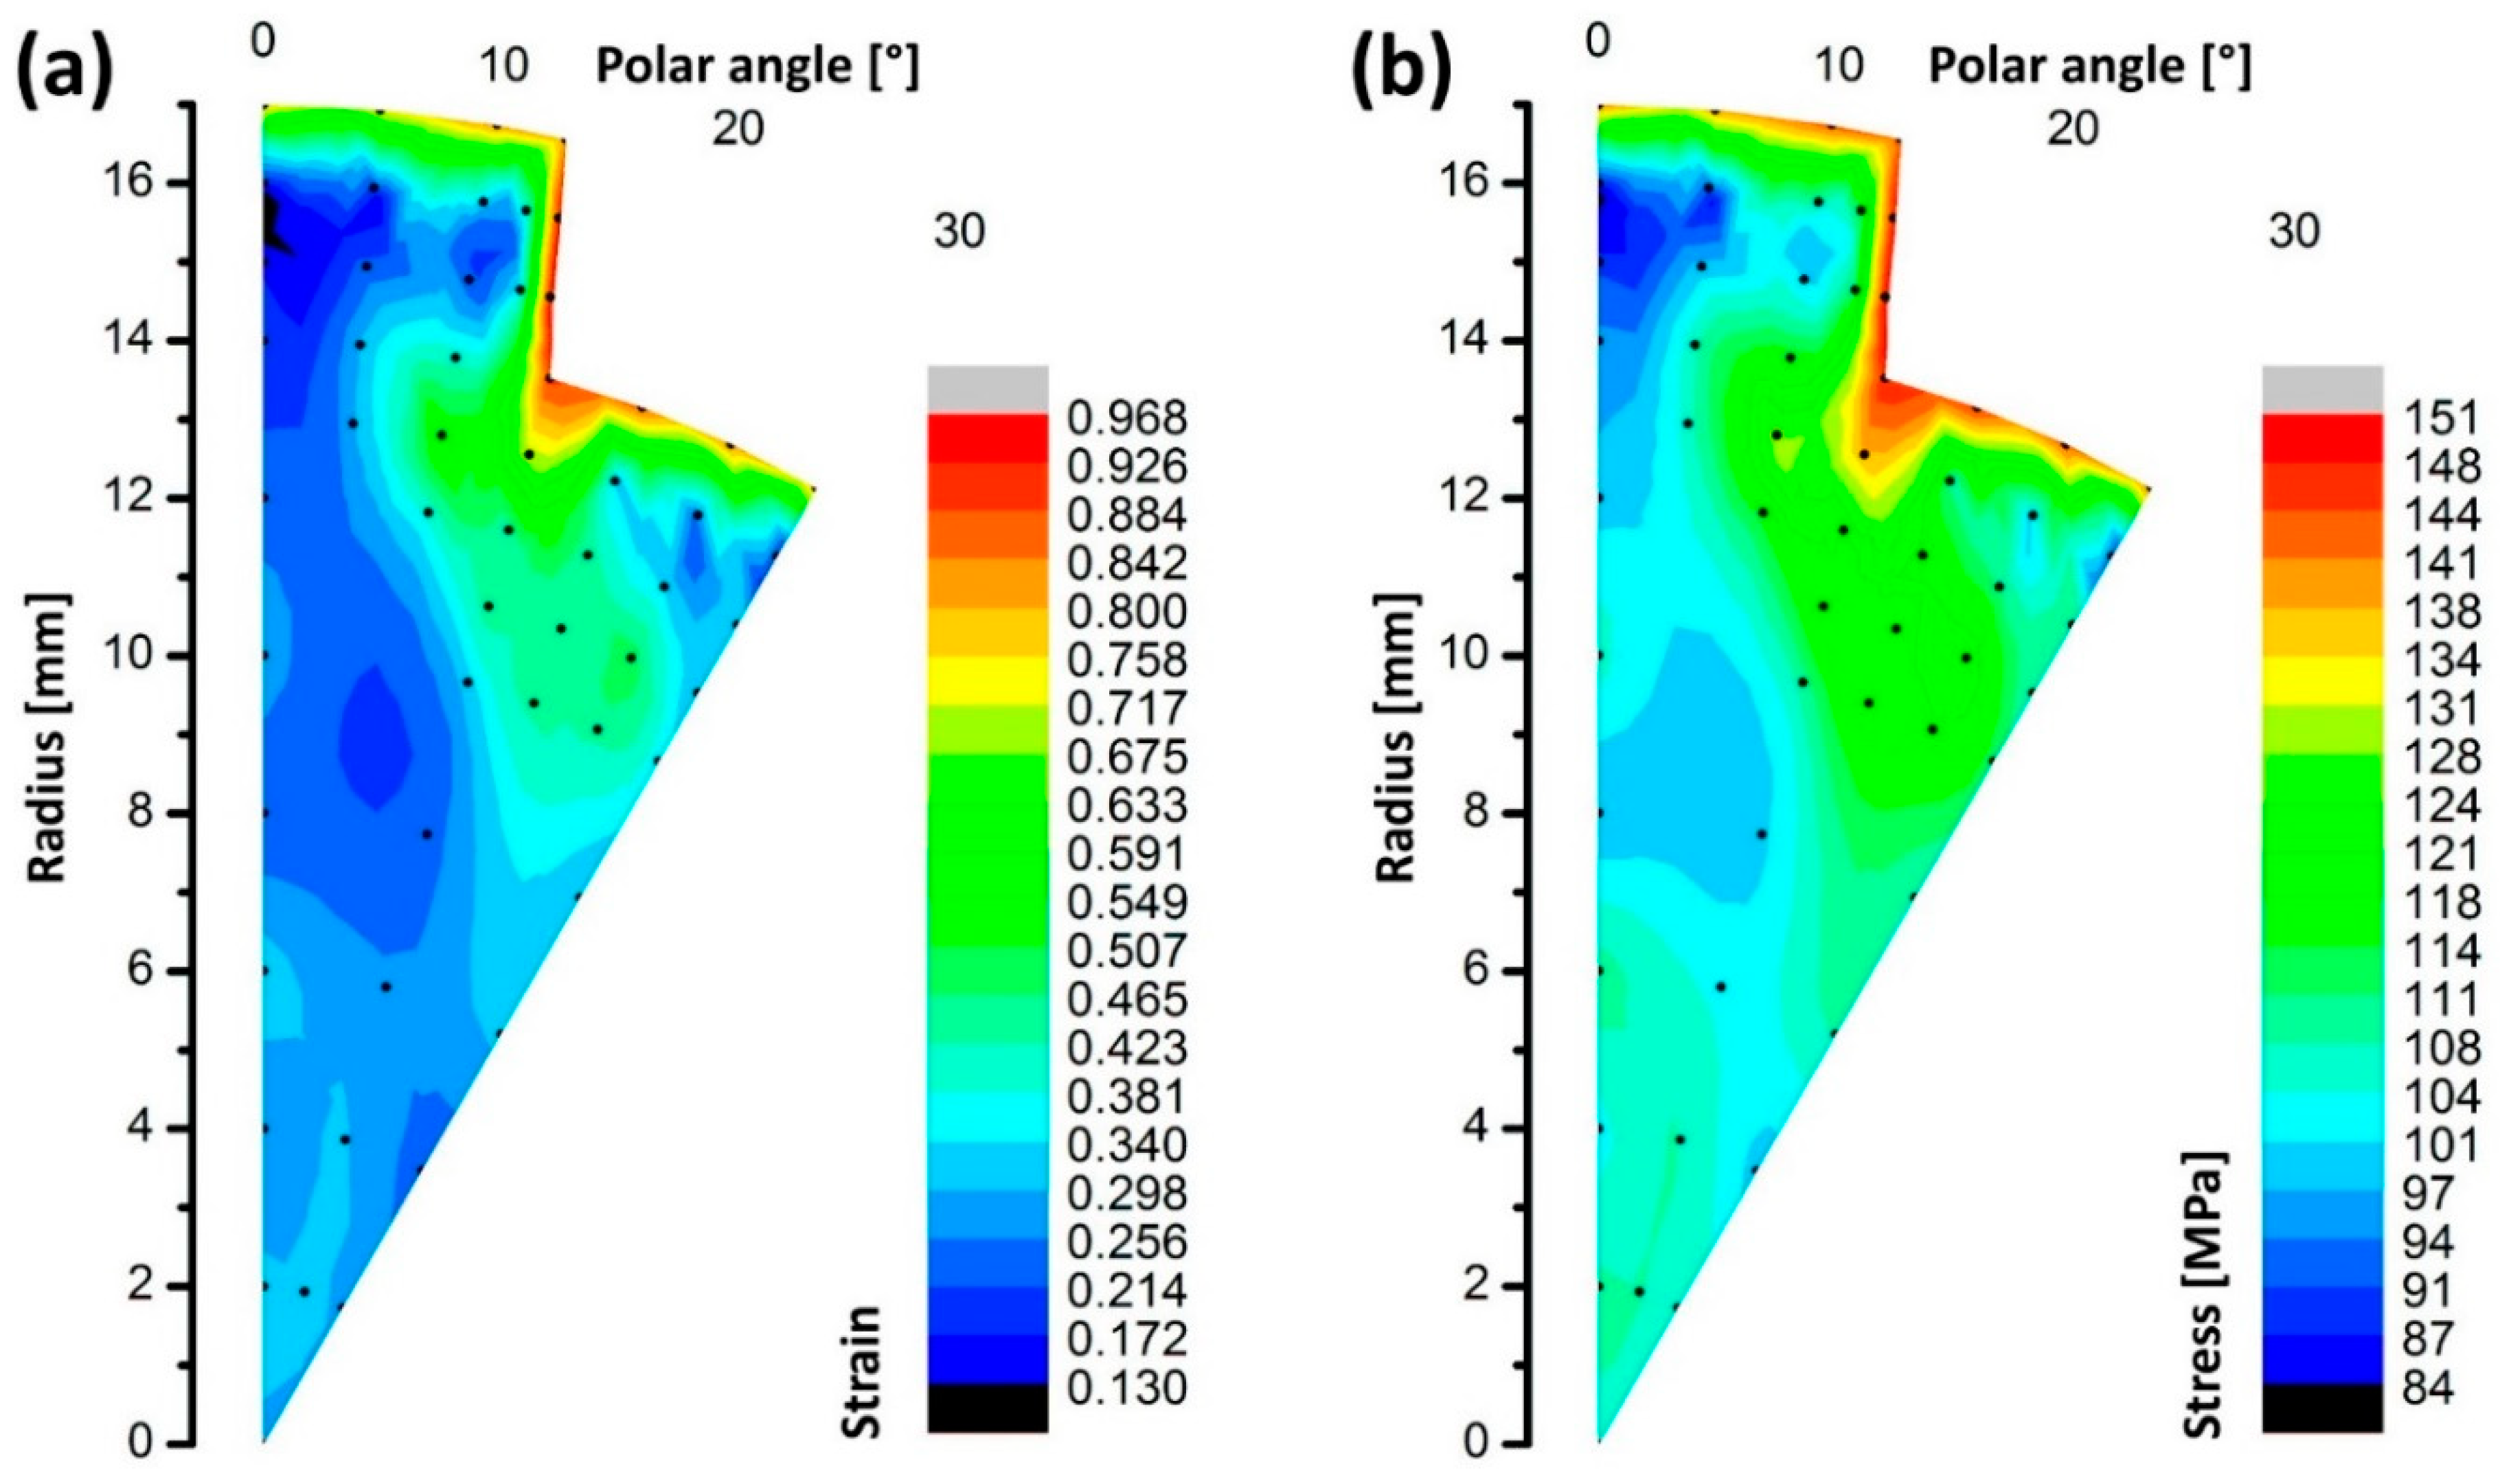
At the beginning of the extrusion process, when the billet is pressed by the punch, the easiest way for material to flow is toward die cavities where teeth are formed. Thus, the highest values of the grain size are in the middle of the tooth, together with the lowest values of strain. That means that material is only slightly deformed, and that is almost translated to the die cavity. Another zone where relatively low deformation is observed is the area between the teeth, close to the surface. However, in this zone, there was no significant flow of the material to free surfaces of die, but deformation is achieved mostly by punch upsetting.
In the center part of the gear-like element, the intermediate values of strain were observed. In addition, the strain values were not homogenous. Slightly higher values were in the very center than in the rest of it. These results could be explained by the fact that in that zone, the material was predominantly upset and stress values are higher than in the rest of the center volume, where material can flow toward die cavities, which caused the stress to decrease.
The highest strain values were obtained at the tooth root and at the surface of the gear-like element. The tooth root was the zone of the highest concentration of stress, as caused by a high change in the direction of material flow. As material between teeth does not flow significantly, because that requires a great change of material flow direction, deformation and flow of material to the tooth is done by high deformation of the material in the “circlet” zone (see
Figure 7). The “circlet” zone represents a zone of intensive deformation caused by the flow of material to the tooth and the pressure of material flow from the center of the part.
The highest strain is obtained at the surface of the gear-like element as a result of the friction influence and high pressure in the extrusion process, especially at the final stage. Thus, the finest grains in those thin surface zones appear.
Similar results are presented in Reference [
1] where strain distribution obtained by numerical simulation in the cold rotary forging process is presented. It can be seen from the results of the simulation that the largest values of the effective strain are located in the area of the tooth root of the forged spur bevel gear, but those results showed only strain values on the surface, without any presentation inside of the part. Further results only for the surface strain distribution are presented in the Reference [
2], which consider lateral extrusion of the gear-like part, while strain distribution attained also by numerical simulation within a part volume is presented in Reference [
12]. The effective strain value of the addendum (top) is lower than that of the dedendum (root), which indicates that the metal of this area undergoes the highest degree of deformation.
The experimental technique utilized for estimating the effective strain distribution based on micro-hardness measurements is presented in Reference [
14]. The relationship between microhardness and the effective strain was determined by the microhardness measurement of several specimens with known values of effective strain. Experimental results were compared with numerical simulation. Both results showed that the highest values of strains were found at the outside contact surface between the workpiece and the tool.
Those results are in accordance with results obtained in this paper by the metallographic method, as the highest deformation was detected in the tooth root, as well as at the surface of the gear-like element. Comparing the metallographic method and simulations, it could be said that the metallographic method gave more accurate information on zone distribution, especially in this case, regarding surface deformation zone depth. Furthermore, the microhardness measurement, used in Reference [
14], as well in this paper shows that deformation zones could be determined, but with lower precision, as the microhardness measurement was more dependent on the place of indentation (smaller grains, larger grains, grains boundary, distance from free surface etc.), while the metallographic method gave the mean grain diameter in the field of view and also gave direct visualization of the deformation zones (see
Figure 7).
Finally, it could be summarized that through the introduced metallographic method, the real view of material flow in the extruded part was successfully obtained.
Author Contributions
Conceptualization, P.S. and L.S.; formal analysis, P.S., D.R., S.B., A.S. and P.N.; investigation, P.S, D.R., P.J.; methodology, P.S., D.R. and L.S.; validation, A.S. and P.N.; resources, S.B.; data curation, P.S., D.R. and P.J.; writing—original draft preparation, P.S., D.R., P.J., S.B., A.S., and P.N.; writing—review and editing, P.S., D.R. and L.S.; visualization, D.R. and P.J.; supervision, L.S. All authors have read and agreed to the published version of the manuscript.
Funding
This research received no external funding.
Conflicts of Interest
The authors declare no conflict of interest. The funders had no role in the design of the study; in the collection, analyses, or interpretation of data; in the writing of the manuscript, or in the decision to publish the results.
References
- Xiaobin, D.; Lin, H.; Xinghui, H.; Yanli, S. Numerical and experimental investigation of cold rotary forging of a 20CrMnTi alloy spur bevel gear. Mater. Des. 2011, 32, 1376–1389. [Google Scholar] [CrossRef]
- Jafarzadeh, H.; Faraji, G.; Dizaji, A.F. Analysis of lateral extrusion of gear-like form parts. J. Mech. Sci. Technol. 2012, 26, 3243–3252. [Google Scholar] [CrossRef]
- Politis, D.J.; Lin, J.; Dean, T.A.; Balint, D.S. An investigation into the forging of Bi-metal gears. J. Mater. Process. Technol. 2014, 214, 2248–2260. [Google Scholar] [CrossRef]
- Choi, J.; Cho, H.; Choi, J. Upper bound analysis for forging of trochoidal gears. J. Mater. Process. Technol. 2000, 103, 347–352. [Google Scholar] [CrossRef]
- Chitkara, N.R.; Bhutta, M.A. Shape heading of splines and solid spur gear forms: An analysis and some experiments. Int. J. Mech. Sci. 2001, 43, 1073–1106. [Google Scholar] [CrossRef]
- Can, Y.; Misirli, C. Analysis of spur gear forms with tapered tooth profile. Mater. Des. 2008, 29, 829–838. [Google Scholar] [CrossRef]
- Song, J.H.; Im, Y.T. The applicability of process design system for forward extrusion of spur gears. J. Mater. Process. Technol. 2007, 184, 411–419. [Google Scholar] [CrossRef]
- Sidor, J.J.; Petrov, R.H.; Xie, Q.; Van Houtte, P.; Kestens, L.A.I. Evaluation of crystallographic changes and plastic strain ratio in Al alloys. Mater. Sci. Technol. 2017, 33, 667–677. [Google Scholar] [CrossRef]
- Nouri, M.; Mohammadian, S.H.; Emadoddin, E.; Seop, K.H. Investigation of direct extrusion channel effects on twist extrusion using experimental and finite element analysis. Measurement 2018, 127, 115–123. [Google Scholar] [CrossRef]
- Kim, J.H.; Lee, M.G.; Kang, J.H.; Oh, C.S.; Barlat, F. Crystal plasticity finite element analysis of ferritic stainless steel for sheet formability prediction. Int. J. Plast. 2017, 93, 26–45. [Google Scholar] [CrossRef]
- Feng, W.; Hua, L.; Han, X.H. Finite element analysis and simulation for cold precision forging of a helical gear. J. Cent. South Univ. 2012, 19, 3369–3377. [Google Scholar] [CrossRef]
- Zeramdini, B.; Robert, C.; Germain, G.; Pottier, T. Numerical simulation of metal forming processes with 3D adaptive Remeshing strategy based on a posteriori error estimation. Int. J. Mater. Form. 2019, 12, 411–428. [Google Scholar] [CrossRef]
- Faregh, S.S.H.; Hassani, A. Stress and strain distribution in twist extrusion of AA6063 aluminum alloy. Int. J. Mater. Form. 2018, 11, 175–184. [Google Scholar] [CrossRef]
- Alves, M.L.; Rodrigues, J.M.C.; Martins, P.A.F. Cold forging of gears: Experimental and theoretical investigation. Finite Elem. Anal. Des. 2001, 37, 549–558. [Google Scholar] [CrossRef]
- Oyekanmi, B.O.; Hughes, T.A.; Bramley, A.N. A microstructural evaluation technique for deformation studies in metal forming processes. J. Mater. Process. Technol. 1990, 21, 75–89. [Google Scholar] [CrossRef]
- Ha, J.; Lee, J.; Kim, J.H.; Lee, M.G.; Barlat, F. Investigation of plastic strain rate under strain path changes in dual-phase steel using microstructure-based modeling. Int. J. Plast. 2017, 93, 89–111. [Google Scholar] [CrossRef]
- Vilotic, D.; Alexandrov, S.; Plancak, M.; Movrin, D.; Ivanisevic, A.; Vilotic, M. Material formability at upsetting by V-shape dies. Steel Res. 2011, 2011, 923–928. [Google Scholar]
- Jawale, K.; Duarte, J.F.; Reis, A.; Silva, M.B. Characterizing fracture forming limit and shear fracture forming limit for sheet metals. J. Mater. Process. Technol. 2018, 255, 886–897. [Google Scholar] [CrossRef]
- Qi, Y.; Kosinova, A.; Lakin, E.; Popov, V.V., Jr.; Rabkin, E.; Lapovok, R. Effect of SPD Processing on the Strength and Conductivity of AA6061 Alloy. Adv. Eng. Mater. 2019, 21, 1801370. [Google Scholar] [CrossRef]
- Larianovsky, N.; Popov, V.; Katz-Demyanetz, A.; Fleisher, A.; Meyers, D.E.; Chaudhuri, R.S. Production of Al Metal Matrix Composites Reinforced With Carbon Nanotubes by Two-Stage Melt-Based HPDC-CE Method. ASME. J. Eng. Mater. Technol. 2019, 141, 011002. [Google Scholar] [CrossRef]
- International Cold Forging Group. 40 Years History Document; Document No18/07; ICFG: Los Angeles, CA, USA, 2007. [Google Scholar]
© 2020 by the authors. Licensee MDPI, Basel, Switzerland. This article is an open access article distributed under the terms and conditions of the Creative Commons Attribution (CC BY) license (http://creativecommons.org/licenses/by/4.0/).


 ,
, 


