Article

Effect of Lubrication on Friction in Bending under Tension Test-Experimental and Numerical Approach

by
Tomasz Trzepiecinski
1 and
Hirpa G. Lemu
2,*
1
Department of Materials Forming and Processing, Rzeszow University of Technology, 35-959 Rzeszów, Poland
2
Faculty of Science and Technology, University of Stavanger, N-4036 Stavanger, Norway
*
Author to whom correspondence should be addressed.
Metals 2020, 10(4), 544; https://doi.org/10.3390/met10040544
Submission received: 29 March 2020 / Revised: 14 April 2020 / Accepted: 21 April 2020 / Published: 23 April 2020
(This article belongs to the Special Issue Forming Processes of Modern Metallic Materials)

Abstract

:
This paper is aimed to determine the value of coefficient of friction (COF) at the rounded edge of the die in the sheet metal forming operations using the bending under tension (BUT) test. The experimental part of the investigations is devoted to the study of the frictional resistances of low alloy steel sheet under different strains of the specimen, surface roughnesses of the tool and for different lubrication conditions. Three oils are destined for different conditions of duties in the stamping process. Numerical modeling of the material flow in the BUT test has been conducted in the MSC.Marc program. One of the objectives of the numerical computations is to know the type of the contact pressure acting on the cylindrical surface countersample in the BUT test by assuming the anisotropic properties of the metallic sheet. It has been found that the COF in the rounded edge of the die does not vary with increasing sheet elongation. Taking into account that normal pressure increases with increasing specimen elongation and workpiece material is subjected to strain hardening phenomenon, the COF value is very stable during the friction test. The effectiveness of the lubrication depends on the balance between two mechanisms accompanied by friction process: roughening of workpiece asperities and adhesion of the contacting surfaces. In the case of high surface roughness of tool due to a dominant share of ploughing, all of the lubricants used were not able to decrease the COF in a sufficient extent. The used lubricants were able to reduce the value of friction coefficient approximately by 3–52% in relation to the surface roughness of rolls.

1. Introduction

The presence of friction in sheet metal forming (SMF) processes is generally an unfavorable phenomenon and causes changes in the force and energy parameters: the total work and power needed for the process increases, which also causes the forces and unit pressures on the tool surfaces to increase. In a stamping tool, frictional resistance is an important process parameter that controls the material flow in the tool and the surface finish of produced parts [1,2]. At high pressures, the occurrence of material adhesion to the tool and the formation of accretions affect the quality of the product surface [3,4]. Thermal dissipation of friction work at high values of unit pressure and relative speeds leads to a significant increase in temperature in areas adjacent to the contact surface. Limiting of the sliding speed and thus reducing the efficiency of the process may be necessary. The appearance of tangential stresses on the contact surface causes changes in the stress–strain state in the entire volume of the formed material. Friction is one of the reasons for the formation of heterogeneous deformation, which leads to the formation of heterogeneous material properties and undesirable deformations of free surfaces. So, friction has a number of negative effects in SMF processes [5,6,7]. Therefore, it is intended to reduce the value of friction forces. There are extensive studies on correlation of the microstructure of the tool material with the coefficient of friction (COF). However, as found by Kirkhorn et al. [8], increased or decreased carbide content could, however, not be directly correlated to an alteration of the friction coefficient when comparing the broad range of different tool materials.
There are many tribological approaches to measure the frictional phenomena existing at the die–workpiece interface. The methods used to represent the friction conditions in conventional SMF have been summarized by Trzepiecinski and Lemu [9], where the main advantages and disadvantages of the modeling methods of the friction phenomena in specific areas of the material are also presented. Experimental prediction of the frictional resistances is a key issue in the suitable setting of the numerical models of sheet metal forming process [10,11,12].
The basic way to reduce friction forces in plastic forming is proper lubrication. Grease lubrication forms layers when separated on a surface of a deformed object or tool, separating both surfaces partially or completely [13]. The basic properties of the lubricant include viscosity and surface activity, which may be essential for maintaining the lubricant under high unit pressure. Due to the wide variety of conditions for plastic forming processes, there are no universal lubricants. Each process requires a separate approach to the lubrication problem and the use of appropriate lubricants [14,15]. The results of the investigations of Hol et al. [16] show that the friction coefficient varies in space and time, and depend on local process conditions such as the nominal contact pressure and lubrication in the sheet material. There is extensive development of friction models destined for the description of the frictional phenomena for different lubrication conditions [17].
Friction occurring on the rounded surface of the die has an adverse effect on the value of the possible limit deformations of the sheet. One of the basic tests provided for the experimental determination of the friction resistance values on the rounded edge of the die is the bending under tension (BUT) test developed by Littlewood and Wallace [18]. In the BUT test, the tribological conditions in the die entry zone can be simulated by drawing a sheet strip over a die shoulder with superimposed back tension on the strip. Many efforts have been made in the literature to recognize the effect of many process parameters on the contact pressure and friction resistance in the rounded region of the die or the punch. Nanayakkara et al. [19] quantitatively determined the effect of roller radius and the tooling pressure on the COF. It was found that the tool radii have a direct effect in the contact pressure. The second cognitive conclusion is that there is a clear relationship between the contact pressure and the COF. To understand the sheet–die interaction, the bending and unbending response of the sheet as it contacts the cylindrical die, Coubrough et al. [20] conducted investigations on the BUT test. The actual contact angle is found to be less than the geometric angle-of-wrap and increases with increasing strip tension. Fratini et al. [1] used the BUT test to measure friction under lubricated and dry friction conditions. The authors concluded that the effect of lubricant in the reduction of the COF is rather small; this is due to the loose of lubricant, which occurred during the tests because of the contact pressure at the sheet metal–tool interface. However, the lubricant reduced the stick–slip phenomena, which are dangerous during SMF operations, since they can induce the cracks in the surface layer of workpiece. Lemu and Trzepiecinski [21] studied the effect of the amount of plastic deformation of the brass, aluminum alloy and steel specimens on the value of COF. It was found that the use of tools with low surface roughness value to reduce the COF is unfounded because the increased real contact area decreases the effectiveness of the lubricant and increases the interatomic interaction of surfaces. Moreover, the results indicated that use of machine oil reduces the friction coefficient value to a lower degree for lower roughness values. Hoffmann et al. [22] conducted a study where they compared the wear occurred in the die radius for different combinations of die and sheet material. The highest wear of die occurred in the regions where the contact pressure between die and workpiece are the highest. Berglund et al. [23] evaluated the correlation between machining finish, punch material and the COF result. The texture characterization parameters measured after the BUT test exhibit strong correlations with the friction and all are related to the areas and inclinations of the surface. Pereira et al. [24] demonstrated that, in the sheet–die interface in BUT test, there is a transient region in the contact pressure that corresponds to the beginning of sheet deformation, after which the pressure stabilizes. It has been specified that the yield stress and relationship between sheet thickness and radius of the die greatly influence the values of contact pressure. In a later study, Pereira et al. [25] analyzed numerically through finite element simulation of the evolution of contact pressure in the die radius during the stamping process. It has been found that the same pressure peaks occur during bending of the sheet over the radius of the die, causing the central part of these peaks to lose contact and greatly reducing the pressure in this region. Ceron and Bay [26] investigated how the BUT test combined with a classical analytical modeling may lead to very large errors in estimation of the COFs. The numerical simulations of the normal stress distributions demonstrated in comparative analysis of an industrial, multistage deep drawing that finite element modeling provides appropriate estimates.
Most of the investigations on the numerical analysis of the tribological test have been conducted assuming the isotropic properties of the material. Moreover, due to bending of the sheet over a rounded die, the assumption that the specimen is subjected to plane strain state is also unjustified, which has been confirmed by authors in the previous papers devoted to the draw bead friction test [27,28]. Thus, one objective of this work reported in this paper is to better understand the contact pressure acting on the rounded edge of the cylindrical countersample in the BUT test by assuming the anisotropic properties of the metallic sheet. Another aim of the paper is to calculate the COF that acts during the BUT test for different strains of the sheet metal. Frictional properties of low alloy steel sheet have been experimentally evaluated for different lubricants.

2. Experimental

2.1. Material

In the investigations, cold-rolled low carbon DC04 grade steel sheets with a thickness of 1 mm were used. These steel sheets are characterized by super deep-drawing properties manifested by high plasticity and high susceptibility to strain hardening. According to the standard EN 10130:2009, DC04 steel sheet is suitable for cold forming of complicated outer and inner components of automobile bodies and other pressworks, especially for high deformation speed. The chemical composition of the DC04 steel sheet is shown in Table 1.
Mechanical properties of the sheets have been determined in a uniaxial tensile test according to ISO 6892-1:2016 [29]. Flat specimens have been cut from the sheet metal in three directions: along rolling direction (RD) and at angles of 45° and 90° to the RD. Z100 (Zwick Roell, Ulm, Germany) uniaxial tensile test machine was used in the investigations of the mechanical properties of the sheets (Table 2). The following parameters have been determined: ultimate tensile strength Rm, yield stress Rp0.2 and anisotropy factor r (Lankford’s coefficient). Moreover, the strain hardening properties have been determined by approximation of the true stress–true strain relation using the Hollomon equation:
σ = K × ε n
where σ is the true stress, ε is the true strain, K is the strength coefficient and n is the strain hardening exponent.
Surface roughness parameters (Table 3) of the tested sheet were determined using a Talysurf CCI Lite 3D optical profiler (Taylor Hobson, Leicester, UK). The following basic parameters have been determined: root mean square roughness Sq, average roughness Sa, maximum pit depth Sv, 10-point peak-valley surface roughness Sz, total height St and the highest peak of the surface Sp.

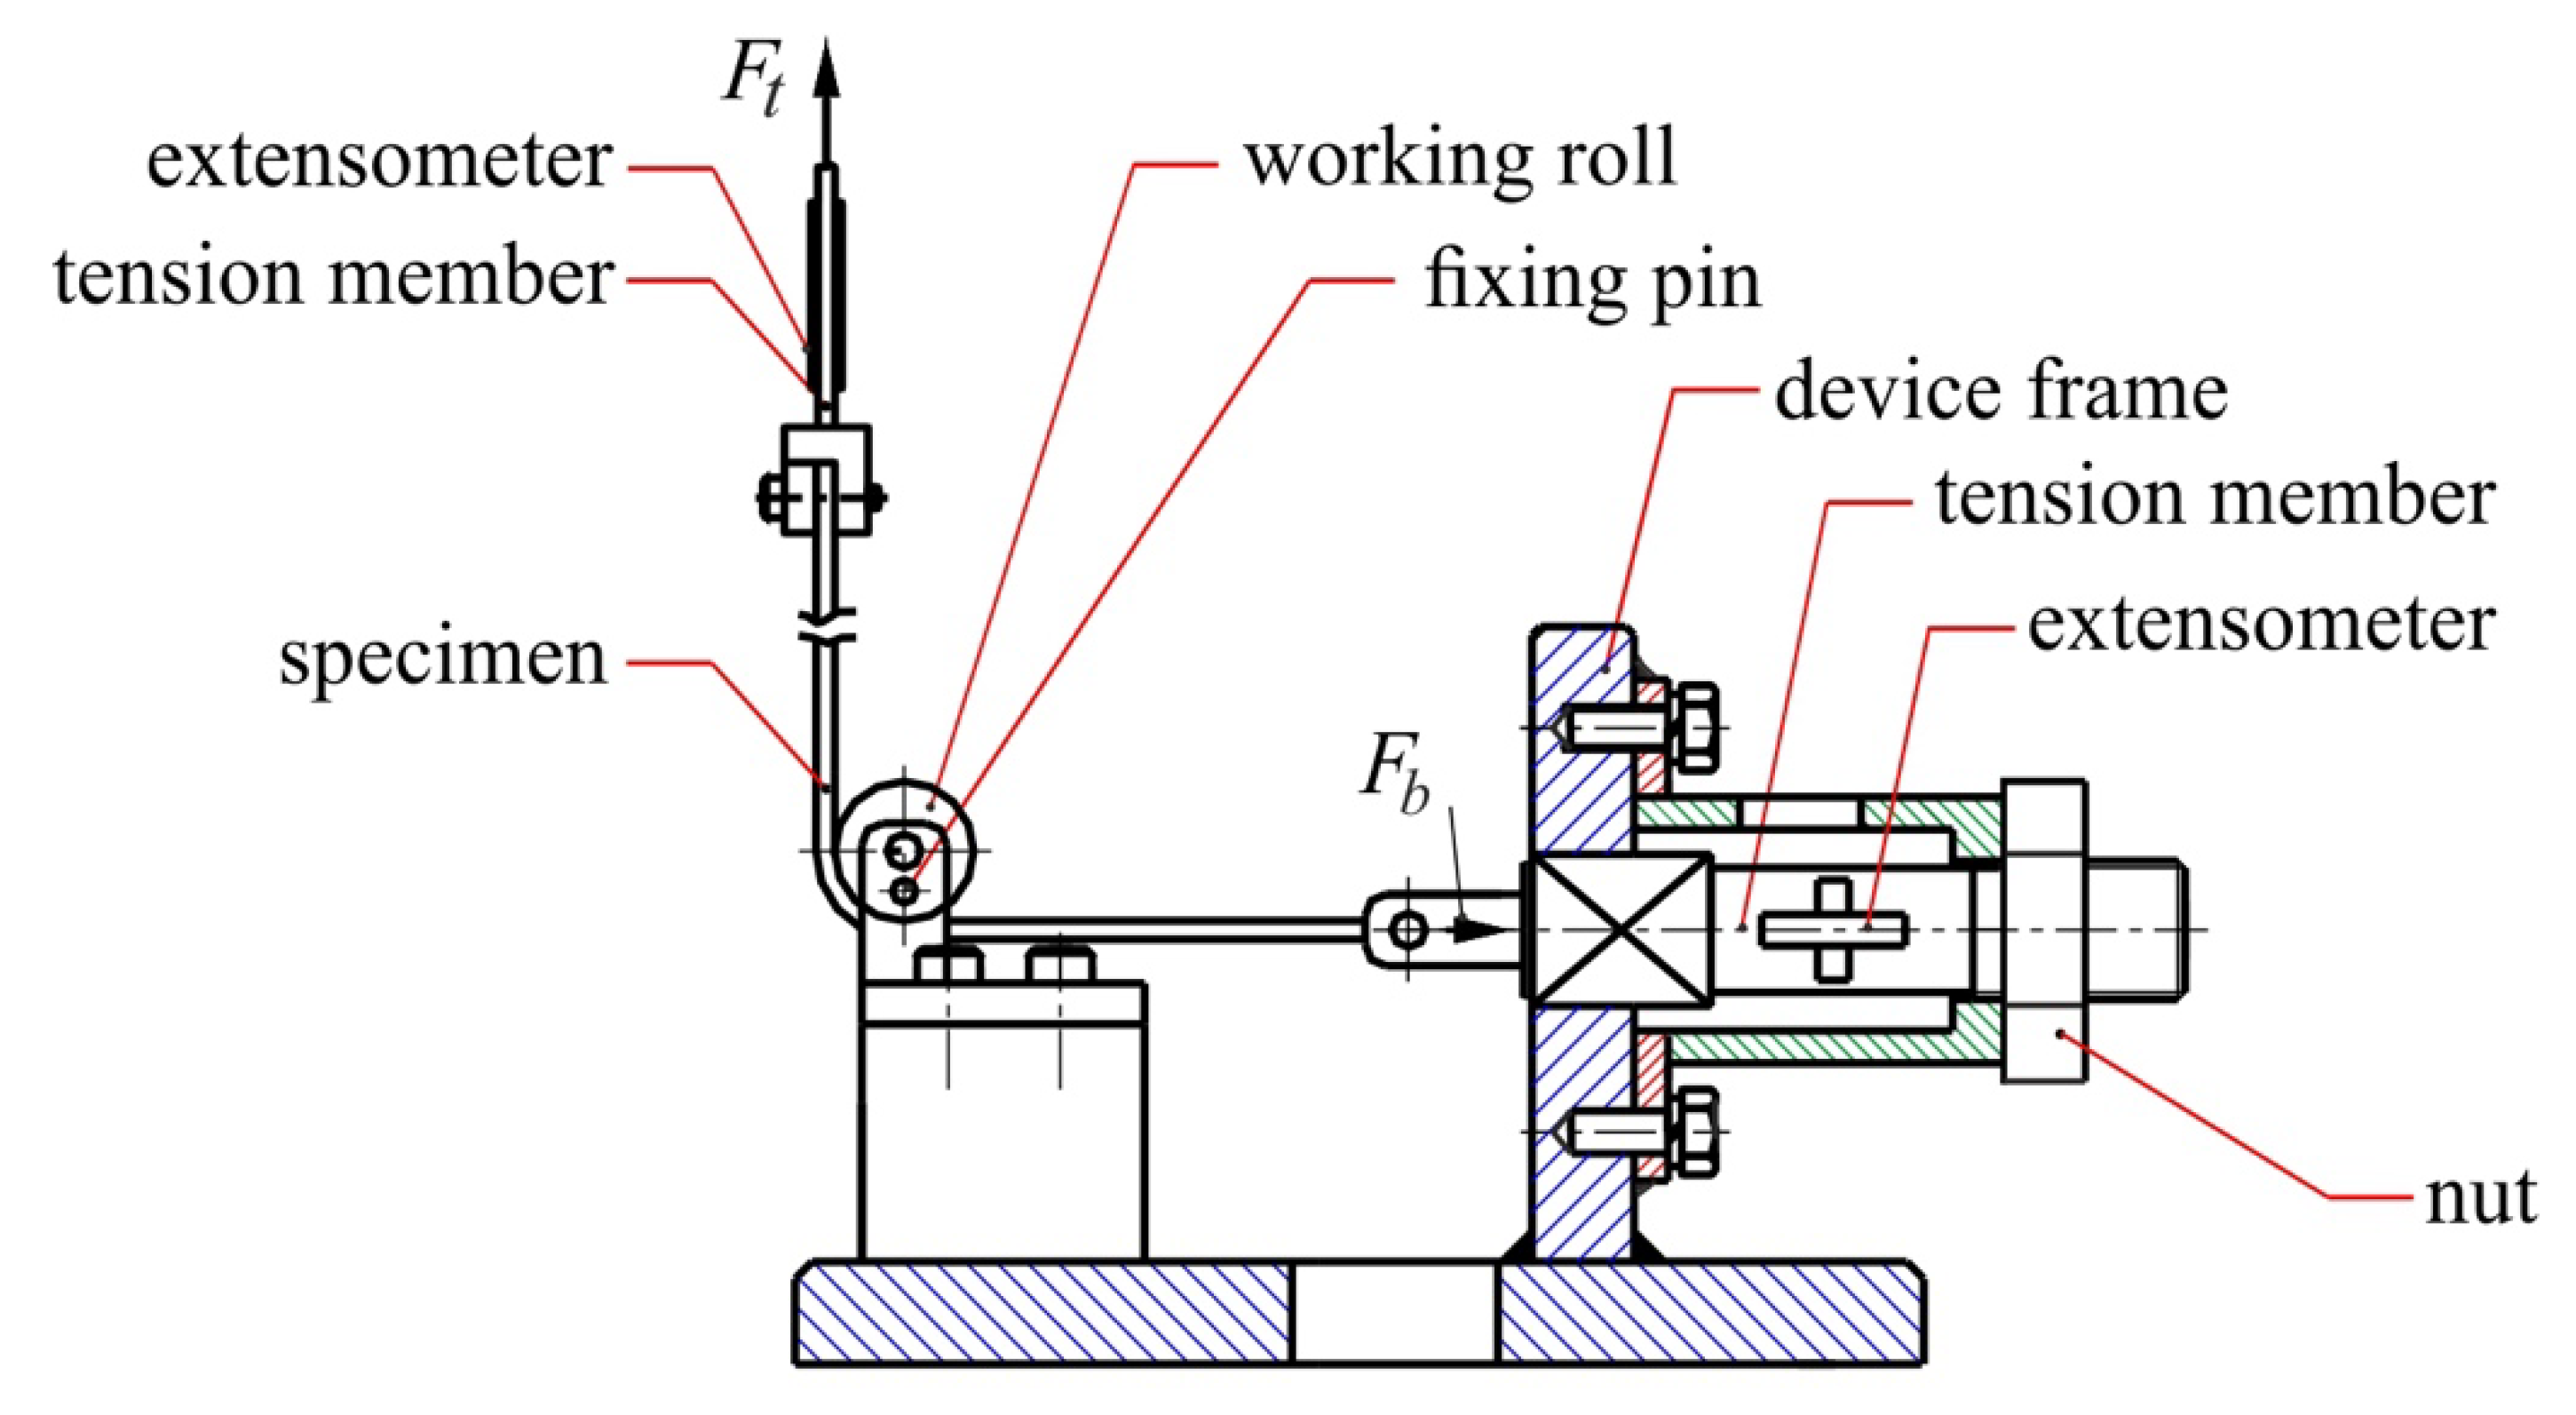
2.2. Friction Simulator

Experimental BUT tests have been carried out using a special friction simulator (Figure 1), which is mounted on a universal tensile test machine. The friction simulator consists of a frame in which the horizontal tension member with load cell is mounted. One end of the specimen was mounted at the end of the horizontal tension member, while the second end was mounted in the vertical tension member with load cell. The specimens for friction test were cut along the rolling direction of the sheet metal. They were stretched with speed of 0.25 mm·s−1. The strip specimen with width of w = 10 mm and length of L = 135 mm was wrapped around a cylindrical fixed roll with radius of R = 20 mm.
The device was equipped with three rolls differing in their surface roughness. To characterize the surface roughness of cylindrical countersamples, the roughness average Ra measured parallel with the roll axis was assumed. The rolls made of cold-worked tool steel had the roughness qualities Ra = 0.32, 0.63 and 1.25 μm. Before testing, all the specimens were degreased with acetone. For lubricated conditions three oils, namely machine oil (MO), deep-drawing oil (DDO) and heavy-drawing oil (HDO) with the following specifications were used:
  • Machine oil LAN-46 (Orlen Oil): kinematic viscosity 43.9 mm2·s−1 (at 40 °C), viscosity index 94, flow temperature −10 °C and ignition temperature 232 °C,
  • Deep-drawing oil L (Orlen Oil): kinematic viscosity 330 mm2·s−1 (at 40 °C), freezing point −29 °C, flash point 238 °C and weld point 500 daN,
  • Heavy-Draw 1150 oil (Lamson Oil): density 975 kg·m−3 (at 20 °C); viscosity 1157 mm2·s−1 (at 40 °C) and flash point 277 °C.
In SMF technology, when stamping components with complex shapes, where extremely different friction conditions, contact pressures and slip speeds occur, different types of lubricants should be used. The lubricants were selected in such a way that the first one is used for typical deep-drawing applications, while the second one is used for super deep-drawing applications and Heavy-Draw 1150 oil is heavy duty stamping oil is used in specially difficult forming applications. All lubricants were distributed uniformly on the surface of the samples using a shaft.
During the test, front tension force Ft and back tension force Fb were simultaneously measured. Assuming that the wrap angle α (Figure 2) is constant during the test, the equilibrium equation of the elementary sector of the strip can be shown as:
F + q μ w R d γ ( F + d F ) = 0
q w R d γ F sin d γ 2 ( F + d F ) sin d γ 2 = 0
where μ is the COF, w is the width of the strip and q is unit contact pressure determined according to the equation:
q = F b + F t 2 w R
For a very small it can be assumed that sin d γ 2 d γ 2 , furthermore dF is much smaller that F. Thus, combining Equations (2) and (3) gives
μ d α = d F F
Taking into account in the Equation (4) that α = π 2 the COF is determined to be
μ = 2 π ln ( F t F b )
The occurrence of friction between the roll and specimen causes that Ft > Fb. The friction test is realized until the elongation of the specimen becomes equal to 20%. It should be noted that the tensile force Ft includes the deformation resistance related with the bending of the specimen around the roll. In this way, Equation (6) does not include explicitly the bending force [21].

3. Numerical Modeling

3.1. Description of the FE-Based Model

Finite element (FE) based numerical modeling of the BUT test was carried out using the MSC.Marc program (MSC.Software, Newport Beach, CA, USA). The geometrical model of the countersample and specimen correspond to the experimental conditions. Due to the fact that strength of the roll material is considerably higher than the strength of specimen material, it was assumed that no deformation exists in the roll. So, the roller surface was modeled as perfectly rigid. The end of the specimen at the back tension side was fixed (Figure 3). The numerical modeling of the BUT test consisted of two steps: (1) bending the sheet around the roll surface (Figure 3a), and (2) applying the tensile force to the upper end of the specimen (Figure 3b). The drawing speed corresponds to the experimental conditions.

3.2. FE Mesh

The geometric model of the specimen has been discretized by using 8-node isoparametric hex-8 brick elements [30] with the assumed strain formulation, which improve the bending characteristic of the finite elements. According to the program documentation [31], this can significantly improve the solution accuracy though the computational costs of assembling the stiffness matrix may increase. The hex-8 element has been successfully used by Trzepiecinski and Fejkiel [27] to study the material flow of a sheet specimen through a drawbead.

3.3. Material Model

An elastic–plastic material model approach was considered to build the material model. The plastic behavior of the sheet metal was established using Hill (1948) [32] yield criterion, which can be applied for a material description of steel sheet metals [33,34,35]. Work hardening with power-type law hardening law has also been incorporated in the finite element method (FEM) based on the average values of material parameters K and n determined for three directions, according to the Table 2. The Hill (1948) formulation can be expressed in terms of rectangular Cartesian stress components as:
σ ¯ = ( F ( σ 22 σ 33 ) 2 + G ( σ 33 σ 11 ) 2 + H ( σ 11 σ 22 ) 2 + 2 L σ 23 2 + 2 M σ 31 2 + 2 N σ 12 2
where σ ¯ is the equivalent stress, and indices 1, 2 and 3 represent the rolling, transverse and normal directions to the sheet surface, respectively.
Parameters (constants) F, G, H, L, M and N define anisotropy state of material and are equal to:
F = 1 2 ( 1 R 22 2 + 1 R 33 2 1 R 11 2 ) ,   G = 1 2 ( 1 R 11 2 + 1 R 33 2 1 R 22 2 ) ,   H = 1 2 ( 1 R 11 2 + 1 R 22 2 1 R 33 2 ) , L = 3 2 R 23 2 ,   M = 3 2 R 13 2 ,   N = 3 2 R 12 2 ,
Parameters R11, R22, R33, R12, R13 and R23 are defined in form of user input consisting of ratios of yield stress in different directions with respect to a reference stress according to Equation (8).
R 11 = σ 11 σ 0 ,   R 22 = σ 22 σ 0 ,   R 33 = σ 33 σ 0 ,   R 12 = σ 12 τ 0 ,   R 13 = σ 13 τ 0 ,   R 23 = σ 23 τ 0 ,
The automatic algorithm for the evaluation of parameters R11–R23 has been built in MSC.Marc program.
The elastic material behavior of sheet is specified using the following properties: Young’s modulus E = 2.1 GPa and Poisson’s ratio ν = 0.3.

3.4. Contact Conditions

To describe contact conditions the classical Coulomb friction law was assumed in Equation (10):
f t = f n · μ · T · 2 π a r c t a n v r δ
where ft-tangential (friction) force, fn-normal force, v r —relative sliding velocity, δ-value of the relative velocity below which sticking occurs and T-tangential vector in the direction of the relative velocity.
The value of δ determines how closely the mathematical friction model represents the step function given as:
f t = f n · μ · s i g n   v r
A small value of relative velocity δ results in a reduced value of the effective friction. A very small value may result in poor convergence of contact algorithm. It is recommended [27] that the value of relative velocity should be 1–10% of a typical relative sliding velocity v r . In this paper, the value of δ = 5% was used.

3.5. Mesh Sensitivity Analysis

Mesh sensitivity analysis (MSA) is a crucial part of each FE-based analysis. The finite element size should be balanced between assurance accurate results and the computational cost. MSA was carried out for three different element sizes: 1 mm × 1 mm × 1 mm, 0.5 mm × 0.5 mm × 0.5 mm and 0.25 mm × 0.25 mm × 0.25 mm. A more dense mesh was created by dividing elements into two equal parts in all directions (Figure 4). The value of the front tensile force at a sheet elongation of 5%, 10% and 15% was adopted as the parameter constituting the basis for the selection of mesh size. Only for the MSA, constant value of COF (μ = 0.3) was assumed. The parameters of the numerical models and the results of MSA are shown in Table 4.
The reduction of the element edge size from 1 to 0.5 mm resulted in a change in the front tensile force value of 0.1–0.44%. At the same time, the computation time increased almost ten times. Further reduction of the element size from 0.5 to 0.25 mm caused the value of the front tensile force to change by less than 0.1%. Due to considerably extended computation time and at the same time a slight change in the value of the front tensile force model N3 might be rejected. Therefore, the N2 model with mesh 0.5 mm × 0.5 mm × 0.5 mm is a reasonable solution.

4. Results and Discussion

4.1. Experimental

4.1.1. Effect of Surface Roughness of Tools

As a result of experimental investigations, the relations between tensile forces and percentage elongation of specimen were obtained. Figure 5 presents an example of such relation registered for the specimen tested using a roll with roughness of Ra = 0.32 μm at HDO lubrication. Increasing the tensile forces can be simply attributed to the strain hardening phenomenon. Although the value of both tensile forces increased, the value of the friction coefficient was very stable during the test.
The initial unstable range of changes in the coefficient of friction is related to the tension of the sample around roll surface with minimization of possible clearances. The increase of the friction coefficient at the beginning of the tribology test is usually attributed to the accommodation of contacting surfaces before reaching a stable stage meaning of linear friction conditions. In this respect, the coefficient of friction determined for the initial stage of the test by Equation (6) as the ratio of two process forces may not make any physical sense. The results were in agreement with the commonly known Amontons–Coulomb law that the COF does not depend on the value of the normal pressure and contact area. The unstable region of the changes of both front Ft and back Fb tension forces was not considered in the determination of COF. The average values of COFs presented in this section (Section 4.1.1) and Section 4.1.2 were determined in the stable range of COFs changes. Although both the front and back tensile forces increased during the test, which results in increasing of normal pressure on the surface of contact of workpiece with rounded countersample, the COF variation kept at a constant trend (Figure 5). This conclusion may be attributed to all conducted tests.
Another phenomenon that should be mentioned is the continuous change in surface topography of the sheet metal due to specimen elongation. This causes the real contact area to increase simultaneously with the normal pressure. The real contact area depends on, for instance, susceptibility to strain hardening of roughness asperities, roughness parameters of the tools and the sheet metal and the geometry of the contact surface [21].
Plots of variations of the COF as a function of friction conditions are shown in Figure 6. In the case of tests carried out with the use of rollers with a roughness Ra = 1.25 μm, the relatively highest values of the COF were observed for all lubrication conditions. At the same time, the lubricating oils used minimized the value of the COF.
For dry friction conditions, the largest value of the COFs were recorded for rolls with a roughness Ra = 0.63 μm (Figure 6b). An increase or decrease in the value of roll roughness resulted in a decreased value of the COF. This is due to the balance of two mechanisms depending on the roughness of the tool: (1) adhesion of the workpiece surface to tool material, in the conditions of small roughness and (2) asperities flattening of the workpiece surface by high roughness of the tool. In the case of high surface roughness, the load pressure acts on the asperities, which results in a higher degree of surface flattening and increased frictional resistance [1]. The share between these phenomena in the total frictional resistance is particularly important in the conditions of sheet lubrication in SMF [2]. The lowest values of the coefficient of friction were recorded during tests using a roll with a roughness Ra = 0.32 μm (Figure 6a). Under these conditions, frictional resistances resulting from interactions between the peaks of cooperating asperities were the smallest. At the same time, the volume of “oil pockets” [2] between contacting surface asperities was large enough to provide an adequate reservoir of lubricant at the contact area.

4.1.2. Effectiveness of Lubrication

The lubricant used in the SMF should effectively separate friction surfaces, protect the tool against excessive wear, have high resistance to normal loads and exhibit easy flow in a tangential direction. The chemical composition of lubricants and viscosity are determined by manufacturers in such a way that they have the ability to transfer pressure and at the same time that the lubricant film is not easily broken. The lubricant viscosity plays a key role in mixed lubrication regime when applied load is partly carried out by fluid film and interacting asperities [36,37]. The mixed lubrication regime is the intermediate zone between the boundary lubrication regime and the elasto-hydrodynamic lubrication regime, where the applied load is partly carried by the interacting asperities and the remaining part by the fluid film. In these conditions, the suitable lubricant viscosity plays a key role [36].
One way to check how effectively the lubricant reduces the friction in specific load conditions is to determine the value of the factor of effectiveness of lubrication δ as a ratio of the coefficient of friction determined in dry conditions μd to the coefficient of friction determined in lubricated conditions μl, according to the following equation:
δ = μ d μ l μ l × 100 %
The highest lubrication efficiency was recorded for HDO (Figure 7). The used lubricants were able to reduce the value of the friction coefficient approximately by 3–52% in relation to the surface roughness of rolls. In the case of the HDO lubricant, the greater the roughness of the roll, the lower the degree of reduction of the friction resistance by the lubricant. The reduction in lubrication efficiency as the roughness increases is most evident in HDO. MO and DDO lubricants showed a local increase in efficiency in reducing frictional resistance for intermediate roll roughness Ra = 0.63 μm. Under these conditions, the amount of space between the asperities was sufficient to accumulate the appropriate volume of lubricant. For the largest tool roughness analyzed Ra = 1.25 μm, the share of the mechanism of ploughing of the workpiece surface by countersample surface was large enough that the grease did not have the proper conditions to reduce COF. An increase of the prestrain value causes an increase of the sheet surface roughness, and as a consequence, the frictional resistance increases due to intensification of the roughness flattening mechanism. In the case of high surface roughness of tool (Ra = 1.25 μm), the load pressure acts dominantly on the asperities, which results in a higher degree of surface flattening of sheet metal and increased frictional resistance. The hardness of the tool material made of cold-work tool steel was considerably higher than the hardness of sheet material. For proper operation, the lubricant requires sufficient pressure to work in conditions of the specific cushion separating the surface being in contact. When the surface roughness of the tool is high, the pressure is carried out by roughness asperities of the tool surface. In these conditions, even if the voids between surface asperities are high, the interaction of high asperities do guarantee the sufficient squeezing of the lubricant in the sheet–tool interface. High tool roughness facilitates the escape of the entrapped lubricant in the pockets. In this way, the lubricant may leak from the contact area. To identify the optimal surface roughness for the best lubrication effectiveness, three aspects need to be considered: surface roughness of tool (the surface of the sheet metal is determined in manufacturing process), lubricant type and contact pressure. The total frictional resistance should take into account appropriate balance between ploughing mechanism (when the surface roughness is too high) and a lack of sufficient lubricant pressure when the lubricant pockets are too small, and mechanical contact of asperities dominate. Due to many parameters and phenomena that influence the frictional resistance there is no universal efficient method to determine a priori appropriate conditions of the forming process. Still, the experimental testing, although time- and cost-consuming, is the best way to select optimal friction conditions that guarantee the best performance of lubricant.
The effectiveness of lubrication may be aided by the mechanism of strain hardening. The DC04 steel sheets are characterized by high susceptibility to work hardening. In the case of cold forming, this phenomenon consists of two main mechanisms, i.e., dislocation glide and twinning. These mechanisms strongly depend on the density of dislocations in the material. During elongation, the surface topography of the sheet metal leads to strong evolution (Figure 8). Scanning electron microscopy (SEM) micrographs revealed directional frontal deformation. These fronts may be in macroscale assignment to the motion of the dislocations.
The rough topography assists the better adhesion of the lubricant to the workpiece surface. This influence is as expected, since the low viscous MO does not assure high effectiveness of lubrication, whereas the higher viscous DDO and the high viscous HDO may support microhydrodynamic lubrication in sheet metal processes as found by Sulaiman et al. [38]. They also concluded that low-viscous mineral oil does not promote micro-plasto-hydrodynamic lubrication in sheet metal forming. This can be revealed from Figure 7, where the performance of this oil in a reduction of COF did not exceed 12%. The highest effectiveness of lubrication was found for HDO at Ra = 0.32 μm. High viscosity lubricant reduces the occurring friction significantly. Oil with high viscosity is characterized by high sticking with contacting surfaces, so the oil film is difficult to break. It is noticed here that the tool roughness of Ra = 1.25 μm has reduced the effectiveness of lubrication as compared to the smoother tool surface (Ra = 0.32 μm and 0.63 μm), when testing with all viscosity oils. This leads to effective separation between a tool and a workpiece on the plateaus of the tool asperities. If a pocket of fluid layers is sheared, the individual fluid layers are displaced in the direction of the shearing force. Molecular forces create resistance to shearing and this resistance is given by the viscosity and the difference in velocity between two given fluid layers, related to the shear rate. The mixed lubrication regime, commonly existing in sheet metal forming to a large extent, based on the kinematic viscosity of lubricant to form a chemical or physical bond with the tool surfaces and steel sheet. When viscosity of lubricant is not able to fulfill the requirements for hydrodynamic lubrication, it will immediately lead to asperity peaks breaking through the lubricant film, provoking metallic contact [39]. A very fine polished tool surface lowers the COF as the lubricant is better retained. Higher viscosity of the lubricant reduces the COF, presumably due to the fact that lubricant escape is diminished.

4.2. Results of Numerical Modeling

4.2.1. Distribution of Specimen Elongation

Numerical simulations of the BUT test allow one to better understand the way the sheet deforms and the phenomena that occur on the interface between the strip specimen and the counter-sample. Obtaining such results on an experimental basis would be very difficult. Numerical analyses were carried out on the numerical model corresponding to the friction of samples against the surface of rolls with a roughness Ra = 0.32 μm (Figure 6a); for these conditions the largest difference in COF values for dry friction and most effective HDO lubrication were observed. In the numerical simulations, the values of the COF determined in experimental studies were taken into account according to the schematic relationship in Figure 5. As this figure shows, the value of COF initial continued to increase with the elongation of the sample and it reached its stable range at a deformation of 3.5%. In the elongation range between 3.5% and 15%, a constant value of COF was obtained and this result was assumed in Figure 6a for the case of HDO.
Figure 9 shows the distribution of mean normal stresses on the contact surface for all the analyzed friction conditions and the various deformations of the specimen. In the case of the smallest analyzed sample deformation of 5%, the distribution and value of normal stress was generally similar for all friction conditions. For the HDO lubrication conditions, which was the most effective lubricant, the higher the deformation value, the more uniform the stress distribution in the contact zone (Figure 9d). Observation of the distribution of mean normal stresses for the largest sample deformation (Figure 9c,d) allowed us to draw a conclusion that the lubricant reduced the stress value on the sample surface in the contact area. Lower friction resistance makes the sample more easily move over the surface of the tool. The most loaded section was the vicinity of the place where the specimen was loaded by the front tensile force leaves contact with the roll. This is due to the accumulation of stresses in the material as a result of the braking frictional effect of the roll surface on the inner side (see Figure 3b) of the sample. The non-homogeneous distribution of stress across the sample width is associated with (i) anisotropy of the mechanical properties of the sheet and (ii) the occurring friction limiting the flow of the sample material over the width of the countersample.

4.2.2. Flexuring of the Specimen

Existence of friction on one inner side of the sheet causes local flexure of the specimen. This phenomenon was observed at the front and back side of the specimen (Figure 10). Of course, the flexuring on the exit side was greater and resulted from different lengths of the free part of the samples (Figure 3b). The flexuring of the strip specimen affected the length of the contact area along the sheet-roll contact surface. The bending deformation of the sample was greater for greater values of the coefficient of friction. It also indicated that the non-uniform distribution of contact normal force along the specimen width and along the contact area (Figure 10) was a result of flexuring of the specimen in a plane perpendicular to the strip direction.

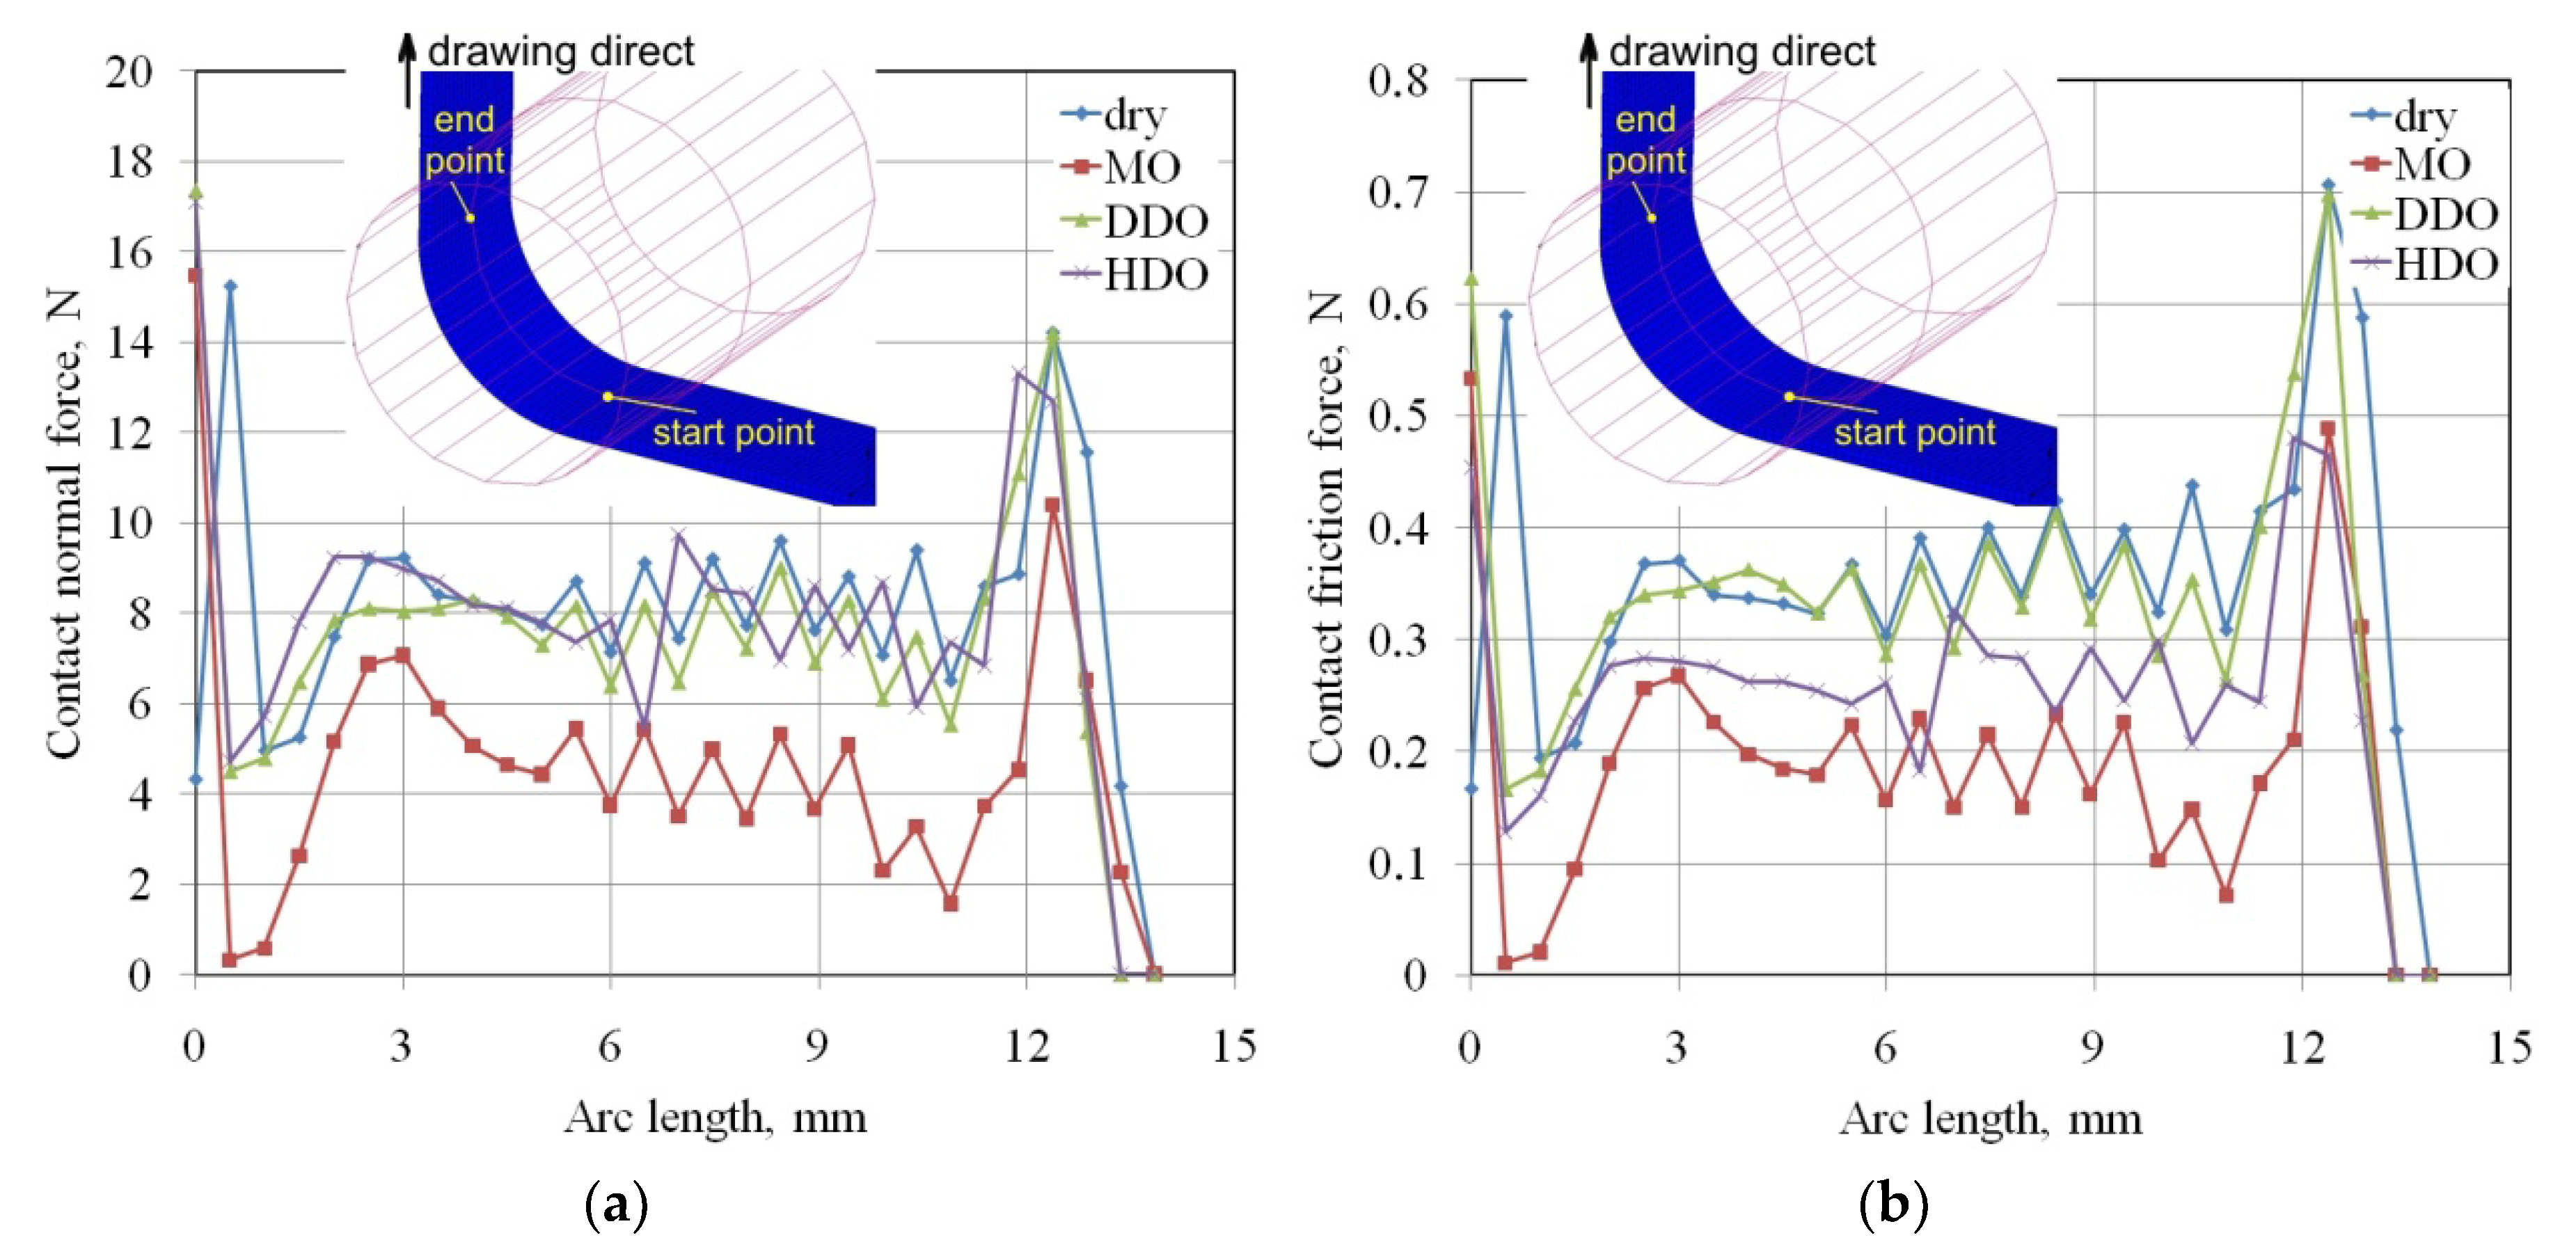
4.2.3. Normal and Friction Forces

The distribution of the contact normal force and contact friction force is non-uniform along the contact area, as it is shown in Figure 11a,b, respectively. Local peaks of forces were observed at the start and the end of contact. This can be associated with the local flexuring of the strip sheet over the countersample surface (Figure 10). In this case, the flexure of the strip sheet locally unloads the material in contact (regions A in Figure 10 and Figure 11). The distribution of normal and friction forces in dry as well as DDO and HDO lubricated conditions was approximately uniform in the range of 3–10 mm of contact length.
Triangular oscillations of the contact normal force value on the side, when the sample leaves contact with a countersample, might be the result of loss of sheet stability due to flexure of the sheet metal shown in Figure 10 (Left). In addition, the strip sheet in the vicinity of the contact with the countersample tended to bend across the width, which is shown in Figure 10 (Right), where the contact normal forces were not uniformly distributed across the specimen width. Due to the direction of specimen movement, the zone located at the bottom of the sample, immediately after coming into contact with the countersample, was most heavily loaded along the entire width of the sample. In this area, the distribution of values of contact normal forces between neighboring nodes was very stable, without oscillations.
The distribution of the mentioned parameters in this range shows that the values of contact and friction forces for MO lubrication were about 2 times lower than for DDO and HDO lubrication conditions. The lowest values of friction force along the path lying in the middle of contact area for MO lubricant did not indicate that this lubricant effectively reduced frictional resistances. Figure 11 allowed us to compare the forces generated by the different friction conditions at a specific cross-section. However, the decisive factor in the flowing resistance of the specimen along the roll surface is the distribution of the friction force values along the specimen width.

5. Conclusions

This study was devoted to the experimental investigation of the frictional phenomena at rounded edges of the die and punch in sheet metal forming operations. Numerical modeling allowed us to study the material flow over the rounded countersample. The change in different process parameters was considered in the investigations. The following conclusions were drawn from the research:
  • The normal pressure in the BUT test continuously increased with increasing specimen elongation, and this was due to the strain hardening phenomenon. However, the COF was very stable during the tests realized in all friction conditions. This conclusion is in contrast to the recent investigations of authors [2,3] on the friction determination in a strip drawing test when the nonlinear relation between friction and normal force was found.
  • The effectiveness of the lubrication depended on the balance between two mechanisms accompanied with friction: (1) adhesion of the surfaces in contact and (2) roughening of workpiece asperities by the tool surface. High surface roughness of tool released the dominant share of ploughing in total frictional resistance. In these conditions, all of the lubricants used were not able to decrease the COF in to sufficient extent.
  • Lubricants destined for application in SMF operations were able to reduce a value of friction coefficient approximately by 3–52% in relation to the surface roughness of rolls.
  • Friction in the sheet–tool interface caused flexuring of the strip during flowing the sheet through the BUT test. This effect results in the non-uniformity of the contact normal force and depended on the value of COF.
  • The lubricated conditions, by making the sample to move over the tool surface more easily, reduced the mean normal stress value on the sample surface in the contact area. Moreover, in the case of the most effective lubricant, i.e., HDO, the higher the deformation value, the more uniform the stress distribution in the contact zone was observed.
  • The distribution of contact friction force and contact normal forces was non-uniform along the width and length of the strip material being in contact with the roll surface. This could be associated with the local flexuring of the strip sheet over the countersample surface.

Author Contributions

Conceptualization and methodology, T.T.; investigation, H.G.L., T.T.; data curation, H.G.L., T.T.; software, T.T.; writing—original draft, T.T.; H.G.L. contributed in funding acquisition, project administration, validation, and writing—review and editing. All authors have read and agreed on the final version of the manuscript.

Funding

This research received no external funding.

Conflicts of Interest

The authors declare no conflict of interest.

References

  1. Fratini, L.; Casto, S.L.; Valvo, E.L. A technical note on an experimental device to measure friction coefficient in sheet metal forming. J. Mater. Process. Technol. 2006, 172, 16–21. [Google Scholar] [CrossRef]
  2. Trzepiecinski, T.; Fejkiel, R. On the influence of deformation of deep drawing quality steel sheet on surface topography and friction. Tribol. Int. 2017, 115, 78–88. [Google Scholar] [CrossRef]
  3. Trzepiecinski, T.; Bochnowski, W.; Witek, L. Variation of surface roughness, micro-hardness and friction behaviour during sheet-metal forming. Int. J. Surface Sci. Eng. 2018, 12, 119–136. [Google Scholar] [CrossRef]
  4. Trzepiecinski, T. A study of the coefficient of friction in steel sheets forming. Metals 2019, 9, 988. [Google Scholar] [CrossRef] [Green Version]
  5. Van Der Heide, E.; Schipper, D.J. Friction and Wear in Lubricated Sheet Metal Forming Processes. In Handbook of Lubrication and Tribology; Taylor & Francis: Abingdon, UK, 2006; Volume 1, p. 28. [Google Scholar]
  6. Weidel, S.; Engel, U. Surface characterisation in forming processes by functional 3D parameters. Int. J. Adv. Manuf. Technol. 2006, 33, 130–136. [Google Scholar] [CrossRef]
  7. Dou, S.; Xia, J. Analysis of sheet metal forming (stamping process): A study of the variable friction coefficient on 5052 aluminum alloy. Metals 2019, 9, 853. [Google Scholar] [CrossRef] [Green Version]
  8. Kirkhorn, L.; Bushlya, V.; Andersson, M.; Stahl, J.-E. The influence of tool steel microstructure on friction in sheet metal forming. Wear 2013, 302, 1268–1278. [Google Scholar] [CrossRef]
  9. Trzepiecinski, T.; Lemu, H.G. Recent developments and trends in the friction testing for conventional sheet metal forming and incremental sheet forming. Metals 2019, 10, 47. [Google Scholar] [CrossRef] [Green Version]
  10. Oliveira, M.C.; Fernandes, J.V. Modelling and simulation of sheet metal forming processes. Metals 2019, 9, 1356. [Google Scholar] [CrossRef] [Green Version]
  11. Trzepiecinski, T.; Lemu, H.G.; Fejkiel, R. Numerical simulation of effect of friction directionality on forming of anisotropic sheets. Int. J. Simul. Model. 2016, 16, 590–602. [Google Scholar] [CrossRef]
  12. Trzepiecinski, T. 3D elasto-plastic FEM analysis of the sheet drawing of anisotropic steel sheet. Arch. Civ. Mech. Eng. 2010, 10, 95–106. [Google Scholar] [CrossRef]
  13. Sulaiman, M.H.; Farahana, R.; Bienk, K.; Nielsen, C.; Bay, N. Effects of DLC/TiAlN-coated die on friction and wear in sheet-metal forming under dry and oil-lubricated conditions: Experimental and numerical studies. Wear 2019, 203040. [Google Scholar] [CrossRef]
  14. Gonzalez-Pociño, A.; Alvarez-Antolin, F.; Asensio-Lozano, J. Improvement of adhesive wear behavior by variable heat treatment of a tool steel for sheet metal forming. Materials 2019, 12, 2831. [Google Scholar] [CrossRef] [Green Version]
  15. Recklin, V.; Dietrich, F.; Groche, P. Influence of Test stand and contact size sensitivity on the friction coefficient in sheet metal forming. Lubricants 2018, 6, 41. [Google Scholar] [CrossRef] [Green Version]
  16. Hol, J.; Meinders, V.T.; Geijselaers, H.; Boogaard, A.H.V.D. Multi-scale friction modeling for sheet metal forming: The mixed lubrication regime. Tribol. Int. 2015, 85, 10–25. [Google Scholar] [CrossRef]
  17. Löfgren, H.B. A first order friction model for lubricated sheet metal forming. Theor. Appl. Mech. Lett. 2018, 8, 57–61. [Google Scholar] [CrossRef]
  18. Littlewood, M.; Wallace, J.F. The effect of surface finish and lubrication on the fictional variation involved in the sheet-metal-forming process. Sheet Met. Ind. 1964, 41, 925–1930. [Google Scholar]
  19. Nanayakkara, N.K.B.M.P.; Kelly, G.L.; Hodgson, P.D. Application of bending under tension test to determine the effect of toolradius and the contact pressure on the coefficient of fiction in sheet metal forming. Mater. Forum 2005, 29, 114–118. [Google Scholar]
  20. Coubrough, G.; Alinger, M.; Van Tyne, C.; Van Tyne, C. Angle of contact between sheet and die during stretch–bend deformation as determined on the bending-under-tension friction test system. J. Mater. Process. Technol. 2002, 130, 69–75. [Google Scholar] [CrossRef]
  21. Lemu, H.G.; Trzepieciński, T. Numerical and experimental study of the frictional behaviour in bending under tension test. J. Mech. Eng. 2013, 59, 41–49. [Google Scholar] [CrossRef]
  22. Hoffmann, H.; Nürnberg, G.; Ersoy-Nürnberg, K.; Herrmann, G. A new approach to determine the wear coefficient for wear prediction of sheet metal forming tools. Prod. Eng. 2007, 1, 357–363. [Google Scholar] [CrossRef]
  23. Berglund, J.; Brown, C.; Rosén, B.G.; Bay, N.O. Milled die steel surface roughness correlation with steel sheet friction. CIRP Ann. 2010, 59, 577–580. [Google Scholar] [CrossRef]
  24. Pereira, M.; Yan, W.; Rolfe, B. Contact pressure evolution and its relation to wear in sheet metal forming. Wear 2008, 265, 1687–1699. [Google Scholar] [CrossRef]
  25. Pereira, M.; Duncan, J.L.; Yan, W.; Rolfe, B.F. Contact pressure evolution at the die radius in sheet metal stamping. J. Mater. Process. Technol. 2009, 209, 3532–3541. [Google Scholar] [CrossRef]
  26. Ceron, E.; Bay, N.O. Determination of friction in sheet metal forming by means of simulative tribo-tests. Key Eng. Mater. 2013, 549, 415–422. [Google Scholar] [CrossRef]
  27. Trzepiecinski, T.; Fejkiel, R. A 3D FEM-Based Numerical Analysis of the Sheet Metal Strip Flowing Through Drawbead Simulator. Metals 2019, 10, 45. [Google Scholar] [CrossRef] [Green Version]
  28. Trzepiecinski, T.; Lemu, H.G. Frictional conditions of AA5251 aluminium alloy sheets using drawbead simulator tests and numerical methods. J. Mech. Eng. 2014, 60, 51–60. [Google Scholar] [CrossRef] [Green Version]
  29. ISO 6892-1. Metallic Materials—Tensile Testing—Part 1: Method of Test at Room Temperature; International Organisation for Standardization: Geneva, Switzerland, 2016. [Google Scholar]
  30. Msc.MARC 2010. Element Library; MSC.Software Corporation: Santa Ana, CA, USA, 2010.
  31. Msc.MARC 2010. Theory Manual; MSC.Software Corporation: Santa Ana, CA, USA, 2010.
  32. Hill, R. A theory of the yielding and plastic flow of anisotropic metals. Proc. R. Soc. London. Ser. A Math. Phys. Sci. 1948, 193, 281–297. [Google Scholar] [CrossRef] [Green Version]
  33. Taherizadeh, A.; Green, D.E.; Yoon, J.W. A non-associated plasticity model with anisotropic and nonlinear kinematic hardening for simulation of sheet metal forming. Int. J. Solids Struct. 2015, 69, 370–382. [Google Scholar] [CrossRef]
  34. Banabic, D.; Comsa, D.S.; Gawad, J. Plastic Behaviour of Sheet Metals. In Multiscale Modelling in Sheet Metal Forming; Springer Science and Business Media LLC: Berlin, Germany, 2016; pp. 1–46. [Google Scholar]
  35. Farahnak, P.; Urbanek, M.; Džugan, J. Investigation study on determination of fracture strain and fracture forming limit curve using different experimental and numerical methods. J. Phys. Conf. Ser. 2017, 896, 12082. [Google Scholar] [CrossRef] [Green Version]
  36. Lovell, M.R.; Khonsari, M.M.; Marangoni, R.D. The response of balls undergoing oscillatory motion: crossing from boundary to mixed lubrication regimes. J. Tribol. 1993, 115, 261–266. [Google Scholar] [CrossRef]
  37. Karupannasamy, D.; Hol, J.; De Rooij, M.; Meinders, T.; Schipper, D. Modelling mixed lubrication for deep drawing processes. Wear 2012, 294, 296–304. [Google Scholar] [CrossRef] [Green Version]
  38. Sulaiman, M.H.; Christiansen, P.; Bay, N.O. The influence of tool texture on friction and lubrication in strip reduction testing. Lubricants 2017, 5, 3. [Google Scholar] [CrossRef] [Green Version]
  39. Bech, J.; Bay, N.O.; Eriksen, M. A study of mechanisms of liquid lubrication in metal forming. CIRP Ann. 1998, 47, 221–226. [Google Scholar] [CrossRef]
Figure 1. Schematic view of the testing device.
Metals 10 00544 g001
Figure 2. Forces acting on an elemental cut of the strip.
Metals 10 00544 g002
Figure 3. Geometrical model of the bending under tension (BUT) test: (a) initial configuration and (b) configuration at the beginning of the friction test.
Metals 10 00544 g003
Figure 4. View of the mesh in the MSA: (a) 1 mm × 1 mm × 1 mm, (b) 0.5 mm × 0.5 mm × 0.5 mm and (c) 0.25 mm × 0.25 mm × 0.25 mm.
Metals 10 00544 g004
Figure 5. The effect of the specimen elongation on the values of front (Ft) and back (Fb) tension forces and coefficient of friction (COF); test conditions: Ra = 0.32 µm, heavy-drawing oil (HDO) lubrication.
Metals 10 00544 g005
Figure 6. The effect of Ra of the roll on the value of COF: (a) Ra = 0.32 µm, (b) Ra = 0.63 µm and (c) Ra = 1.25 µm.
Metals 10 00544 g006
Figure 7. The effect of the oil type on the effectiveness of lubrication δ.
Metals 10 00544 g007
Figure 8. SEM micrographs of the surface topography of the DCO4 steel sheet subjected to the (a) 10% and (b) 15% elongation, magnification 1200×.
Metals 10 00544 g008
Figure 9. Effect of specimen elongation on the value of the mean normal stress (MPa) for the friction conditions: (a) dry, (b), machine oil (MO), (c) deep-drawing oil (DDO) and (d) HDO.
Metals 10 00544 g009
Figure 10. Distribution of contact normal force (in N) at the contact area of sheet metal and countersample surface; testing conditions: dry friction, roughness of countersample Ra = 0.32 μm.
Metals 10 00544 g010
Figure 11. Distribution of the (a) contact normal force and (b) contact friction force on the contact surface of metal strip and countersample surface; analyzed roughness of the countersample Ra = 0.32 μm.
Metals 10 00544 g011
Table 1. Chemical composition of DC04 steel sheet (in wt. %).
CMnPSFe
≤0.08≤0.4≤0.03≤0.03remainder
Table 2. Selected mechanical properties of the DC04 steel sheet.
Specimen
Orientation
Rp0.2 (MPa)Rm (MPa)K (MPa)nr
1723065130.171.49
45°1793195020.191.32
90°1842105240.201.58
Table 3. Surface roughness parameters of the DC04 steel sheet.
Sa (μm)Sq (μm)Sv (μm)Sz (μm)St (μm)Sp (μm)
1.461.725.8912.4211.398.87
Table 4. Parameters of the mesh and mesh sensitivity analysis (MSA) results.
Model No.Element Size, mmNumber of ElementsNumber of NodesTensile Front Force, N
at Specimen Elongation
Computation Time, s
5%10%15%
N11 × 1 × 113803058270929793096220
N20.5 × 0.5 × 0.511,04017,4512697297630892008
N30.25 × 0.25 × 0.2588,320113,36526952976308624,547

