Review

Dislocation Emission and Crack Dislocation Interactions

by
Chandra S. Pande
1 and
Ramasis Goswami
2,*
1
Volunteer Emeritus, Naval Research Laboratory, Washington, DC 20375, USA
2
Materials Science and Technology Division, Naval Research Laboratory, Washington, DC 20375, USA
*
Author to whom correspondence should be addressed.
Metals 2020, 10(4), 473; https://doi.org/10.3390/met10040473
Submission received: 3 January 2020 / Revised: 5 March 2020 / Accepted: 19 March 2020 / Published: 3 April 2020
(This article belongs to the Special Issue Dislocation Mechanics of Metal Plasticity and Fracturing)

Abstract

:
An understanding of the crack initiation and crack growth in metals spanning the entire spectrum of conventional and advanced has long been a major scientific challenge. It is known that dislocations are involved both in the initiation and propagation of cracks in metals and alloys. In this review, we first describe the experimental observations of dislocation emission from cracks under stress. Then the role played by these dislocations in fatigue and fracture is considered at a fundamental level by considering the interactions of crack and dislocations emitted from the crack. We obtain precise expression for the equilibrium positions of dislocations in an array ahead of crack tip. We estimate important parameters, such as plastic zone size, dislocation free zone and dislocation stress intensity factor for the analysis of crack propagation. Finally, we describe very recent novel and significant results, such as residual stresses and relatively large lattice rotations across a number of grains in front of the crack that accompanies fatigue process.

1. Introduction

The prediction of the fatigue properties of structural materials is rightly recognized as one of the most important problems in engineering. Previous works suggest that fatigue is an very complex phenomenon primarily because of the large number of variables spanning the aspects of microstructure, alloy chemistry, processing treatment, intrinsic microstructural effects, and test variables. The frequency of failure mechanisms of aircraft components as a result of corrosion, fatigue, overload, high temperature corrosion, corrosion fatigue and wear/abrasion/erosion is 16%, 55%, 14%, 2%, 7% and 6%, respectively [1]. In fatigue phenomenon, the unsolved fundamental questions are: (i) how cracks are created? (ii) Where do the dislocations originate? (iii) How do the cracks interact with mobile and immobile dislocations ? (iv) How cracks are able to grow at loads far less than that needed for fracture? and (v) What are the effects microstructural features, such as: voids, interfaces, grain boundaries, and second-phase particles? We will be able to predict the fatigue behavior in a variety of materials and structures, once these questions have been addressed.
Basinski and Basinski [2] reported that cracks nucleate at persistent slip bands (PSBs) that are generated immediately prior to fracture initiation. According to Mott [3], vacancies are generated immediately below the surface and eventually coalesce to form fine microscopic cracks. This idea has been extended by Antonopoulos et al. [4]. They proposed a model based on vacancy dipoles, which develop in the PSBs. Essmann et al. [5] employed similar ideas for the nucleation of fine microscopic cracks. However, Neumann [6] developed and put forward a model based on an activation of two operating slip systems. It, therefore, appears that the crack nucleation process has been fairly well understood for a wide spectrum of materials.
In the next section, we describe and discuss the emission of dislocations from the cracks and provide some direct evidence for such emission. In Section 3, we discuss in detail used to predict various features of crack process. This forms the main part of this paper. In Section 4, we some other features of the fatigue usually not considered that is, to determine characteristics of lattice rotation and residual stresses around and in front of the crack, and relate it to fatigue plastic zone and dislocation configurations, in high stacking fault energy materials, particularly in Al alloys. Finally, in Section 5, we provide some discussion and concluding remarks. The objective of this brief review is:
(i)
To establish that dislocation emission from cracks plays a major role in the fatigue process.
(ii)
To point out the methodologies and recent progresses in analytical formulation of the dislocation interactions, and the role they play in fatigue and fatigue processes.
(iii)
To present some very recent results pertaining to the changes in grain morphology, orientations and residual stresses as the materials undergo fatigue.

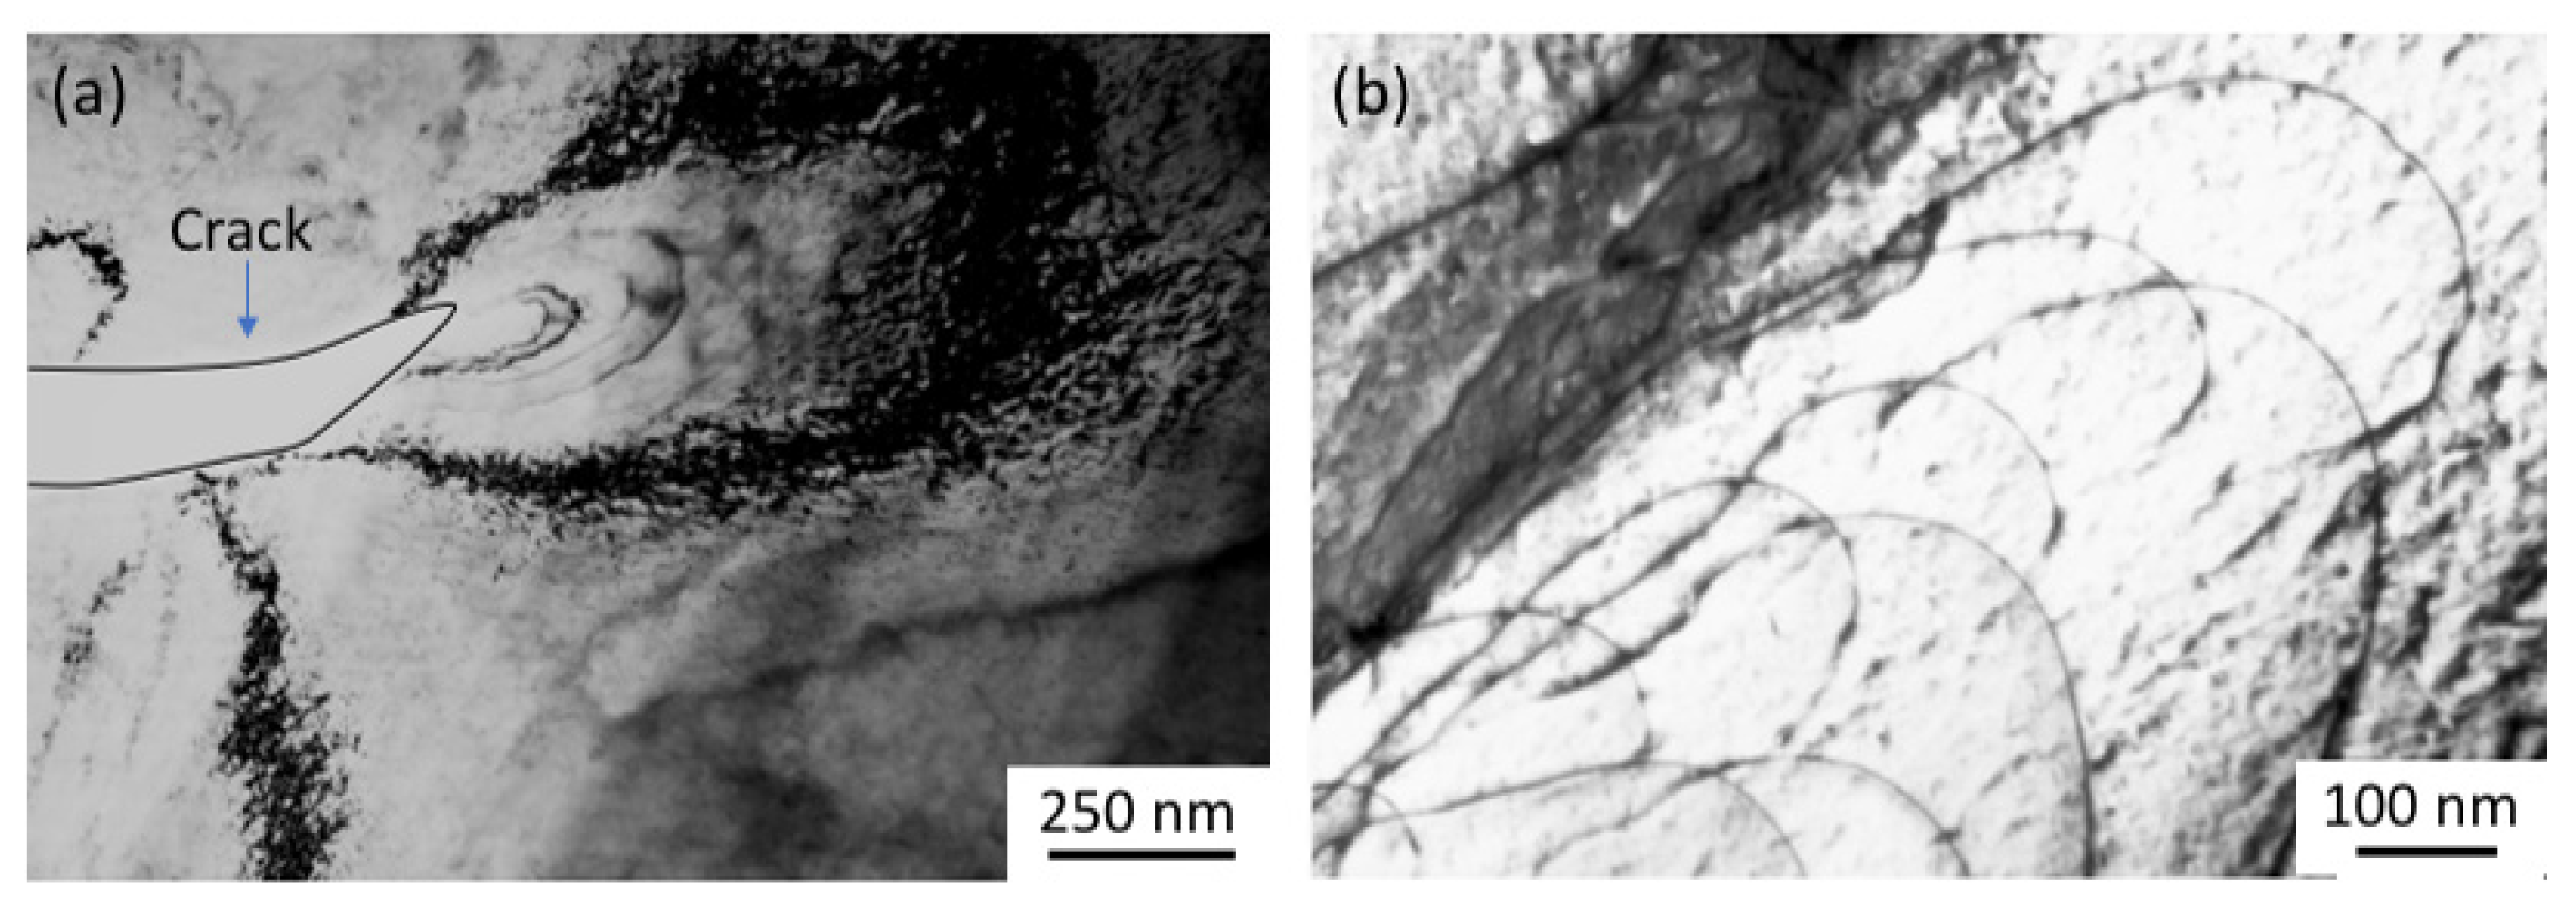
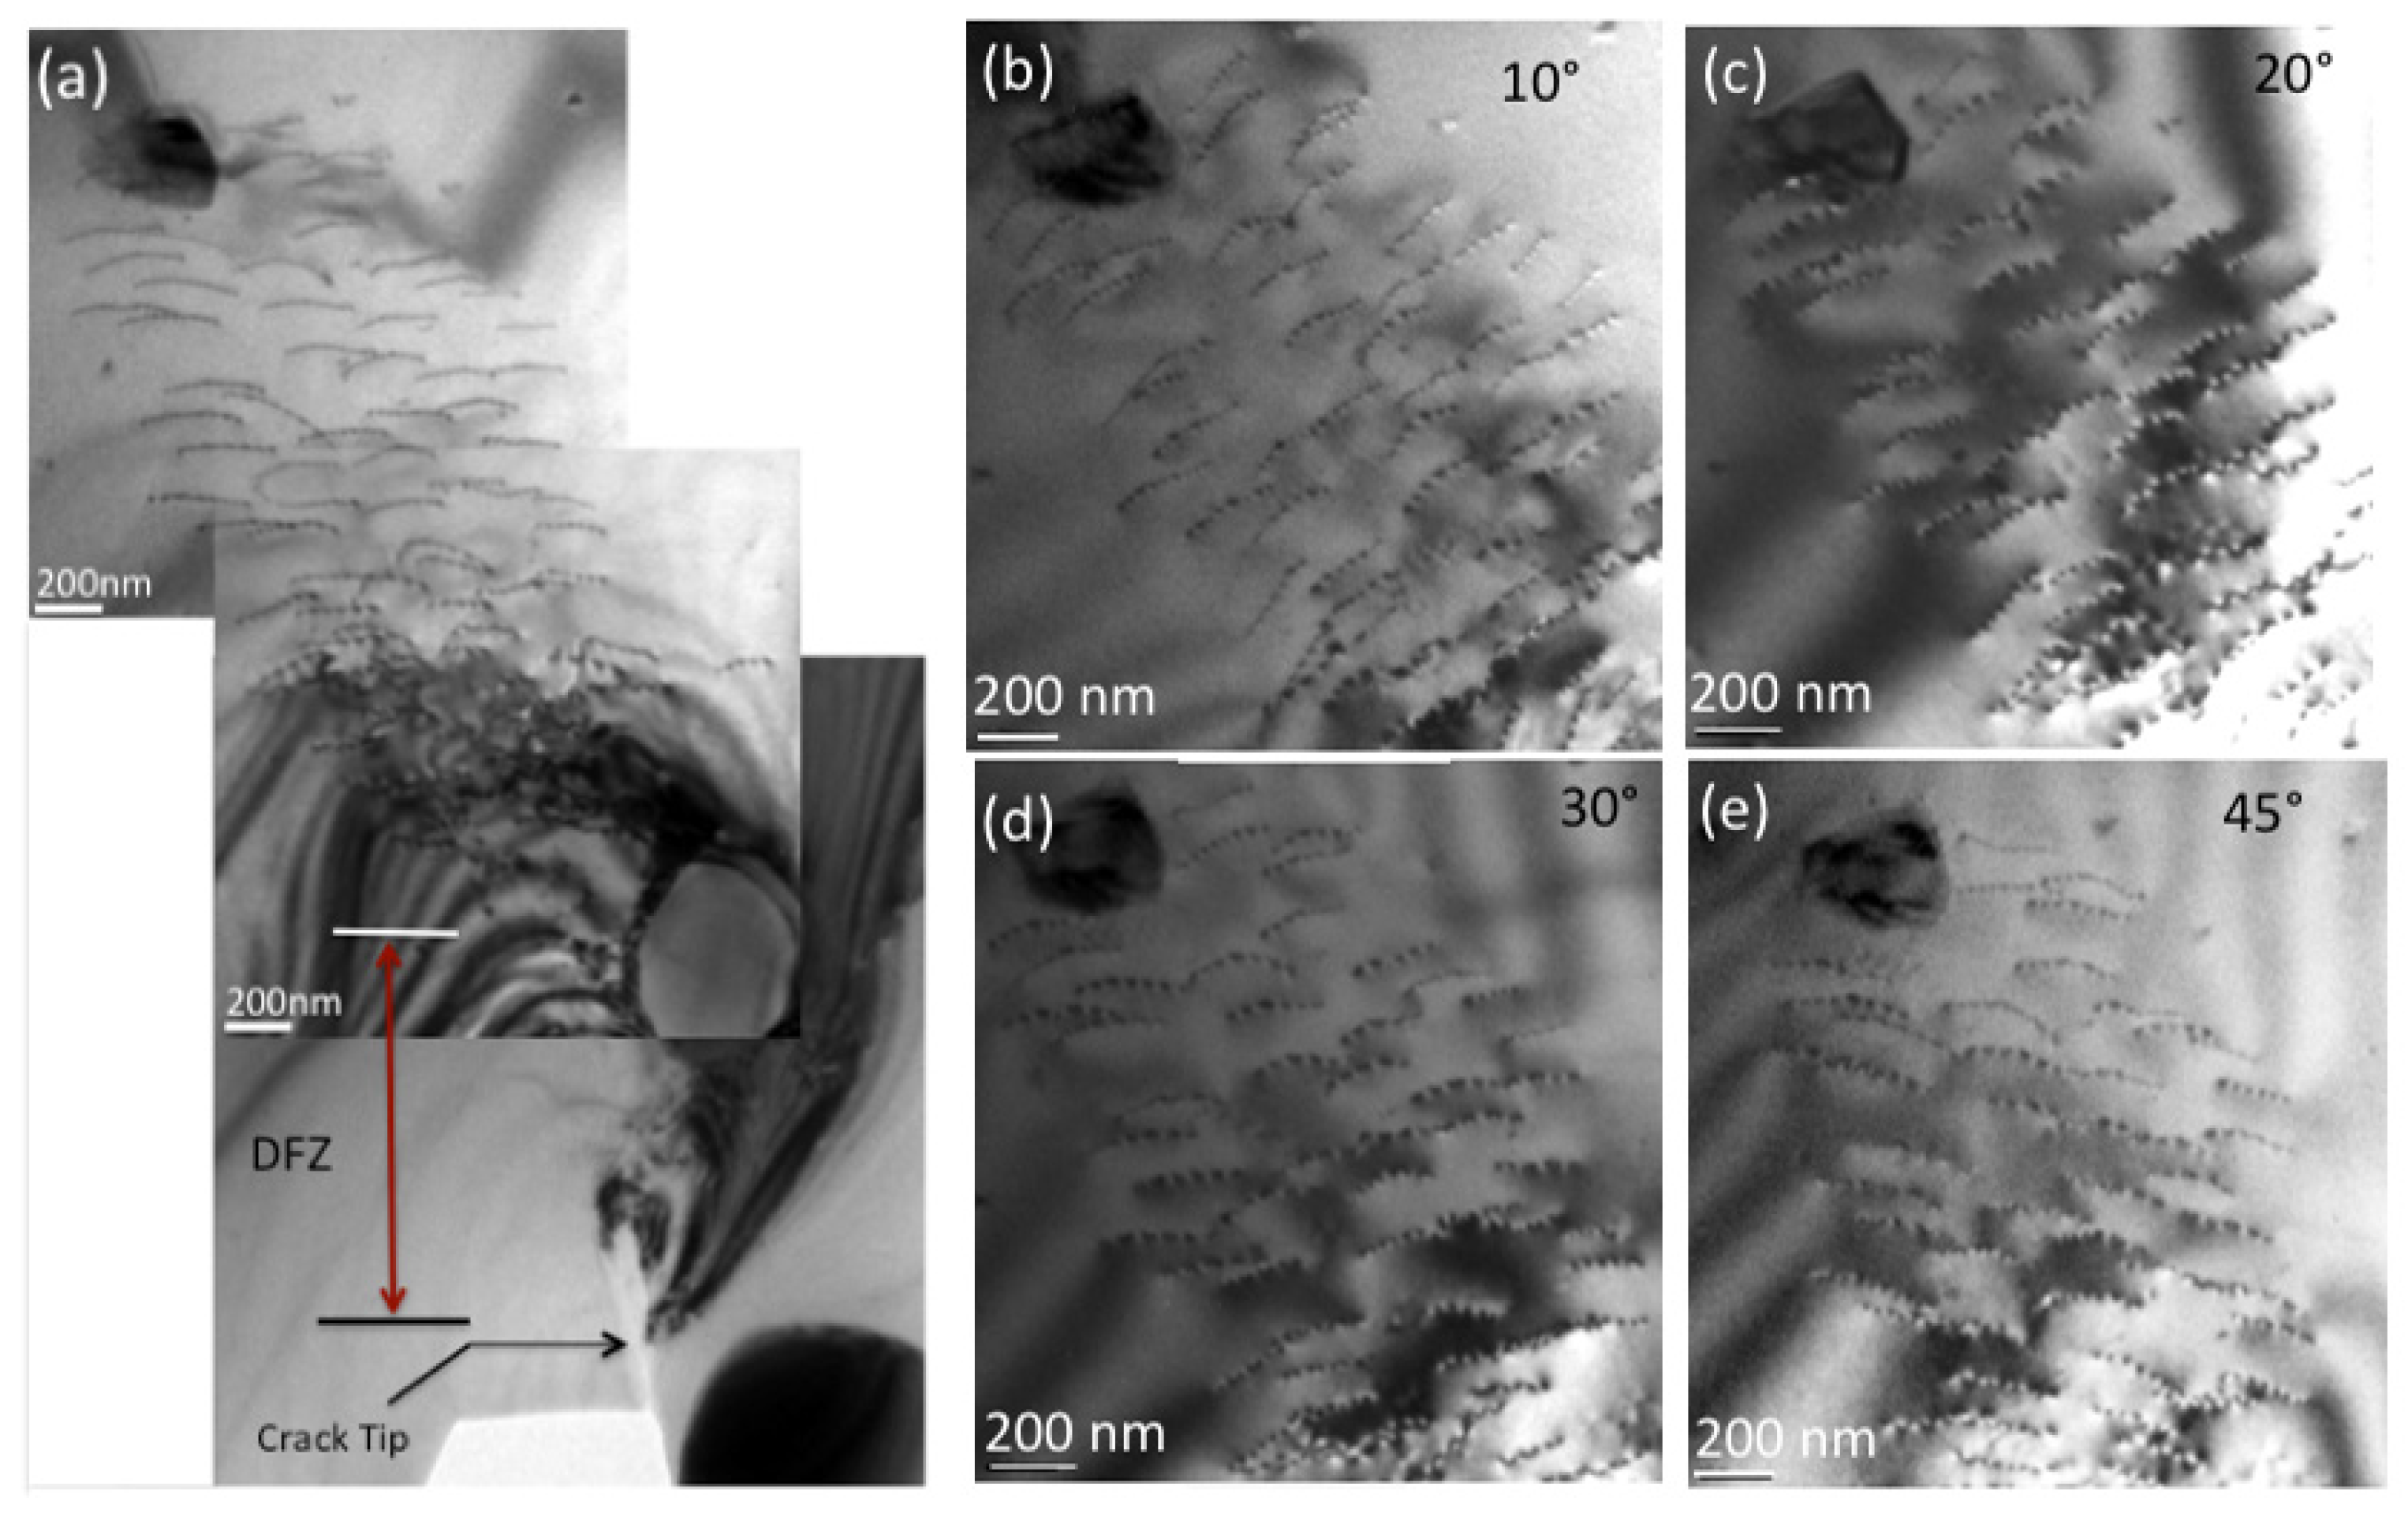
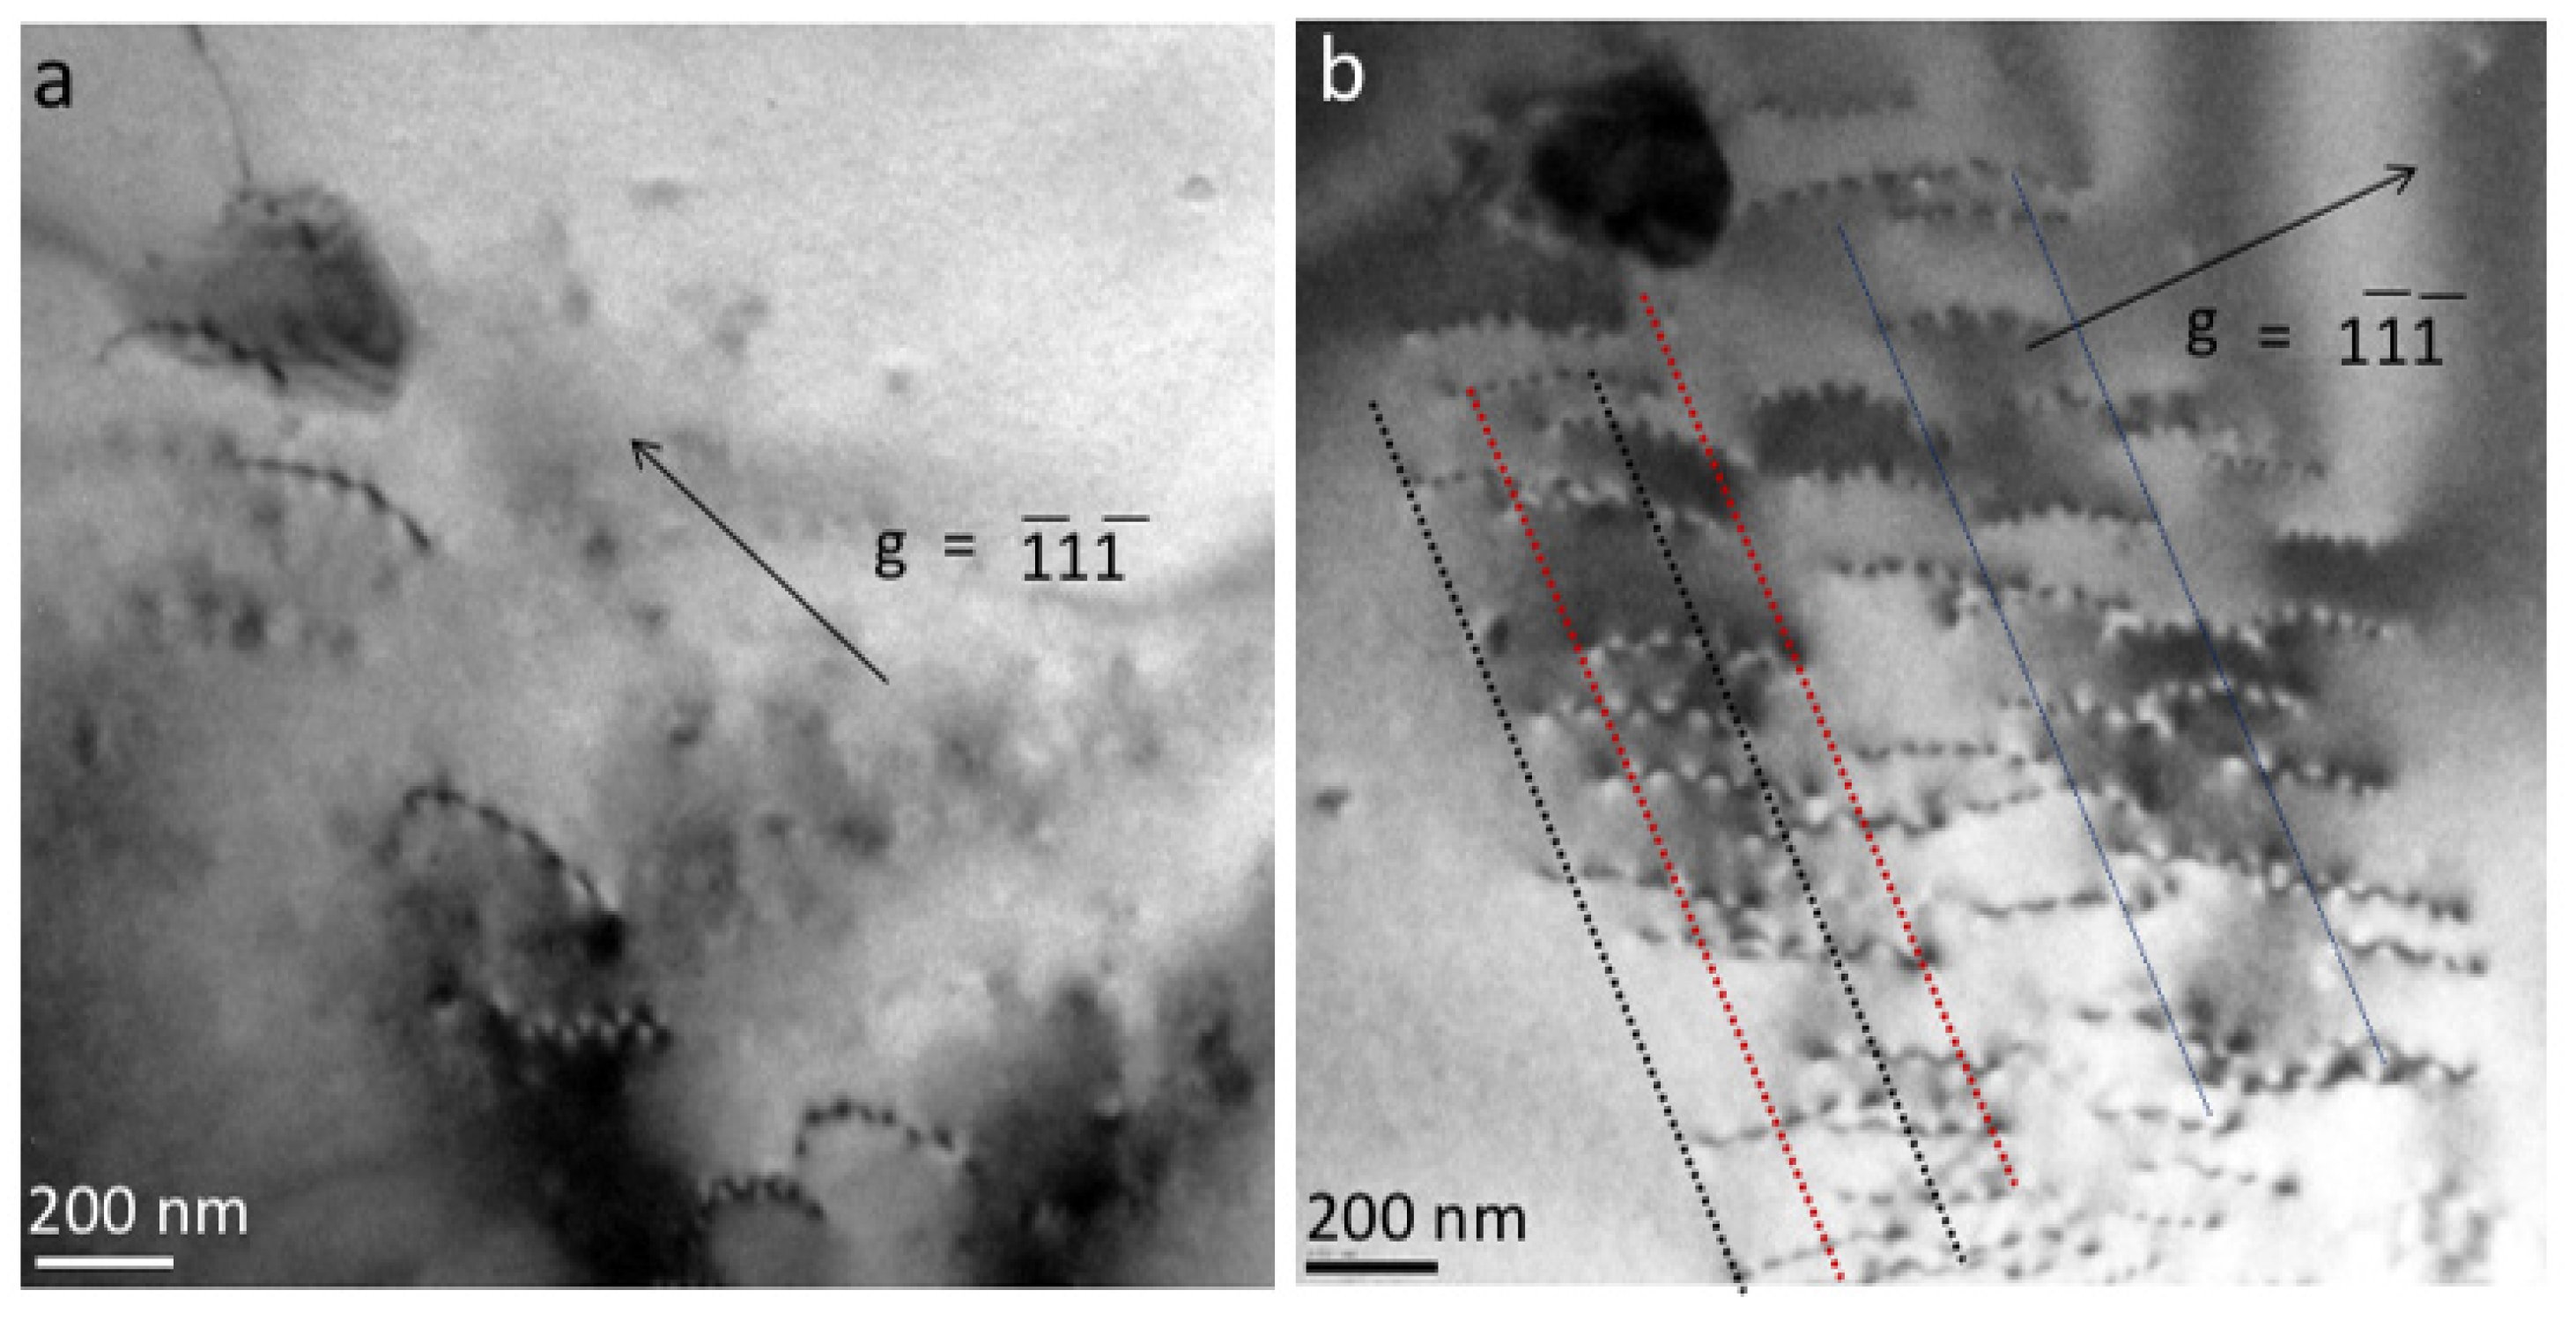
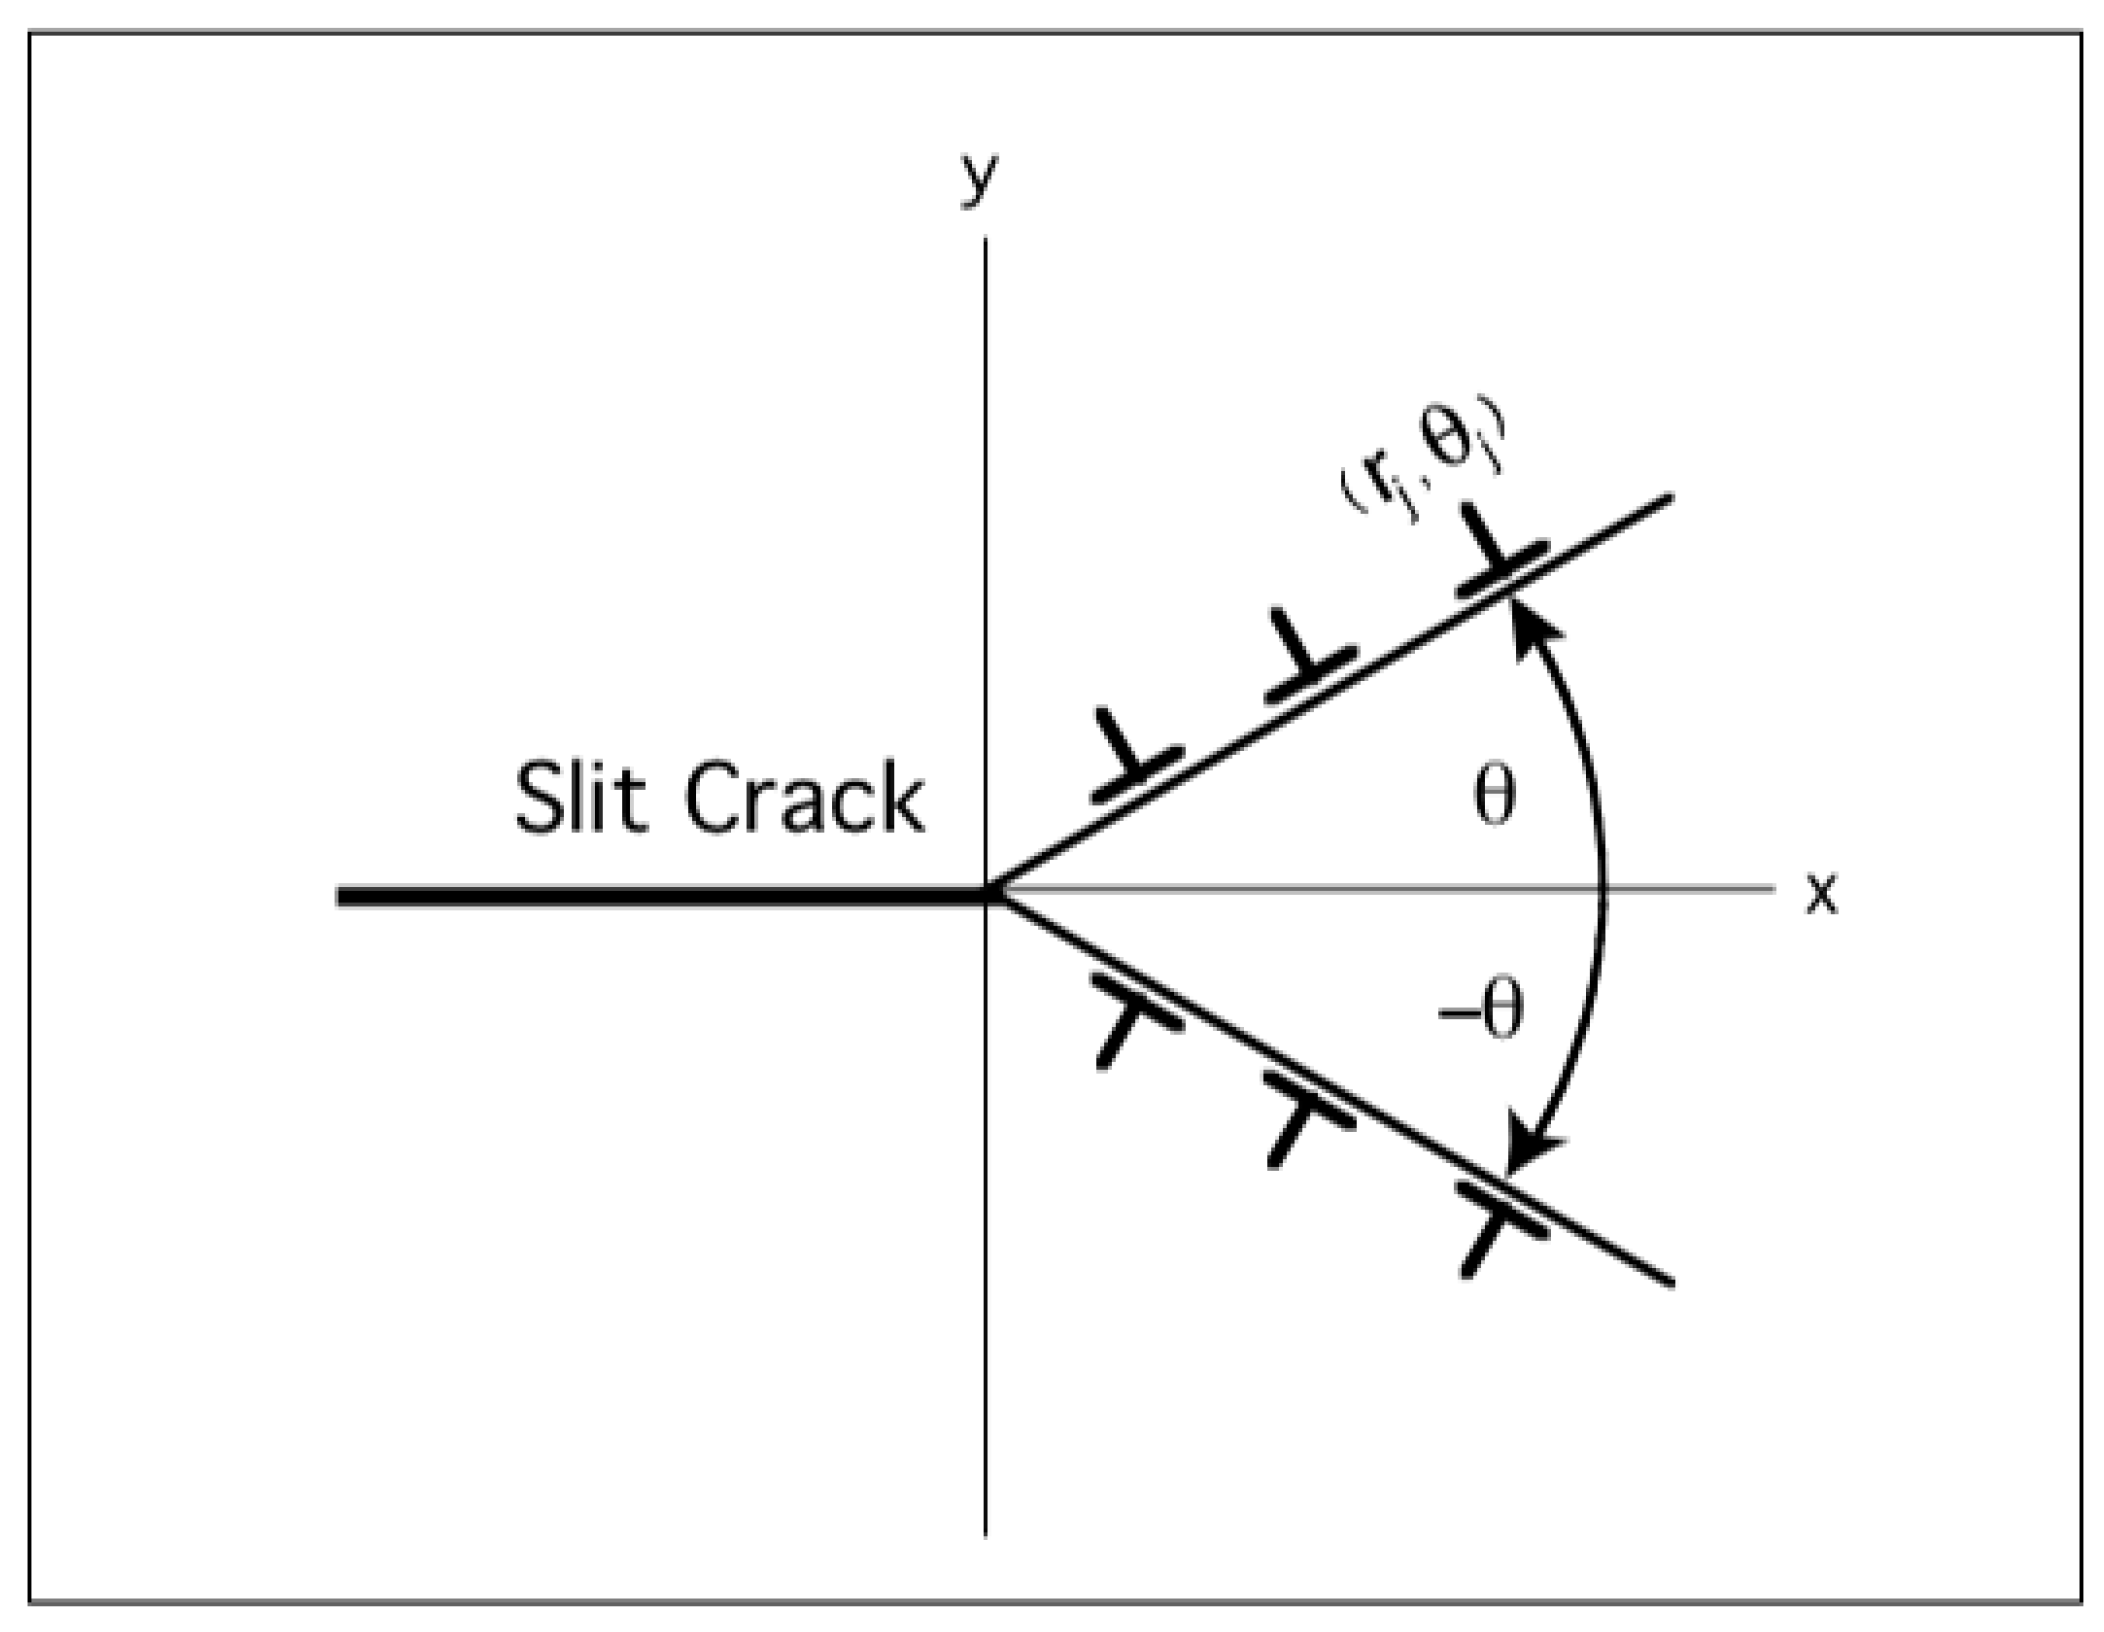
2. Dislocations Emission From Cracks

Significant efforts have been carried out to examine the crack-tip deformation behavior in metals and alloys using in-situ tensile deformation in an electron microscope. It has been reported that deformation occurs mostly by the emission of dislocations from the crack tip. The propagation of cracks has been correlated with the behavior of dislocations ahead of the crack tip. The process of dislocation emission from the crack tip have been examined theoretically by several authors, considering the elastic interaction between a crack and a dislocation. Ohr et al. [7,8,9] have observed dislocation emissions and the distribution of dislocations in the plastic zone during in-situ tensile deformation in an electron microscope. They reported a region immediately ahead of the crack tip to be free of dislocations and called this region as dislocation free zone (DFZ). Similar observations have been made by Park and coworkers [10].
Transmission electron microscopy (TEM) was employed to investigate the spatial configuration of dislocations emitted from crack tip in Cu and Al alloys. Figure 1a shows the emission of dislocation from a crack in (111) oriented single crystalline Cu. In this case, the crack lies on one of the (111) planes, and the dislocations are long and curved (see Figure 1b). Figure 2a is a bright-field TEM image showing the dislocations emitted from a crack tip for Al and a dislocation free zone (DFZ) of ≈ 1.35 μ m in length ahead of the crack tip. A total of ≈ 90 dislocations was observed to emitted from the crack tip [11]. These dislocations were then migrated up to 3.85 μ m from the crack tip. The plastic zone was found to be elliptical, which is in agreement with the discrete dislocation model [12], and the distribution of dislocations is approximately in the form of inverse pile-up configurations, which is consistent with the previous observations for stainless steel, Cu, Ni, Al and Mo [13]. We have examined the dislocations under different tilt conditions from 10 to 45 ° to investigate the dislocation configurations (see Figure 2b–e) in the plastic zone, and determine the Burgers vector of the dislocations using the g . b = 0 criterion. Figure 3a shows most of the dislocations with g = 1 ¯ 1 1 ¯ are invisible. Most dislocations are, however, visible with g = 1 1 ¯ 1 ¯ and g = 002 as shown in Figure 3b. It suggests that the most dominant dislocations have Burgers vector, b = a 2 [011]. For the case of thin foil, these dislocations around the crack tip were emitted to accommodate mode-III stress intensity. Note that usually in mode-III loading, most dislocations are of screw type, and in this case these dislocations lie on one parallel set of 111 planes. The estimated mean position of dislocations is in reasonably good agreement with models of crack-dislocation configuration based on a continuum distribution dislocations. These models, however, do not accurately predict the number of dislocations emitted by the crack tip.

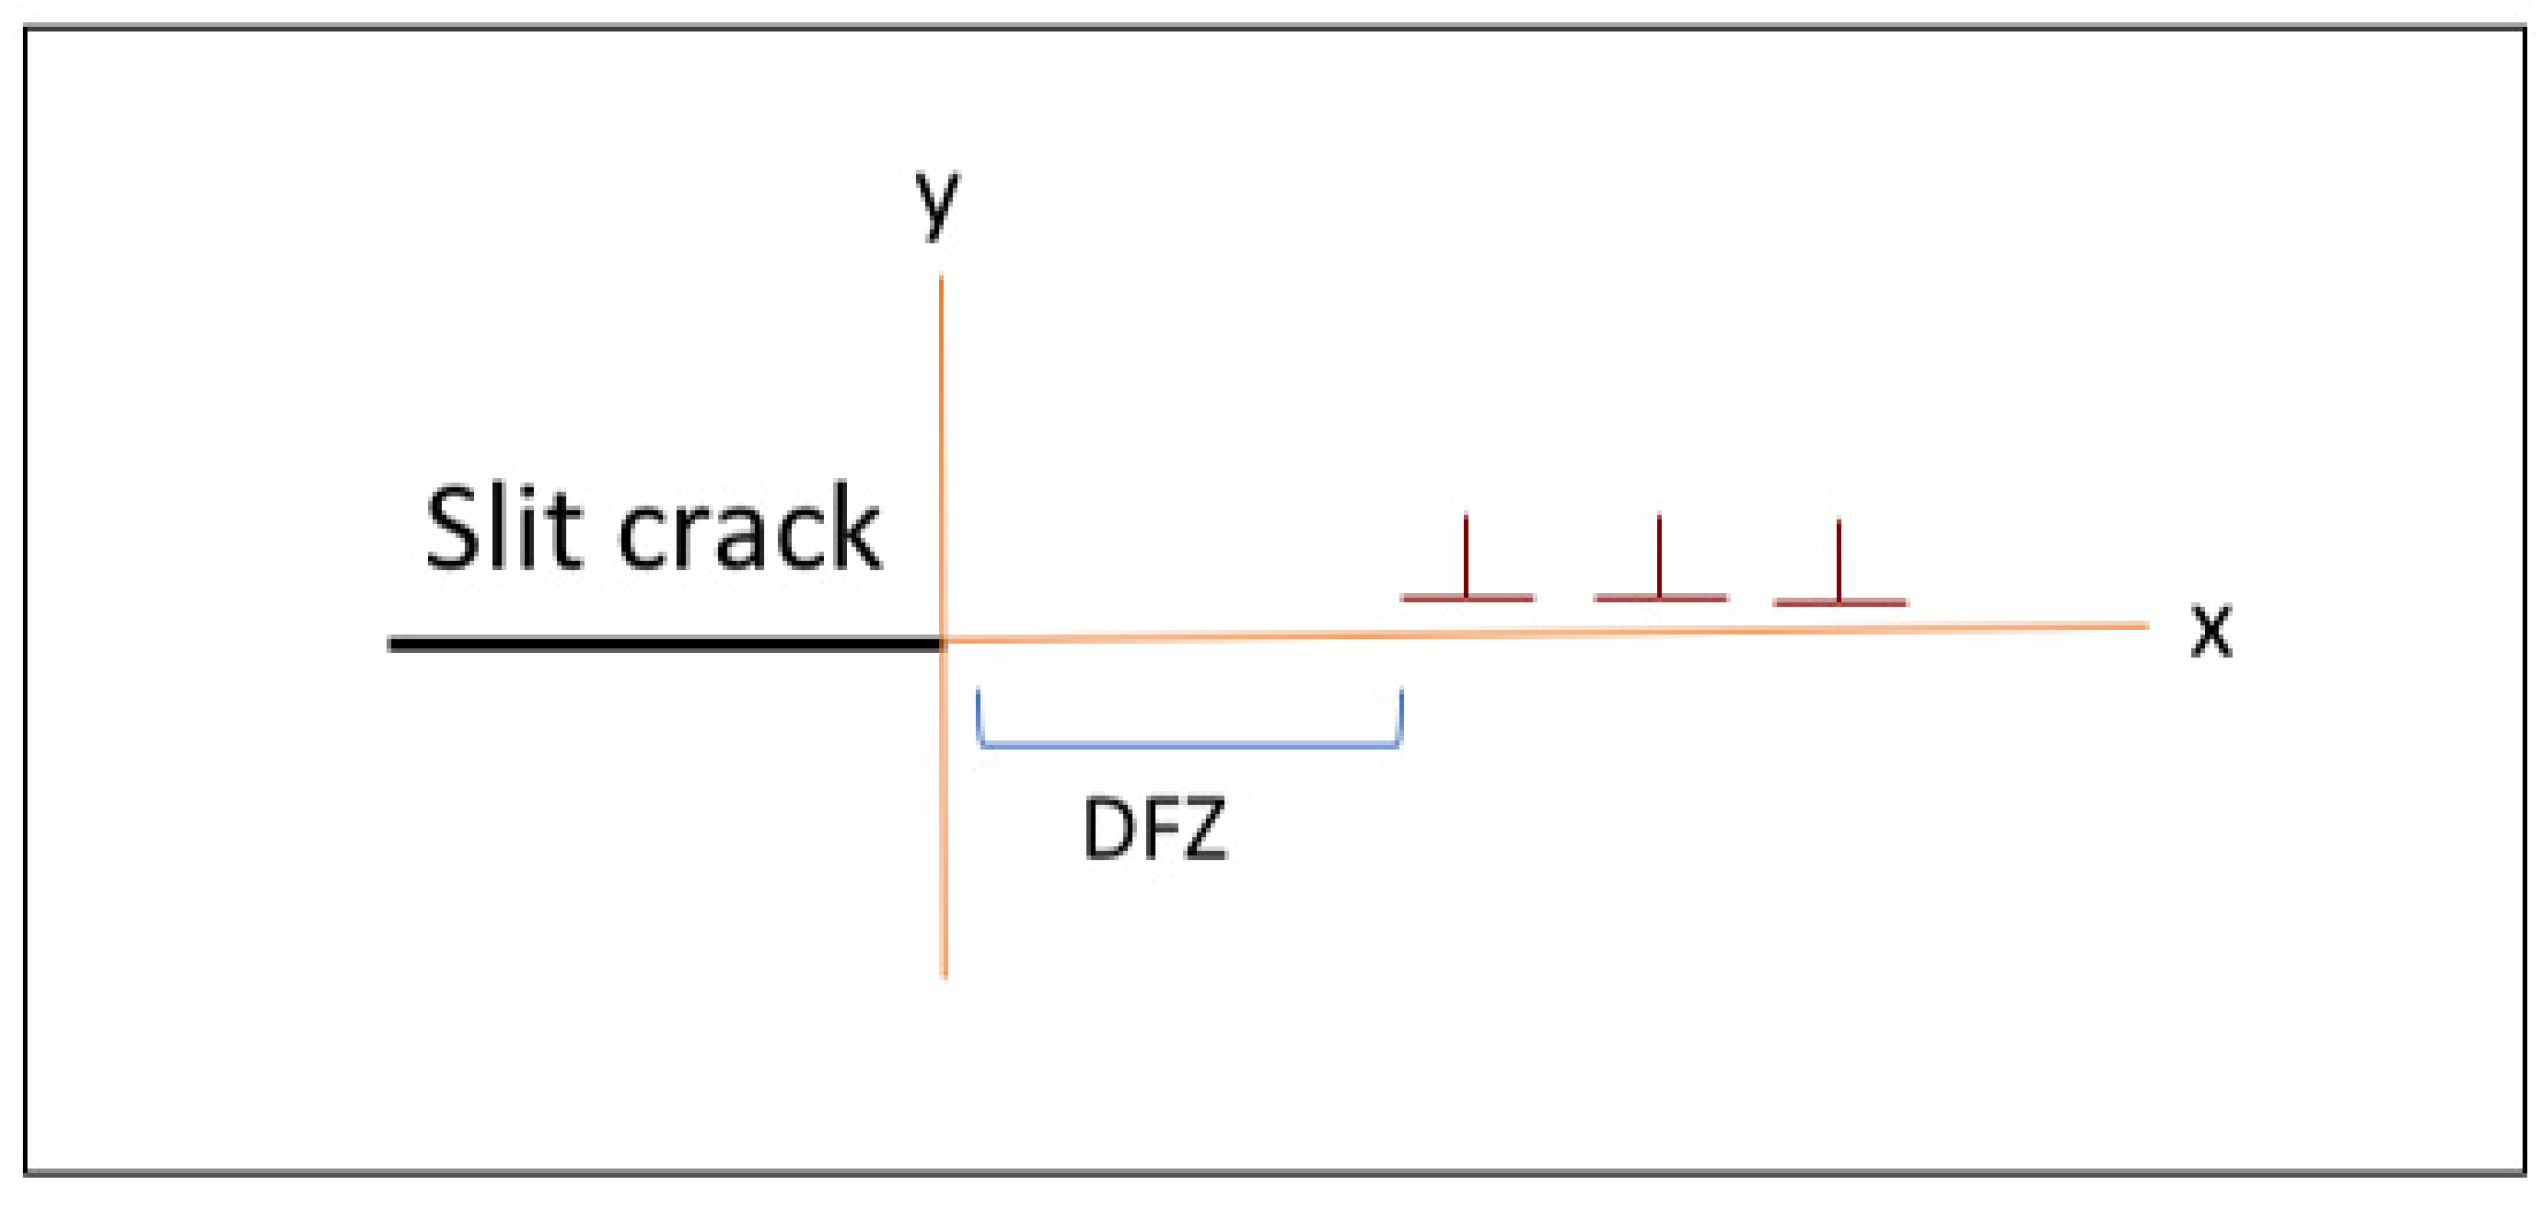
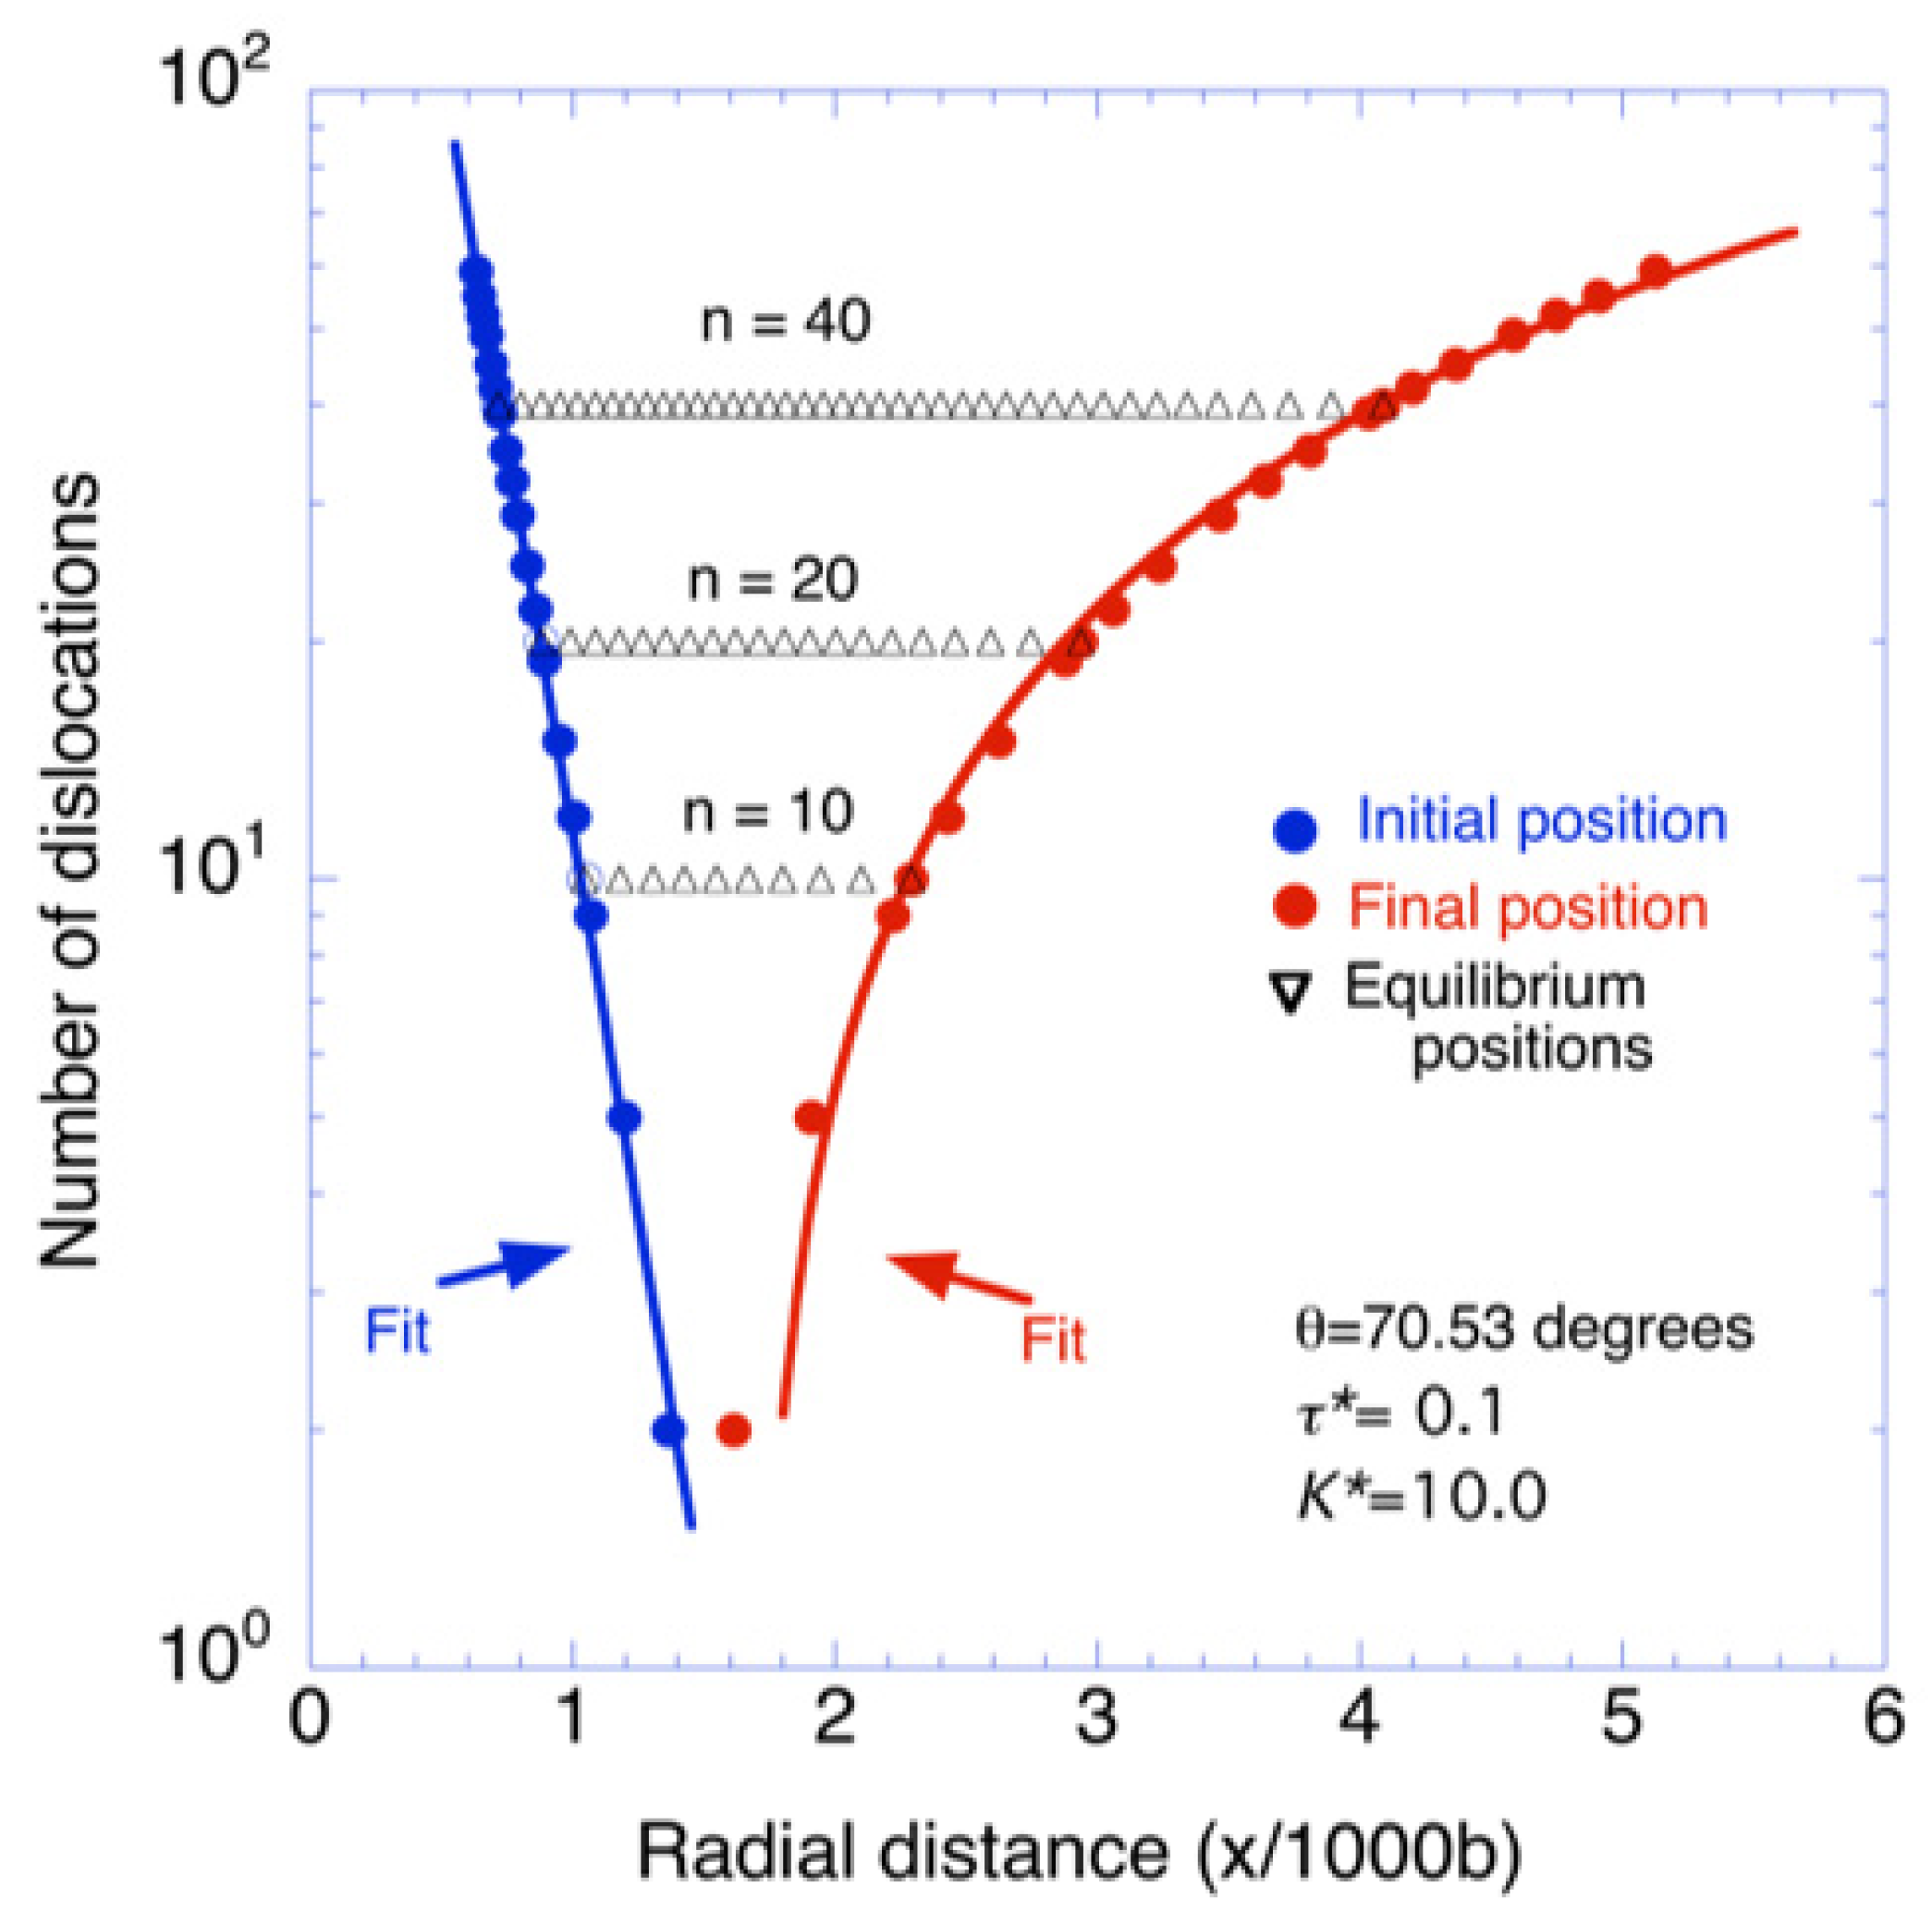
3. Crack-Dislocation Interaction(s)

To understand of the fatigue phenomenon at the microscopic level, an investigation of crack-dislocation interactions [14] is needed. In this regard, the most interesting work has been the development of discrete modeling approach by Pippan et al. [15,16,17,18], Deshpande et al. [19], and Mastorakos and Zbib [20]. They established that it is essential to concentrate on the initial stages of fatigue process. In addition, to better understand the existence of a threshold in the fatigue, an understanding of the stresses both at and near the crack tip, is required. The discrete dislocation studies may deliver the changes in both the stresses and resultant displacements during cyclic loading, and this model can convincingly show the crack propagation mechanism, which is appropriate depending on the nature of loading. Note that most models related to the fatigue phenomenon are two-dimensional in nature. Mastorakas and Zbib [20] employed a three-dimensional (3D) model, which is more realistic to obtain a better understanding of the fatigue phenomenon. However, it does not use of discrete dislocations concept. Several simulations using the discrete nature of dislocations have been done before [18,21,22,23,24,25,26,27,28,29,30,31,32,33,34], which suggest that the fatigue threshold behavior can be related to the discrete nature of plastic deformation.
As discussed before, considerable efforts have been made to experimentally investigate the crack-tip deformation behavior using TEM [35,36,37,38]. All of these experimental observations show that the crack tip acts as a possible source of dislocations. As a result the dislocation emission starts from the crack tip, which is consistent with the fact that the crack tip is associated with the highest stress. Such crack-tip dislocation emission process, on the other hand, have been theoretically [13,39,40,41,42,43] investigated by several authors. Several dislocation models [13,39,40,41,42,43,44,45] have been proposed to understand the initiation and propagation of cracks.
The initial model for the monotonically loaded cracks was first given by Bilby, Cottrell and Swinden (BCS) [44], which considers a finite crack in an infinite isotropic elastic medium (Figure 4). However, the BCS model does not consider for the existence of the DFZ in front of the crack tip, which has been experimentally observed. The BCS has been applied by Weertman [46] to model fatigue crack growth. This model has been modified by Chang and Ohr [13], Majumdar and Burns [39,40] and Weertman et al. [46,47,48,49]. Majumdar and Burns [39,40] model considers a crack tip with a pile-up of screw dislocation, and a dislocation free zone immediately after the crack. This model assumes continuous distribution of dislocations in the plastic zone. Lin and Thomson (LT) [45] considered two symmetrically inclined slip planes stemming from a semi-infinite crack tip, and they replaced the dislocation arrays by a superdislocation and examined the emission of dislocation. In the next section, we discuss another crack-tip dislocation model by Pande, Masumura and Chou [50,51], which do not use the superdislocation approximation. In their model, Pande et al. provided an expression for the length of DFZ, which cannot be obtained by the Lin-Thomson model because of the unrealistic (not experimentally observed) approximation of superdislocation.

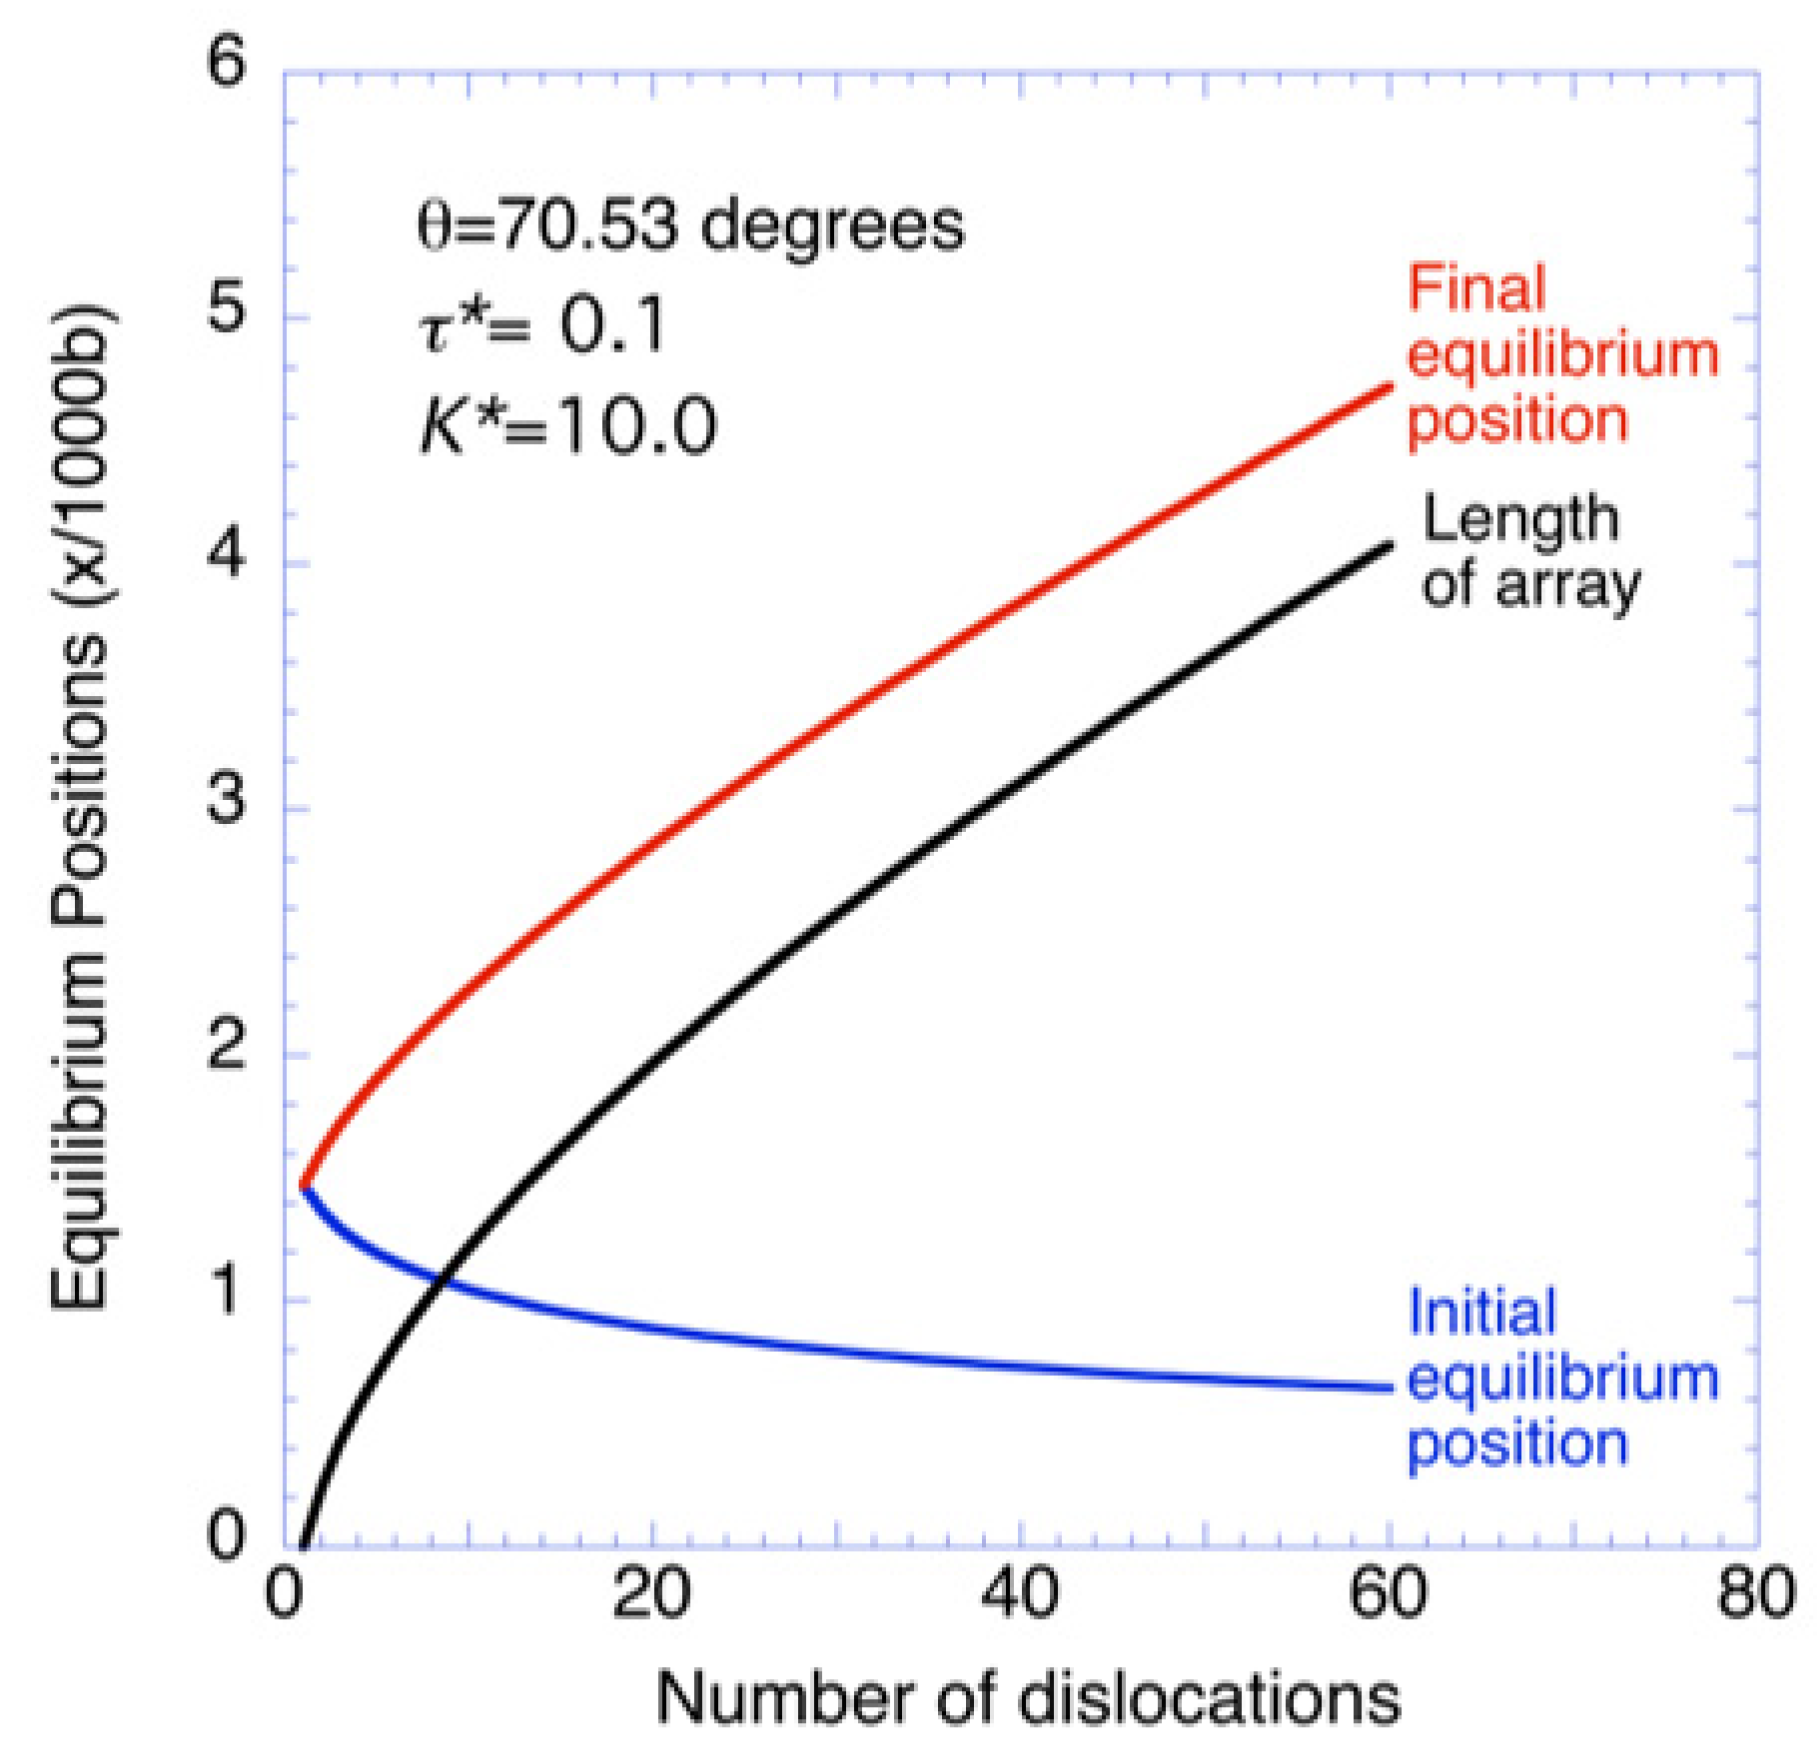
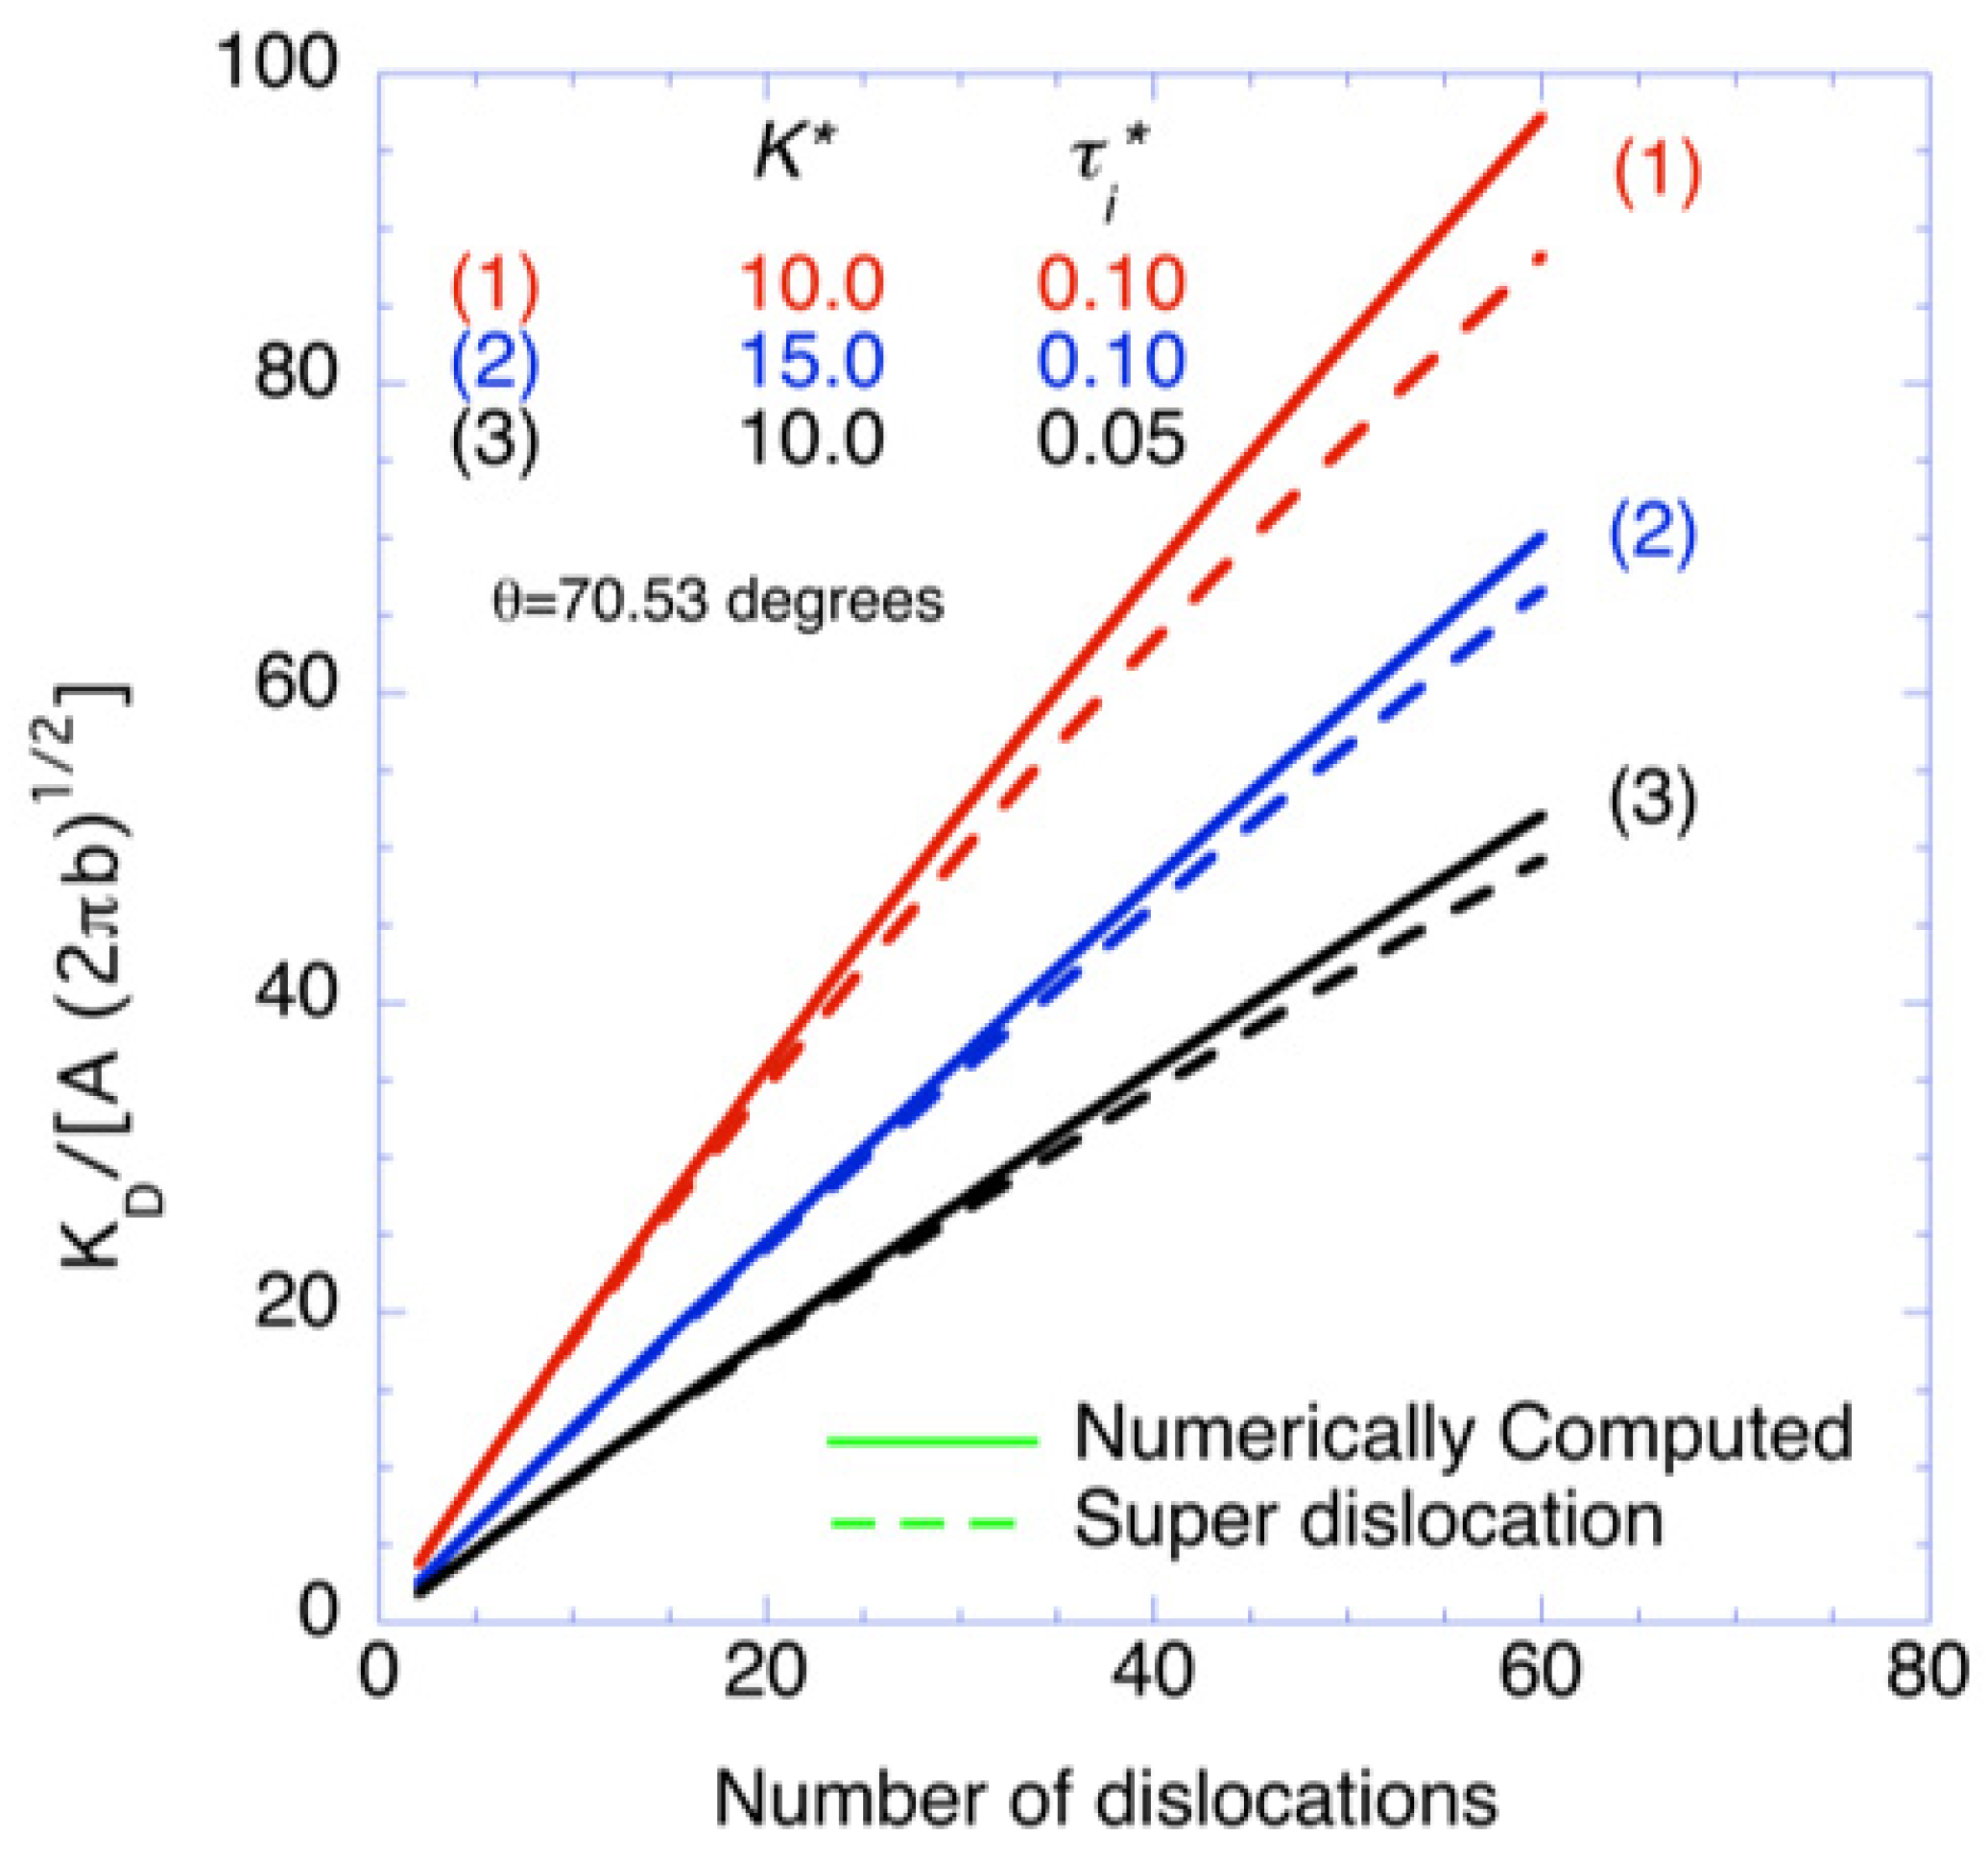
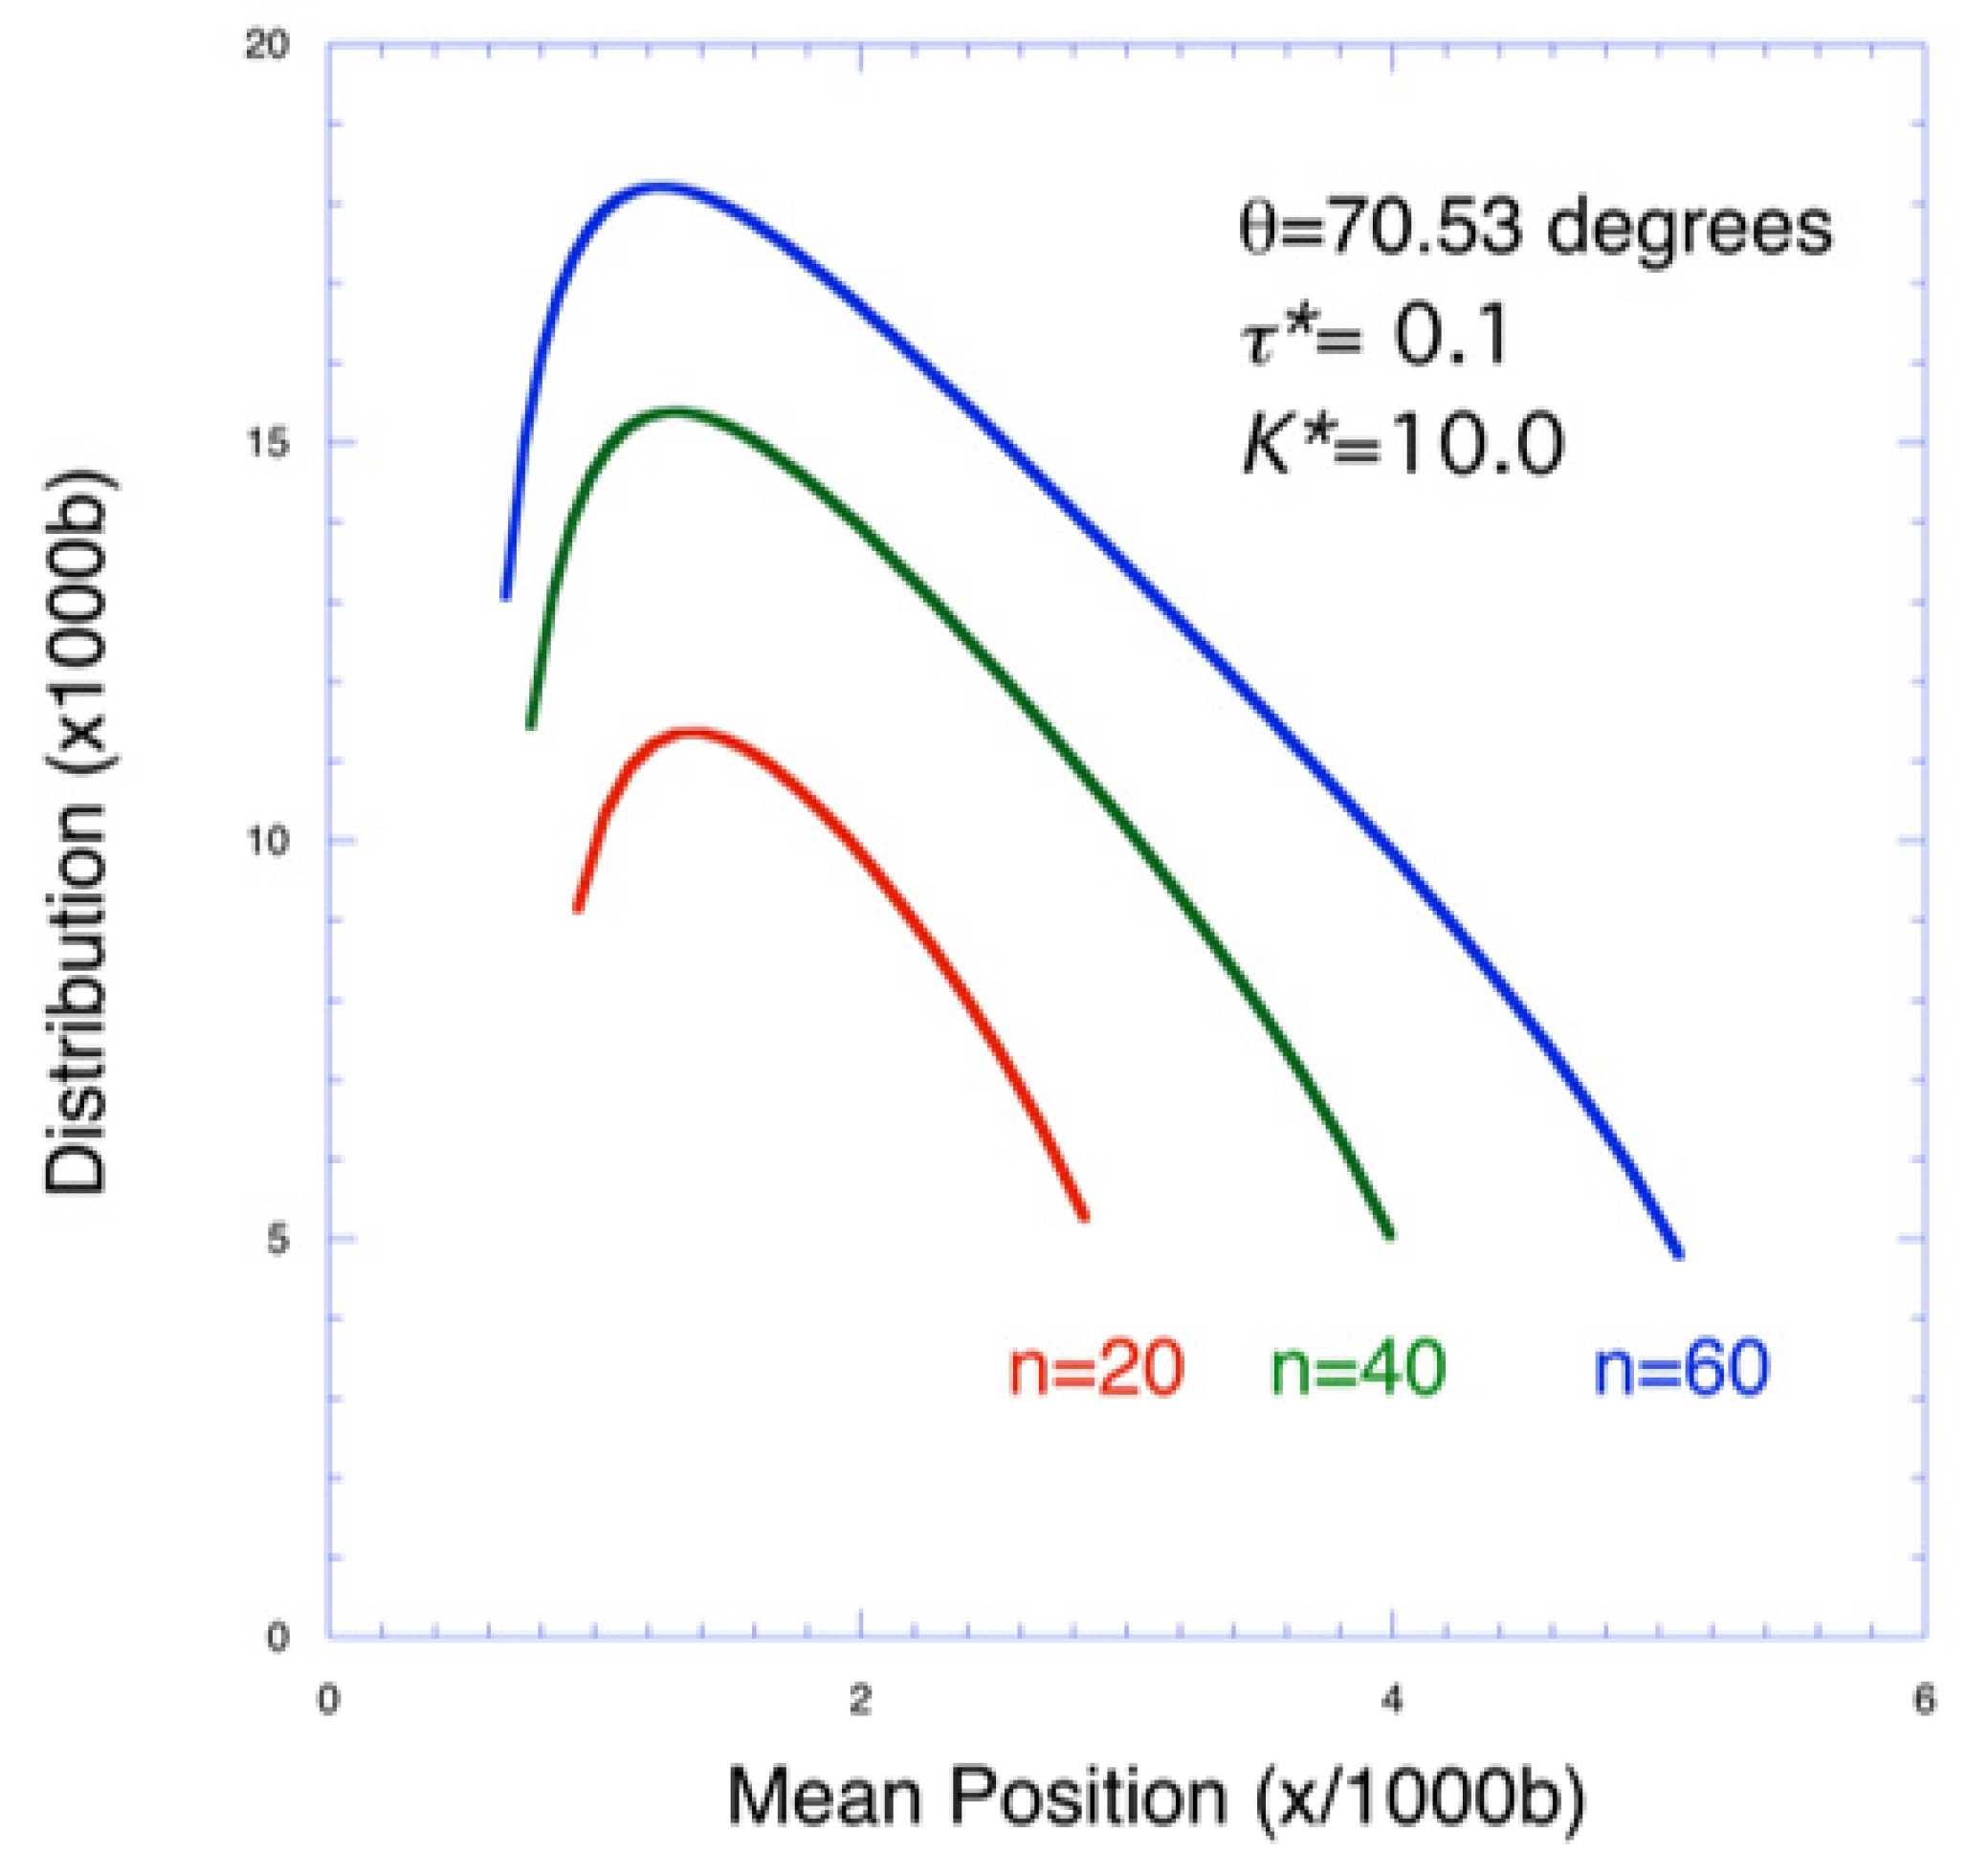
Pande, Masamura and Chou Model

This model examined emission of dislocations on two symmetrically inclined slip planes from a semi-infinite crack tip in mode-I loading. The crack geometry is shown in Figure 5 for edge dislocations on two inclined slip planes. In this condition, the forces on the ith dislocation on the slip plane are due to (1) the crack tip stress field, (2) stress field due to other dislocations and the (3) image forces due to the crack surface. The sum of the forces, at equilibrium, is equal to the lattice friction force, F f r i c . It can be written as [51];
F f r i c = b τ f r i c = F i m a g e + F c r + F d F i m a g e = μ b 2 4 π ( 1 ν ) r i F c r = b K A 2 π r i s i n θ 2 c o s 2 θ 2 F d = ( k = 1 , k i ) n F d k ,
where ν is Poissons ratio, K A is the stress intensity factor, and F f r i c , F i m a g e , F c r and F d are the forces due to lattice friction, image, crack and dislocations, respectively.
The force due to other dislocations, F d , can be estimated by the superposition of forces of the elastic field [52]. Zhang et al. [53] formulated the contribution of this force for an infinite slit crack and a single edge dislocation on an inclined slip plane using the complex potential [52]. The force acting on the ith dislocation due to the kth dislocation is given by the Peach-Koehler equation. It is written as;
F d k = b σ r θ k
Thus, for the ith dislocation, the scaled force equilibrium condition is written as:
τ i * = 1 2 ρ i + K * ρ i s i n θ 2 c o s 2 θ 2 + 1 2 ( k = 1 , k i ) n f d k ,
where τ i * = τ f r i c A , f d k = σ r θ k A , ρ i = r i b , A = μ 2 π ( 1 ν ) and K * = K A A 2 π b . For n dislocations, Equation (3) becomes a system of n equations, and the solution of these equations generates the equilibrium positions of dislocations, r i , for a given K * and τ i * . Utilizing the expressions given by Zhang et al. [53], the set of n × n non-linear simultaneous equations has been numerically solved.
One could use this model to estimate the size of the DFZ. The first and the last equilibrium positions are shown in Figure 6 as a function of the number of dislocations for K * = 10.0 and τ i * = 0.1 . In this geometry, the slip plane inclination is θ = 70.54 ° , and the plastic zone size is the distance from the crack tip to the last dislocation in the array. Similarly, the DFZ is the distance from the tip to the first dislocation. One could observe that the plastic zone size increases as the number of dislocations increases, while the DFZ decreases with the dislocation array. In this case, the greatest extent of the plastic zone size occurs when θ = 70.54 ° , which corresponds to the maximum of the total applied stress field.
The centroid of the superdislocation in Figure 6 is calculated as a simple mean and is fairly linear over a large range of dislocations. Furthermore, it has been observed that the various zones decrease with decreasing K * , for example, externally applied load. The elastic field at a crack tip is shielded ( b > 0 ) or enhanced ( b < 0 ), depending on the sign of the Burgers vector, which can be characterized by the stress intensity factor, K D due to the dislocations, and have been given by Lin and Thomson [45] (see also Zhang et al. [53]). The stress intensity factor, K D , is written as;
K D = 6 A π 2 s i n ( θ ) c o s θ 2 ( n 1 ) ρ m e a n + 1 ρ l ,
where ρ l is the position of superdislocation and n is number of dislocations. Using Equations (3) and (4), K D has been plotted as a function of number of dislocation (see Figure 7). Here ρ m e a n was considered as the arithmetic average of the dislocations positions. As K * increases from 10 to 15, the externally applied tensile stress reduces the effect of shielding. Similarly, the decrease in friction stress, τ * lowers the K D . All these effects can influence the response to fatigue loads and the subsequent crack growth behavior. In some cases, the superdislocation computation can deviate significantly from the actual K D , and the position of the superdislocation is somewhat arbitrary [50,51,54].
The distribution of dislocations is shown in Figure 8 for several values of n, θ = 70.54 ° and τ i * = 0.1 . As can be seen from the figure, the distribution is considerably different from a regular pile up of dislocation. The initial, final and equilibrium positions of dislocations [50,51,54] are shown in Figure 9, and it is clearly observed that the DFZ size is proportional to log n, and the plastic zone is proportional to the number of dislocations in the array.
The lower limit for K * and an equilibrium position, ρ m i n , for a given τ * and θ can be written as;
K m i n * = 2 τ * s i n θ 2 c o s 2 θ 2 ρ m i n = 1 2 τ * .
For θ = 70.53 ° and τ * = 0.1 , the above equation gives a minimum K * = 1.16 and ρ m i n = 5 . This analysis shows a minimum value of K * is required for the emission of dislocation from the crack. This minimum value of K * could be associated with one of the two fatigue thresholds [55].
Here we briefly discuss the crack tip deformation behavior in mode-III loading. For θ = 0 , this reduces to analysis presented by Dai and Li [41]. The stress intensity factor increases with the increase in θ by a significant amount. For other parameters, such as length of pile up and DFZ, the estimates are similar to the values obtained by Dai and Li. Thus if the dislocation arrays are inclined, they might significantly affect the crack propagation, which is valid even if it is not exactly mode-III. These results are useful in brittle and ductile fracture [56].

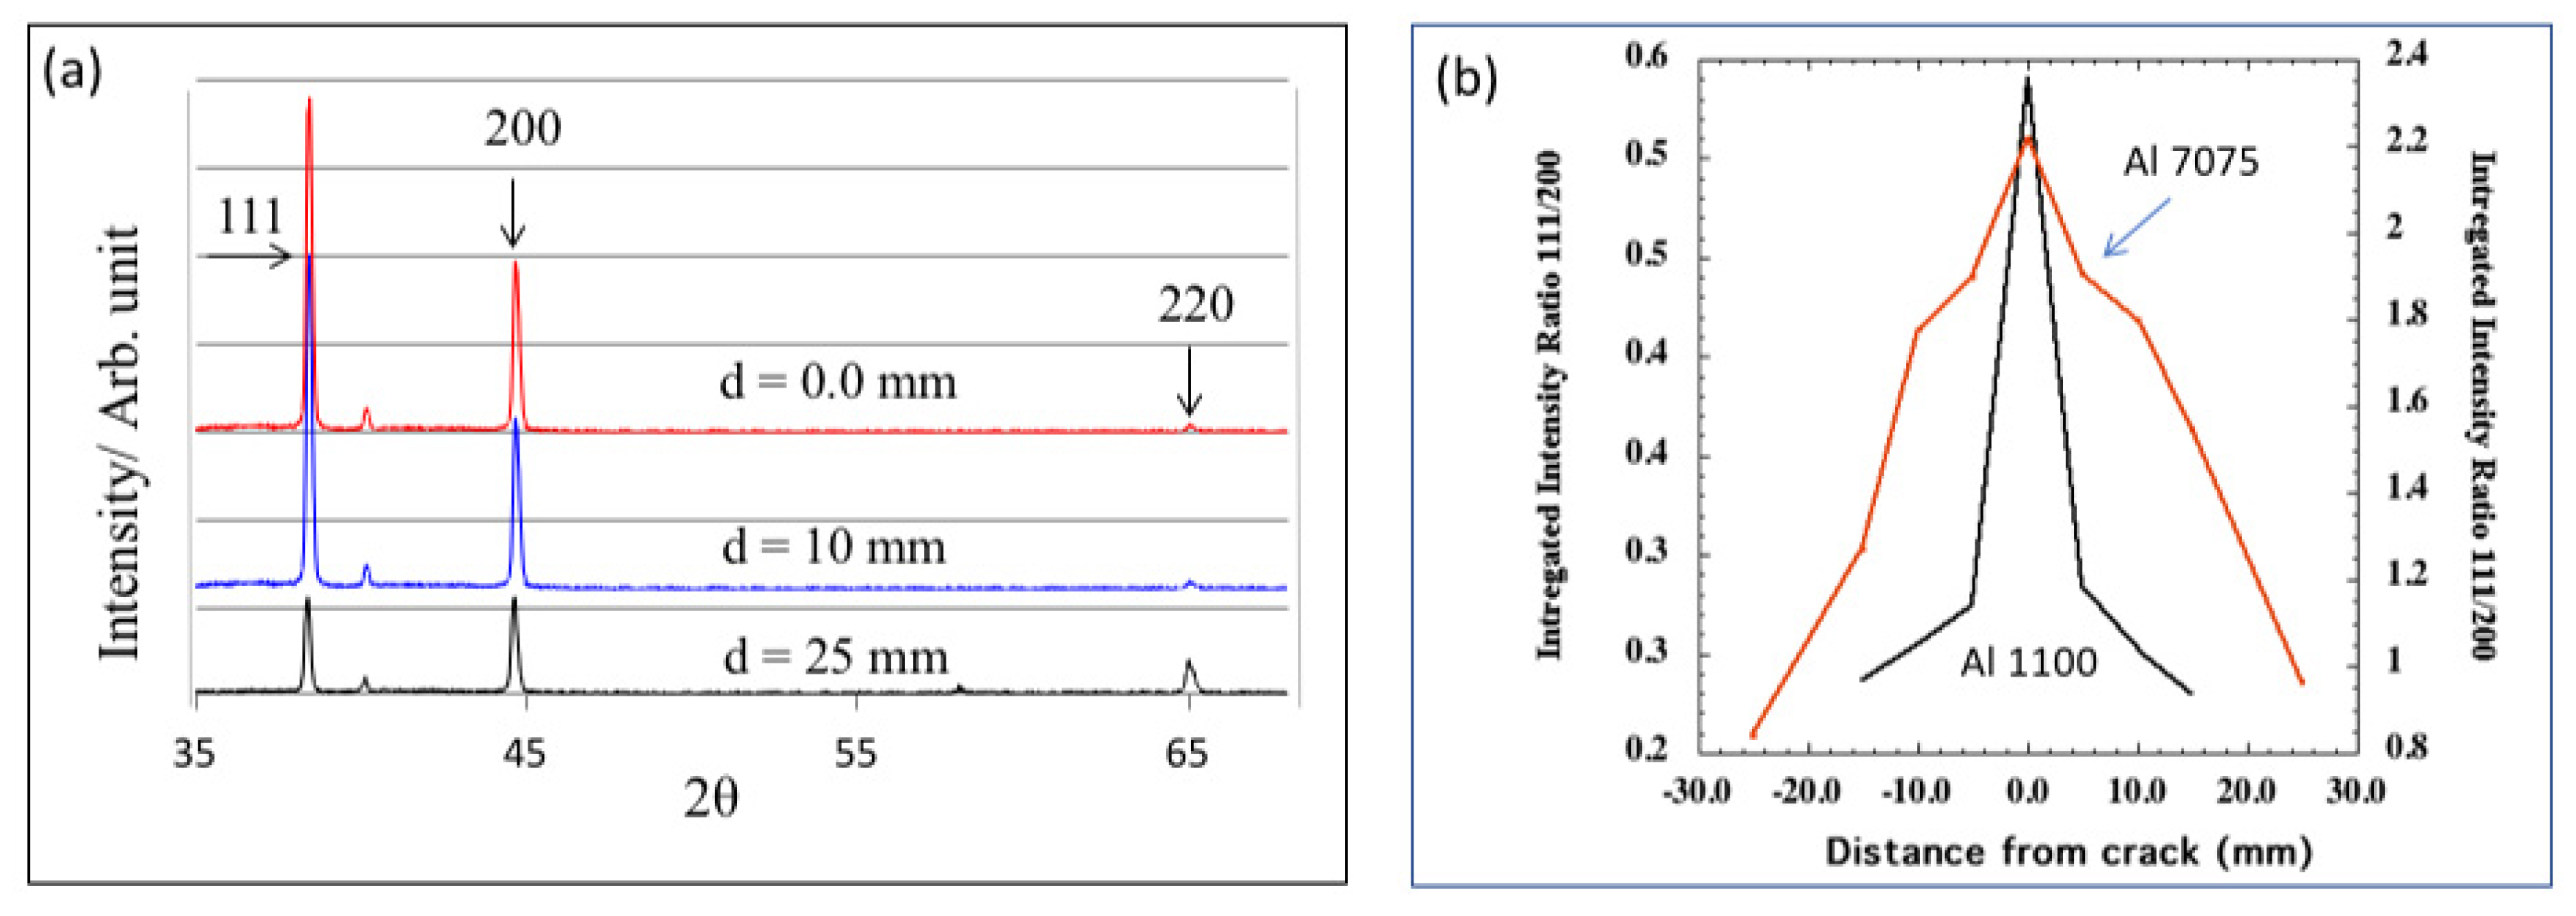
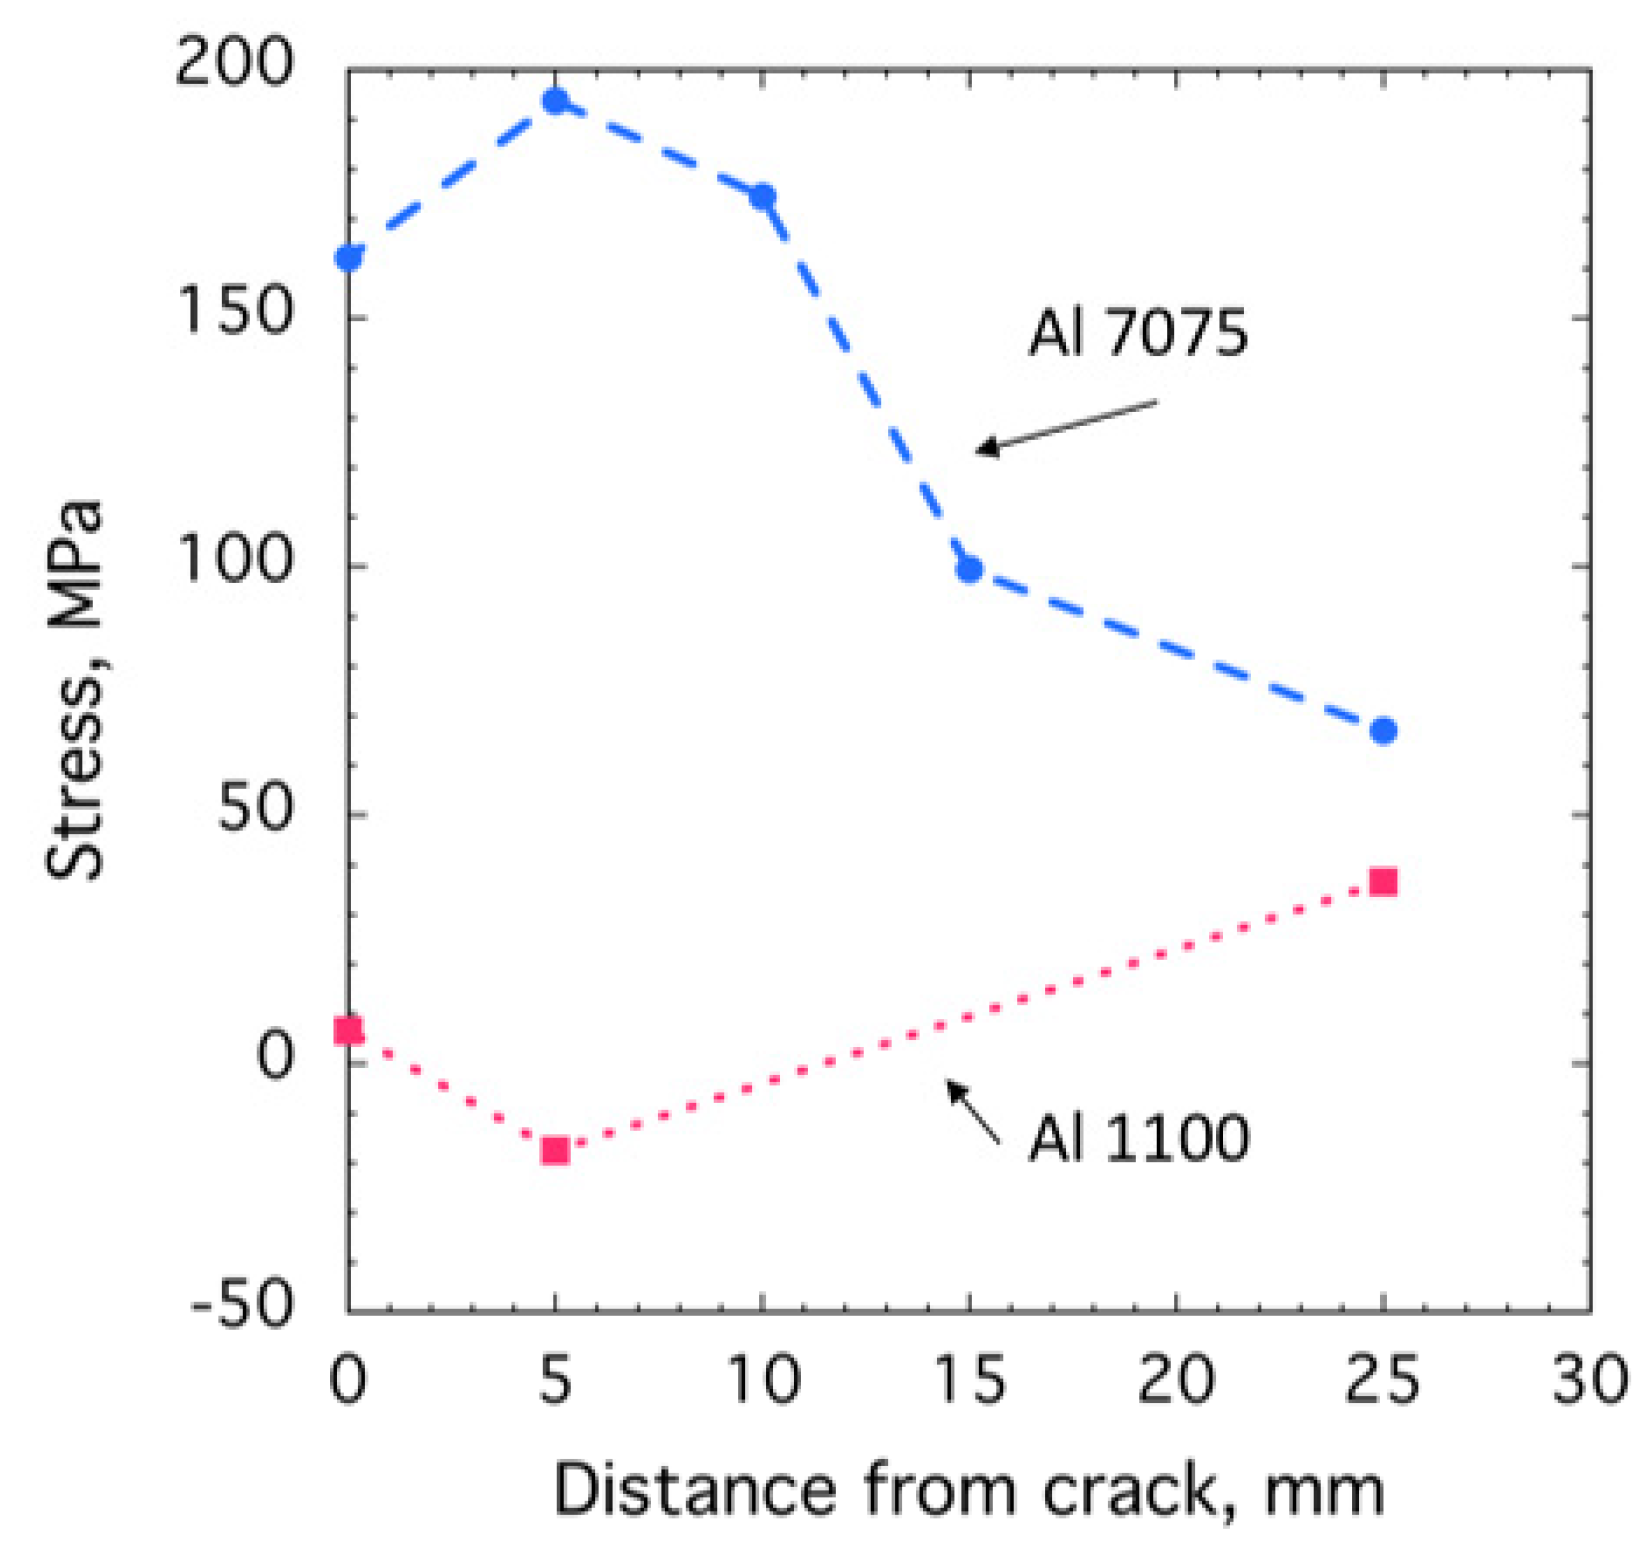
4. Experimental Verification

The theoretical distribution, position and number of dislocation in the plastic zone have been compared here with the experimental observations of dislocations close to the crack. Here we use Majumdar and Burns’ model to compare with the experimental observations as one can obtain the mean position and number of emitted screw dislocations for mode-III loadings. The experimental observations (see Figure 2 and Figure 3) suggest they are mostly screw type. These experiments were carried out on thin foils using in-situ tensile stage in the transmission electron microscope, and in this case the loading in the tensile stage on the thin foil conforms to mode-III loading [38]. The distance of the mean position of dislocation, X m , in front of the crack is given by Majumdar and Burns [39,40];
X m = K 1 c d 0.5 E c d 0.5 c K = π 2 + m π 8 + 9 π m 2 128 + E = π 2 m π 8 3 π m 2 128 ,
where K and E are the elliptic integrals, the c and d are the length of DFZ and the plastic zone size, respectively. The mean position, X m , has been obtained from the experimentally measured parameters, c and d (see Figure 2). For Al, the experimentally observed values of c and d [11] are 1.35 μ m and 3.85 μ m, respectively, and the X m turned out to be 2.15 μ m. This suggests that the continuum approximation can adequately describe the plastic zone. One can now estimate the number of emitted dislocations and compare with the theory. The stress intensity factor ( k I I I ) is given by;
k I I I = 0.75 τ f r i c 2 c π 0.5 l n 4 d c + 4 3 .
The total stress intensity factor ( K I I I ) is written as;
K I I I = k I I I + j = 1 N k ( j ) D ,
where the second term, j = 1 N k ( j ) D , is due to the contribution of N dislocations. Thus, the total stress intensity factor, K I I I , can be written as [42];
K I I I = 2 τ f r i c 2 d π 0.5 ,
From Equation (9), the total number of crack tip dislocations, N, is given by;
N = K I I I μ b 2 d π 0.5 N = 4 d π μ b τ f r i c .
Considering τ f r i c = 20 MPa and μ = 27 GPa for Al, the number of emitted dislocations calculated using Equation (10) turned out to be 13. TEM observations, however, showed that the observed number of dislocations (see Figure 2 and Figure 3) is approximately one order of magnitude greater than this estimation. Although the mean position of the dislocation distribution in the plastic zone can be predicted by the continuum dislocation models, they do not properly predict the total number of emitted dislocations from a crack tip. This discrepancy could result from the assumption that all dislocations lie on one plane is not a valid one. There are many other reasons also. The model itself is two dimensional and the dislocations are considered straight and infinite in length. One important fact observed in our experiments is that the crack has several sources of dislocations active at the same time. The predictions are thus merely quantitative. But such a large discrepancy need further experimental and theoretical investigations.

5. Effect of Dislocation Emissions

The emission of dislocations in fatigue results in significant lattice rotation and tensile residual stresses around the fatigue crack [57,58,59,60]. The lattice rotation may be related to the size of the plastic zone and the redistribution of dislocations and slip processes in front of crack. To study the plastic zone, the growth of the crack has been stopped at a different lengths. Fatigue tests were performed in vacuum (< 6 × 10 6 Pa) background pressure at a cyclic load frequency of 10 Hz with a load ratio of 0.10 on compact tension (CT) specimens. Figure 10a shows the XRD patterns at different locations from the crack. One could observe the relative variations of 111 and 200 Al peaks (see Figure 10b) as a function of position from crack at either side of the crack for Al 7075 and Al 1100. For Al 7075, the ratio of 111 to 200 increases from 1.20 to 2.2 close to the crack, implying a change approximately 130%. This suggests that considerable lattice rotation across several grains takes place in front of the crack as a result of fatigue crack growth at room temperature [57].
The compressive residual stress enhances the fatigue lifetime [61], however, the tensile residual stress is highly damaging under fatigue loading [62]. Thus, the residual stress can affect the crack growth by influencing the stress intensity factor, the mean stress and the fatigue life [63,64]. In addition, the local residual stress could play a significant role than the overall large scale distribution of the residual stresses. To estimate the residual stress, the elastic strain has been experimentally obtained with the XRD technique around the crack. The residual stresses were obtained from the slope and the intercept of the d vs. s i n 2 ( ψ ) lines [59] as a function of distance from the crack. The slope has been observed to be positive at a number of locations for Al 7075, indicating that the stress is tensile in most places, and the residual stresses increase from 60 MPa to 195 MPa at 5 mm from the crack, and then decreases to 165 MPa close to the crack for Al 7075 (see Figure 11). The stress measured in front of the crack tip is ≈ 220 MPa. For Al 1100, the stresses decrease from 38 MPa tensile at 25 mm to 17 MPa compressive at 5 mm from the crack. It is below 5 MPa tensile close to the crack (see Figure 11).
In Section 3, we have given a detailed description of analytical progress in developing dislocation crack interaction. Although the very nature these analyses are often two dimensional and highly idealized model of the fatigue process, they provide valuable insight of the interactions, and also mathematical expressions of the various fatigue parameters, which can be experimentally tested. As mentioned before in our opinion the most interesting work during the last few years has been development of discrete modeling approach by Pippan et al. [26,27], Deshpande and co-workers [19], and also continuum modeling by Mastorakos and Zbib [20]. They used a three- dimensional analysis, which is more appropriate and realistic, but it does not make use of discrete dislocations. On the experimental side, as seen in Section 4, there is need to use many sophisticated and, in some cases, new analytical techniques to obtain a more realistic picture of the fatigue process. New direct evidence is presented for the cracks as a major source of dislocations taking part in the fracture and fatigue process. From our model, we obtain the size of the plastic zone and an estimate of the critical threshold for further dislocation emission.
A significant lattice rotation has been observed in the plastic zone of a fatigue crack. We ascribe such rotation to glide of large number of dislocations in front of crack. As we approach the crack, the residual stress increases gradually around the fatigue crack by ≈ 200% for Al-7075, and decreases by ≈ 80% for Al-1100. Such change in residual stress cannot be explained by the difference in dislocation density alone. We demonstrate that the deformation associated with the lattice rotation is a major factor controlling the residual stress [59].
This review, we hope, establishes the fact that cracks are the primary source of dislocations. In fact, in our own work no secondary source of dislocation ahead of the crack was found. On the theoretical side, it appears that analytical modeling of the dislocation-crack interaction is much more complex than usually assumed. Firstly, there are more than one dislocation source at the crack tips. Secondly, the 3D nature of the process is hard to model and thirdly, the dislocations are curved. The superdislocation model introduced by Lin and Thompson may simplify some of the analytic difficulties. A relatively new result, that is, the rotation of the grains ahead of the crack, even when the grains are not in the nano range (≤10 nm) was shown to be an important part of the fatigue process, and should be taken into consideration in making fatigue predictions.

6. Concluding Remarks

The detailed picture of the deformation and fatigue processes has now been well described in the literature. A semi-emperical understanding of various features involved in these processes is also available. Using empirical techniques and experimental methods, fairly accurate predictions can sometimes be made [14]. A macro picture of the process has also emerged, where dislocation density and dislocation configurations play a significant part. For an excellent, but brief recent summary, see the review by Mughrabi [65]. For most of the purposes the above described knowledge of the phenomenon is sufficient.
Despite the progress so far made, our basic understanding of many features of the processes is lacking. In the absence of the basic understanding, dislocation modeling has so far not become a predictive tool. It has been mostly used in many cases to provide quantitative understanding of the experiments or give some rule of thumb for practical applications. We want therefore to strive a more basic understanding of the processes involved. In other words, we want to study the issues involved at a more fundamental level using modern analytical techniques and to use as far as possible rigorous mathematical techniques to analyze the dislocation configurations and their role.
Towards this goal, some fundamental studies have been undertaken, which are briefly described in this review. In 2001, Riemelmoser et al. [28] gave an overview of the dislocations modeling of cracks and in 2003 Pipan et al. [66] published a chapter in much greater detail on dislocation models of fatigue crack growth. Another review dealing with more applied aspects of the basic theoretical models, published in 2011 by Bhat and Patibandla [67] is also very useful. A short review of 2D modeling, which is most common, is provided by Olarnrithinun, in 2013 [68].
One aspect of the modeling not mentioned in our review is the atomistic modeling of the fatigue process. This technique may be very useful in the future as the capacity of the computing process increases. A review of this technique applied to nanostructurally small cracks is available by Horstemeyer et al. [69]. In summary, much remains to be discovered and investigated before a comprehensive methodology for predicting fatigue from first principles can be made available.

Funding

This research was funded by the Office of Naval Research (ONR) through 6.1 program at Naval Research Laboratory (NRL), Washington DC 20375.

Acknowledgments

We also thank Ronald Armstrong for critical comments and encouragement in the preparation of this paper.

Conflicts of Interest

The authors declare no conflict of interest.

References

  1. Findlay, S.J.; Harrison, N.D. Why aircraft fail. Mater. Today 2002, 55, 18–25. [Google Scholar] [CrossRef]
  2. Basinski, Z.S.; Basinski, S.J. Low amplitude fatigue of copper single crystals-III PSB sections. Acta Metall. 1985, 33, 1319–1327. [Google Scholar] [CrossRef]
  3. Mott, N.F. A theory of the origin of fatigue cracks. Acta Metall. 1958, 6, 195–197. [Google Scholar] [CrossRef]
  4. Antonopoulos, J.G.; Brown, L.M.; Winter, A.T. Vacancy dipoles in fatigued copper. Philos. Mag. 1976, 34, 549–563. [Google Scholar] [CrossRef]
  5. Differt, K.U.; Essmann, U.; Mughrabi, H. A model of extrusions and intrusions in fatigued metals-II surface roughening by random irreversible slip. Philos. Mag. A 1986, 54, 237–258. [Google Scholar] [CrossRef]
  6. Neumann, P. Coarse slip model of fatigue. Acta Metall. 1969, 17, 1219–1225. [Google Scholar] [CrossRef]
  7. Kobayashi, S.; Ohr, S.M. Proceedings of the 37th Annual Meeting Electron Microscopy Society of America; Bailey, G.W., Ed.; Claitors Publishing: Baton Rouge, LA, USA, 1979; pp. 424–425. [Google Scholar]
  8. Kobayashi, S.; Ohr, S.M. In-situ Fracture Experiments in BCC Metals. Philos. Mag. 1980, A42, 763–772. [Google Scholar] [CrossRef]
  9. Kobayashi, S.; Ohr, S.M. In-situ Observations of the Formation of Plastic Zone Ahead of a Crack Tip in Copper. Scr. Metall. 1981, 15, 343–348. [Google Scholar] [CrossRef]
  10. Park, C.G.; Lee, S.; Chang, Y.W. Mechanical behavior of materials. In Proceedings of the 6th International Conference, Kyoto, Japan, 29 July–2 August 1991; Volume 4, pp. 3–9. [Google Scholar]
  11. Goswami, R.; Pande, C.S. Investigations of Crack-Dislocation Interactions Ahead of Mode-III Crack. Mater. Sci. Eng. A 2015, 627, 217–222. [Google Scholar] [CrossRef]
  12. Du, K.L.; Lu, J.B.; Li, R.W. A continuous dislocation model of mode-I crack. In Proceedings of the 15th ASCE Engineering Mechanics Conference, New York, NY, USA, 2–5 June 2002; Columbia University: New York, NY, USA, 2002; pp. 1–8. [Google Scholar]
  13. Chang, S.J.; Ohr, S.M. Dislocation free zone model of fracture. J. Appl. Phys. 1981, 52, 7174–7181. [Google Scholar] [CrossRef]
  14. Suresh, S. Fatigue of Materials, 2nd ed.; Cambridge University Press: Cambridge, UK, 1998. [Google Scholar]
  15. Pippan, R. Dislocation emission and fatigue crack growth threshold. Acta Metall. Mater. 1991, 39, 255–262. [Google Scholar] [CrossRef]
  16. Pippan, R. The condition for the cyclic plastic deformation of the crack tip: The influence of dislocation obstacles. Int. J. Fract. 1992, 58, 305–318. [Google Scholar] [CrossRef]
  17. Riemelmoser, F.O.; Pippan, R.; Stuwe, H.P. A comparison of a discrete dislocation model and a continuous description of cyclic crack tip plasticity. Int. J. Fract. 1997, 85, 157–168. [Google Scholar] [CrossRef]
  18. Riemelmoser, F.O.; Pippan, R.; Stuwe, H.P. An argument for a cycle-by-cycle propagation of fatigue cracks at small stress intensity ranges. Acta Mater. 1998, 46, 1793–1799. [Google Scholar] [CrossRef]
  19. Deshpande, V.S.; Needleman, A.; Giessen, E. A discrete dislocation analysis of near-threshold fatigue crack growth. Acta Mater. 2001, 49, 3189–3203. [Google Scholar] [CrossRef] [Green Version]
  20. Mastorakos, I.N.; Zbib, H.M. Dislocation-cracks interaction during fatigue: A discrete dislocation dynamics simulation. J. Met. 2008, 60, 59–63. [Google Scholar] [CrossRef]
  21. Curtin, W.A.; Deshpande, V.S.; Needleman, A.; Giessen, E.; Wallin, M. Hybrid discrete dislocation models for fatigue crack growth. Int. J. Fatigue 2010, 32, 1511–1520. [Google Scholar] [CrossRef] [Green Version]
  22. Wilkinson, A.J.; Roberts, S.G. A dislocation model for the two critical stress intensities required for threshold fatigue crack propagation. Scr. Mater. 1996, 35, 1365–1371. [Google Scholar] [CrossRef]
  23. Wilkinson, A.J.; Roberts, S.G.; Hirsch, P.B. Modelling the threshold conditions for propagation of stage-I fatigue cracks. Acta Mater. 1998, 46, 379–390. [Google Scholar] [CrossRef]
  24. Doquet, V. Crack initiation mechanisms in torsional fatigue. Fract. Eng. Mater. Struct. 1998, 21, 661–672. [Google Scholar] [CrossRef]
  25. Giessen, E.; Deshpande, V.S.; Cleveringa, R.P.; Needleman, A. Discrete dislocation plasticity and crack tip fields in single crystals. J. Mech. Phys. Solids 2001, 49, 2133–2153. [Google Scholar] [CrossRef] [Green Version]
  26. Pippan, R.; Riemelmoser, F.O.; Weinhandl, H.; Kreuzer, H. Plasticity-induced crack closure under plane-strain conditions in the near-threshold regime. Philos. Mag. 2002, 82, 3299–3309. [Google Scholar] [CrossRef]
  27. Pippan, R.; Riemelmoser, F.O. Dislocation shielding of fatigue cracks. Metallkunde 1995, 86, 823–826. [Google Scholar]
  28. Riemelmoser, F.O.; Gumbsch, P.; Pippan, R. Dislocation modelling of fatigue cracks: An overview. Mater. Trans. A 2001, 42, 2–13. [Google Scholar] [CrossRef] [Green Version]
  29. Hansson, P.; Melin, S. Simulation of simplified zigzag crack paths emerging during fatigue crack growth. Eng. Fract. Mech. 2008, 75, 1400–1411. [Google Scholar] [CrossRef]
  30. Bjerkn, C.; Melin, S. A tool to model short crack fatigue growth using a discrete dislocation formulation. Int. J. Fatigue 2003, 25, 559–566. [Google Scholar] [CrossRef]
  31. Bjerkn, C.; Melin, S. A study of the influence of grain boundaries on short crack growth during varying load using a dislocation technique. Eng. Fract. Mech. 2004, 71, 2215–2227. [Google Scholar] [CrossRef]
  32. Hansson, P.; Melin, S. Dislocation-based modelling of the growth of a microstructurally short crack by single shear due to fatigue loading. Int. J. Fatigue 2005, 27, 347–356. [Google Scholar] [CrossRef]
  33. Groh, S.; Olarnrithinum, S.; Curtin, W.A.; Needleman, A.; Deshpande, V.S.; Giessen, E. Fatigue crack growth from a cracked elastic particle into a ductile matrix. Philos. Mag. 2008, 88, 3565–3583. [Google Scholar] [CrossRef] [Green Version]
  34. Kunkler, B.; Duber, O.; Koster, P.; Krupp, U.; Fritzen, C.P.; Christ, H.J. Modeling of short crack propagation - Transition from stage I to stage II. Eng. Fract. Mech. 2008, 75, 715–725. [Google Scholar] [CrossRef]
  35. Ohr, S.M.; Narayan, J. Electron Microscope Observation of Shear Cracks in Stainless Steel Single Crystals. Philos. Mag. 1980, 41, 81–89. [Google Scholar] [CrossRef]
  36. Horton, J.A.; Ohr, S.M. Determination of emission condition from the experiments and theory. Scr. Metall. 1982, 16, 621–626. [Google Scholar] [CrossRef]
  37. Horton, J.A.; Ohr, S.M. TEM observations of dislocation emission at crack tip in aluminum. J. Mater. Sci. 1982, 17, 3140–3148. [Google Scholar] [CrossRef]
  38. Ohr, S.M. An electron microscope study of crack tip deformation and its impact on the dislocation theory of fracture. Mater. Sci. Eng. 1985, 72, 1–35. [Google Scholar] [CrossRef]
  39. Majumdar, B.; Burns, S.A. Crack tip shielding-anelastic theory of dislocation and dislo- cation arrays near a sharp crack. Acta Metall. 1981, 29, 579–588. [Google Scholar] [CrossRef]
  40. Majumdar, B.; Burns, S.A. A Griffith crack shielded by a dislocation pile-up. Int. J. Fract. Mech. 1983, 21, 229–240. [Google Scholar] [CrossRef]
  41. Dai, S.H.; Li, J.C.M. Dislocation free zone at the crack tip. Scr. Metall. 1982, 16, 183–188. [Google Scholar] [CrossRef]
  42. Thomson, R. Physics of fracture. J. Phys. Chem. Solids 1987, 48, 965–983. [Google Scholar] [CrossRef]
  43. Sadananda, K.; Glinka, G. Dislocation processes that affect kinetics of fatigue crack growth. Philos. Mag. 2005, 85, 189–203. [Google Scholar] [CrossRef]
  44. Bilby, B.; Cottrell, A.; Swinden, K. The spread of plastic yield from a notch. Proc. Roy. Soc. A 1963, 272, 304–314. [Google Scholar]
  45. Lin, I.H.; Thomson, R. Cleavage, dislocation emission, and shielding for cracks under general loading. Acta Metall. 1986, 34, 187–206. [Google Scholar] [CrossRef]
  46. Weertman, J. Fracture mechanics-unified view for Griffith-Irwin-Orowan cracks. Acta Metall. 1978, 26, 1731–1738. [Google Scholar] [CrossRef]
  47. Weertman, J. Fracture stress obtained from the elastic crack tip enclave model. J. Mater. Sci. 1980, 15, 1306–1310. [Google Scholar] [CrossRef]
  48. Weertman, J.; Lin, I.H.; Thomson, R. Double slip plane crack model. Acta Metall. 1983, 31, 473–482. [Google Scholar] [CrossRef]
  49. Weertman, J. Dislocation emission into a mode III plastic zone. Scr. Metall. 1986, 20, 1483–1488. [Google Scholar] [CrossRef]
  50. Masumura, R.A.; Pande, C.S.; Chou, Y.T. Model for interaction of dislocation arrays with a crack. Int. J. Fatigue 2005, 27, 1170–1174. [Google Scholar] [CrossRef]
  51. Pande, C.S.; Masumura, R.A.; Chou, Y.T. Shielding of crack tips by inclined pile-ups of dislocations. Acta Metall. 1988, 36, 49–54. [Google Scholar] [CrossRef]
  52. Muskhelishvili, N. Singular Integral Equations; P. Noordhoof Ltd.: Groningen, The Netherlands, 1953. [Google Scholar]
  53. Zhang, T.Y.; Tong, P.; Ouyang, H.; Lee, S. Interaction of an edge dislocation with a wedge crack. J. Appl. Phys. 1995, 78, 4873–4880. [Google Scholar] [CrossRef]
  54. Pande, C.S.; Masumura, R.A.; Chou, Y.T. Shielding of crack tips by critical parameters for fatigue damage. Int. J. Fatigue 2001, 23, 1170–1174. [Google Scholar]
  55. Vasudevan, A.K.; Sadananda, K.; Glinka, G. Critical parameters for fatigue damage. Int. J. Fatigue 2001, 23, S39–S53. [Google Scholar] [CrossRef]
  56. Rice, J.R.; Thomson, R. Ductile versus brittle behavior of crystals. Philos. Mag. 1974, 29, 73–97. [Google Scholar] [CrossRef]
  57. Goswami, R.; Qadri, S.B.; Pande, C.S. Fatigue mediated lattice rotation in Al Alloys. Acta Mater. 2017, 129, 33–40. [Google Scholar] [CrossRef] [Green Version]
  58. Goswami, R.; Feng, C.R.; Qadri, S.B.; Pande, C.S. Fatigue-assisted grain growth in Al alloys. Sci. Rep. 2017, 7, 10179–10186. [Google Scholar] [CrossRef] [PubMed]
  59. Goswami, R.; Qadri, S.B.; Pande, C.S. Residual Stresses and Localized Lattice Rotation Under Fatigue Loading. Mater. Sci. Eng. A 2019, 763, 113–138. [Google Scholar] [CrossRef]
  60. Lam, Y.C.; Lian, K.S. Effect of residual stress and its redistribution on fatigue crack growth. Theor. Appl. Fract. Mech. 1989, 12, 59–66. [Google Scholar] [CrossRef]
  61. LaRue, J.E.; Daniewicz, S.R. The effect of residual stress on fatigue crack growth rate in AISI 304LN stainless steel. Int. J. Fatigue 2007, 29, 508–515. [Google Scholar] [CrossRef]
  62. Reid, C.N. A Method of mapping residual stress in a compact tension specimen. Scr. Metall. 1988, 22, 451–456. [Google Scholar] [CrossRef]
  63. Schindler, H.J. Determination of Residual Stress Distributions from Measured Stress Intensity Factors. Int. J. Fract. 1995, 74, R23–R30. [Google Scholar] [CrossRef]
  64. Schindler, H.J.; Cheng, W.; Finnie, I. Experimental determination of stress intensity factors due to residual stresses. Exp. Mech. 1997, 37, 272–277. [Google Scholar] [CrossRef] [Green Version]
  65. Mughrabi, H. Revisiting Steady-State Monotonic and Cyclic Deformation: Emphasizing the Quasi-Stationary State of Deformation. Metall. Mater. Trans. A 2020, 51A, 1441–1456. [Google Scholar] [CrossRef] [Green Version]
  66. Pippan, R.; Riemelmoser, F.O. Modeling of Fatigue Crack Growth: Dislocation Models. Compr. Struct. Integr. 2003, 191–207. [Google Scholar] [CrossRef]
  67. Bhat, S.; Patibandla, R. Metal Fatigue and Basic Theoretical Models: A Review, Alloy Steel-Properties and Use; Morales, E.V., Ed.; InTech: Lagos, Nigeria, 2011. [Google Scholar]
  68. Olarnrithinun, S. A Short Review of 2D-Discrete Dislocation Modeling for Fracture/Fatigue. AIJSTPME 2013, 6, 45–57. [Google Scholar]
  69. Horstemeyer, M.F.; Farkas, D.; Kim, S.; Tang, T.; Potirniche, G. Nanostructurally small cracks (NSC): A review on atomistic modeling of fatigue. Int. J. Fatigue 2010, 32, 1473–1502. [Google Scholar] [CrossRef]
Figure 1. (a,b) A bright-field transmission electron microscopy (TEM) image close to the [111] zone in Cu showing curved dislocations ahead of a sharp crack.
Metals 10 00473 g001
Figure 2. (a) A TEM image showing dislocations ahead of a sharp crack and a dislocation free zone (DFZ). (be) Dislocations configurations at different tilt angles of 10, 20, 30 and 45 ° , respectively.
Metals 10 00473 g002
Figure 3. (a,b) Two beam bright field images showing dislocations with g = 1 ¯ 1 1 ¯ and g = 1 1 ¯ 1 ¯ , respectively.
Metals 10 00473 g003
Figure 4. A schematic diagram showing the slit crack and the dislocation distribution.
Metals 10 00473 g004
Figure 5. The diagram showing the dislocation distribution for θ = 70.54 ° in front of a slit crack.
Metals 10 00473 g005
Figure 6. The diagram showing the equilibrium positions as a function of number of dislocations for θ = 70.54 ° and τ i * = 0.1 .
Metals 10 00473 g006
Figure 7. K D as a function of number of dislocations. Note that the increase of K * reduces the effect of shielding. The decrease of the friction stress lowers the K D .
Metals 10 00473 g007
Figure 8. The diagram showing the first and last equilibrium positions as a function of the number of dislocations for θ = 70.54 and τ i * = 0.1 .
Metals 10 00473 g008
Figure 9. The diagram showing initial, final and equilibrium positions of dislocations.
Metals 10 00473 g009
Figure 10. (a) X-ray diffraction (XRD) patterns as a function of distance from the crack showing the relative variations of intensity of 111 and 200 peaks. (b) The integrated intensity ratio of 111 to 200 as a function of position from crack for Al 1100 and Al 7075. The y-axis values for Al 7075 are shown on the right side.
Metals 10 00473 g010
Figure 11. The estimated residual stress as a function of position from crack.
Metals 10 00473 g011

