Induction Weld Seam Characterization of Continuously Roll Formed TRIP690 Tubes


Abstract
1. Introduction
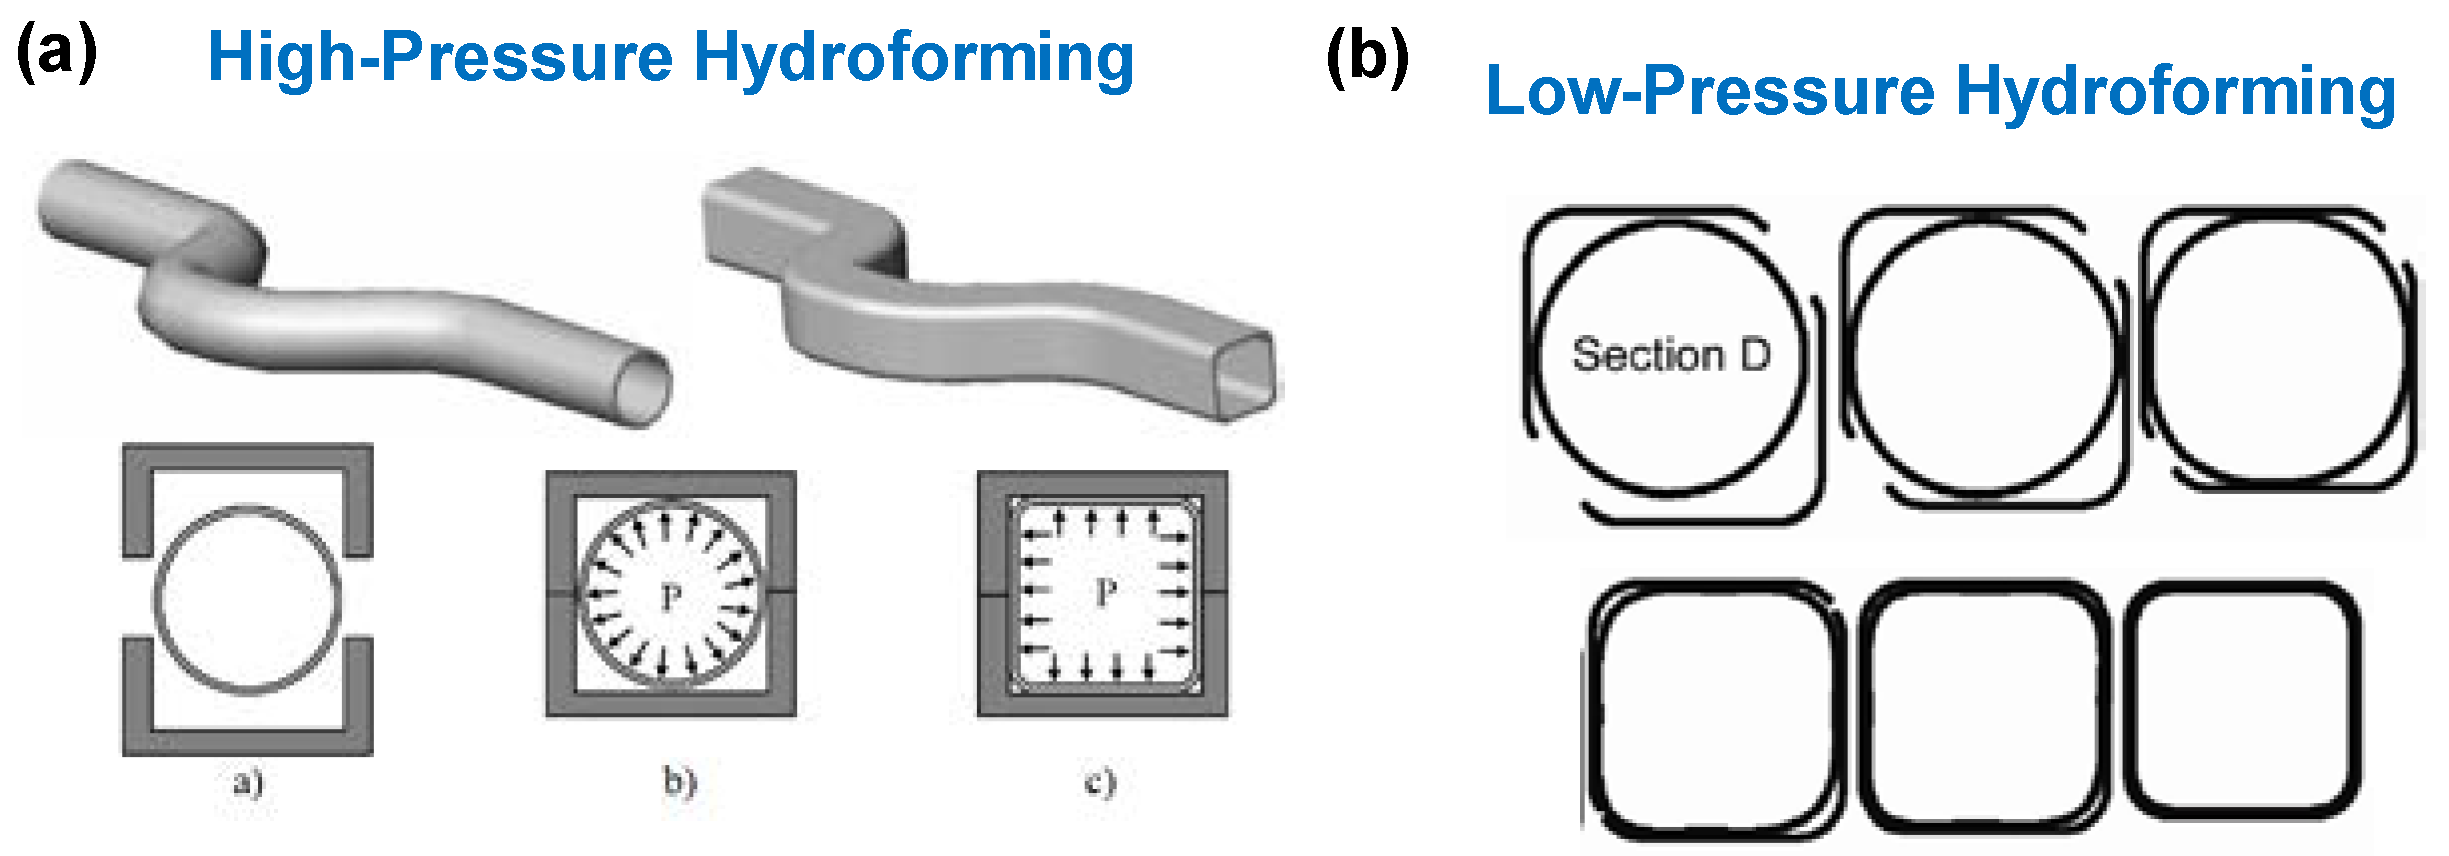
1.1. Hydroforming
1.2. Tubular Roll Forming
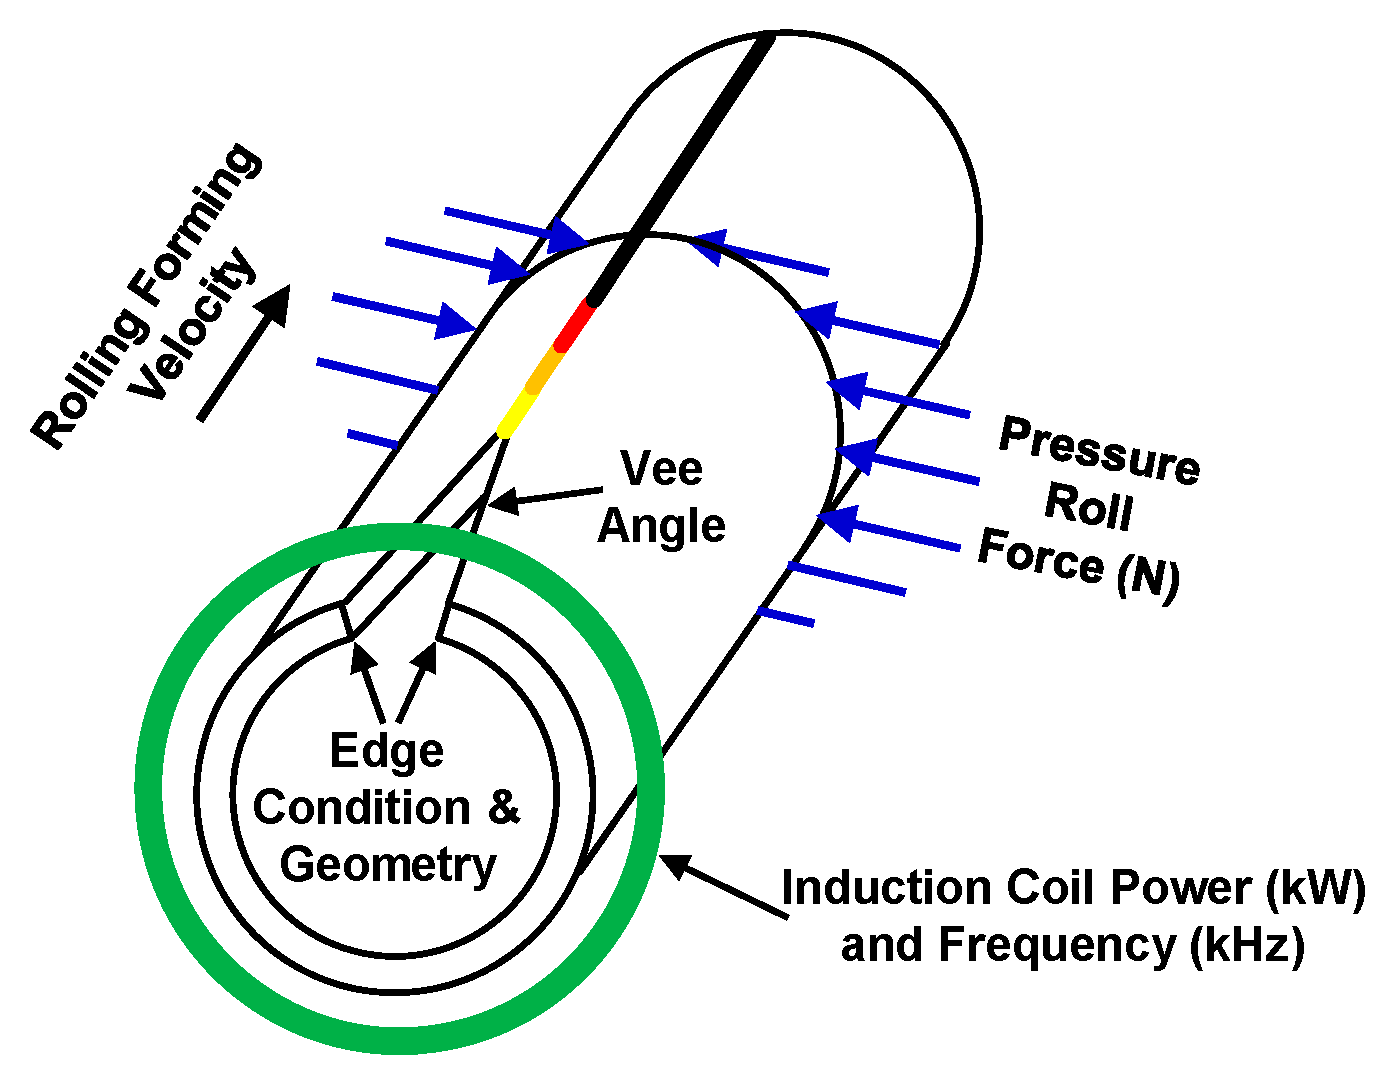
1.3. Induction Seam Welding in Roll Forming
1.4. Welding of TRIP Steels
2. Materials and Methods
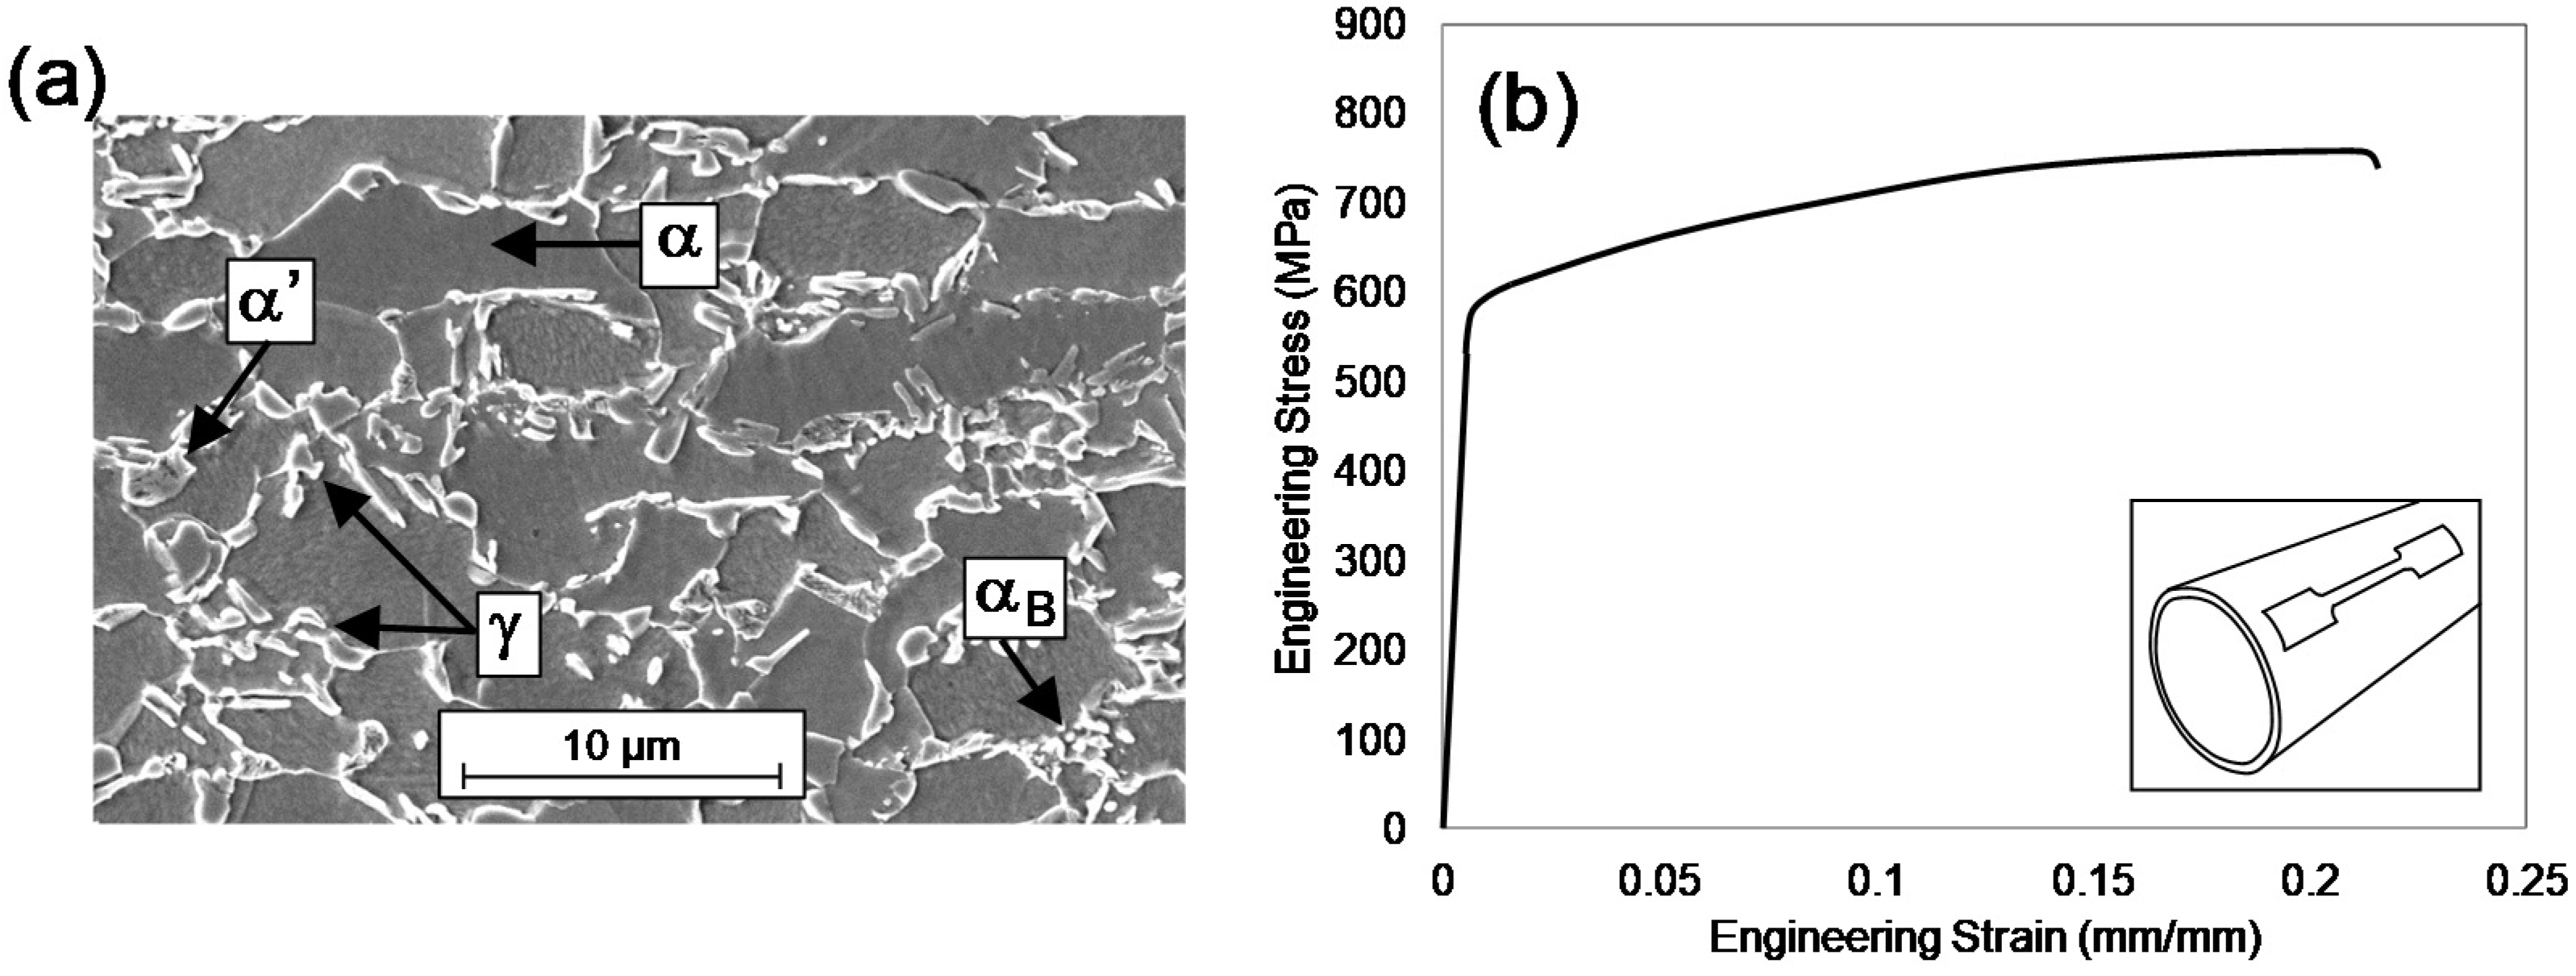
2.1. TRIP690 Material Properties
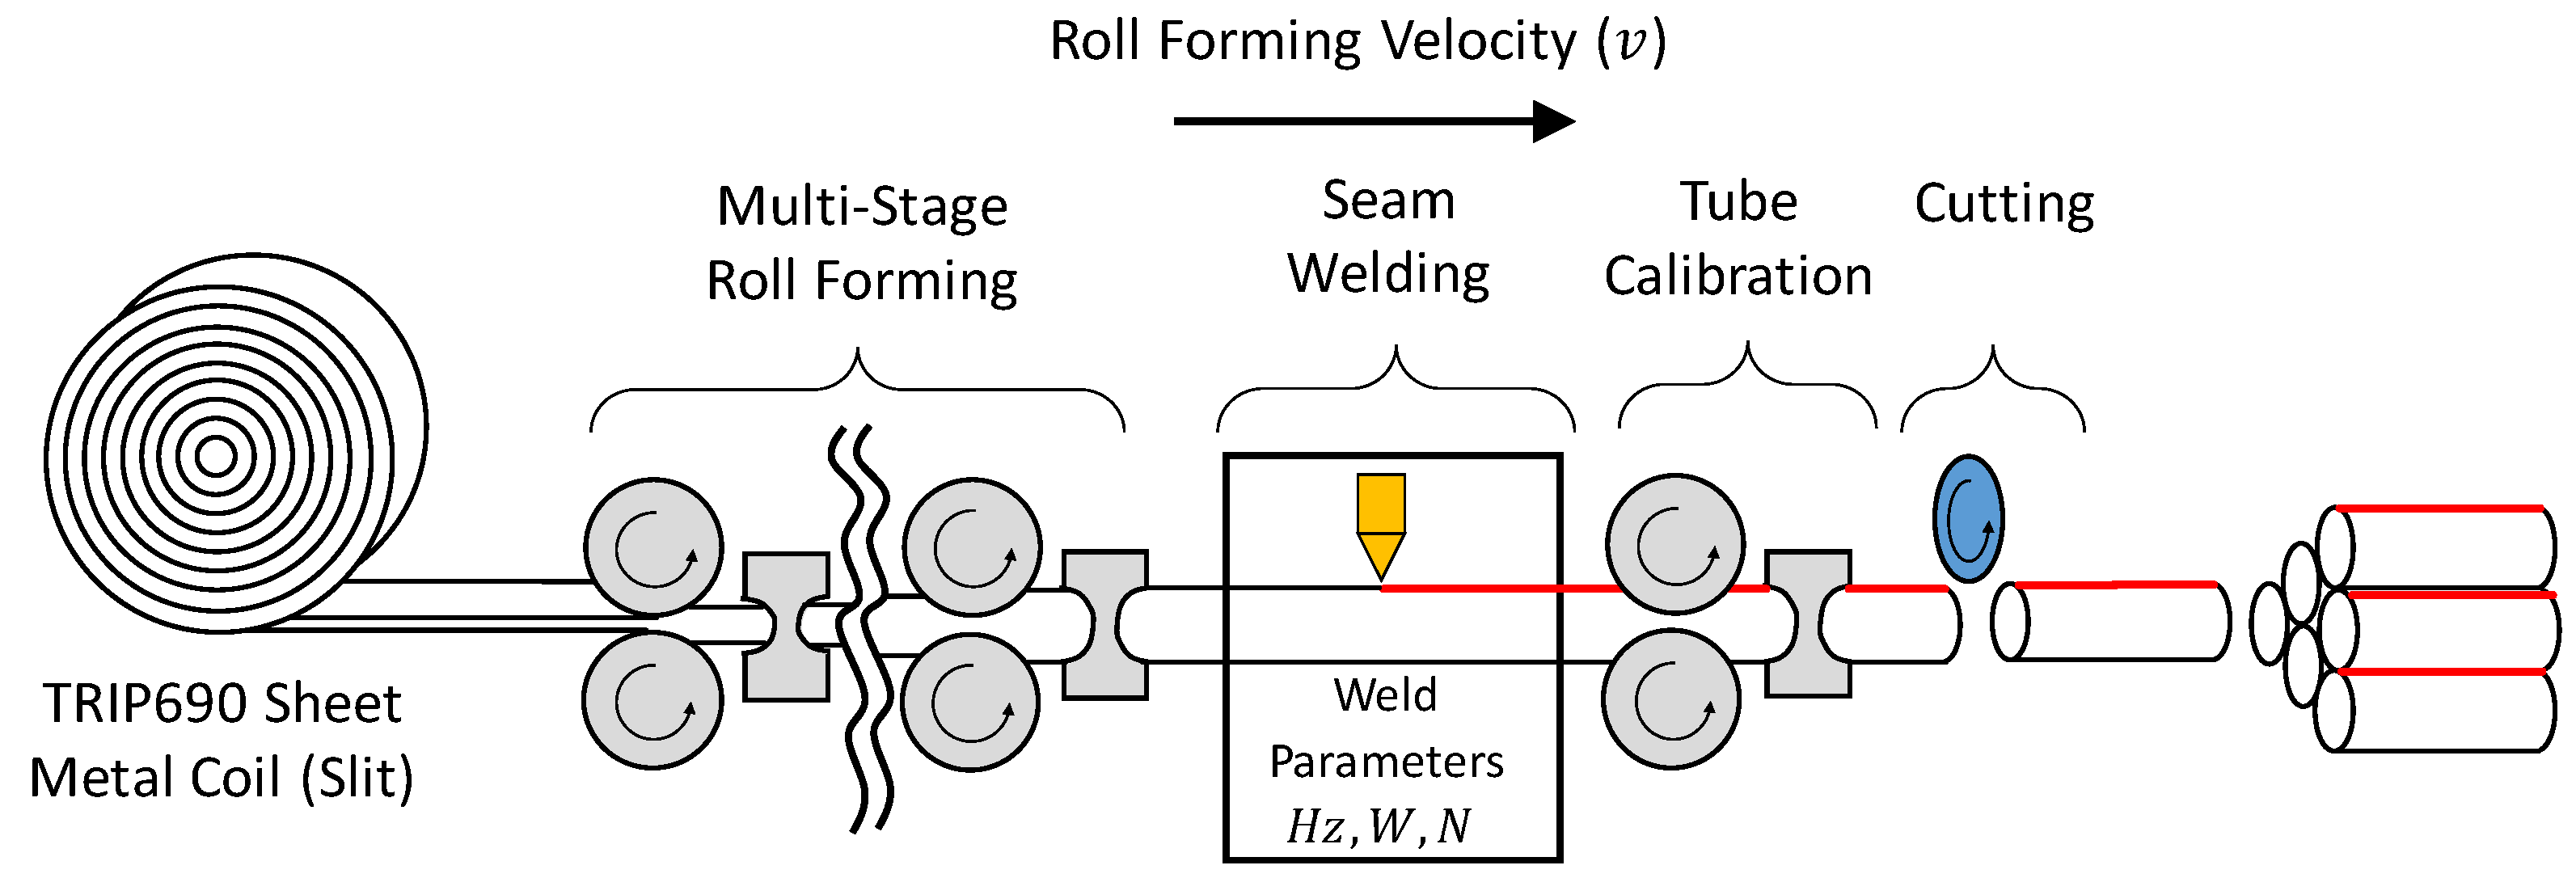
2.2. Tubular Roll Forming Parameters
2.3. Specimen Preparation
2.4. Microhardness Testing
2.5. Scanning Electron Microscopy
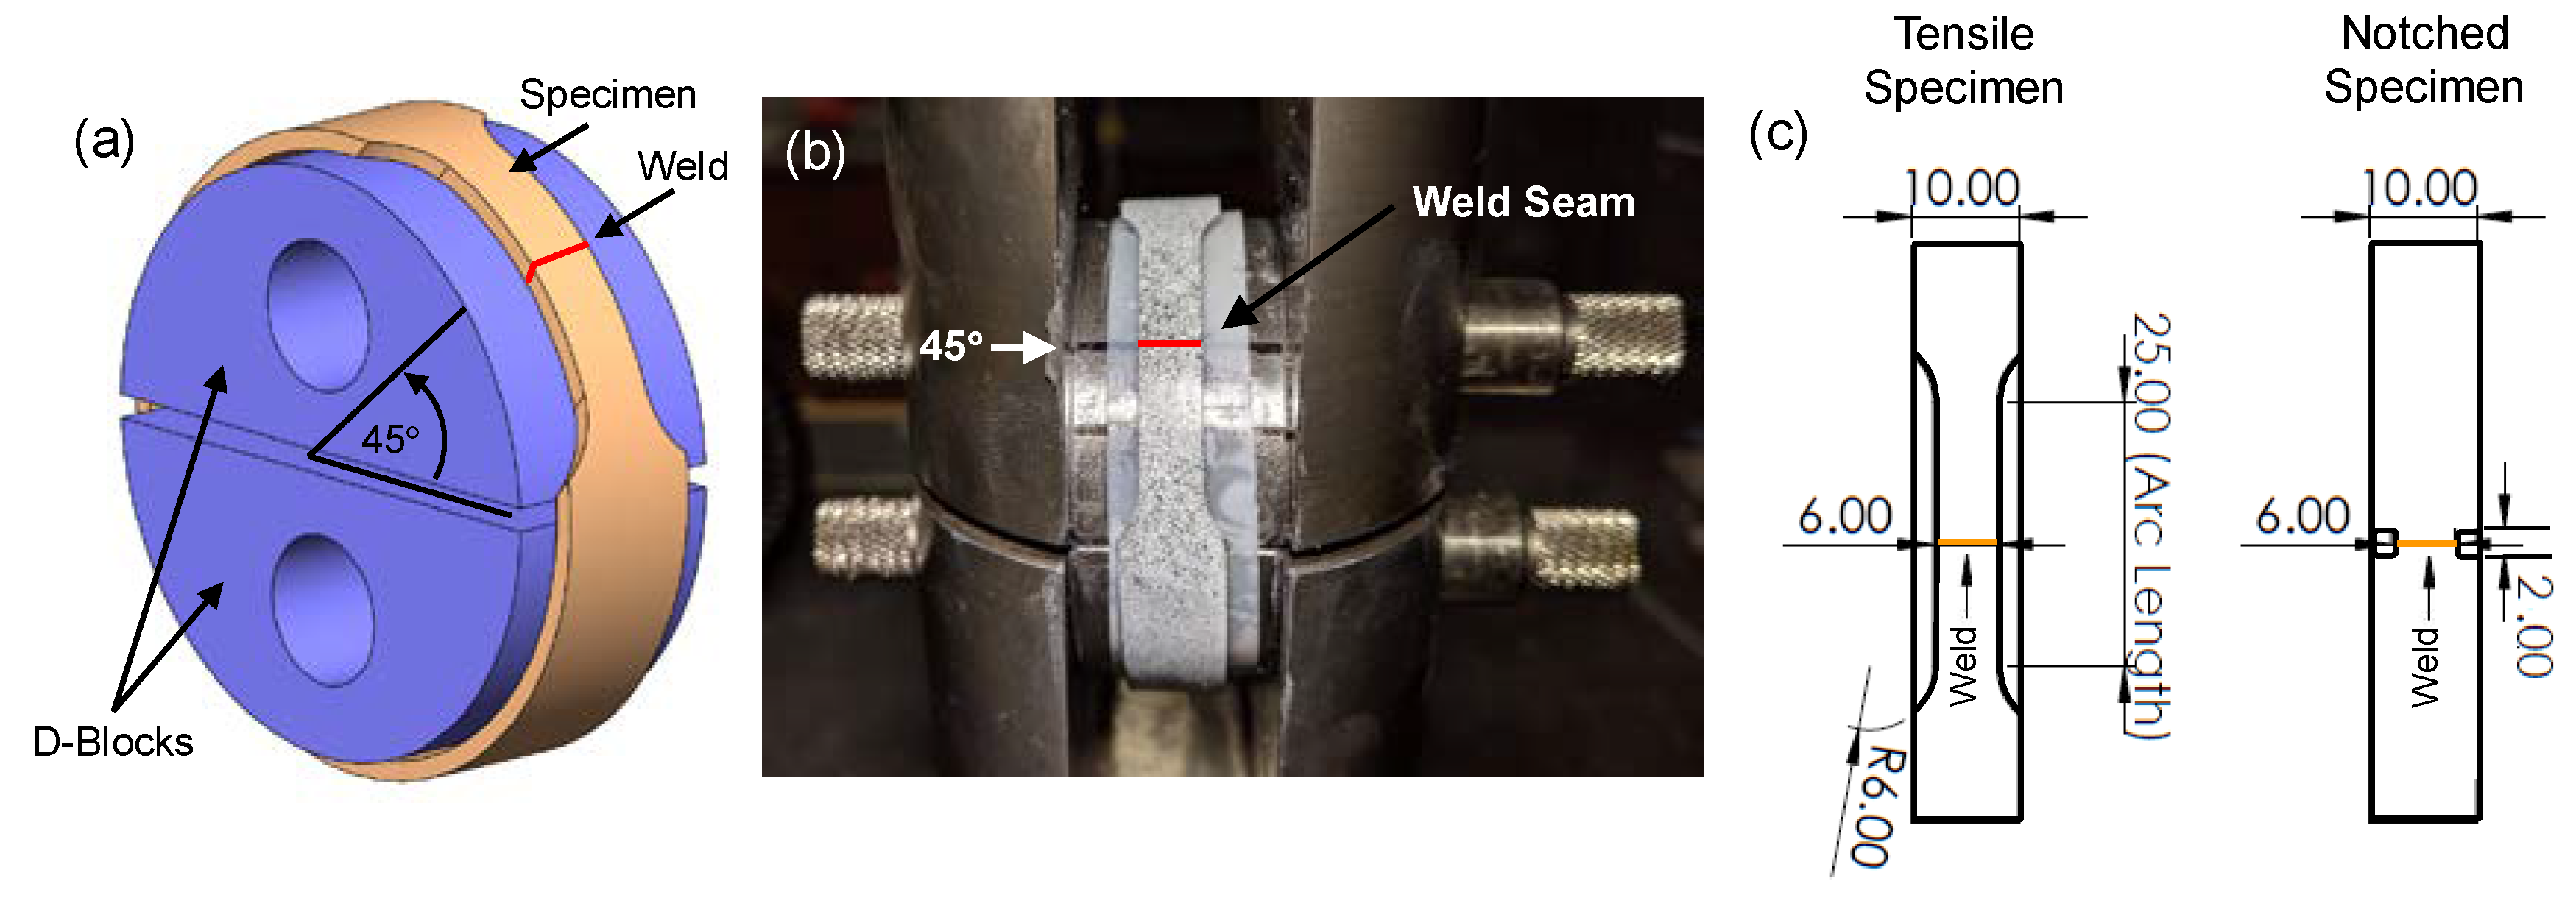
2.6. Ring Hoop Tension Test (RHTT)
3. Results and Discussion
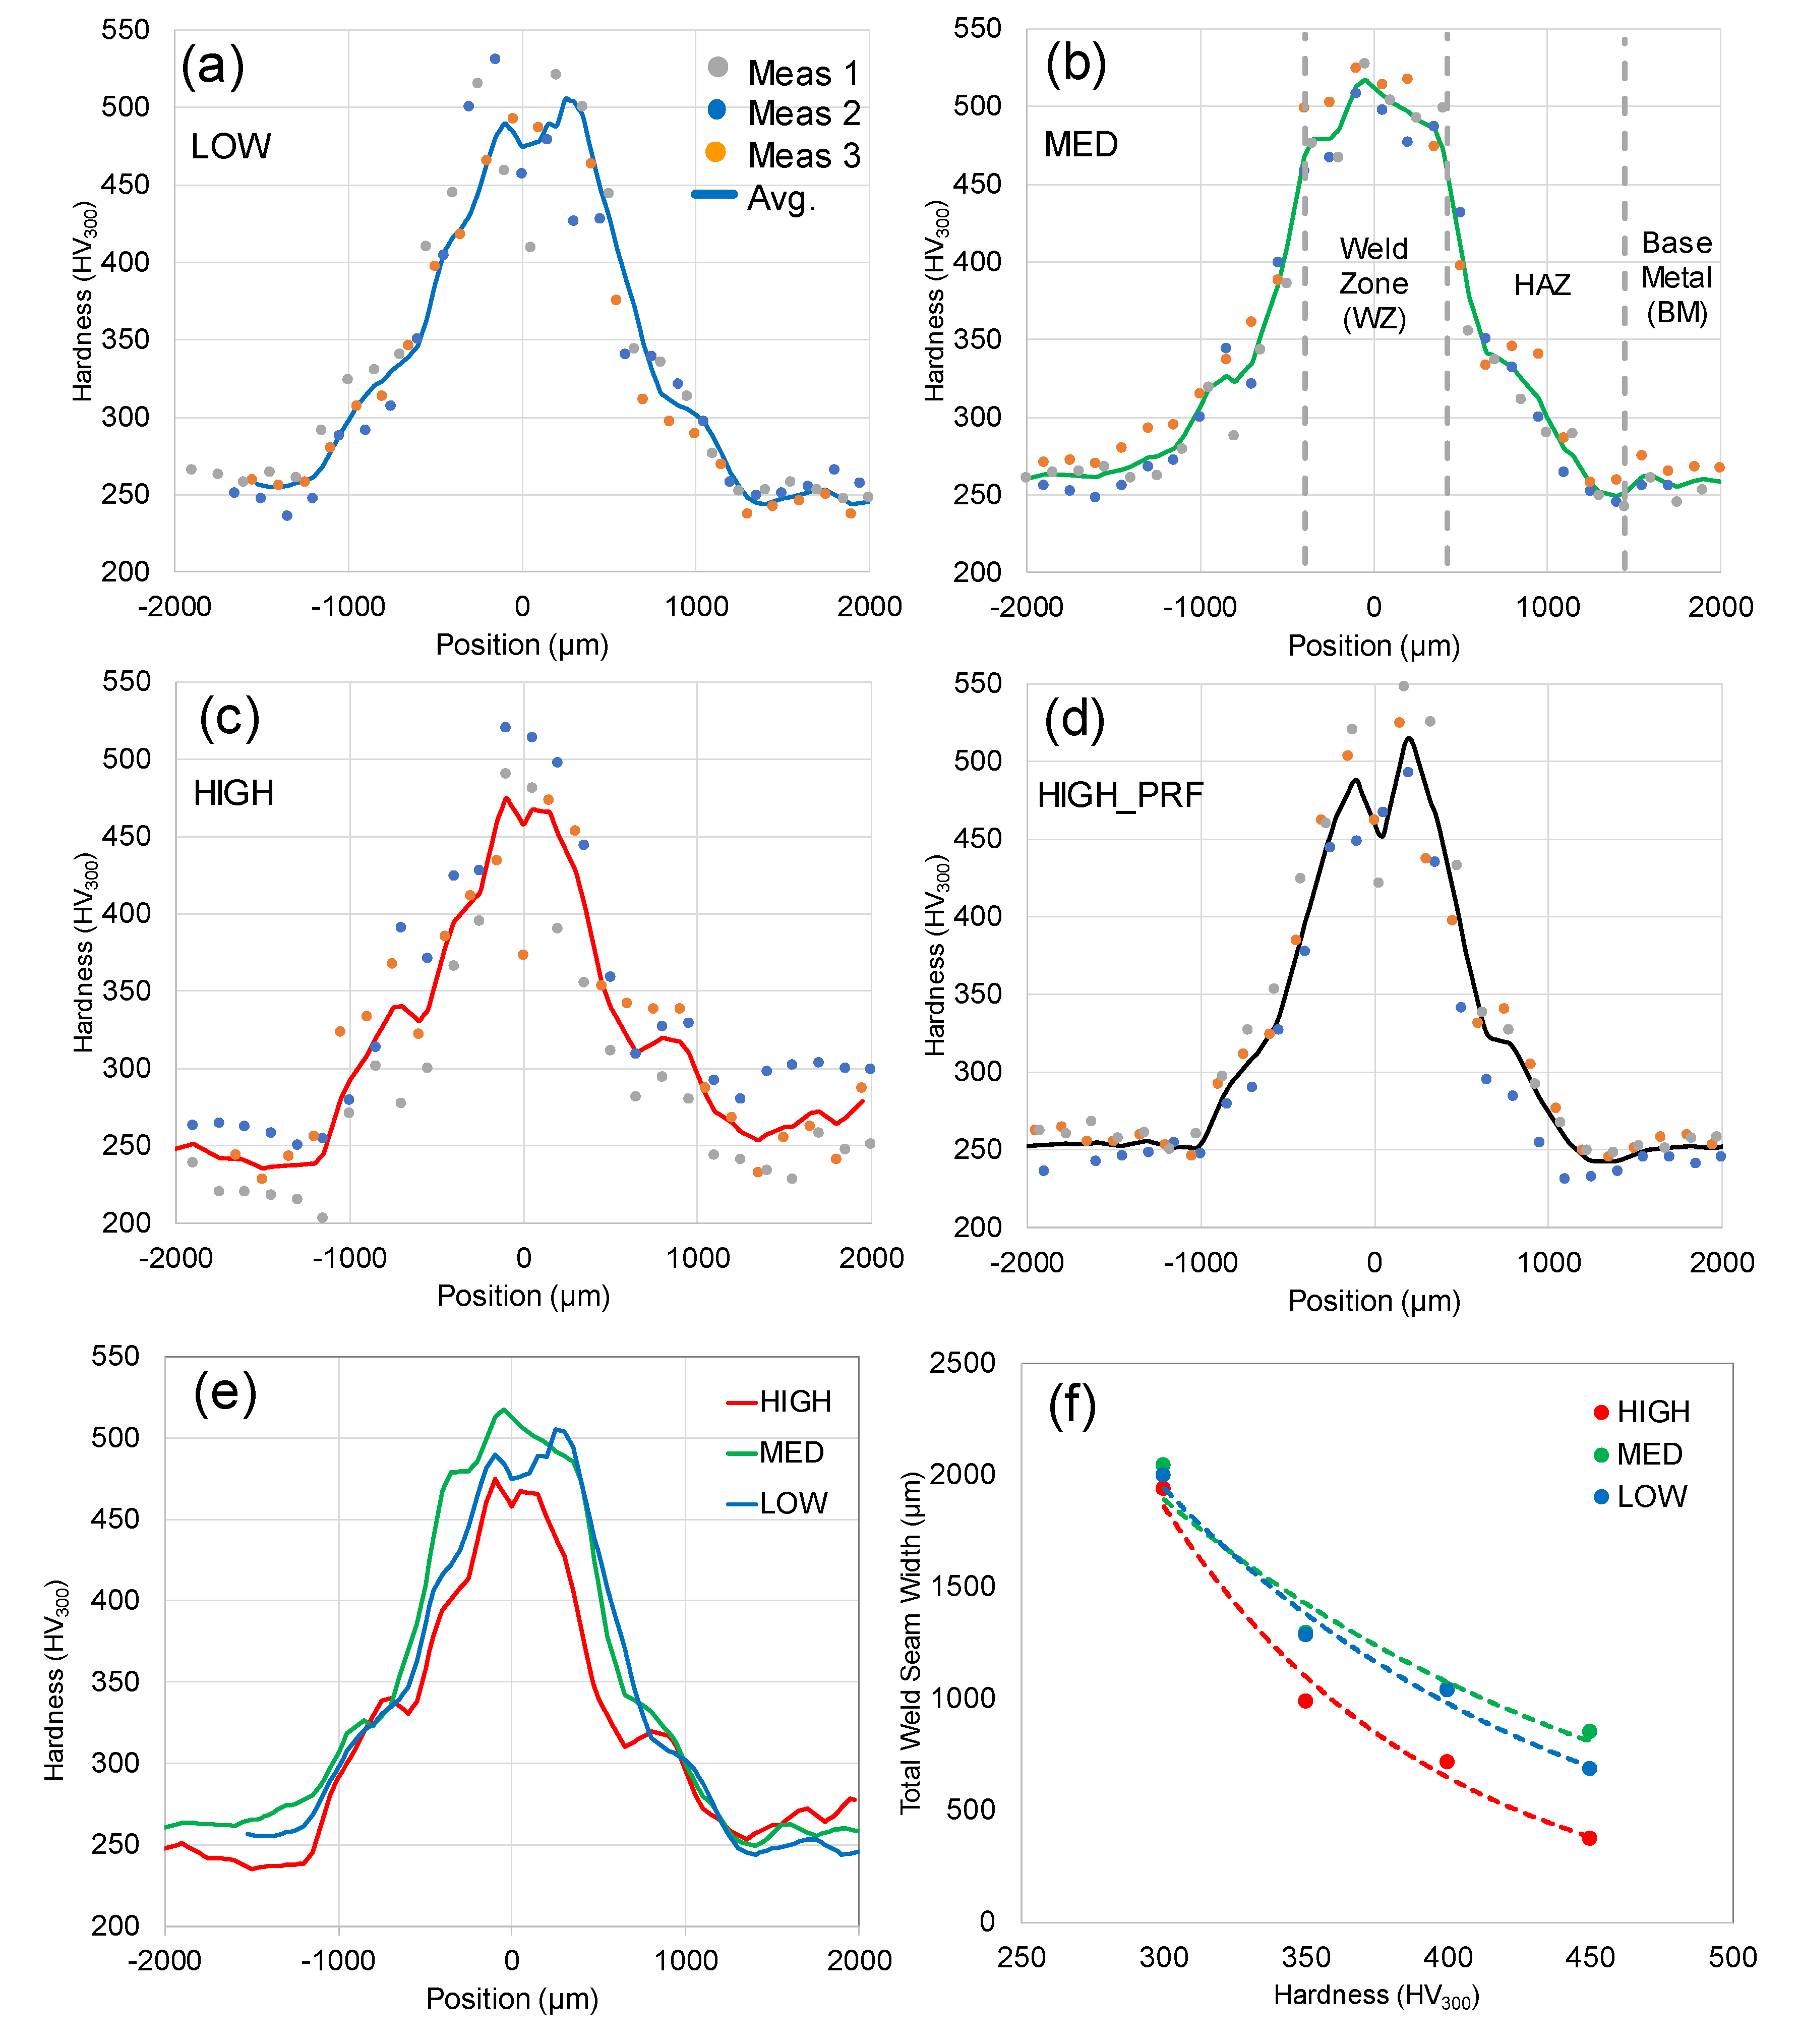
3.1. Centerline Hardness Distributions
3.1.1. Effect of Weld Frequency on Centerline Hardness Distribution
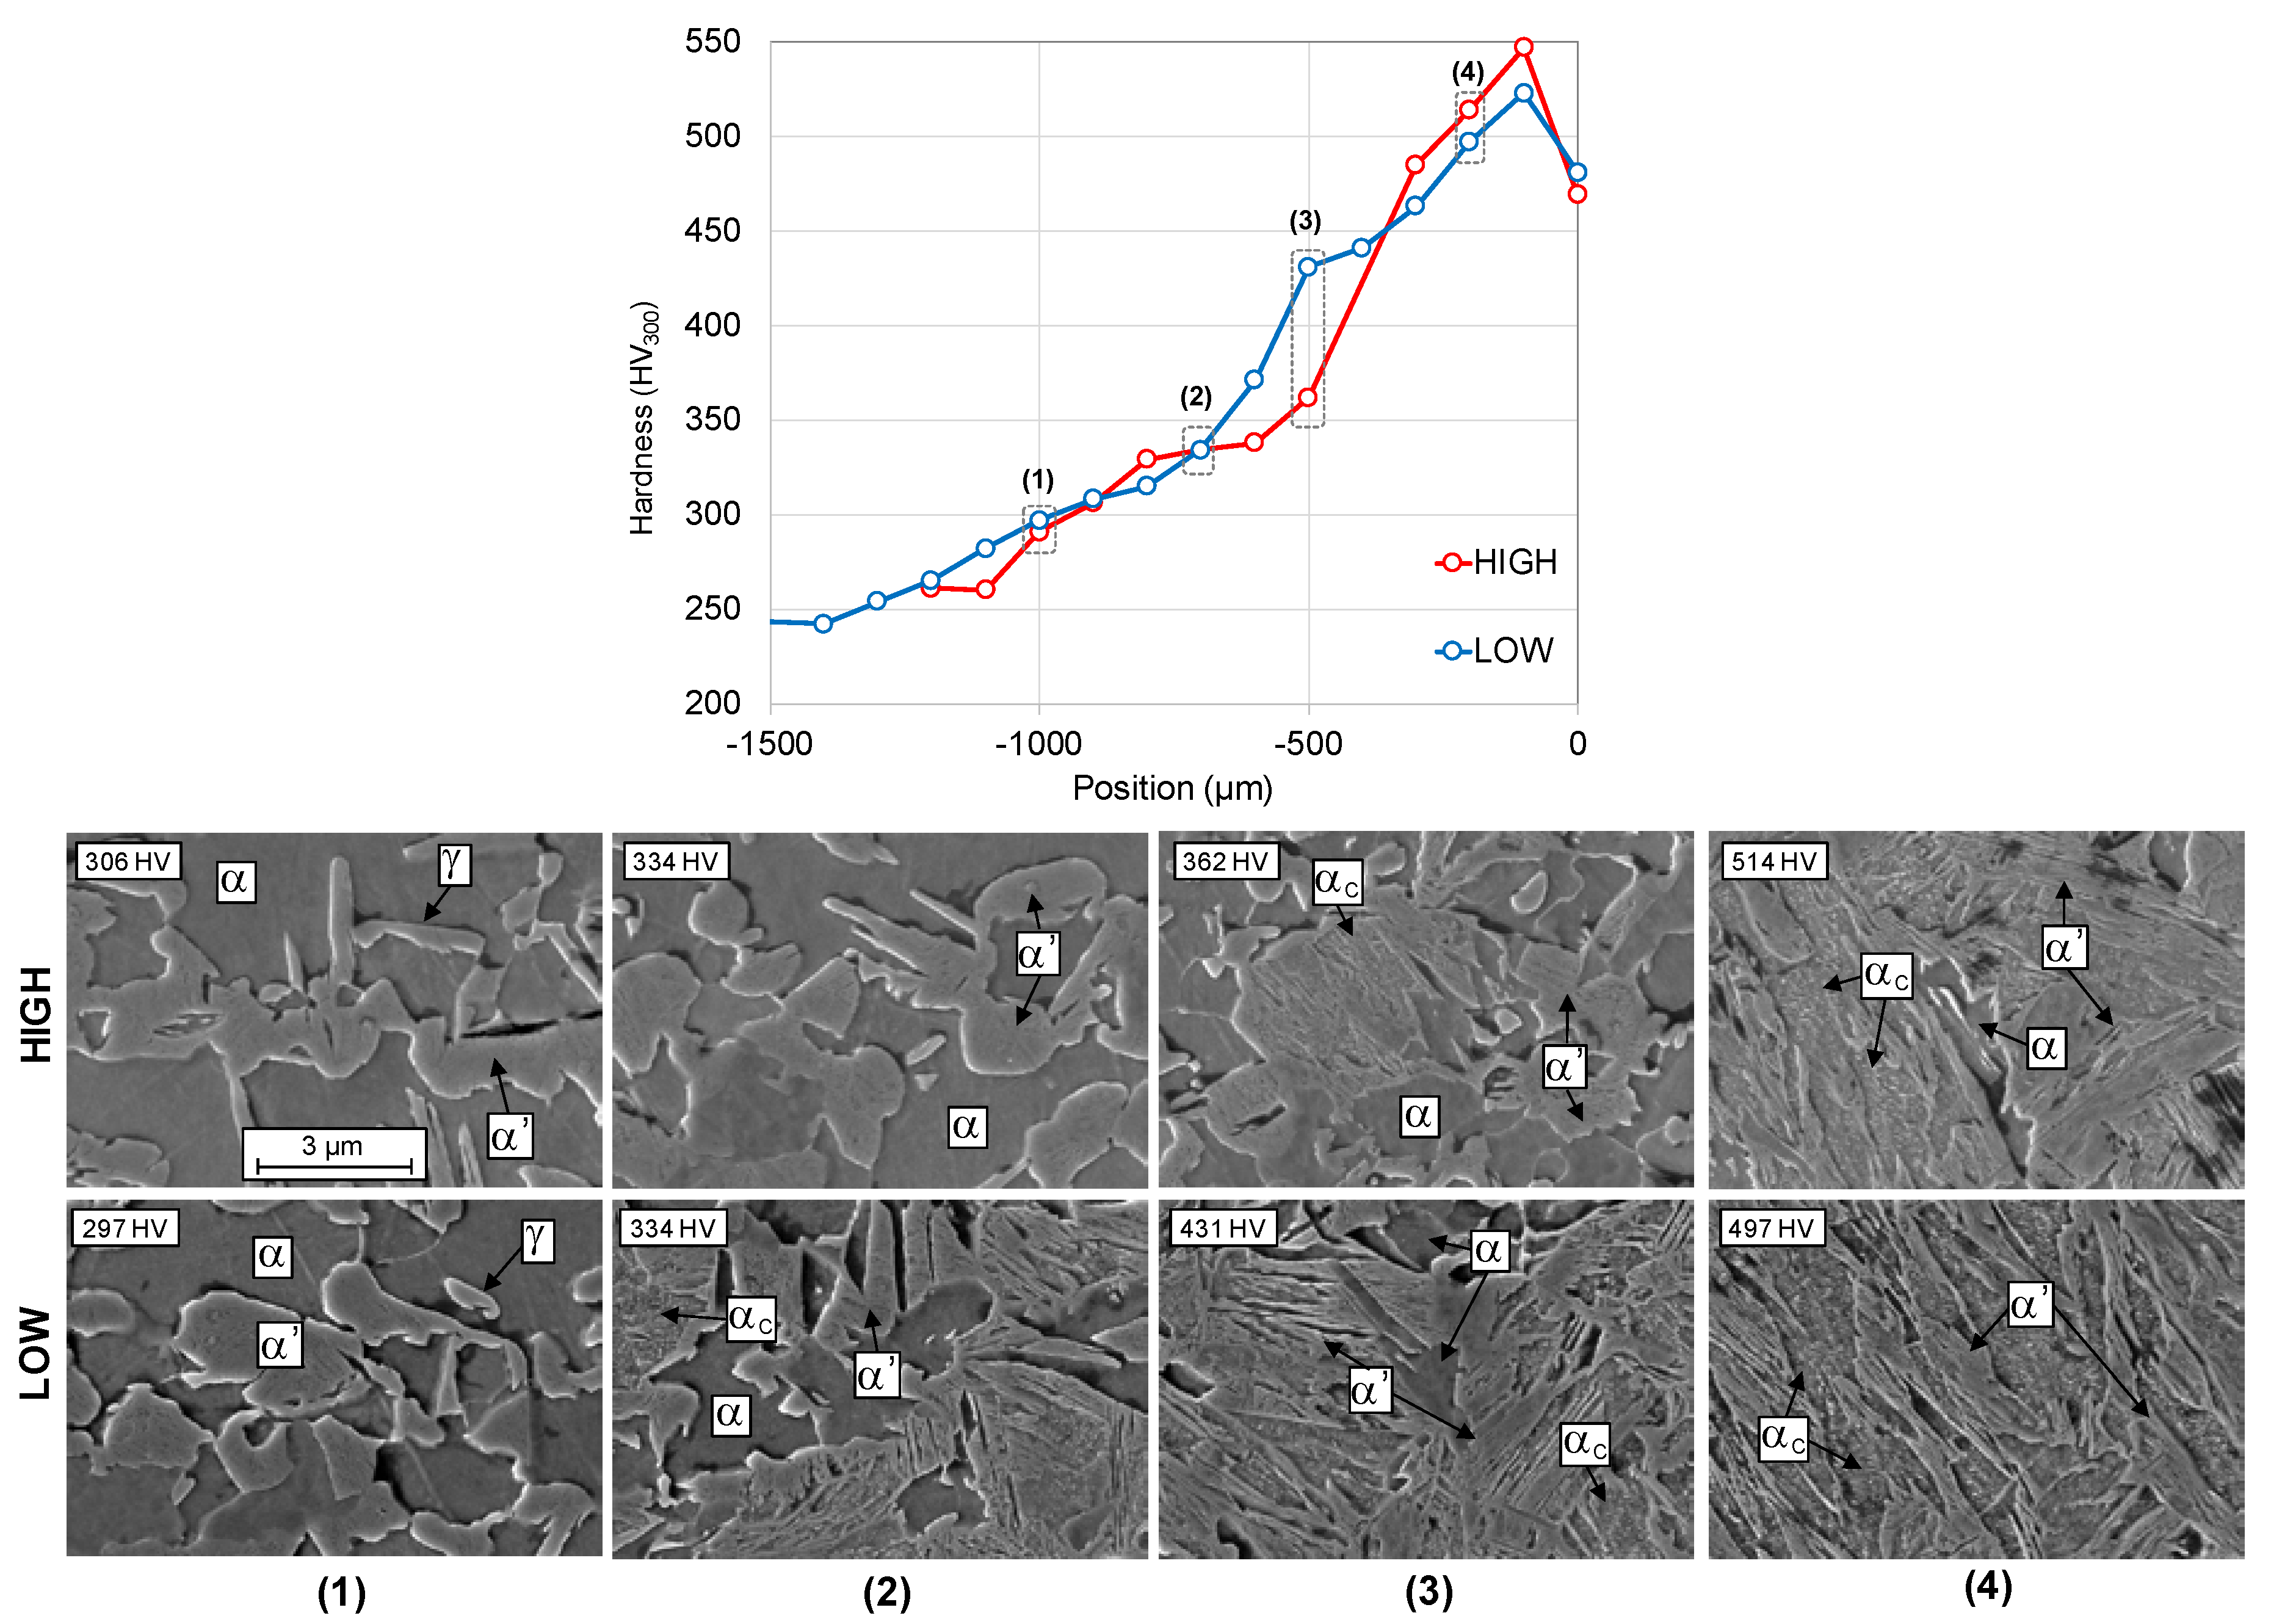
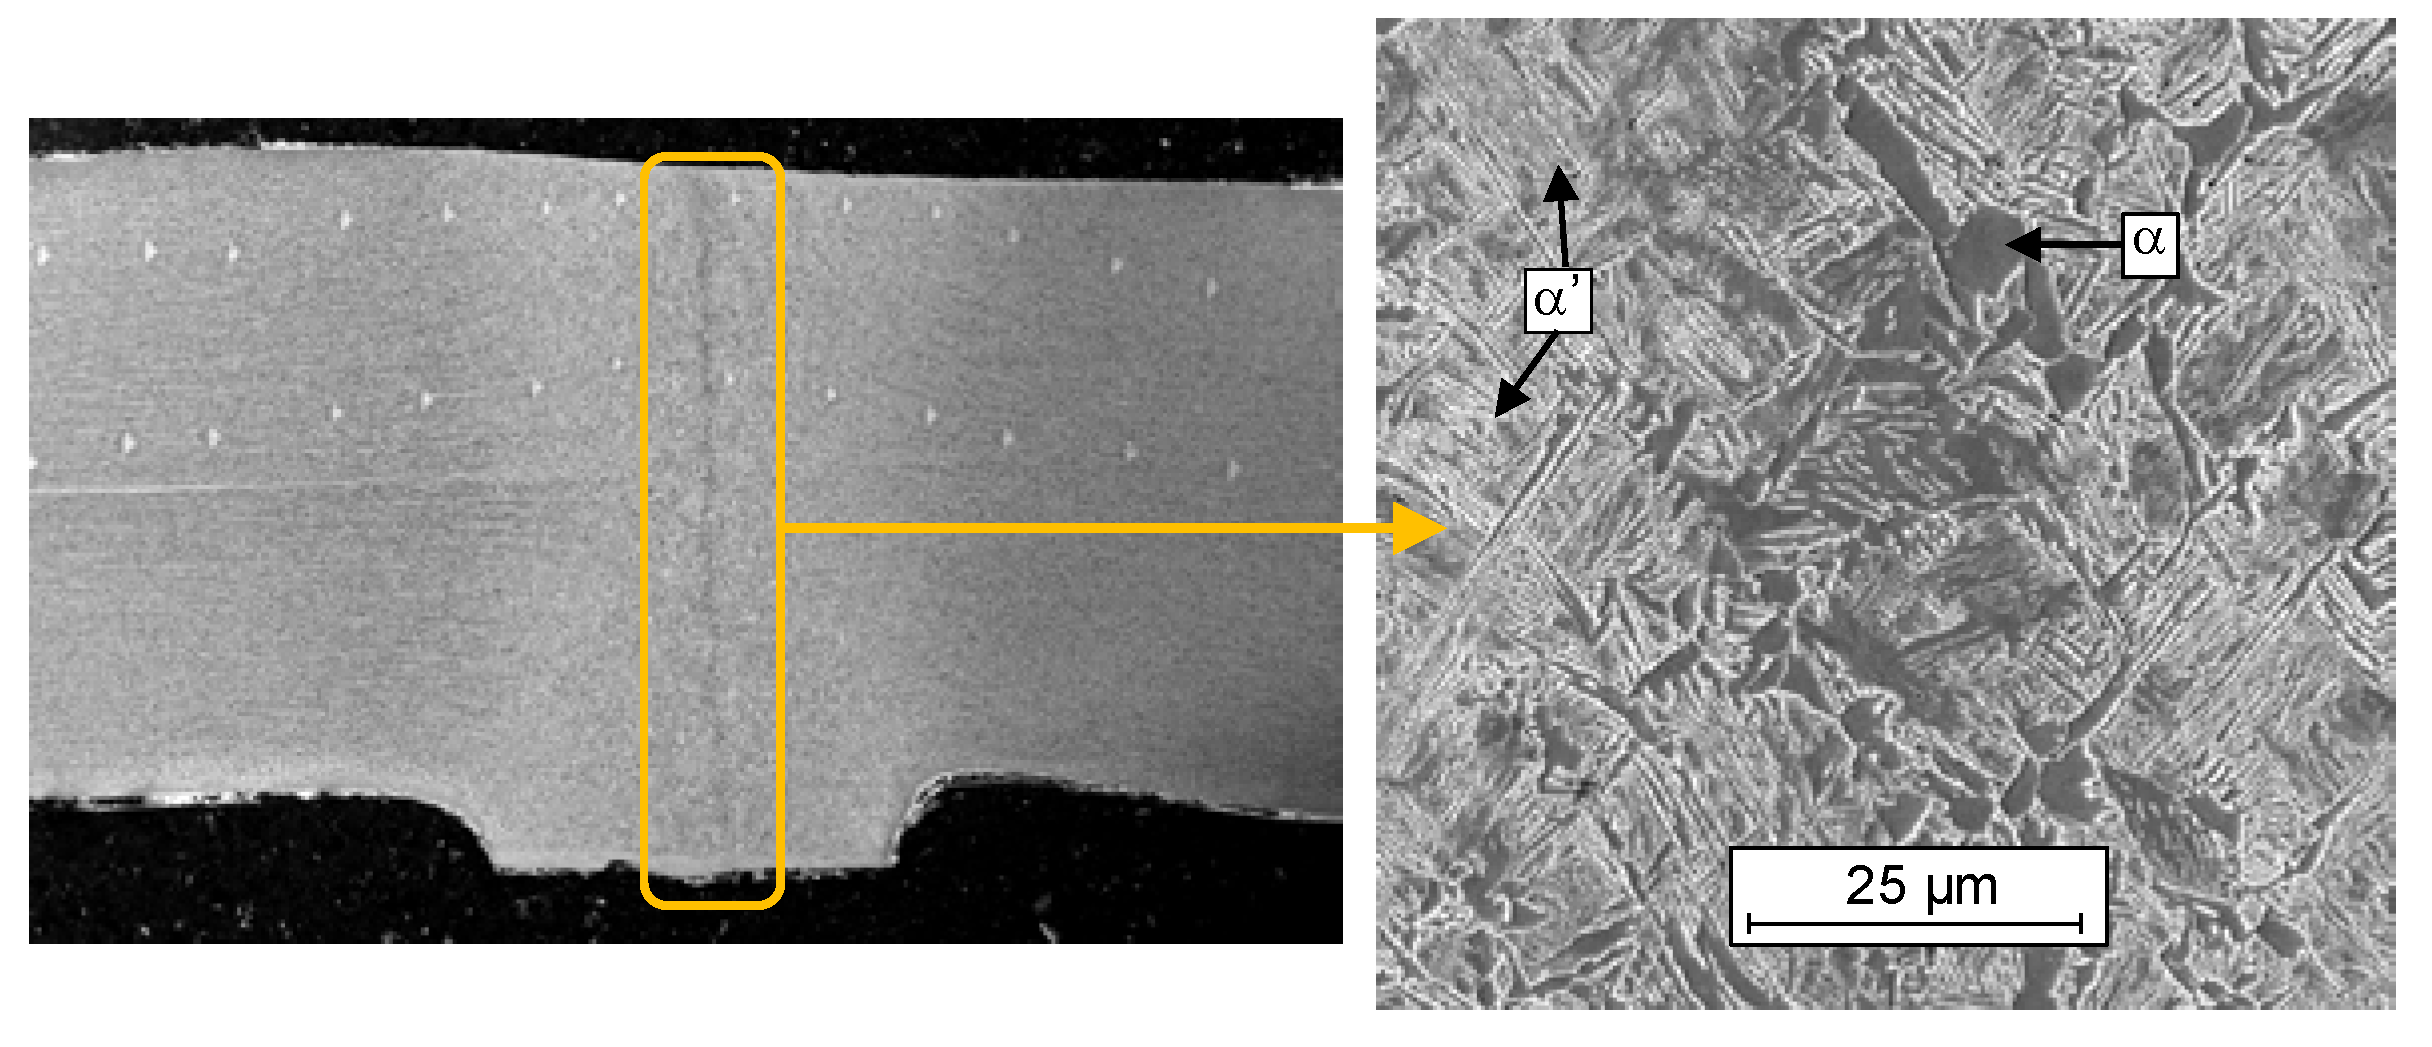
3.1.2. Microstructural Analysis of the Weld Seam
3.1.3. Weld Zone Ferrite-Martensite Band
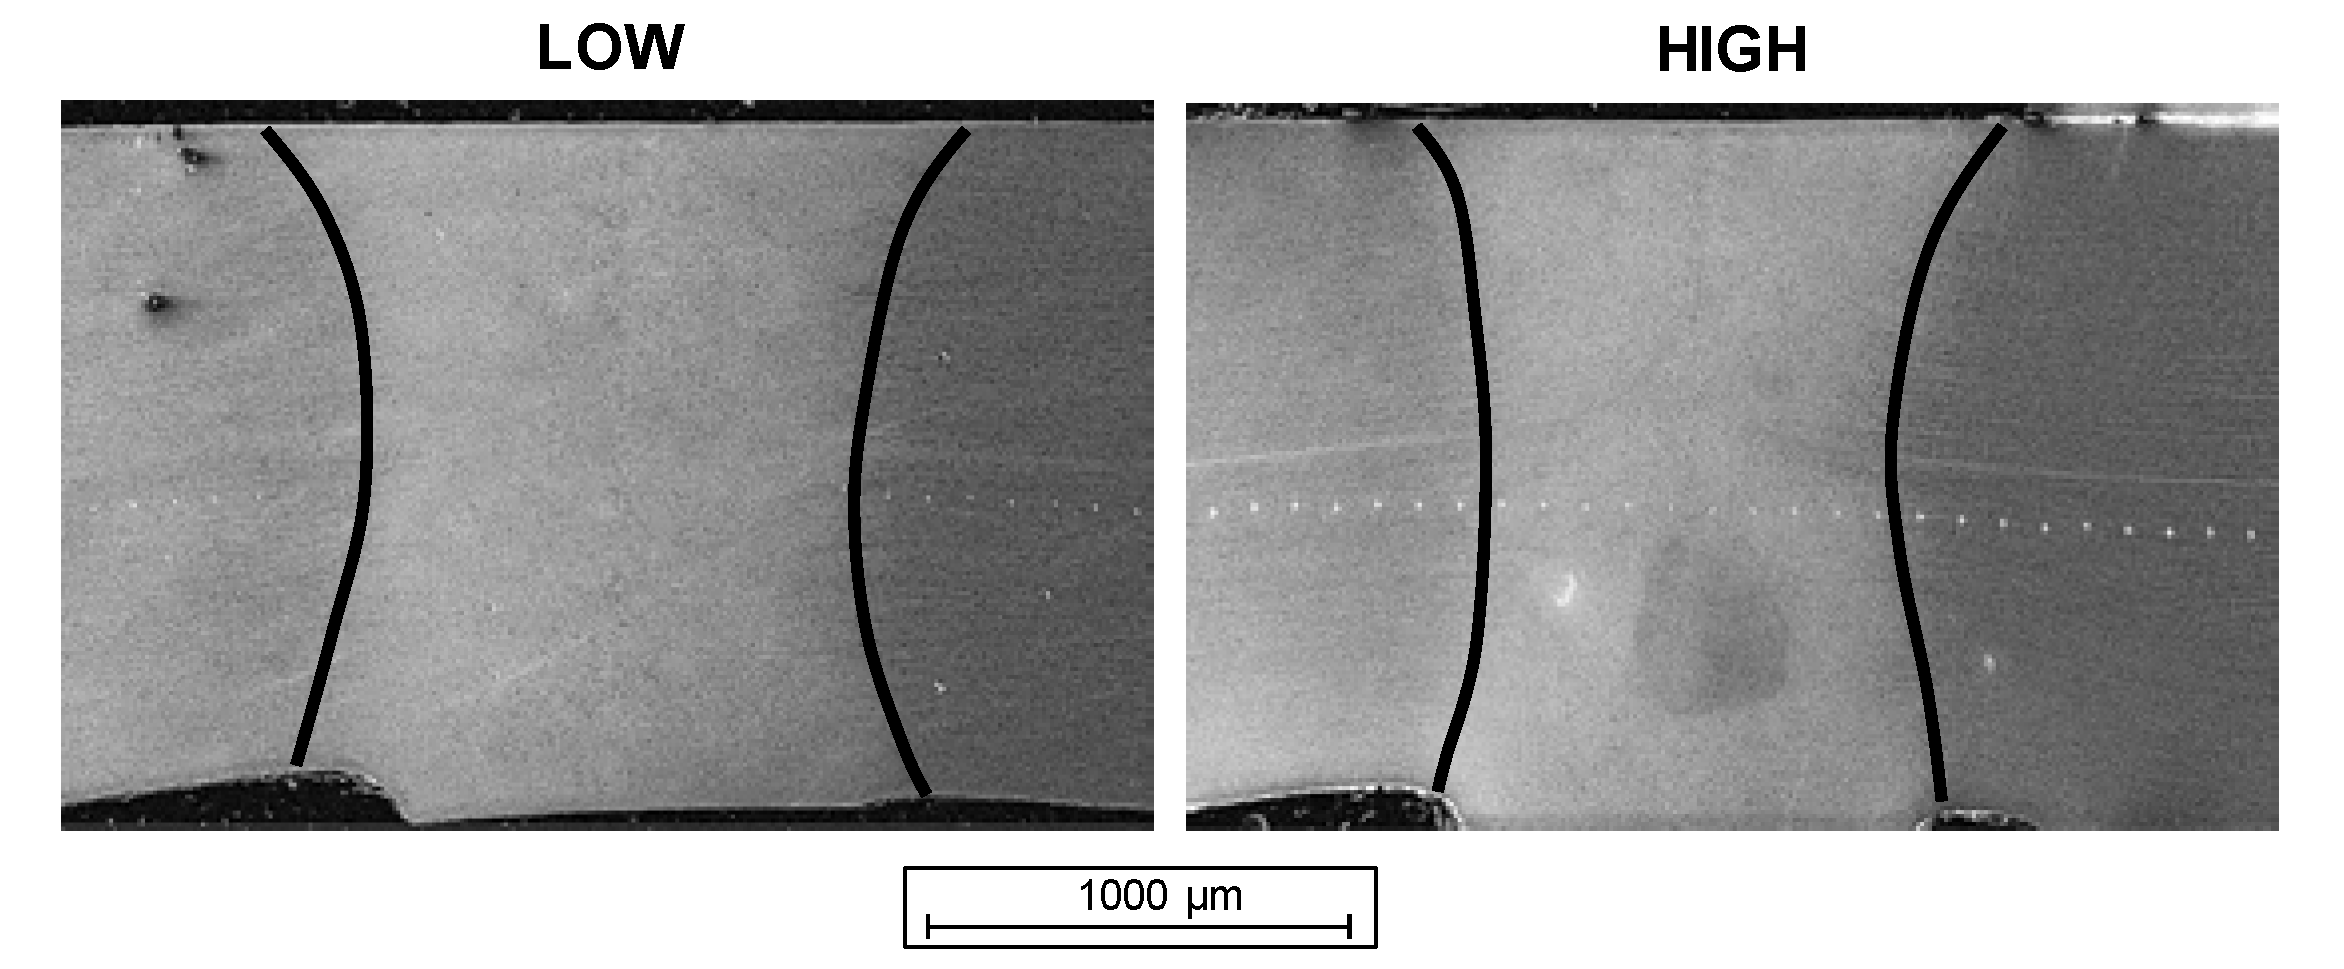
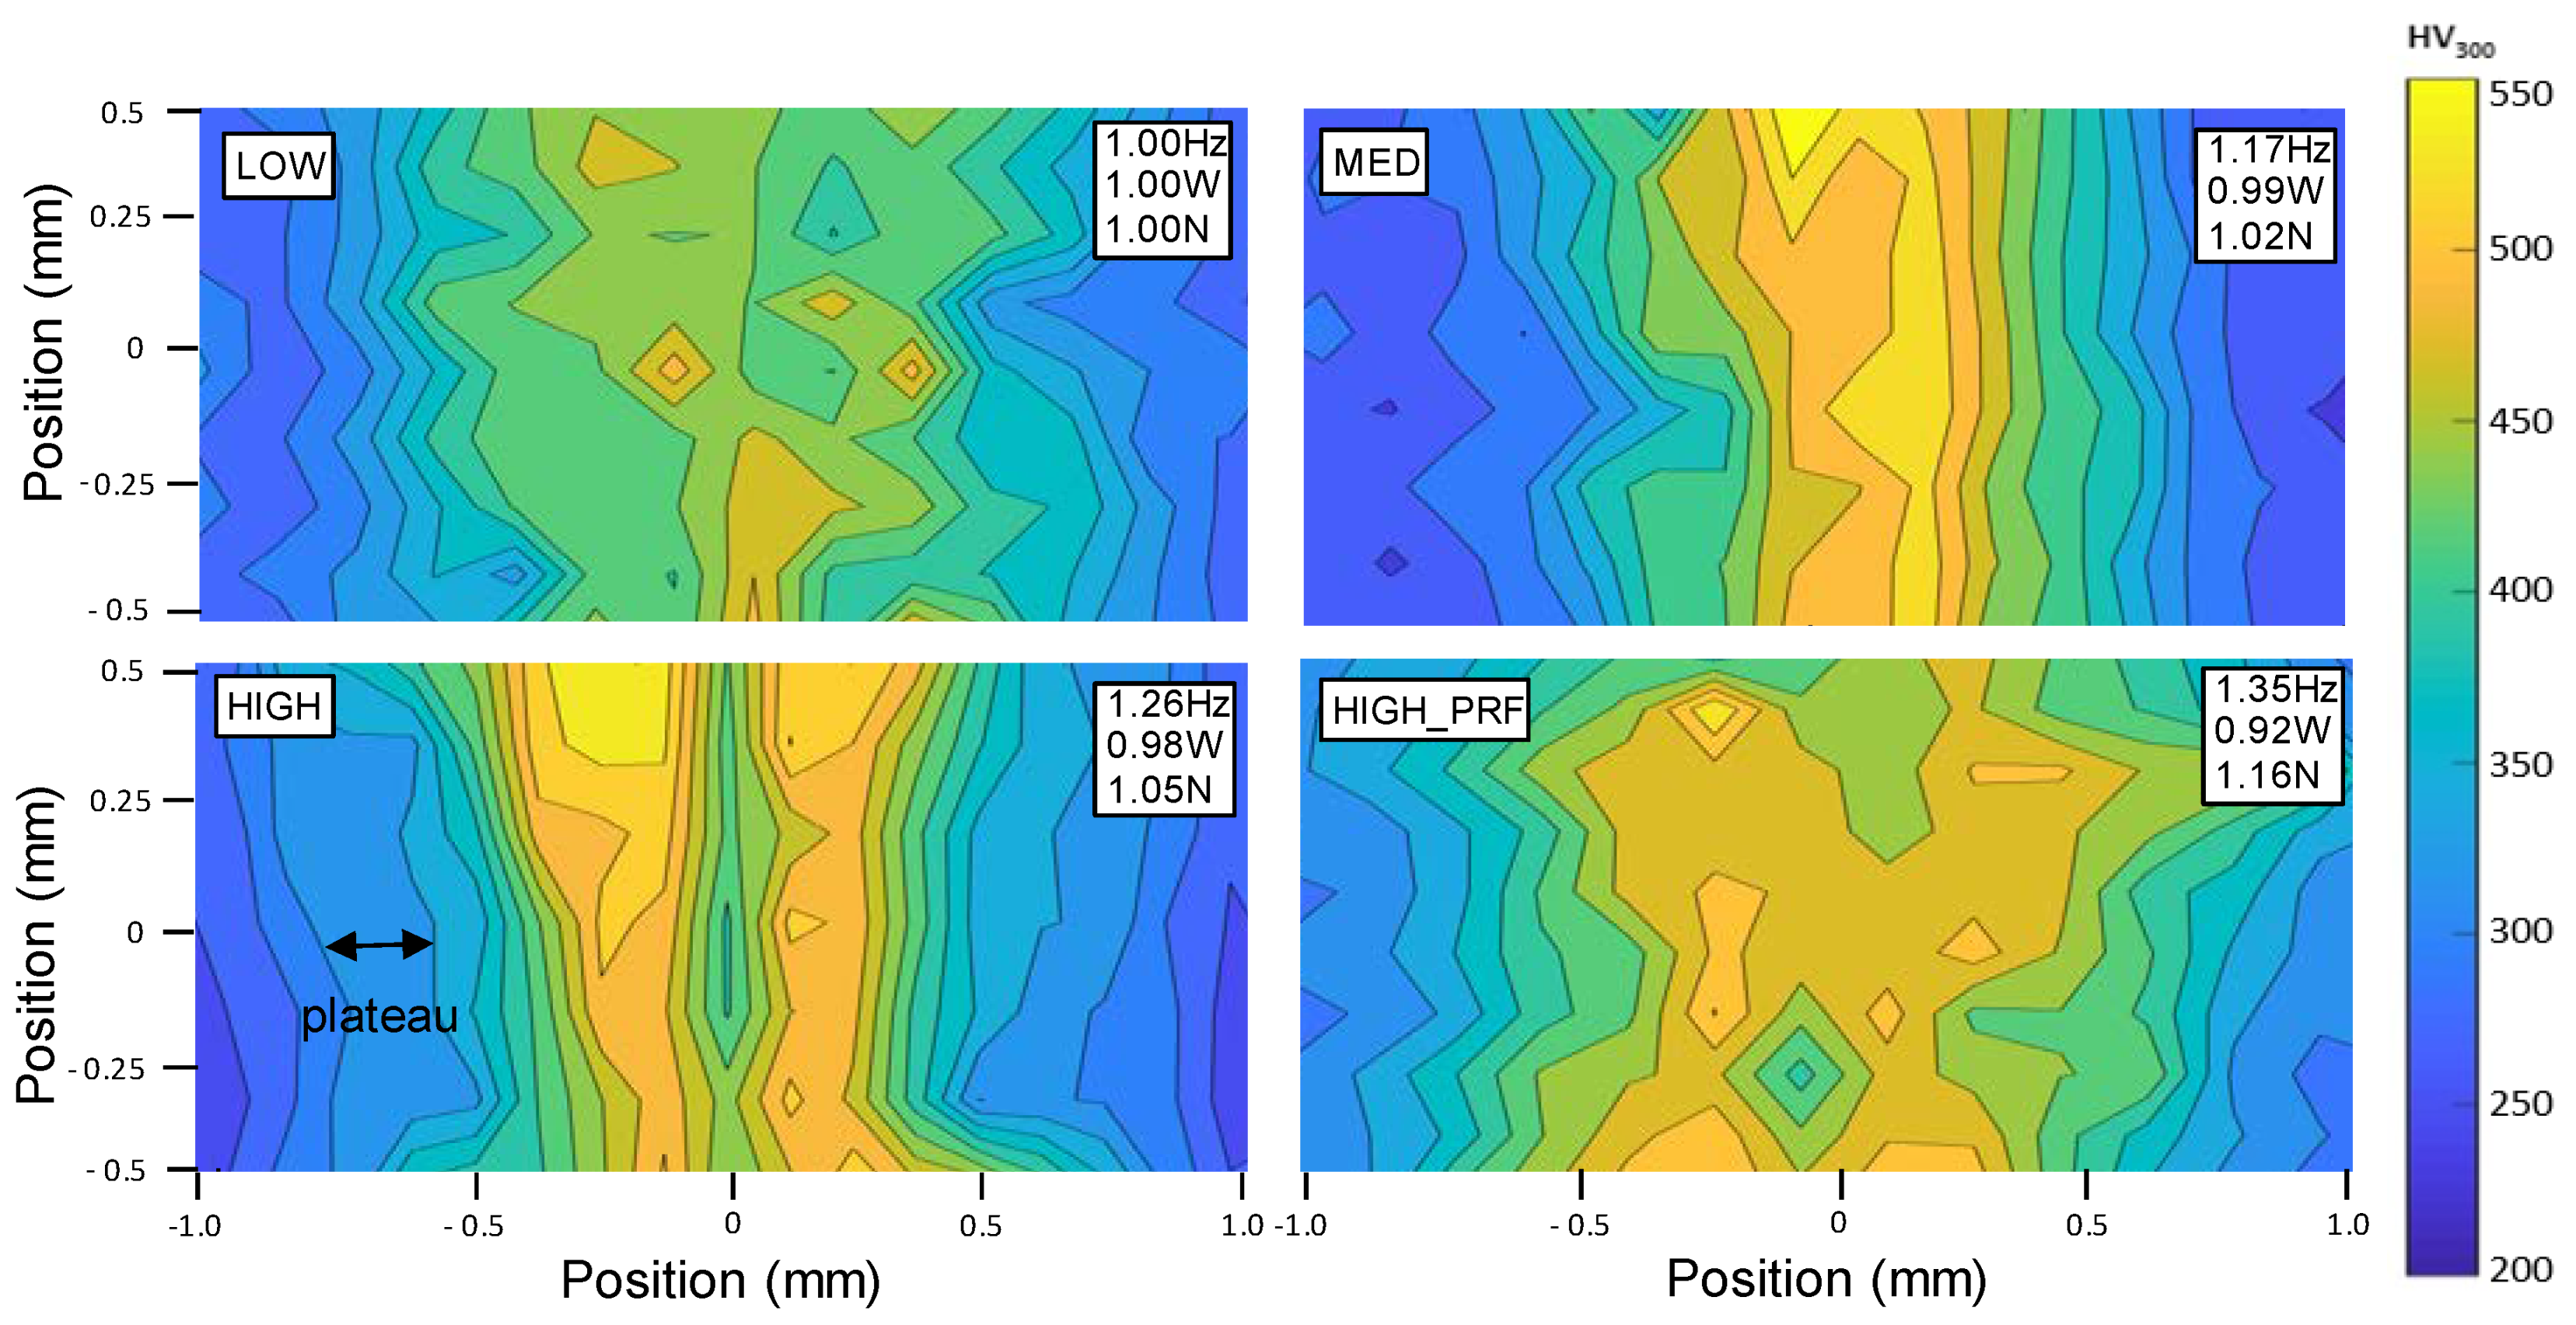
3.2. 2D Hardness Distribution Contours
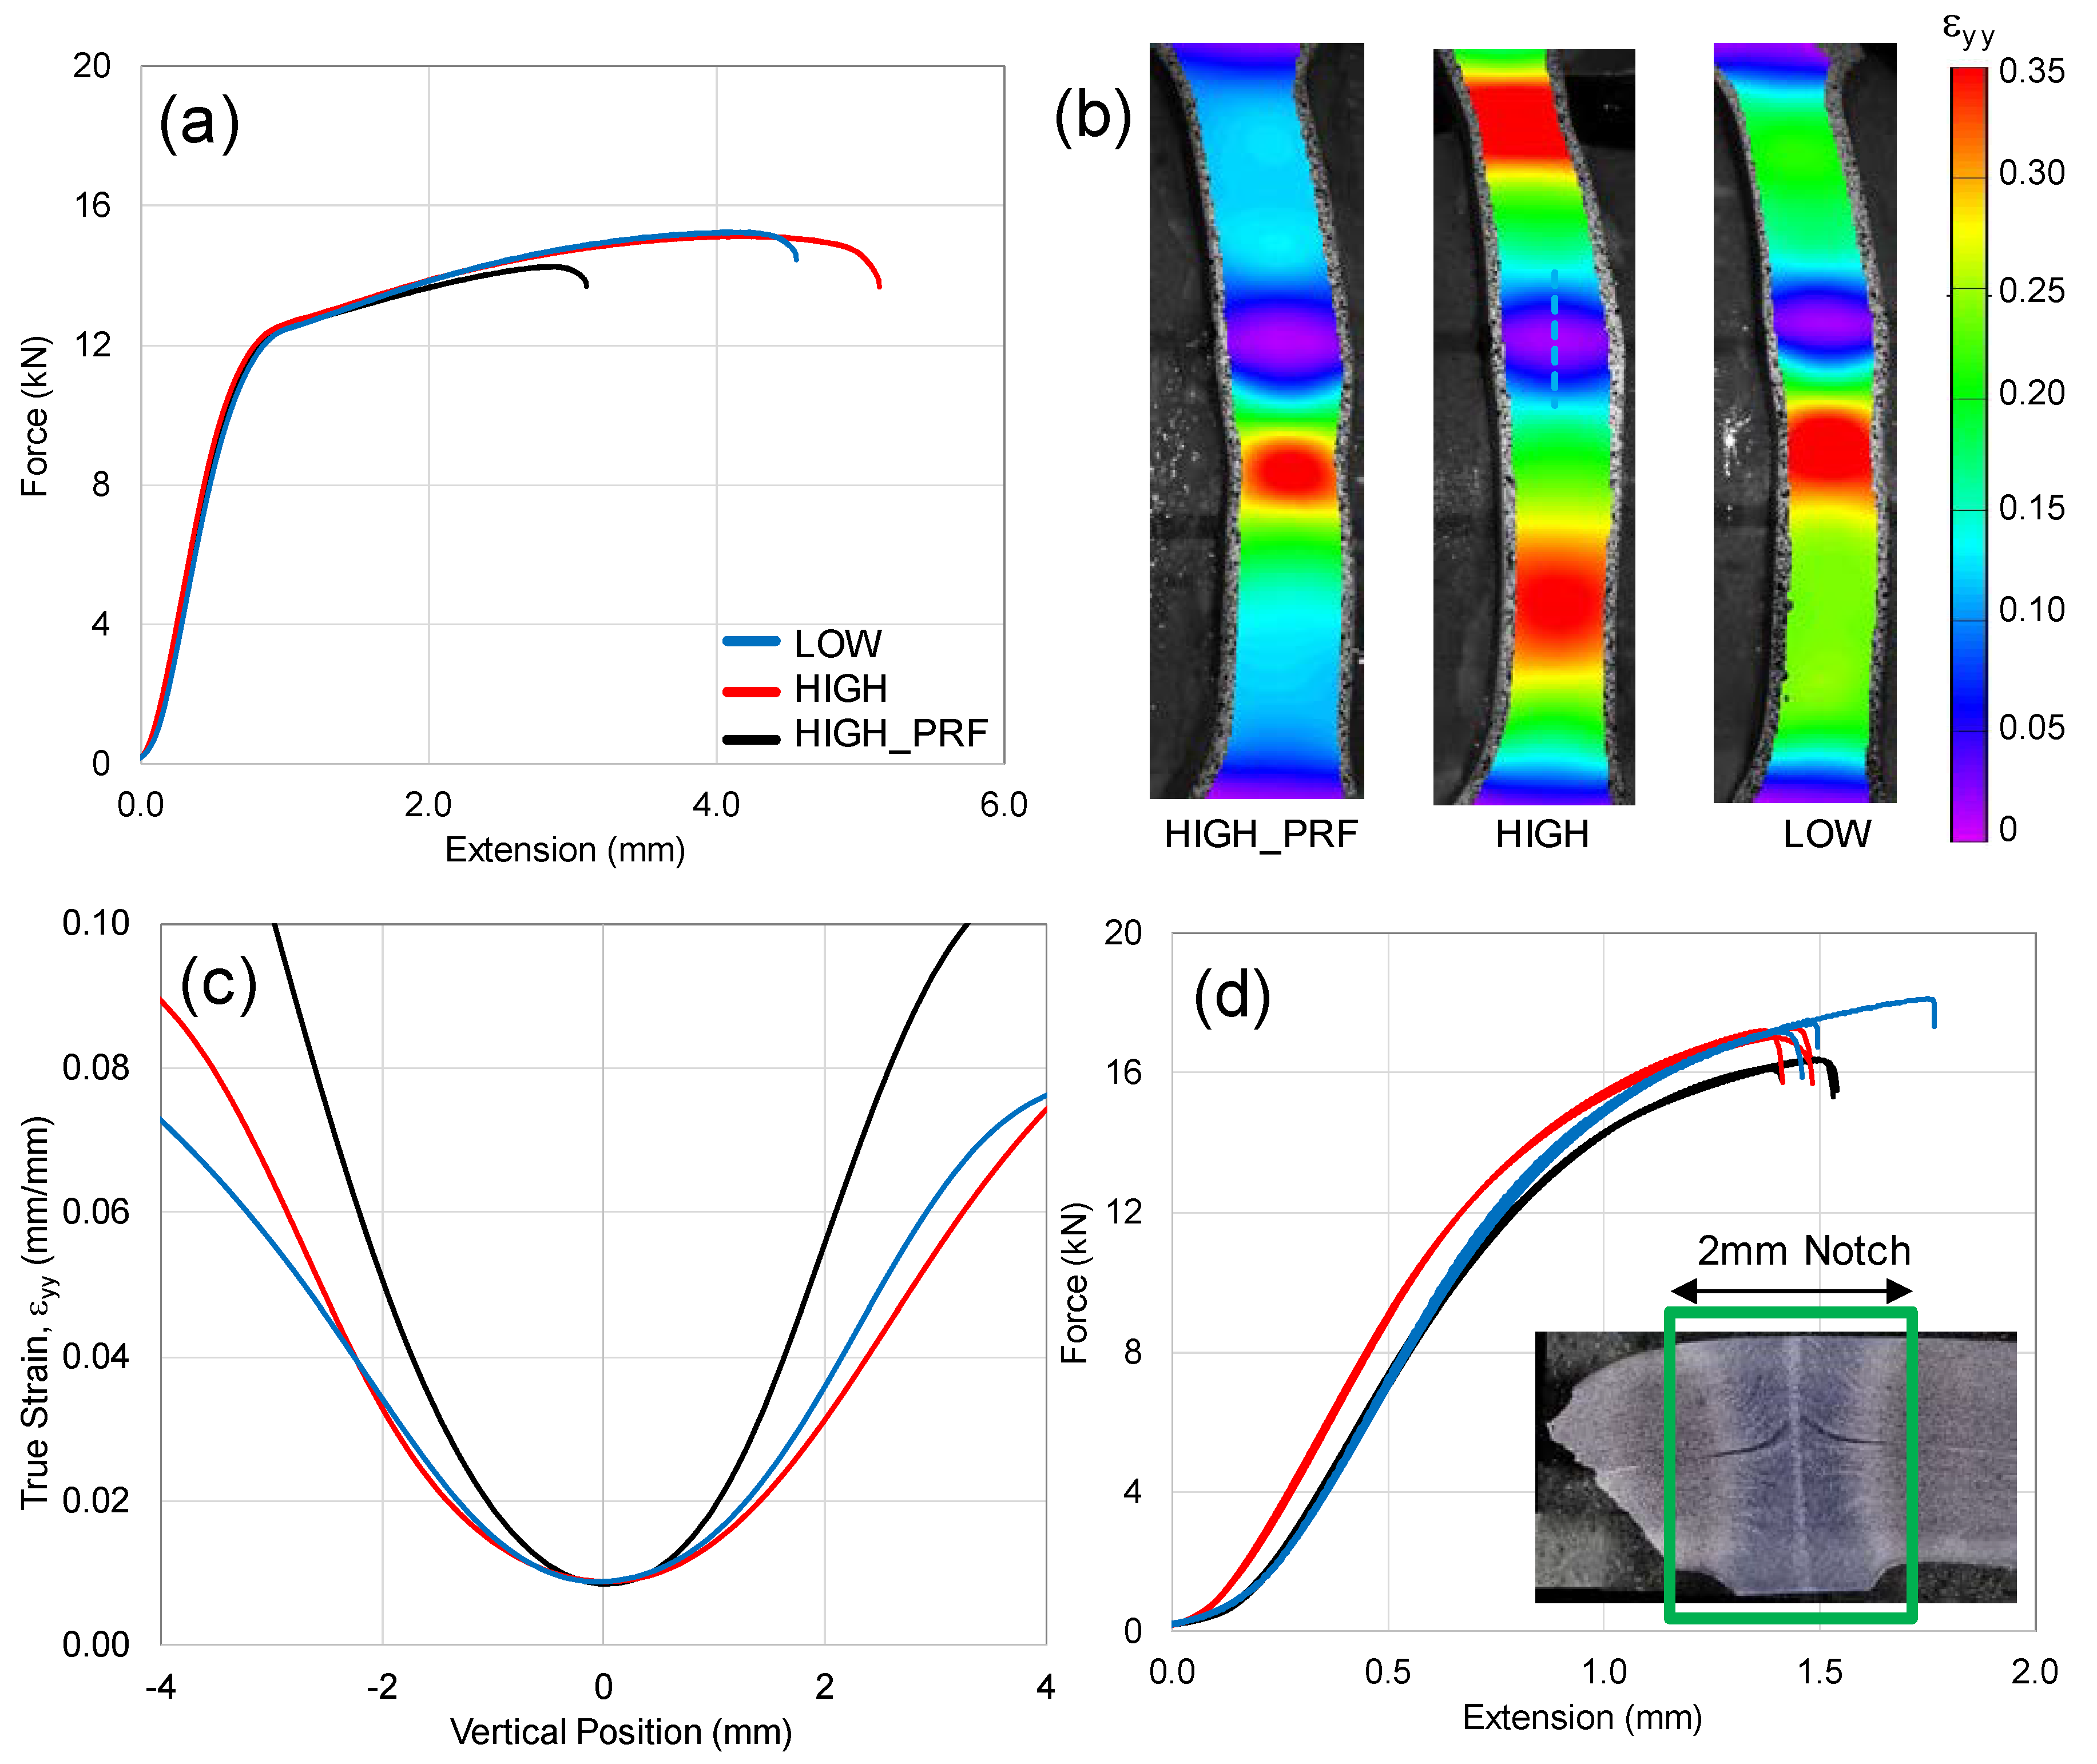
3.3. Ring Hoop Tension Test (RHTT) Results
3.3.1. Tensile Specimen Results
3.3.2. Notched Specimen Results
4. Conclusions
- Based on the measured centerline hardness distributions, the LOW and MED weld frequency cases resulted in similar hardness distributions, while the HIGH weld frequency resulted in a narrower total weld width within the HAZ due to a plateau in hardness at approximately 325 HV300. The plateau in hardness was due to a delay in the transformation of martensite which indicates that the HIGH weld frequency resulted in a lower weld temperature.
- The HAZ was composed of increasing volume fractions of martensite and coalesced bainite (or auto-tempered martensite) as the hardness increased from the BM towards the WZ. The presence of ferrite was observed within the predominantly martensitic weld interface which may have been due to insufficient austenitization at the complex tube edge condition.
- 2D hardness distributions were shown to be important in identifying highly asymmetric weld microstructure distributions, which are undesirable from a fracture performance perspective.
- An increased weld width was observed for a higher pressure roll force (with changes also to frequency and power) and it is likely that the high weld force resulted in more of the sheet edge being austenitized, but also possibly affected the phase transformation kinetics for this particular grade of TRIP690.
- The Ring Hoop Tension Test (RHTT) was used to evaluate the mechanical weld seam performance of the tubes examined in this work and showed that peak loads were higher for the Notch specimen than the Tensile specimens by ~13% (for HIGH/LOW), indicating good weld fracture performance and the suitability of these tubes for hydroforming applications.
- From an experimental and numerical perspective, future work will focus on quantifying the impact that induction welding parameters have on the complex temperature-time history of the seam welding process. This will allow for the optimization of the weld seam microstructure for this and future novel AHSS.
Author Contributions
Funding
Conflicts of Interest
References
- Corporate Average Fuel Economy | NHTSA. (n.d.). Available online: https://www.nhtsa.gov/laws-regulations/corporate-average-fuel-economy#light-duty-stakeholders (accessed on 30 September 2019).
- Bouaziz, O.; Zurob, H.; Huang, M. Driving force and logic of development of advanced high strength steels for automotive applications. Steel Res. Int. 2013, 84, 937–947. [Google Scholar] [CrossRef]
- Karbasian, H.; Tekkaya, A.E. A review on hot stamping. J. Process. Technol. 2010, 210, 2103–2118. [Google Scholar] [CrossRef]
- Bardelcik, A.; Bouhier, A.; Worswick, M.J. Three Point Bend Performance of Solutionized, Die Quenched and Heat Treated AA7075 Beam Members. Mater. Sci. Forum 2014, 794, 431–436. [Google Scholar] [CrossRef]
- Naka, T.; Yoshida, F. Deep drawability of type 5083 aluminium-magnesium alloy sheet under various conditions of temperature and forming speed. J. Process. Technol. 2013, 89, 19–23. [Google Scholar] [CrossRef]
- Tari, D.G.; Worswick, M.J.; Winkler, S. Experimental studies of deep drawing of AZ31B magnesium alloy sheet under various thermal conditions. J. Process. Technol. 2013, 213, 1337–1347. [Google Scholar] [CrossRef]
- Dohmann, F.; Hartl, C. Tube hydroforming – research and practical application. J. Process. Technol. 1997, 71, 174–186. [Google Scholar] [CrossRef]
- Bardelcik, A. Effect of Pre-Bending and Hydroforming Parameters on the Formability of Advanced High Strength Steel Tube. Master’s Thesis, University of Waterloo, Waterloo, ON, Canada, October 2006. [Google Scholar]
- Oliveira, D.A. Interaction Between Forming and the Crash Response of Aluminium Alloy S-Rails. Ph.D. Thesis, University of Waterloo, Waterloo, ON, Canada, July 2007. [Google Scholar]
- Bardelcik, A.; Worswick, M.J. Evaluation of load control end-feed in hydroforming of pre-bent DP600 steel tube using the extended stress-based forming limit curve failure criterion. J. Comput. Appl. Mech. 2006, 7, 133–154. [Google Scholar]
- Simha, C.H.M.; Gholipour, J.; Bardelcik, A.; Worswick, M.J. Prediction of necking in tubular hydroforming using an extended stress-based forming limit curve. J. Eng. Mater. Technol. 2007, 129, 36–47. [Google Scholar] [CrossRef]
- Groche, P.; Breitenbach, G.V.; Steinheimer, R. Properties of tubular semi-finished products for hydroforming. Steel Res. Int. 2005, 76, 181–186. [Google Scholar] [CrossRef]
- Groche, P.; Breitenbach, G. Roll Forming Strategies for Welded Tubes. Steel Res. Int. 2008, 79, 40–46. [Google Scholar] [CrossRef]
- The Tube and Pipe Journal-Choosing a Welding Process for Tubular Profiles. Available online: https://www.thefabricator.com/tubepipejournal/article/tubepipeproduction/choosing-a-welding-process-for-tubular-profiles (accessed on 15 November 2019).
- Ghaffarpour, M.; Akbari, D.; Moslemi Naeeni, H.; Ghanbari, S. Improvement of the joint quality in the high-frequency induction welding of pipes by edge modification. Weld World 2019, 63, 1561–1572. [Google Scholar] [CrossRef]
- The Tube and Pipe Journal-Selecting a welding frequency-Research on the optimal frequency for tube production. Available online: https://www.thefabricator.com/tubepipejournal/article/tubepipefabrication/selecting-a-welding-frequency (accessed on 28 January 2020).
- Weman, K. Welding processes handbook, 1st ed.; Woodhead Publishing Ltd.: Cambridge, UK, 2013; p. 89. [Google Scholar]
- Nikanorov, A.; Baake, E.; Brauer, H.; Weil, C. Approaches for Numerical Simulation of High Frequency Tube Welding Process. In Proceedings of the International Conference on Heating by Electromagnetic Sources, Pandua, Italy, 22–24 May 2013; pp. 647–654. [Google Scholar]
- Kim, C.M.; Kim, J.K. The effect of heat input on the defect phases in high frequency electric resistance welding. Met. Mater. Int. 2009, 15, 141–148. [Google Scholar] [CrossRef]
- Okabe, T.; Yasuda, K.; Nakata, K. Dynamic observations of welding phenomena and finite element analysis in high-frequency electric resistance welding. Weld. Int. 2016, 30, 835–845. [Google Scholar] [CrossRef]
- Li, F.; Ning, J.; Wang, T.; Liang, S.Y. Analytical modeling and sensitivity analysis of the temperature distribution in the planar scanning induction heating based on 2D moving heat source. J. Mech. Sci. Technol. 2019, 33, 5093–5102. [Google Scholar] [CrossRef]
- Li, F.; Ning, J.; Liang, S.Y. Analytical Modeling of the Temperature Using Uniform Moving Heat Source in Planar Induction Heating Process. Appl. Sci. 2019, 9, 1445. [Google Scholar] [CrossRef]
- Zackay, V.F.; Parker, E.R.; Fahr, D.; Busch, R. The enhancement of ductility in high-strength steels. ASM Trans. Q. 1967, 60, 252–259. [Google Scholar]
- Matsumura, O.; Sakuma, Y.; Takechi, H. Enhancement of elongation by retained austenite in intercritical annealed 0.4C-1.5Si-0.8Mn steel. ISIJ Int. 1987, 27, 570–579. [Google Scholar] [CrossRef]
- Ashiri, R.; Mostaan, H.; Park, Y. A Phenomenological Study of Weld Discontinuities and Defects in Resistance Spot Welding of Advanced High Strength TRIP Steel. Metall. Mater. Trans. A 2018, 49, 6161–6172. [Google Scholar] [CrossRef]
- Sajjadi-Nikoo, S.; Pouranvari, M.; Abedi, A.; Ghaderi, A.A. In situ postweld heat treatment of transformation induced plasticity steel resistance spot welds. Sci. Tchnol. Weld. Joi. 2018, 23, 71–78. [Google Scholar] [CrossRef]
- Spena, P.R.; Cortese, L.; De Maddis, M.; Lombardi, F. Effects of Process Parameters on Spot Welding of TRIP and Quenching and Partitioning Steels. Steel Res. Int. 2016, 87, 1592–1600. [Google Scholar] [CrossRef]
- Zhang, M.; Li, L.; Fu, R.; Zhang, J.; Wan, Z. Weldability of Low Carbon Transformation Induced Plasticity Steel. J. Iron Steel Res. Int. 2008, 15, 61–65. [Google Scholar] [CrossRef]
- López Cortéz, V.H.; Pérez Medina, G.Y.; Reyes Valdéz, F.A.; López, H.F. Effects of the heat input in the mechanical integrity of the welding joints welded by GMAW and LBW process in Transformation Induced Plasticity steel (TRIP) used in the automotive industry. Soldag. insp. 2010, 15, 234–241. [Google Scholar] [CrossRef]
- Grajcar, A.; Rózański, M.; Stano, S.; Kowalski, A. Microstructure Characterization of Laser-Welded Mb-Microalloyed Silicon-Aluminum TRIP Steel. J. Mater. Eng. Perform. 2014, 23, 3400–3406. [Google Scholar] [CrossRef]
- Medina, G.P.; Ferreira, H.L.; Robledo, P.Z.; Perez, A.M.; Valdes, F.E.R. Microstructural Development in a TRIP-780 Steel Joined by Friction StirWelding (FSW): Quantitative Evaluations and Comparisons with EBSD. Soldagem & Inspeção 2016, 21, 146–155. [Google Scholar] [CrossRef]
- Mironova, S.; Satoa, Y.S.; Yoneyamab, S.; Kokawaa, H.; Fujiia, H.T.; Hiranoc, S. Microstructure and tensile behavior of friction-stir welded TRIP steel. Mat. Sci. Eng. A 2018, 717, 26–33. [Google Scholar] [CrossRef]
- Mazzaferro, C.C.P.; Ramos, F.D.; Mazzaferro, J.A.E.; de Souza Rosendo, T.; Tier, M.A.D.; da Silva, A.M.; Reguly, A. Microstructure evaluation and mechanical properties of a friction stir spot welded TRIP 800 steel. Weld. Int. 2011, 25, 683–690. [Google Scholar] [CrossRef]
- Dick, C.P.; Korkolis, Y.P. Mechanics and full-field deformation study of the Ring Hoop Tension Test. Int. J. Solids Struct. 2014, 51, 3042–3057. [Google Scholar] [CrossRef]
- Keehan, E.; Karlsson, L.; Bhadeshia, H.K.D.H.; Thuvander, M. Electron backscattering diffraction study of coalesced bainite in high strength steel weld metals. J. Mater. Sci. Technol. 2013, 24, 1183–1188. [Google Scholar] [CrossRef]
- Pouranvari, M.; Sobhani, S.; Goodarzi, F. Resistance spot welding of MS1200 martensitic advanced high strength steel: Microstructure-properties relationship. J. Manuf. Process. 2018, 31, 867–874. [Google Scholar] [CrossRef]
- Saha, D.C.; Biro, E.; Gerlich, A.P.; Zhou, Y. Effects of tempering mode on the structural changes of martensite. Mat. Sci. Eng. A. 2016, 673, 467–475. [Google Scholar] [CrossRef]
- Jarvinen, H.; Honkanen, M.; Jarvenpaa, M.; Peura, P. Effect of paint bake treatment on the properties of press hardened boron steels. J. Eng. Mater. Technol. 2018, 252, 90–104. [Google Scholar] [CrossRef]
- Bourque, C.; Bardelcik, A.; Wells, M.; Chiriac, C. Short cycle tempering of an 1800 MPa grade of press hardening steel. Proceedings of Materials Science and Technology 2019, Portland, OH, USA, 29 September–3 October 2019. [Google Scholar]


| Sample ID | Weld Frequency (Hz) |
|---|---|
| LOW | 1.0 |
| MED | 1.17 |
| HIGH | 1.26 |
| HIGH_PRF | 1.35 |
© 2020 by the authors. Licensee MDPI, Basel, Switzerland. This article is an open access article distributed under the terms and conditions of the Creative Commons Attribution (CC BY) license (http://creativecommons.org/licenses/by/4.0/).
Share and Cite
Bardelcik, A.; Ananthapillai, B.T. Induction Weld Seam Characterization of Continuously Roll Formed TRIP690 Tubes. Metals 2020, 10, 425. https://doi.org/10.3390/met10040425
Bardelcik A, Ananthapillai BT. Induction Weld Seam Characterization of Continuously Roll Formed TRIP690 Tubes. Metals. 2020; 10(4):425. https://doi.org/10.3390/met10040425
Chicago/Turabian StyleBardelcik, Alexander, and Bharathwaj Thirumalai Ananthapillai. 2020. "Induction Weld Seam Characterization of Continuously Roll Formed TRIP690 Tubes" Metals 10, no. 4: 425. https://doi.org/10.3390/met10040425
APA StyleBardelcik, A., & Ananthapillai, B. T. (2020). Induction Weld Seam Characterization of Continuously Roll Formed TRIP690 Tubes. Metals, 10(4), 425. https://doi.org/10.3390/met10040425