Next Article in Journal
Simulation on the Effect of Porosity in the Elastic Modulus of SiC Particle Reinforced Al Matrix Composites
Next Article in Special Issue
Erratum: Pushkareva, I., et al. The Influence of Vanadium Additions on Isothermally Formed Bainite Microstructures in Medium Carbon Steels Containing Retained Austenite. Metals 2020, 10, 392
Previous Article in Journal
Development of Metal Powder Hot Embossing: A New Method for Micromanufacturing
Previous Article in Special Issue
Hot Strip Mill Processing Simulations on a Ti-Mo Microalloyed Steel Using Hot Torsion Testing
 
 
Erratum published on 27 April 2020, see Metals 2020, 10(5), 565.
Article

The Influence of Vanadium Additions on Isothermally Formed Bainite Microstructures in Medium Carbon Steels Containing Retained Austenite

by
Irina Pushkareva
1,*,
Babak Shalchi-Amirkhiz
1,
Sébastien Yves Pierre Allain
2,
Guillaume Geandier
2,
Fateh Fazeli
1,
Matthew Sztanko
1 and
Colin Scott
1
1
Canmet Materials, Natural Resources Canada, 183 Longwood Road South, Hamilton, ON L8P 0A5, Canada
2
Institut Jean Lamour, UMR CNRS-UL 7198, 54011 Nancy, France
*
Author to whom correspondence should be addressed.
Metals 2020, 10(3), 392; https://doi.org/10.3390/met10030392
Submission received: 25 February 2020 / Revised: 13 March 2020 / Accepted: 16 March 2020 / Published: 19 March 2020
(This article belongs to the Special Issue Thermomechanical Processing of Steels)

Abstract

:
The influence of V additions on isothermally formed bainite in medium carbon steels containing retained austenite has been investigated using in-situ high energy X-ray diffraction (HEXRD) and ex-situ electron energy loss spectroscopy (EELS) and energy dispersive X-ray analysis (EDX) techniques in the transmission electron microscope (TEM). No significant impact of V in solid solution on the bainite transformation rate, final phase fractions or on the width of bainite laths was seen for transformations in the range 375–430 °C. No strong influence on the dislocation density could be detected, although quantitative analysis was impeded by ferrite tetragonality. A reduction in the carbon content of retained austenite Cγ that is not believed to be due to competition with VC or cementite precipitation was observed. No influence of V on the carbon supersaturation in bainitic ferrite Cb could be directly measured, although carbon mass balance calculations suggest Cb slightly increases. A beneficial refinement of blocky MA and a corresponding size effect induced enhancement in austenite stability were found at the lowest transformation temperature. Overall, V additions result in a slight increase in strength levels.

1. Introduction

Vanadium additions are known to be beneficial for improving the strength and/or the in-use performance of several classes of advanced high strength steel (AHSS) products. These include low carbon hot rolled bainitic steels [1], medium carbon air-cooled bainitic forging steels [2,3,4], intercritically annealed low and medium carbon transformation induced plasticity (TRIP) and dual phase (DP) sheets [5], medium carbon ferritic hot strips [6,7] and high carbon austenitic twinning induced plasticity (TWIP) steels [8,9]. Classically, the vanadium strengthening effect in carbon-manganese steels is attributed to a combination of microstructure refinement and precipitation hardening [10]. However, vanadium can also provide positive effects while still in solid solution. For example, in bainitic steels that are fast cooled from temperatures above Ac3 and transformed below Bs almost all of the added vanadium remains in solid solution [3,4]. Nevertheless, for low carbon alloys it is clear that there can be a beneficial strengthening effect from vanadium due to a notable decrease in the bainite transformation temperature [1]. Further, bainite softening during coiling is reduced in a manner analogous to the well known effect of vanadium on the temper softening of martensite [11]. While the situation for low carbon (i.e., containing < 0.1 wt. % C) bainite now seems reasonably clear, few detailed studies on technologically important medium carbon bainitic alloys (0.2–0.4 wt. % C) are available. For example, in 0.25 wt. % C alloys with V additions of up to 0.4 wt. % Sourmail and co-authors [2,3] reported no significant precipitation or clustering of V and no effect on the bainite reaction for isothermal transformations in the range 375–450 °C. In fact, the dominant effect of vanadium in these alloys was a strong reduction in the critical cooling rate for pearlite formation, leading to a significant improvement in hardenability for large sections. Wang et al. [4] found that the addition of 0.13 wt. % V in bainitic forging steels was advantageous for both strength and toughness under as-forged slow air-cooled conditions, but that the benefits were reduced as the cooling rate increased.
In low carbon steels the bainitic transformation is very rapid and, depending on the composition and cooling rates applied on the hot strip mill run out table, can begin during fast cooling before the coiling temperature is reached. The situation is more complicated in the medium carbon steels considered here as the bainitic transformation is much slower and carbon partitioning will result in the presence of a second phase of carbon-stabilized retained austenite (RA). Often, silicon additions are employed to delay cementite formation in bainitic ferrite and increase the amount of carbon available for retained austenite stabilization [12]. Further, the high dislocation densities formed in fresh bainitic ferrite may accelerate vanadium carbide and nitride nucleation. In this work, a powerful combination of in-situ high energy synchrotron X-ray diffraction (HEXRD) and ex-situ electron back scattered diffraction (EBSD) and electron energy loss spectroscopy (EELS) and energy dispersive X-ray mapping (EDX) techniques to determine the effect of vanadium additions on the evolution of the microstructure before, during and after the bainitic transformation in two model alloys is applied. An important aspect of this study is that all of the experimental work including the heat treatment, in-situ diffraction, ex-situ microscopy and mechanical testing was carried out on the same samples. This was done in order to eliminate, as far as possible, the effects of heterogeneous composition and/or processing.

2. Materials and Methods

In this work the effect of vanadium on the bainitic transformation in two laboratory alloys, Ref and Ref+V was studied, using a range of in-situ diffraction and ex-situ microscopy techniques. The in-situ work was done using synchrotron X-ray diffraction to determine the evolution of the phase fractions, the average carbon content in austenite and the dislocation density in bainitic ferrite. Ex-situ optical and scanning electron microscopy (including EBSD) were applied to compare the microstructural parameters such as bainite lath size and MA island sizes. Transmission electron microscopy was also employed to characterize precipitate size and chemistry using EDX mapping and to measure the local carbon content in austenite, martensite and bainitic ferrite.
The chemical compositions of the two alloys, Ref and Ref+V, are given in Table 1. The nitrogen content was deliberately kept low in order to maximize the amount of vanadium in solution during the bainite transformation. The vanadium content was based on previous work on TRIP alloys [13] and is typical of bainitic forging applications. The steels were cast into 50 kg ingots from a single 200 kg heat in a vacuum induction melting (VIM) furnace at CanmetMATERIALS (CMAT). The chemical compositions of the solidified ingots were verified by optical emission spectroscopy (OES) and LECO combustion analysis for C and N. Hot rolling was carried out on the CMAT pilot hot strip mill. The ingots were reheated to 1220 °C, held at temperature for 3 h and then hot rolled from 75 to 15 mm in 6 passes. The final rolling pass was carried out above 900 °C and the finished plates were allowed to air cool.
Hollow tube specimens with an outer diameter of 4 mm, an inner diameter of 2 mm and a length of 10 mm were directly machined from the hot rolled plates. They were cut with the cylindrical axis parallel to the rolling direction and centered at ¼ plate thickness. The tube geometry has two important advantages for this study; firstly the amount of X-ray absorption is reduced by having thin wall sections and secondly induction heating and gas cooling is much more efficient and homogeneous with hollow samples. A Bahr DIL 805 deformation dilatometer was used to determine the alloy transformation temperatures Ac1, and Ac3 using a heating rate of 5 °C/s. Optical microscopy (OM), EBSD and Vickers microhardness testing were all done on wall sections obtained by cutting the tubes into two equal half cylinders and polishing the cut faces. Specimens for OM were first polished with 1 μm diamond paste, then finished with Struers OPS solution before etching with a Klemm reagent. EBSD maps were acquired from the same OM samples after repolishing. The EBSD data was acquired using an EDAX TSL system on a Nova NanoSEM 650 field emission gun scanning electron microscope (FEG-SEM). The spot spacings used were 200 nm and 80 nm. Vickers microhardness was measured using a Clemex MMT-X7B tester under 300 gf force and 10 s dwell time according to the ASTM E384 standard.
The in-situ HEXRD experiments were carried out at the Petra (Hamburg) P07 beam line operated in transmission mode under powder diffraction conditions. A high-energy monochromatic beam with 100 keV energy and 0.12 Å wavelength permitted data acquisition in the transmission mode at a frequency of ≃ 10 Hz. A 2-D Perkin-Elmer charge coupled device (CCD) detector was positioned 1 m behind the sample, giving access to full Debye-Scherrer rings with a maximum 2θ angle of 12°. The X-ray beam cross section was 400 μm × 400 μm so that the analyzed volume contained at least 10,000 austenitic grains at the start of each experiment. The applied thermal cycles were controlled using another Bahr dilatometer available at the P07 beam line. Specimens were heated by induction and cooled by argon gas. The temperature was regulated and recorded by a thermocouple spot-welded at the center of the sample. The setup was the same as that used in [14].
The 2-D diffraction patterns produced during the synchrotron experiments were circularly integrated using the Fit2D software [15] after calibration using Si powder and the resulting 1-D diffractograms were analyzed with a full Rietveld refinement procedure. The diffraction peaks were fitted by pseudo-Voigt functions using the FullProf code [16] with 16 degrees of freedom (background, lattice parameters, peak shape and temperature effects) to determine the phase fractions and the lattice parameters. In all the following experiments only two phases were detected in the diffraction patterns: a face-centered cubic phase, corresponding to austenite; and a body-centered phase. The latter could correspond to either body-centered tetragonal (bct-martensite or supersaturated bct-bainitic ferrite) or body-centered cubic (bcc) ferrite. It was not possible to isolate the contribution of each based on tetragonal distortion. Therefore, during the Rietveld refinement procedures the lattices of the two phases were considered to be cubic (Fm3m for austenite and Im3m for martensite/bainite). It is also important to note that no peaks from carbides of any type (including cementite) were detected on the diffractograms.
The austenite carbon content Cγ starts to change from the nominal value during the bainitic transformation when carbon diffuses from fresh bainite into the parent austenite phase. This causes the austenite lattice parameter aγ to increase linearly with the amount of carbon rejected from bainitic ferrite. In these trials the transformation is isothermal, so the austenite carbon content was determined by calculating the relative lattice dilatation Δaγ between each measured lattice parameter value, am and a reference lattice parameter determined at the transformation temperature before any bainite has formed, atr. This difference is proportional to the austenite carbon enrichment ΔCγ as follows [14]:
Δ a γ = a m a t r = k C Δ C γ
The coefficient of proportionality kC is taken to be 0.00105 nm/(at. %)C [17,18]. The absolute carbon content in austenite is then obtained by adding ΔCγ to the nominal carbon content.
Planar TEM thin foils were prepared from the same specimens that were analyzed in the synchrotron. To do this, the tube samples were cut in half in the direction parallel to the rotation axis and one of the resulting half cylinders was gently flattened and then mechanically thinned to 100 μm. The other half cylinder was used for microscopy and microhardness testing. Standard 3 mm disks were punched out of the flattened tubes and perforated by twin-jet polishing using a Struers Tenupol 5 and Struers A8 electrolyte. The specimens were analyzed in a Technai Osiris 200 keV X-FEG (S)TEM equipped with a 4 element windowless Super-X EDX detection system and a Gatan Enfina EELS analysis system. The carbon content in martensite, bainite and retained austenite phases was measured by EELS using a standards based second difference acquisition technique developed by the authors [18]. All equilibrium and kinetic thermodynamic calculations were carried out using the MatCalc 6.02 (rel 1.003) software [19] using the mc_fe_v2.011 diffusion data base, the mc_fe_1.003 physical database and the mc_fe_2.059 thermodynamic database.

3. Results

Section 3.1 is concerned with the determination of the optimum experimental conditions. Section 3.2 contains the OM, SEM and microhardness data. Section 3.3 provides an exploitation of the in-situ synchrotron results. Complementary data obtained from TEM analyses are presented in Section 3.4.

3.1. Definition of the Thermal Cycles

The solution treatment employed here was designed as a compromise to best satisfy several mutually incompatible requirements:
  • The specimens should be completely austenitized with an austenite grain size as small as possible in order to maximize the number of diffracting crystallites and minimize texture effects in the HEXRD experiments.
  • Vanadium precipitates formed either during hot rolling or during the reheating ramp should be redissolved to maximize the amount of vanadium and carbon in solution before the bainite transformation.
  • Any cementite formed during reheating should be dissolved to maximize the interstitial carbon content in austenite before the bainite transformation.
The equilibrium transformation temperatures Ae1 and Ae3 for Ref and Ref+V were calculated using the MatCalc 6 code and compared with experimental dilatometry data [20] in Table 2. The bainitic start temperature Bs and the martensite start temperature Ms calculated from the empirical equations of Kircaldy and Venugopalan [21] and Andrews [22] respectively are also shown.
As expected, the addition of vanadium tends to increase the equilibrium transformation temperatures and stabilize the ferrite phase. The most important effect is on the kinetics—during continuous heating vanadium greatly reduces the austenite nucleation and growth rate in the intercritical region, resulting in a >40 °C increase in Ac1 and Ac3 at a constant heating rate of 5 °C/s. This behavior has been previously observed by the authors in microalloyed dual phase (DP) steels [5]. The calculated solution temperature for V(C,N) in Ref+V is 1067 °C. In the interests of optimizing the austenite grain size for the synchrotron experiment it was decided to use the lowest possible austenitizing temperature and soaking time and tolerate the inevitable presence of a small fraction of precipitated V(C,N). This will be considered further in the discussion section. Therefore a combination of 900 °C/120 s for the austenitization parameters was chosen. It was verified by dilatometry that this was sufficient for the complete austenitization of both alloys. Not much reliable information on the effect of vanadium on Bs and Ms exists for this class of steels. Therefore, three isothermal bainitic transformation temperatures spanning the range of the theoretical values; 375 °C, 400 °C and 430 °C were studied. The optimum cooling rate after austenitization was determined experimentally from the initial synchrotron trials. The cooling rate should be fast enough to avoid the formation of bainite before the isothermal temperature is attained, but slow enough so that there is no significant temperature undershoot at the transition point. It was found that a cooling rate of 40–50° C*s−1 satisfied these requirements. The experimental thermal cycles are shown in Figure 4a.

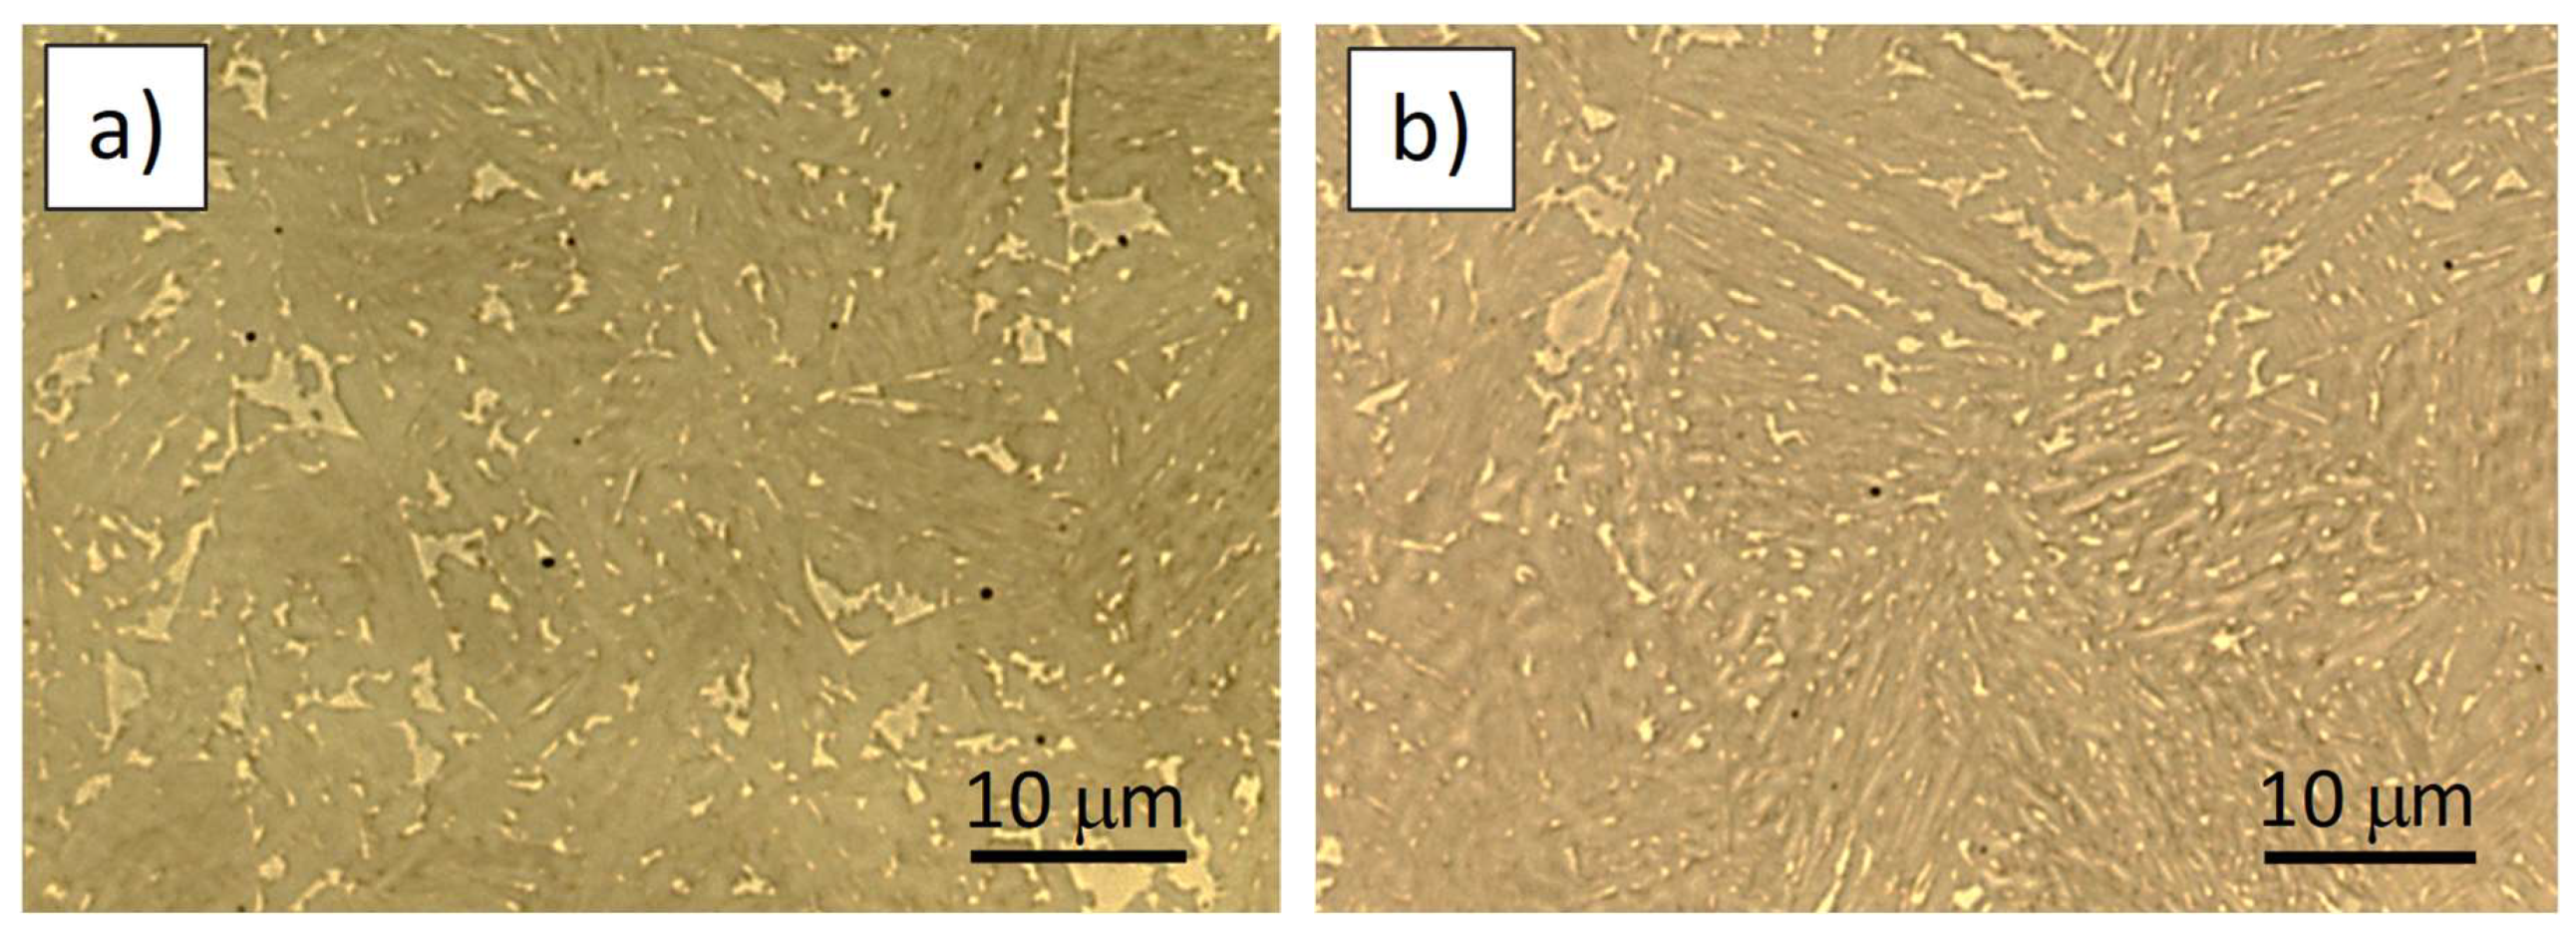
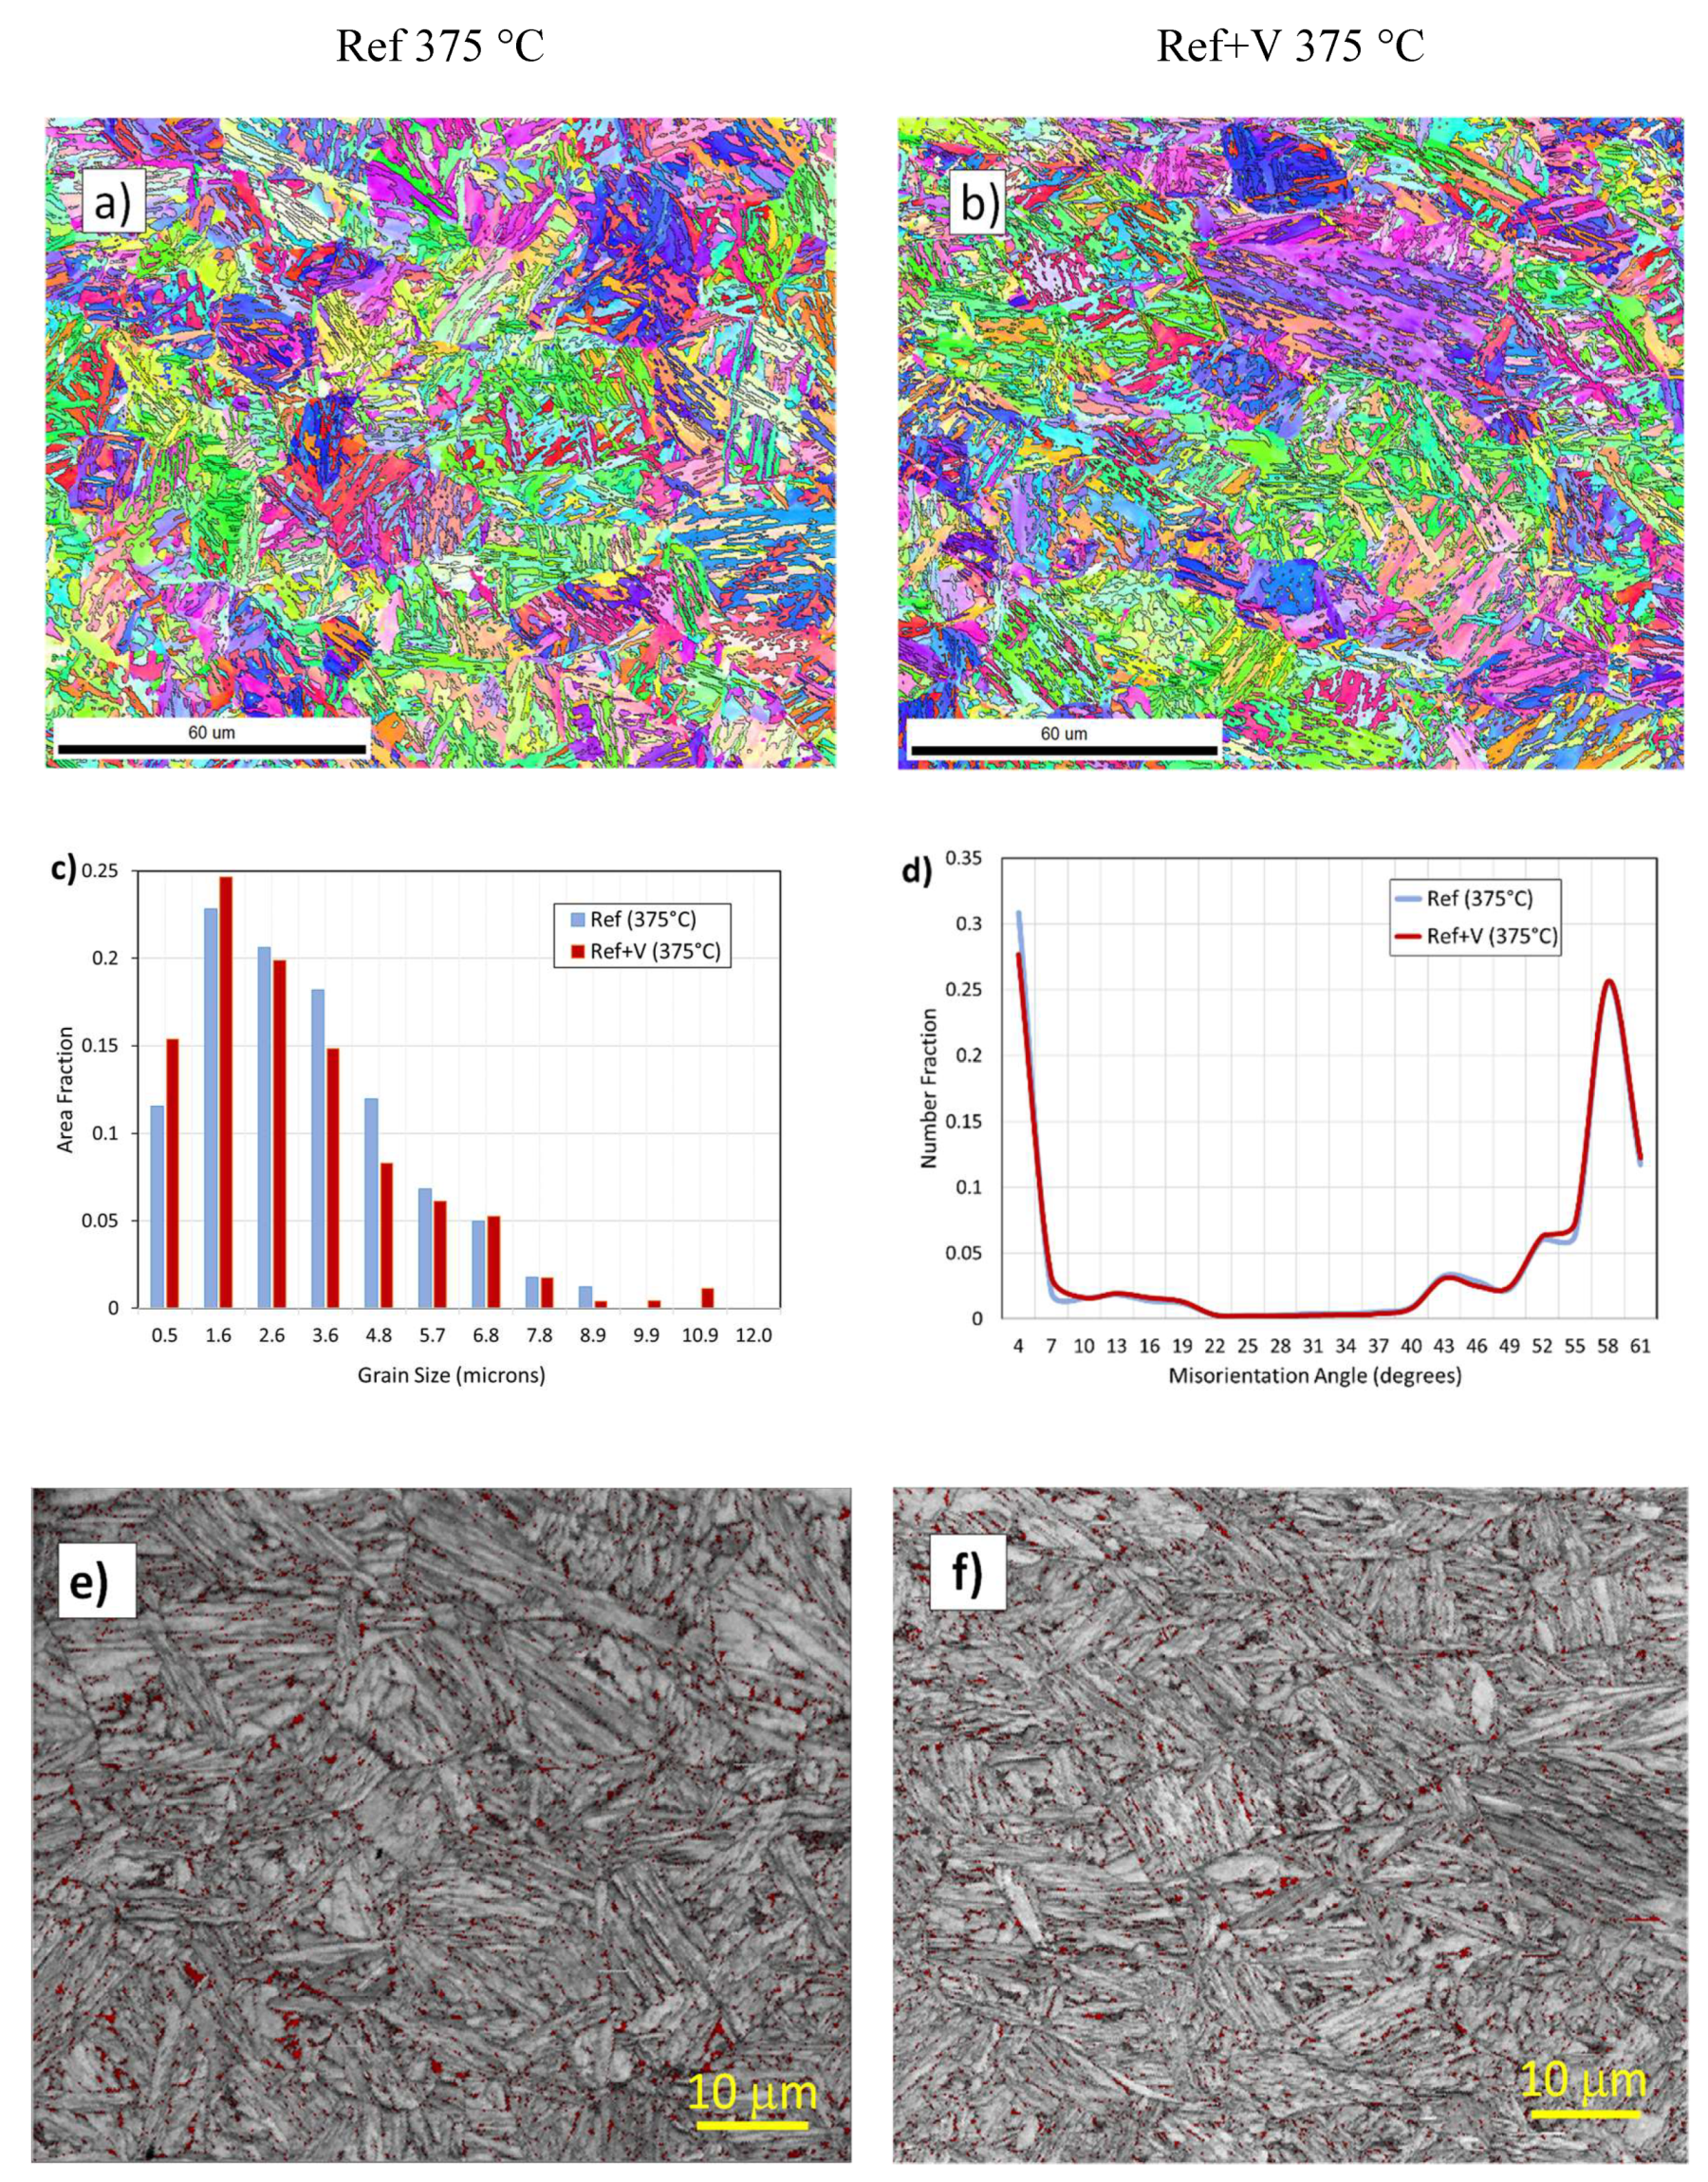
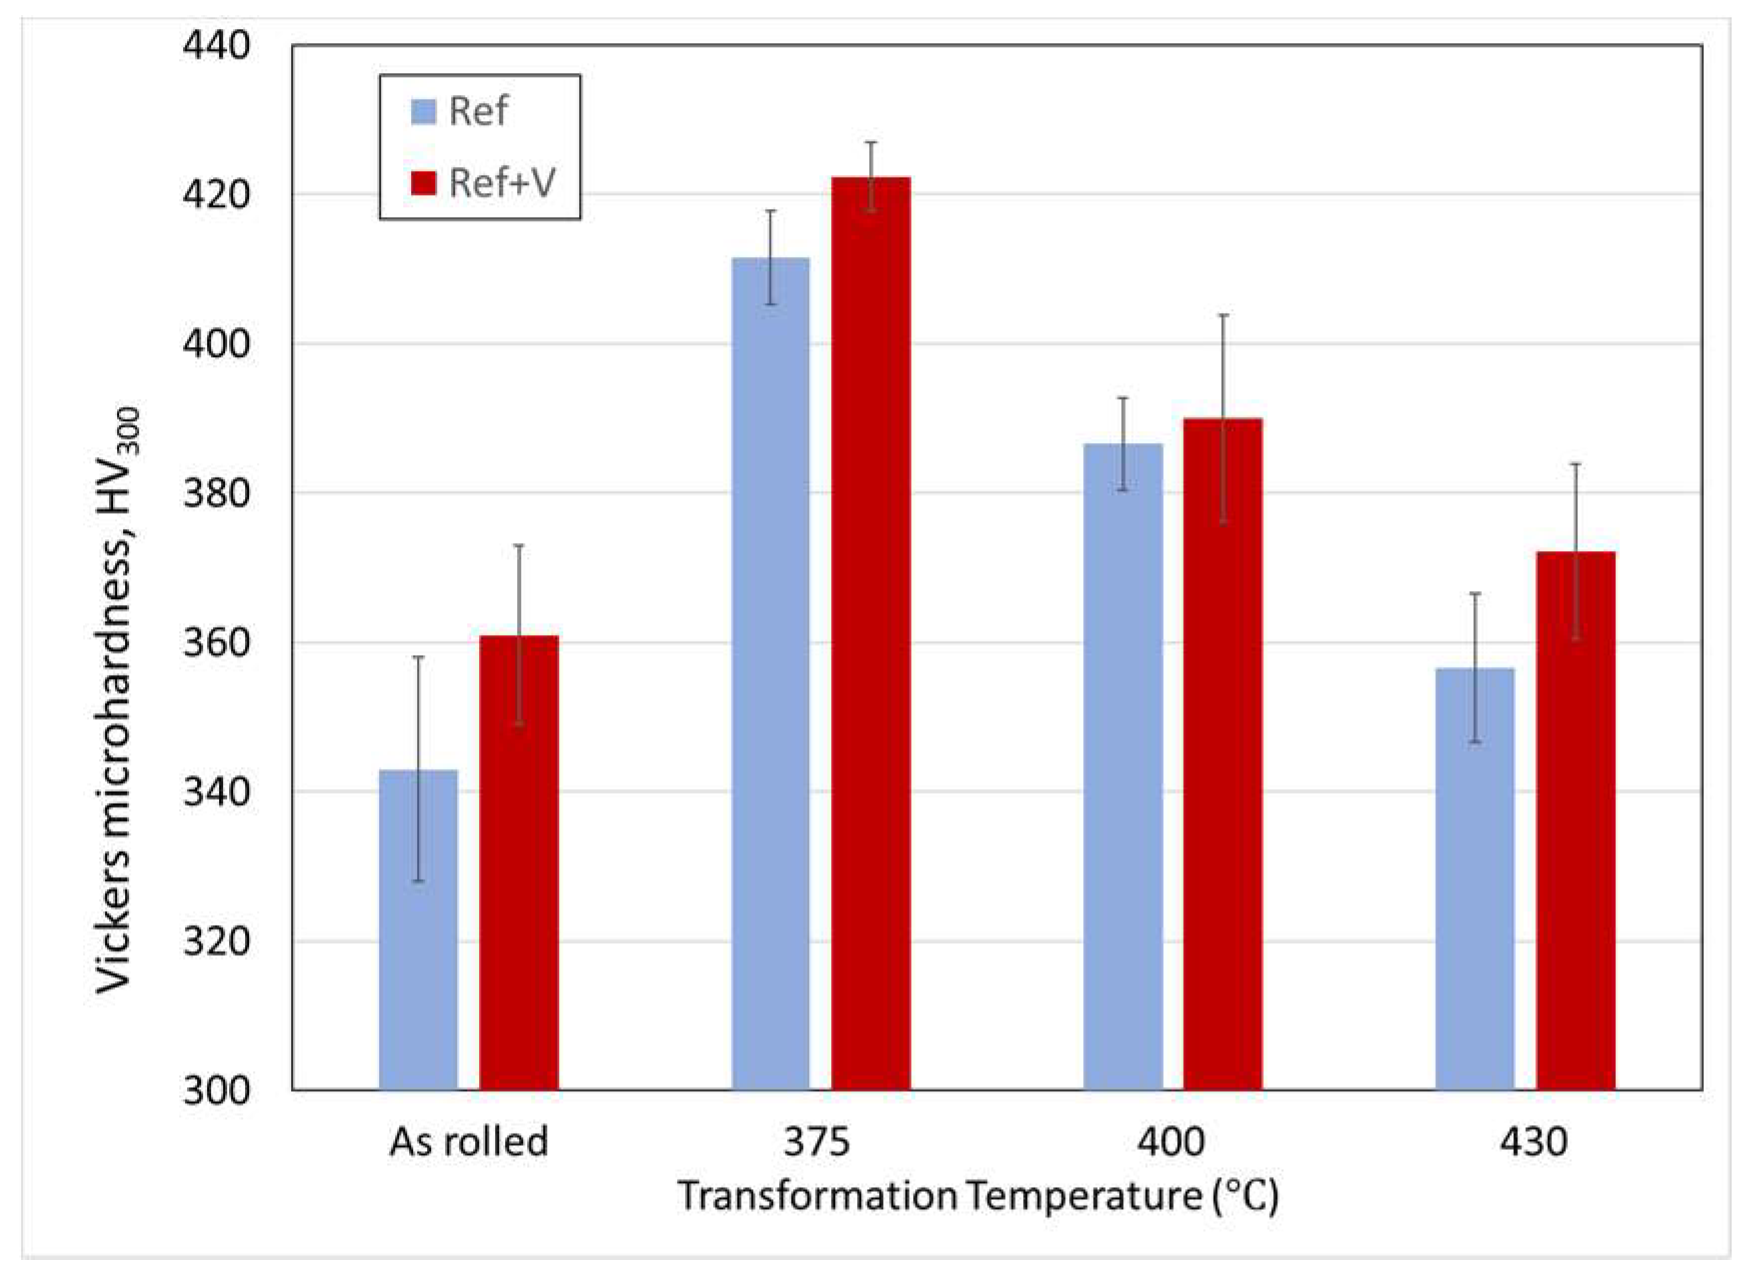
3.2. Microstructure and Mechanical Properties

The microstructure of the Ref and Ref+V alloys transformed at 375 °C can be seen after Klemm etching in Figure 1. The matrices (colored dark) are fully bainitic with second phase retained austenite and/or martensite (MA) colored light. The second phase consists of two distinct morphologies—alignments of thin films or small islands along interlath boundaries and prior austenite grain (PAG) boundaries and coarser blocky islands with a more random distribution. The area fraction and the mean size of second phase islands were determined using the ImageJ analysis software for all three transformation temperatures. The results are listed together with the corresponding synchrotron HEXRD, EBSD and TEM data in Table 3 and Table 4.
The EBSD data from specimens transformed at 375 °C are presented in Figure 2a–f. Similar results were obtained for the 400 °C transformation (not shown). The 430 °C transformation samples were not studied. The Euler orientation maps are shown in Figure 2a,b, the size distributions determined from low angle boundaries (θ < 5°) are compared in Figure 2c, the grain misorientation frequencies in Figure 2d and the image quality (IQ) maps with superimposed austenite islands (red color) in Figure 2e,f. The frequency distributions of grain boundary misorientation angles were typical of lower bainitic microstructures with dominant fractions of low misorientation (θ < 15°) and high misorientation (θ > 50°) boundaries. Vanadium additions clearly had little or no effect on the distributions at 375 °C. The effective grain size for low angle boundaries (θ < 5°) thought to define the effective lath size [23] is reported in Table 4. An estimate of the MA fractions and mean MA island area was determined from the poorly indexed regions in the IQ maps. This information, together with the RA fraction is reported in Table 3 and Table 4.
Vickers microhardness measurements were obtained from the as-rolled plates and from the tube samples after thermal treatment in the synchrotron (Table 4, Figure 3). The hardness of the air-cooled hot strips was found to be 343 ± 15 HV for the Ref alloy and 361 ± 12 HV for Ref+V after air cooling. This is equivalent to an increase of ~+60 MPa in the YS [24]. As expected, fast cooled and isothermally transformed bainitic samples were all stronger than the as-rolled condition, with the highest hardness (422 HV) occurring for the Ref+V alloy transformed at 375 °C. Vanadium additions improved the alloy strength at all transformation temperatures, but the difference at 400 °C was very small. This could indicate that the presence of vanadium introduces different strengthening mechanisms operating at low and high transformation temperatures. The maximum vanadium-related hardness increase after isothermal transformation occurred at 430 °C (+15 HV or ~+50 MPa). The gain in strength was therefore proportionately much lower than that achieved under slow air cooling conditions.

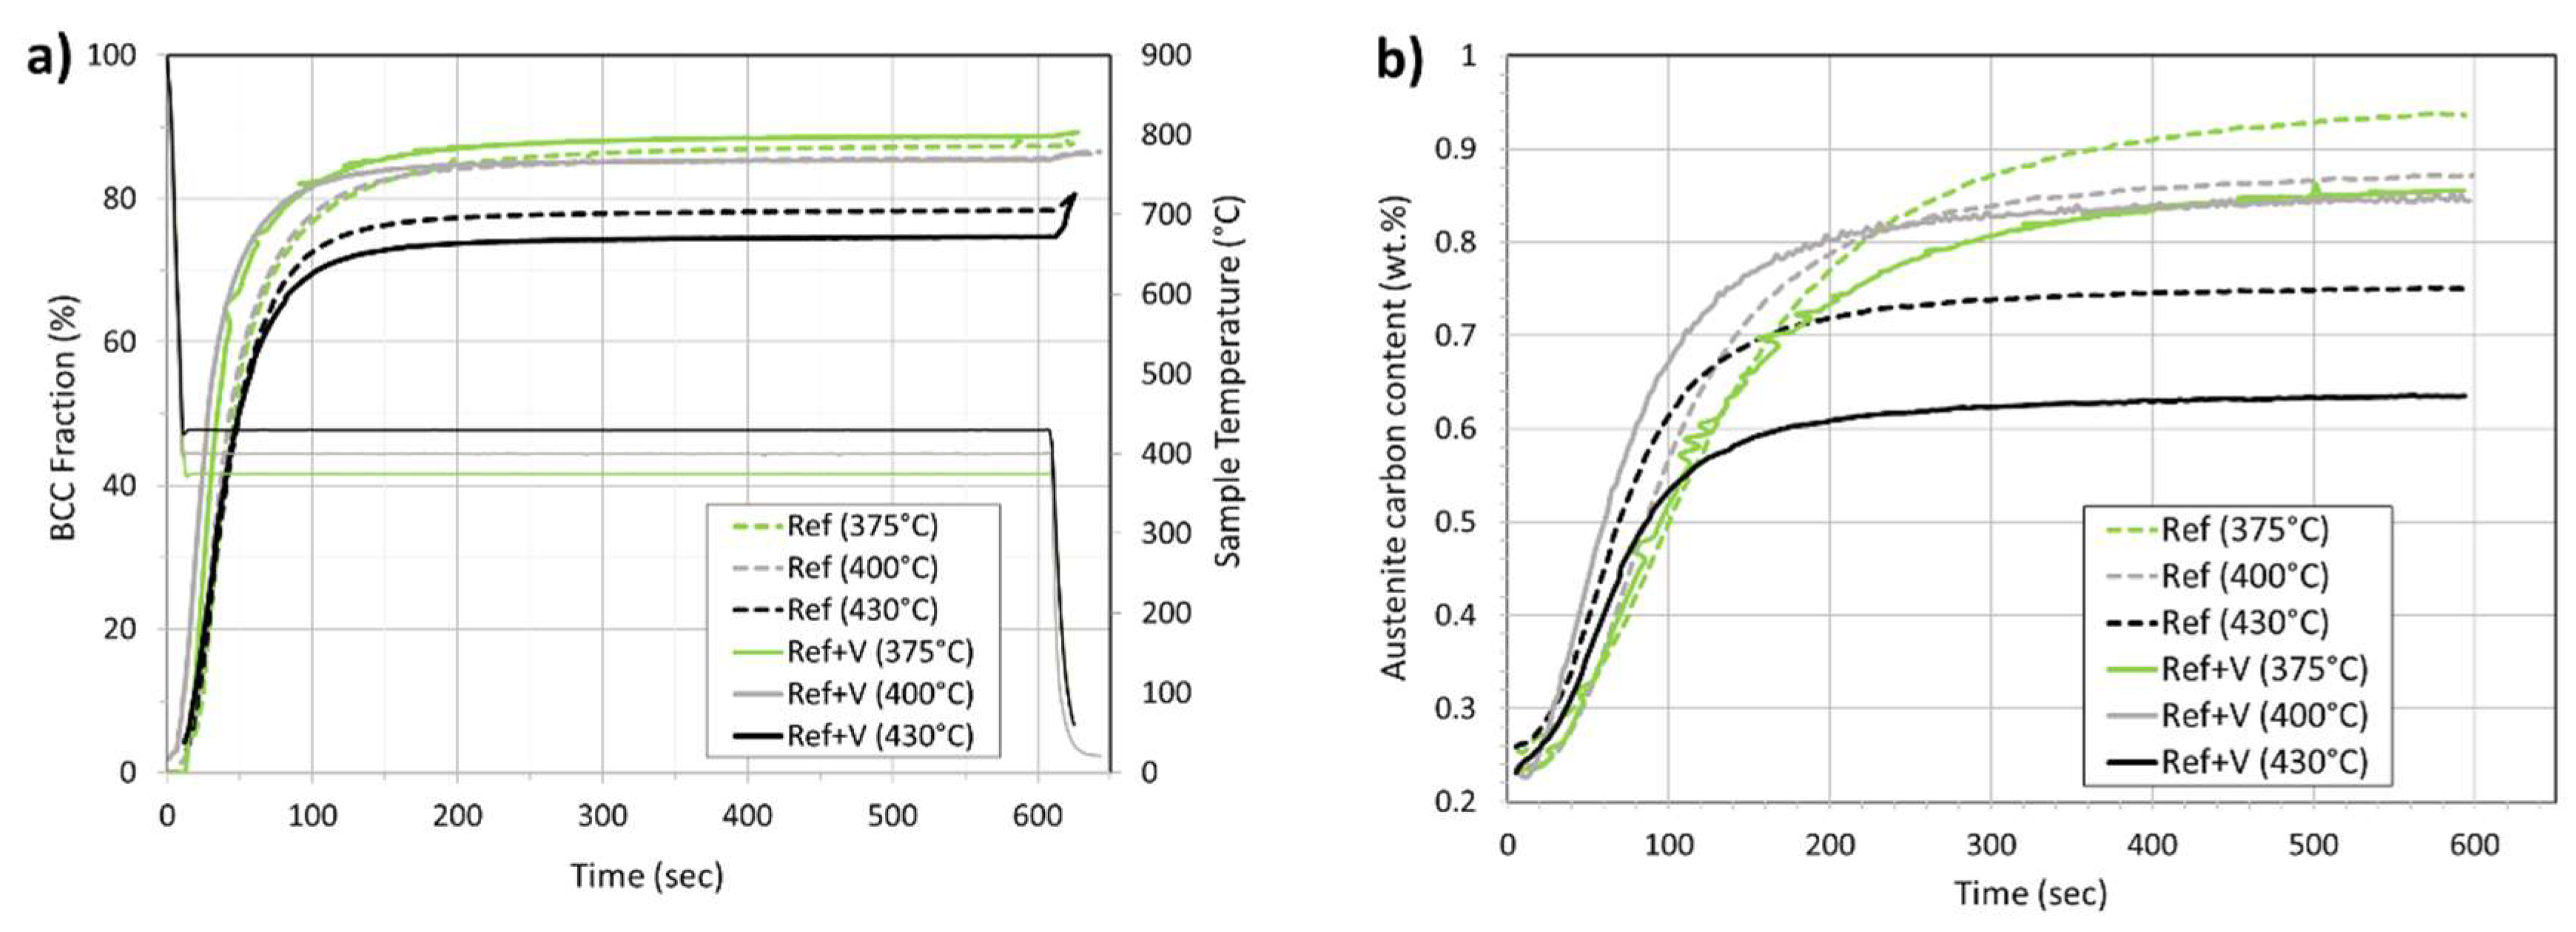
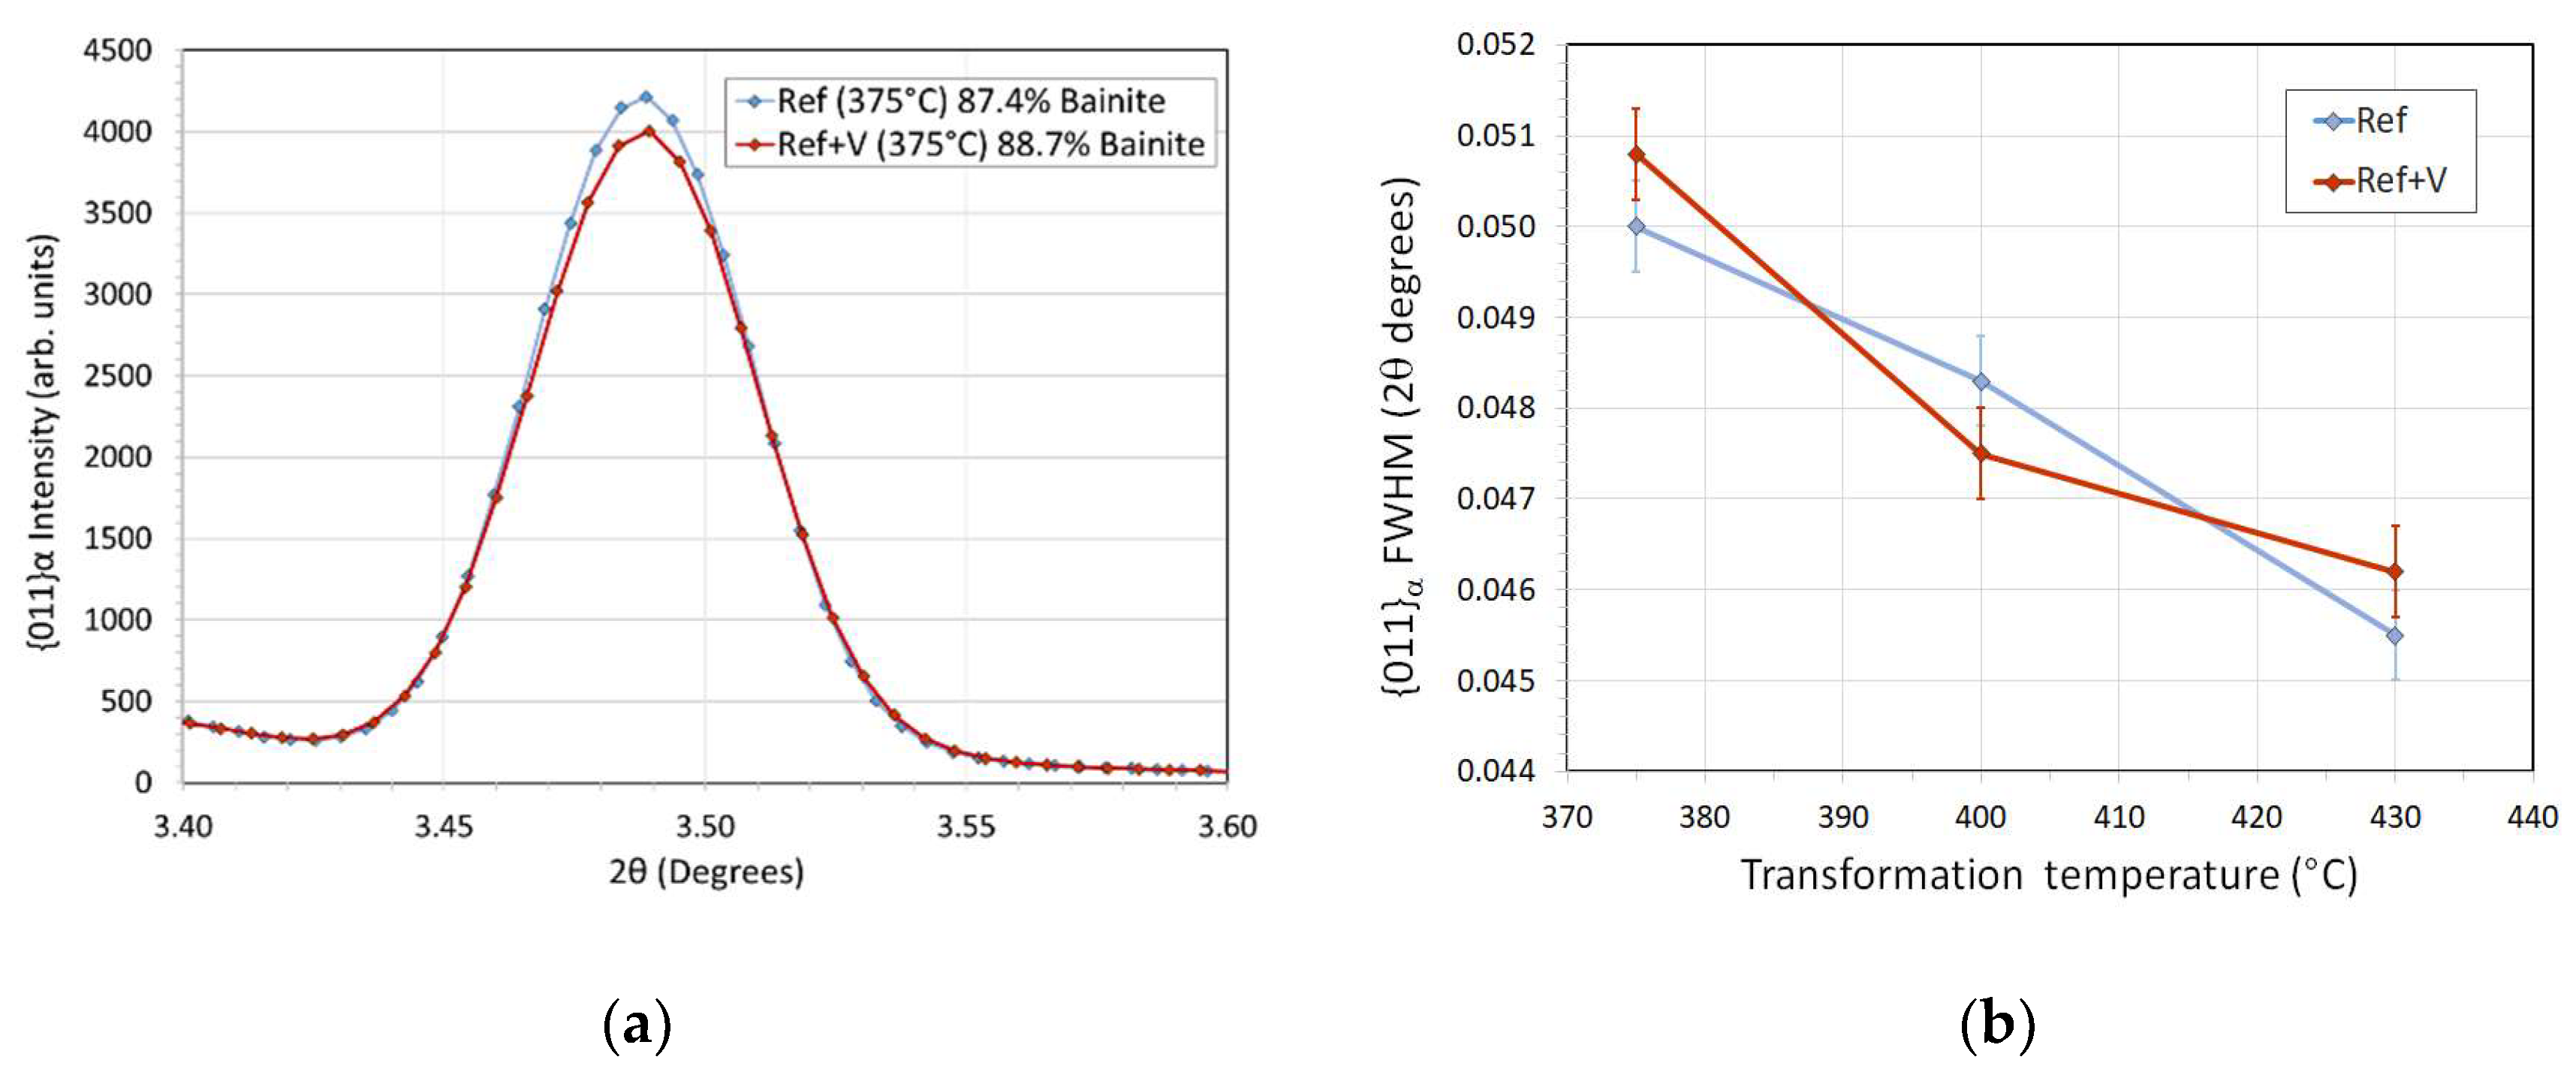
3.3. Synchrotron XRD—Phase Fractions, Carbon Partitioning and Dislocation Densities.

The evolution of the bcc phase fraction with time and temperature can be readily determined from the in-situ XRD data. Figure 4a shows the results obtained for the Ref and Ref+V alloys isothermally transformed at 375 °C, 400 °C and 430 °C. Time t = 0 s on the horizontal axis corresponds to the start of the fast cooling ramp after soaking at 900 °C. The isothermal section ends at t = 612 s. At this point, any unstable austenite transforms to martensite during the final cooling step. The amount of martensite formed during secondary cooling is very limited except for the Ref+V alloy transformed at 430 °C. Although the HEXRD detection limit for ferrite is excellent (0.1% volume fraction) there is a large mathematical uncertainty in the calculated volume fractions for ferrite fractions < 5% during the refinement procedure. This is partly due to the highly textured nature of the very first ferrite nuclei. In consequence only data with >5% bcc fraction is reported. The phase fractions are summarized in Table 3 (uncertainty ± 1%).
Following current theory, the total amount of bainite formed increased as the isothermal transformation temperature decreased (Figure 4a) and the RA fraction followed the opposite trend (Table 3). From the HEXRD data, the addition of vanadium had virtually no effect on the final bainite fraction after transformation at 375 °C and 400 °C and introduced a slight decrease at 430 °C. It had no influence on the final fraction of retained austenite at any transformation temperature, although it did increase the unstable austenite content at 430 °C. This slight excess austenite transformed to give 5.9% martensite fraction during final cooling, compared to only 2.5% for the Ref alloy under identical conditions. The bainite start transformation temperature, Bs, defined here as the temperature at which 5% of the final bainite fraction is detected, occurred either at or very close to the isothermal temperature for all of the trials, except for Ref+V at 400 °C. The time required to complete 95% of the bainite transformation decreased as the transformation temperature is lowered—this is expected as the thermodynamic driving force for austenite decomposition increases. The addition of vanadium appears to very slightly accelerate the transformation, but the effect is not significant.
The magnitude of the RA fraction detected by EBSD was lower than the HEXRD data by a factor of >2 and the MA fraction was much higher. Other authors have reported analogous discrepancies with similar bainitic steels [4]. Either more than 50% of all RA is contained in films and islands that are below the EBSD resolution limit (80 nm step size) or it is unstable and transforms to martensite during the specimen preparation. Nevertheless, all techniques show that the same trends are followed. For both steels, the mean MA island size decreased as the transformation temperature was lowered. However, a significant additional refinement from the vanadium addition was apparent at 375 °C where the mean EBSD MA island size in Ref+V was 0.38 μm2 compared to 0.53 μm2 for the Ref alloy.
The evolution of Cγ as the bainite transformation progresses can be seen in Figure 4b. Comparing Figure 4b with Figure 4a, it is interesting to note that partitioning of carbon to austenite follows a sigmoidal type kinetic that is much slower than the bainite formation rate. Indeed, at the lowest transformation temperature partitioning is still active at the end of the isothermal plateau (600 s), even although the bainite transformation stopped more than 300 s before. The final RA carbon content in both alloys (Table 5) increased monotonically with decreasing transformation temperature in agreement with the T0 model [25].
From Figure 4b and Table 5, the addition of vanadium changed the austenite carbon enrichment, i.e., Cγ was systematically lower in Ref+V at the end of transformation, for all transformation temperatures. The difference was large at 430 °C and at 375 °C but very small at 400 °C. As all of the Ref+V samples were machined from the same plate and processed identically, there is unlikely to be any variation in the fraction of carbon trapped in vanadium carbide precipitates formed prior to the fast cooling step. Now, for a fixed transformation temperature Table 3 shows that the RA fraction is the same for both alloys, so these data suggest that vanadium is in some way restricting the amount of carbon available for partitioning to austenite. Further, the severity of the effect may have a complex temperature dependence. This could be related to carbon trapping by undissolved prior VC precipitates or the formation of new VC/VxCy clusters in bainitic ferrite. Alternatively, vanadium may promote faster cementite formation in bainite. It is also possible that vanadium could directly consume some of the carbon partitioned to austenite by precipitating as VC inside highly enriched austenite islands. Another theory is that solute vanadium retards recovery in bainitic ferrite leading to a higher defect (dislocation) density that in turn increases the effective carbon solubility. These points are discussed further in the next sections.

Measuring Dislocation Densities

The dislocation density in bainitic ferrite at the end of the isothermal transformation is a critical parameter in evaluating the structure/properties relationship of these steels. TEM imaging can be used to estimate dislocation densities on a microscopic scale (as long as the foil thickness is known), however the highly disorganized nature of these microstructures (see the next section) would require extensive sampling to avoid serious errors in determining the average dislocation density. HEXRD can provide an accurate measurement of global dislocation densities [26]. Normally, Williamson–Hall (W–H) or Warren–Averbach (W–A) type analyses are used to isolate the contribution to the full width half maximum (FWHM) peak broadening from microstrain and hence determine the dislocation density. An attempt was made to calculate the dislocation densities in bainitic ferrite from the {110}α, {200} α, {211} α, {220} α and {310} α peak line broadening (after subtraction of the contribution from instrumental broadening) using the Williamson–Hall (W–H) method [27,28]. Unfortunately, the W–H values for dislocation densities were unphysically high for both alloys, almost certainly because tetragonality-induced peak splitting was present. However, the W–H plots did show a strong linear dependence on sin θ, indicating that strain broadening and not crystallite size was the major constituent. The degree of influence of vanadium on the dislocation density in bainitic ferrite was estimated by comparing the angular width at half maximum of the {011}α peaks from both alloys at the end of the isothermal hold (Figure 5a,b). The {222}α reflection, whose angular width is less sensitive to tetragonality than {011}α, would be a better choice for this. However, as there is almost perfect superposition between {222}α and {311}γ reflections, these peaks cannot be separated. Based on the trends seen in the W–H plots, it is reasonable to interpret Figure 5b as a qualitative plot of the variation of dislocation density with transformation temperature. For both steels, the dislocation density was highest during transformation at 375 °C and linearly decreased as the temperature increases. From Figure 5b the absolute difference in the {011}α FWHM of Ref and Ref+V was never more than 1.7% at any transformation temperature (measured after 600 s). As this is comparable with the uncertainty in the FWHM measurement, it is not possible to demonstrate that there is any significant difference in the dislocation density of bainitic ferrite due to vanadium additions.

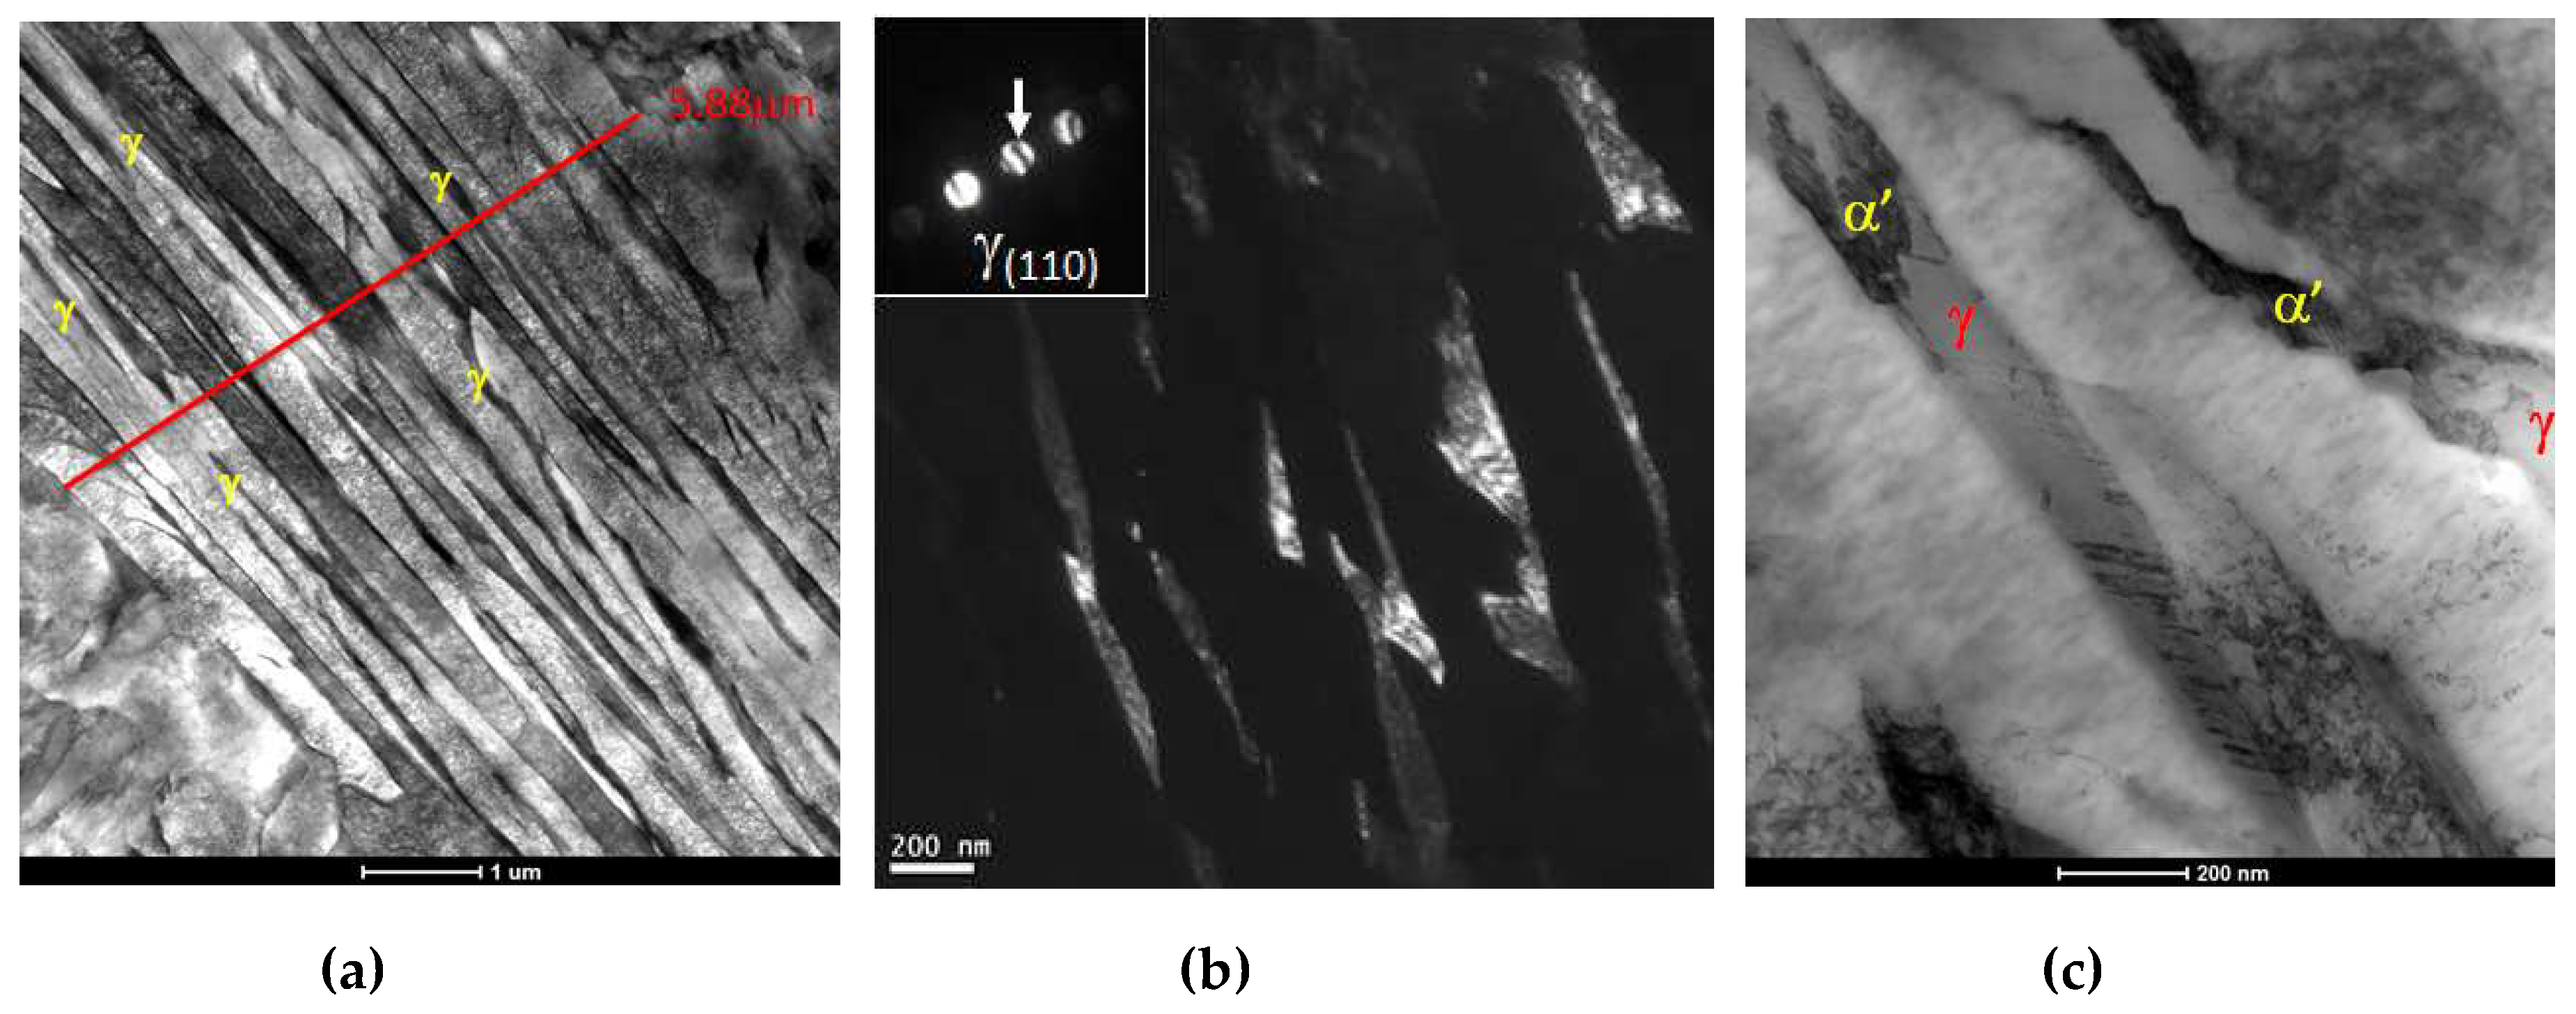
3.4. TEM—Microstructure

Thin foil samples from all of the specimens listed in Table 3 were examined in the TEM. Consistent with Figure 1, the matrix phase was lath bainite (Figure 6a) with thin (<100 nm) films of retained austenite situated between the bainite laths (Figure 6b). Some martensite was detected at higher transformation temperatures, usually associated with the RA films (Figure 6c). The linear defects visible in the austenite lath of Figure 6c are most likely epsilon martensite. Other areas showed plate or granular bainite (Figure 7). Overall, very few cementite precipitates were observed, in agreement with the HEXRD findings.
The bainitic lath size was estimated by selecting blocks with lath boundaries that were normal to the foil surface and measuring the average distance between the lath boundaries (Figure 6a). The results can be seen in Table 4 and in Figure 7. The heterogeneous nature of these microstructures makes it very difficult to determine a reliable value for the lath width and it is impossible to say from the data that there is any significant difference between the Ref and Ref+V specimens. The bainite lath width actually appears to increase slightly with decreasing transformation temperature for the Ref alloy, which is contrary to current theory [25]. However, the scatter in the measurement is large and the trend could be misleading.
Figure 8a shows a bright field image of plate bainite containing RA films in Ref+V transformed at 400 °C. Figure 8b is the same area superimposed with a vanadium EDX chemical map and Figure 8c shows a carbon EDX map of the same region. Even although EDX carbon maps are not quantitative, carbon enrichment in retained austenite films is qualitatively obvious. Some coarse and fine precipitates are visible in Figure 8a. The chemical map in Figure 8b confirms that the majority of these particles contain vanadium. Interestingly, there is little evidence from carbon or nitrogen (not shown) maps that these are classical carbide or nitride precipitates. The largest of these particles are aligned, probably along austenite grain boundaries formed during hot rolling as their position is clearly uncorrelated with either the bainitic structure or the retained austenite films. In fact, the V precipitate density in retained austenite appears to be quite low, compared to the surrounding ferrite.
Most of the particles observed in Ref+V specimens transformed at 400 °C and 430 °C contained vanadium with small amounts of carbon and nitrogen being occasionally detected, especially for the larger precipitates (Figure 9e). However, at 375 °C some of the particles contained V+Mo (Figure 9a–d). An equilibrium calculation (not shown) predicted that Mo enrichment of V(C,N) is only significant at temperatures below 800 °C, suggesting that these particles formed in ferrite.

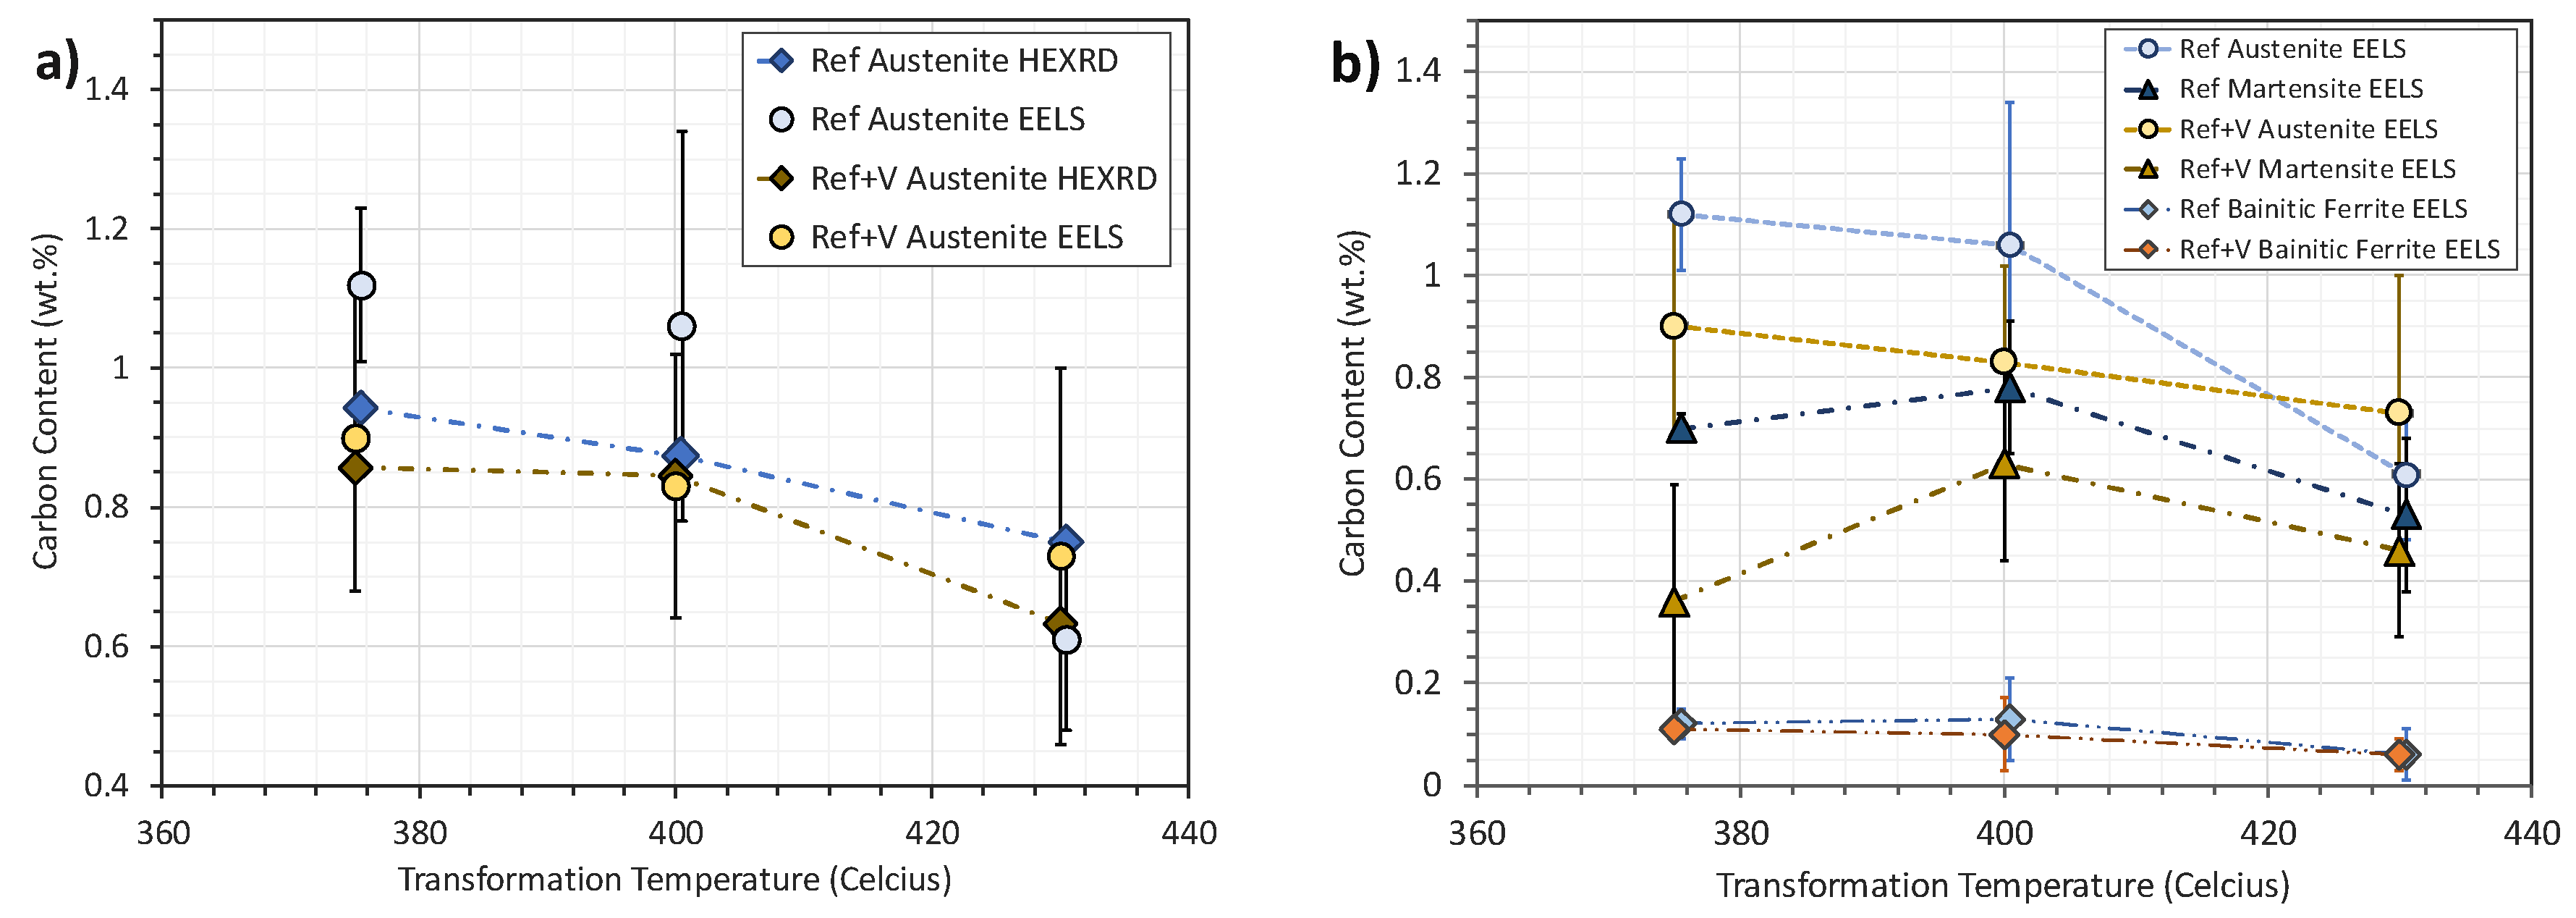
Measuring the Local Carbon Contents

The local carbon content, Cγ, in a number of retained austenite and martensite islands was measured using a standards-based EELS technique [18]. At a carbon concentration level of 0.8 wt. % the EELS measurement precision was ±4% and the detection limit for solute carbon was 0.03 wt. %. The ex-situ EELS results for Cγ were averaged and compared in Figure 10a with the in-situ HEXRD synchrotron data from Figure 4b and Table 5. Note that the error in the HEXRD carbon measurement (±0.011 wt. %) is too small to show in Figure 10a. The error bars in the EELS data are not measurement errors but rather represent the standard deviation in the carbon contents obtained from different austenite islands. Clearly, there is a wide island-to-island scatter in Cγ, as previously noted for TRIP steels [18].
From Figure 10a, the global HEXRD measurement and the local EELS values both predict the same trend of decreasing Cγ with increasing transformation temperature. For Ref+V (yellow and brown points), the mean EELS data show very close agreement with HEXRD, especially bearing in mind the scatter in RA island carbon contents. The agreement for Ref (light blue and dark blue points) was slightly less good, but the overall trend was the same. In Figure 10b the mean carbon content in martensite Cα′ is compared with Cγ from the EELS data. As expected, martensite islands contained less carbon than stable retained austenite. However, it is interesting to note that on average Ref+V martensite contained less carbon than Ref, i.e., Ref+V austenite appeared to be more stable, especially at lower transformation temperatures, and both alloys show Cα′ (375 °C) < Cα′ (400 °C). These observations clearly show that RA stability is not solely determined by carbon content [29].
If all the available carbon diffused into retained austenite, then the lever rule would predict significantly higher concentrations, Cγ than those found in Table 5. In the absence of any significant precipitation this implies that bainitic ferrite is supersaturated in carbon. EELS analyses were therefore carried out to try to measure Cb, the bainitic ferrite carbon content. These measurements were made in regions of bainitic ferrite where there were no obvious signs of carbide precipitation. It was observed that Cb was heterogeneous—in areas close to austenite laths usually no carbon was detected (i.e., Cb < 0.03 wt. %). The experimental values for Cb given in Table 5 and plotted in Figure 10b were determined by averaging EELS measurements from bainitic ferrite far from austenite laths. The experimental Cb results can be compared with values calculated from a simple carbon mass balance using the phase fraction data in Table 3 and the experimental values for Cγ and Cα in Table 5. The two show very good agreement (Table 5). Evidently, bainitic ferrite remained highly supersaturated in carbon for both alloys, hence the tetragonality problem encountered with the W–H analysis. Cb increased as the transformation temperature decreased, in accordance with theory [30]. There appeared to be a slight influence of vanadium on Cb at 375 °C and 400 °C but the difference was within the experimental error. The carbon mass balance calculations in Table 5 suggest that vanadium additions increased Cb. More experimental work is required to confirm this.

4. Discussion

The yield stress σe of a single phase fully bainitic structure can be expressed as the sum of contributions:
σ e = σ 0 + σ s s + σ d + σ p   + σ L
where σ0 is the Peierls stress for pure iron, σss is the contribution from solid solution hardening, σd is the strengthening due to forest dislocations, σp is due to precipitation strengthening and σL is the hardening due to grain or lath size dependence. As the interest here lies in explaining the difference in strength between Ref and Ref+V shown in Figure 3, the first two terms on the right side of Equation (1) can be neglected by assuming there is no difference in Cb and that small amounts of vanadium in solid solution have a negligible influence so that:
Δ σ e = Δ σ d + Δ σ p   + Δ σ L
Figure 5a,b show that the dislocation term Δσd is very small. This leaves two terms to evaluate; the contribution from precipitation strengthening, Δσp and a size dependent term, ΔσL. The precipitation term consists of two distinct components; strengthening from (a) precipitates inherited from prior processing steps and (b) precipitates formed at the isothermal transformation temperature. The two cases are considered separately below.

4.1. Strengthening from V Precipitation in Austenite and Ferrite

The presence of 1.8 wt. % silicon strongly inhibits cementite formation in these steels [12]. This was confirmed by the lack of evidence for Fe3C in the TEM images and the absence of any cementite reflections in the HEXRD data. In view of the scarcity of these precipitates, there is no evidence to suggest that vanadium additions have a significant influence on their size, volume fraction or distribution or that they make a measurable contribution to the mechanical properties of these alloys. Therefore, cementite precipitation can be omitted from further discussion.
In order to restrict austenite grain growth the choice was made to austenitize at 900 °C, which is below the calculated solution temperature of 1067 °C for V(C,N) in Ref+V. Consequently, some undissolved vanadium-containing particles are present before the bainitic transformation occurs (Figure 8 and Figure 9). In those images a majority of rather coarse (20–40 nm) vanadium particles can be seen, along with some finer (5–10 nm) precipitates. It must be emphasized that many areas showed little or no evidence of V precipitation, so that the average particle density observed in the TEM was actually quite low. Further, a close examination of the carbon and nitrogen maps suggests that many of these vanadium-rich regions are not carbides or nitrides and in fact could be due to local segregation.
An anisothermal kinetic precipitation calculation was carried out with the MatCalc 6 code in order to determine the amount of V(C,N) remaining undissolved before the bainitic transformation. Figure 11a shows the thermal path of the simulation. Starting at 1220 °C, hot rolling is represented by a uniform cooling rate of 10 °C/s in the austenite domain. This is decreased to 2 °C/s to represent air cooling in ferrite from 700 °C to room temperature. The material is then reheated to 900 °C at a constant rate of 3 °C/s and held for 120 s before quenching. Two types of vanadium precipitates were simulated; the first class nucleates in austenite on grain boundaries and triple points (assuming a 100 μm austenite grain size), the second nucleates in ferrite on dislocations and defects. The dislocation density in ferrite is assumed to be low, 1 × 10¹² m−2 due to the slow air cooling after finish rolling. No attempt was made to include strain induced precipitation in austenite as previous experimental studies indicate that very little vanadium is actually precipitated before this point [3,4]. Figure 11b shows the evolution of the phase fractions, Figure 11c the number density and Figure 11d the mean radii of the two types of precipitate.
At the end of re-austenitization, the mean diameter of the GB V(C,N) precipitates was predicted to be 120 nm with a very low number density of 1 × 10¹⁵/m3. The particles nucleated in ferrite were much smaller with a mean diameter of 9 nm and higher number density of 1.6 × 10¹⁹/m3. The total amount of V and C precipitated was actually very small: 0.0006 wt. % V and 0.0002 wt. % C. Compared to the TEM images, the calculated GB particle size appeared to be overestimated. However, the size of the dislocation nucleated precipitates correlated well with the thin foil images. Given their large size and scarcity, the strengthening effect of the GB particles can be neglected.
The contribution to strengthening made by the smaller precipitates can be estimated using the modified Ashby–Orowan equation proposed by Gladman [31]:
σ p = 0.538 G b ( f 0.5 X )   l n ( X 2 b )
where G is the shear modulus (80,000 MPa), b is the Burgers vector (2.5 × 10⁻⁴ μm), f is the volume fraction of precipitates and X is the mean particle diameter in μm. Substituting the appropriate values from Figure 11 gives σp = 8.5 MPa. Thus, the strength contribution from undissolved vanadium precipitates formed before the end of the re-austenitization step is expected to be very small.

4.2. Strengthening from V Precipitation in Bainite

Here the question of whether or not new vanadium precipitates can nucleate and grow during the fast cooling and isothermal bainitic transformation stage is addressed. It can be assumed that any further growth of the pre-existing vanadium particles is limited, as this would require low temperature long-range diffusion of vanadium across the (presumably) depleted zones surrounding those precipitates. Figure 12a is a calculated precipitation-time-temperature (PTT) diagram for V(C,N) formation in Ref+V calculated using the MatCalc 6 code [32] assuming a constant dislocation density of 1 × 10¹⁴/m2 in ferrite. The blue dots show the cooling path of the Ref+V alloy. The high defect density decreased the nucleation time for V(C,N) by several orders of magnitude, but it is still not possible to nucleate vanadium particles in any ferrite that might form during cooling.
A PTT section from a lower temperature region corresponding to the isothermal bainitic transformations is shown in Figure 12b. Here the dislocation density was increased to 5 × 10¹⁴/m2, which is a reasonable value for lower bainite [1]. The simulation predicts that no V(C,N) could nucleate during the transformation times tested here. In fact, the temperature needs to be raised to almost 500 °C before any detectable precipitation can occur. The evidence points to the conclusion that no new vanadium precipitation occurred during the bainitic transformations studied here and that the precipitates observed in Figure 8 and Figure 9 were all formed prior to bainite. The Δσp strengthening term is thus a constant for all three transformation temperatures.
Even if classical precipitates do not form, the possibility that vanadium could influence the mechanical properties by segregating or clustering at a finer scale during the bainitic transformation is not precluded. Sourmail et al. [3] could not find any vanadium segregation at all in a medium carbon forging steel transformed at 450 °C using 3D tomographic atom probe reconstructions. However, many vanadium-rich areas that did not appear to contain either C or N were observed and these could well be an indication of clustering or segregation to boundaries and defects. Further investigations, beyond the scope of this work, are required.

4.3. Size-Dependence Effects

There is no doubt that the bainite matrix of both alloys becomes significantly stronger as the transformation temperature decreases from 430 to 375 °C (Figure 3). Following the current literature, a combination of packet and/or block size and/or lath refinement should be observed as the transformation temperature decreases. There are many arguments as to what is the best effective length L to use and whether yielding has a Hall–Petch or simple reciprocal type dependence on L [23]. The EBSD analysis of low angle (θ < 5°) misorientations representing lath boundaries and the TEM analysis of lath sizes (Table 4) did not show the expected monotonic temperature-dependence (although it should be stated that the size variations were subtle and the trends might be being distorted by experimental error). It can be concluded that, based on the experimental data, the behavior shown in Figure 3 could not be explained by variations in the ΔσL term.

4.4. Strengthening from Minority Phases

The hardness measurements in Figure 3 involved plastic deformation and hence depended to some extent on the work hardening behavior of the alloys. The latter is greatly influenced by the minority retained austenite and martensite phases. In particular, the stability of retained austenite islands will play an important role. Table 3, Table 4 and Table 5 show that vanadium additions introduced four microstructural changes in Ref+V that may have a bearing on this:
  • Retained austenite in Ref+V contained less carbon, although the volume fraction of stable austenite was the same in both alloys.
  • Both OM and EBSD data show that MA islands in Ref+V were refined at the two lowest transformation temperatures.
  • Thermal martensite in Ref+V contained less carbon, especially at lower transformation temperatures.
  • At higher transformation temperatures (430 °C) more thermal martensite formed in Ref+V.
Points 1–3 indicate that retained austenite in Ref+V transformed at low temperatures must be being stabilized by a strong size effect, i.e., the RA stability is not governed uniquely by the local chemistry [29]. This is very striking at 375 °C where the mean Ref+V thermal martensite carbon content was much lower than the Ref alloy (Figure 10b). From this together with point 4 two different transformation temperature dependent strengthening mechanisms to qualitatively explain the hardness response in Figure 3 can be proposed:
  • At 375 °C the retained austenite in Ref+V was significantly stabilized by size refinement. This should result in a higher work hardening coefficient and hence higher hardness, mitigated by the fact that any strain induced martensite will contain less carbon.
  • At 400 °C minority phase strengthening was at a minimum and only weak precipitation strengthening was apparent.
  • At 430 °C there was no size effect operating so the austenite stability should actually reverse. However, this was compensated by more thermal martensite formation in Ref+V at this transformation temperature.

5. Conclusions

The influence of vanadium additions on isothermally formed bainite in medium carbon steels containing retained austenite was investigated using in-situ HEXRD and ex-situ electron microscopy techniques. In the range of transformation temperatures investigated (375–430°C) the main conclusions are:
  • Vanadium did not change the final fractions of bainite or of retained austenite.
  • There was no significant effect on the bainite reaction rate.
  • The presence of bainitic ferrite tetragonality hindered the quantitative dislocation density analysis. Qualitatively, there was no detectable effect of vanadium on the dislocation density in bainitic ferrite.
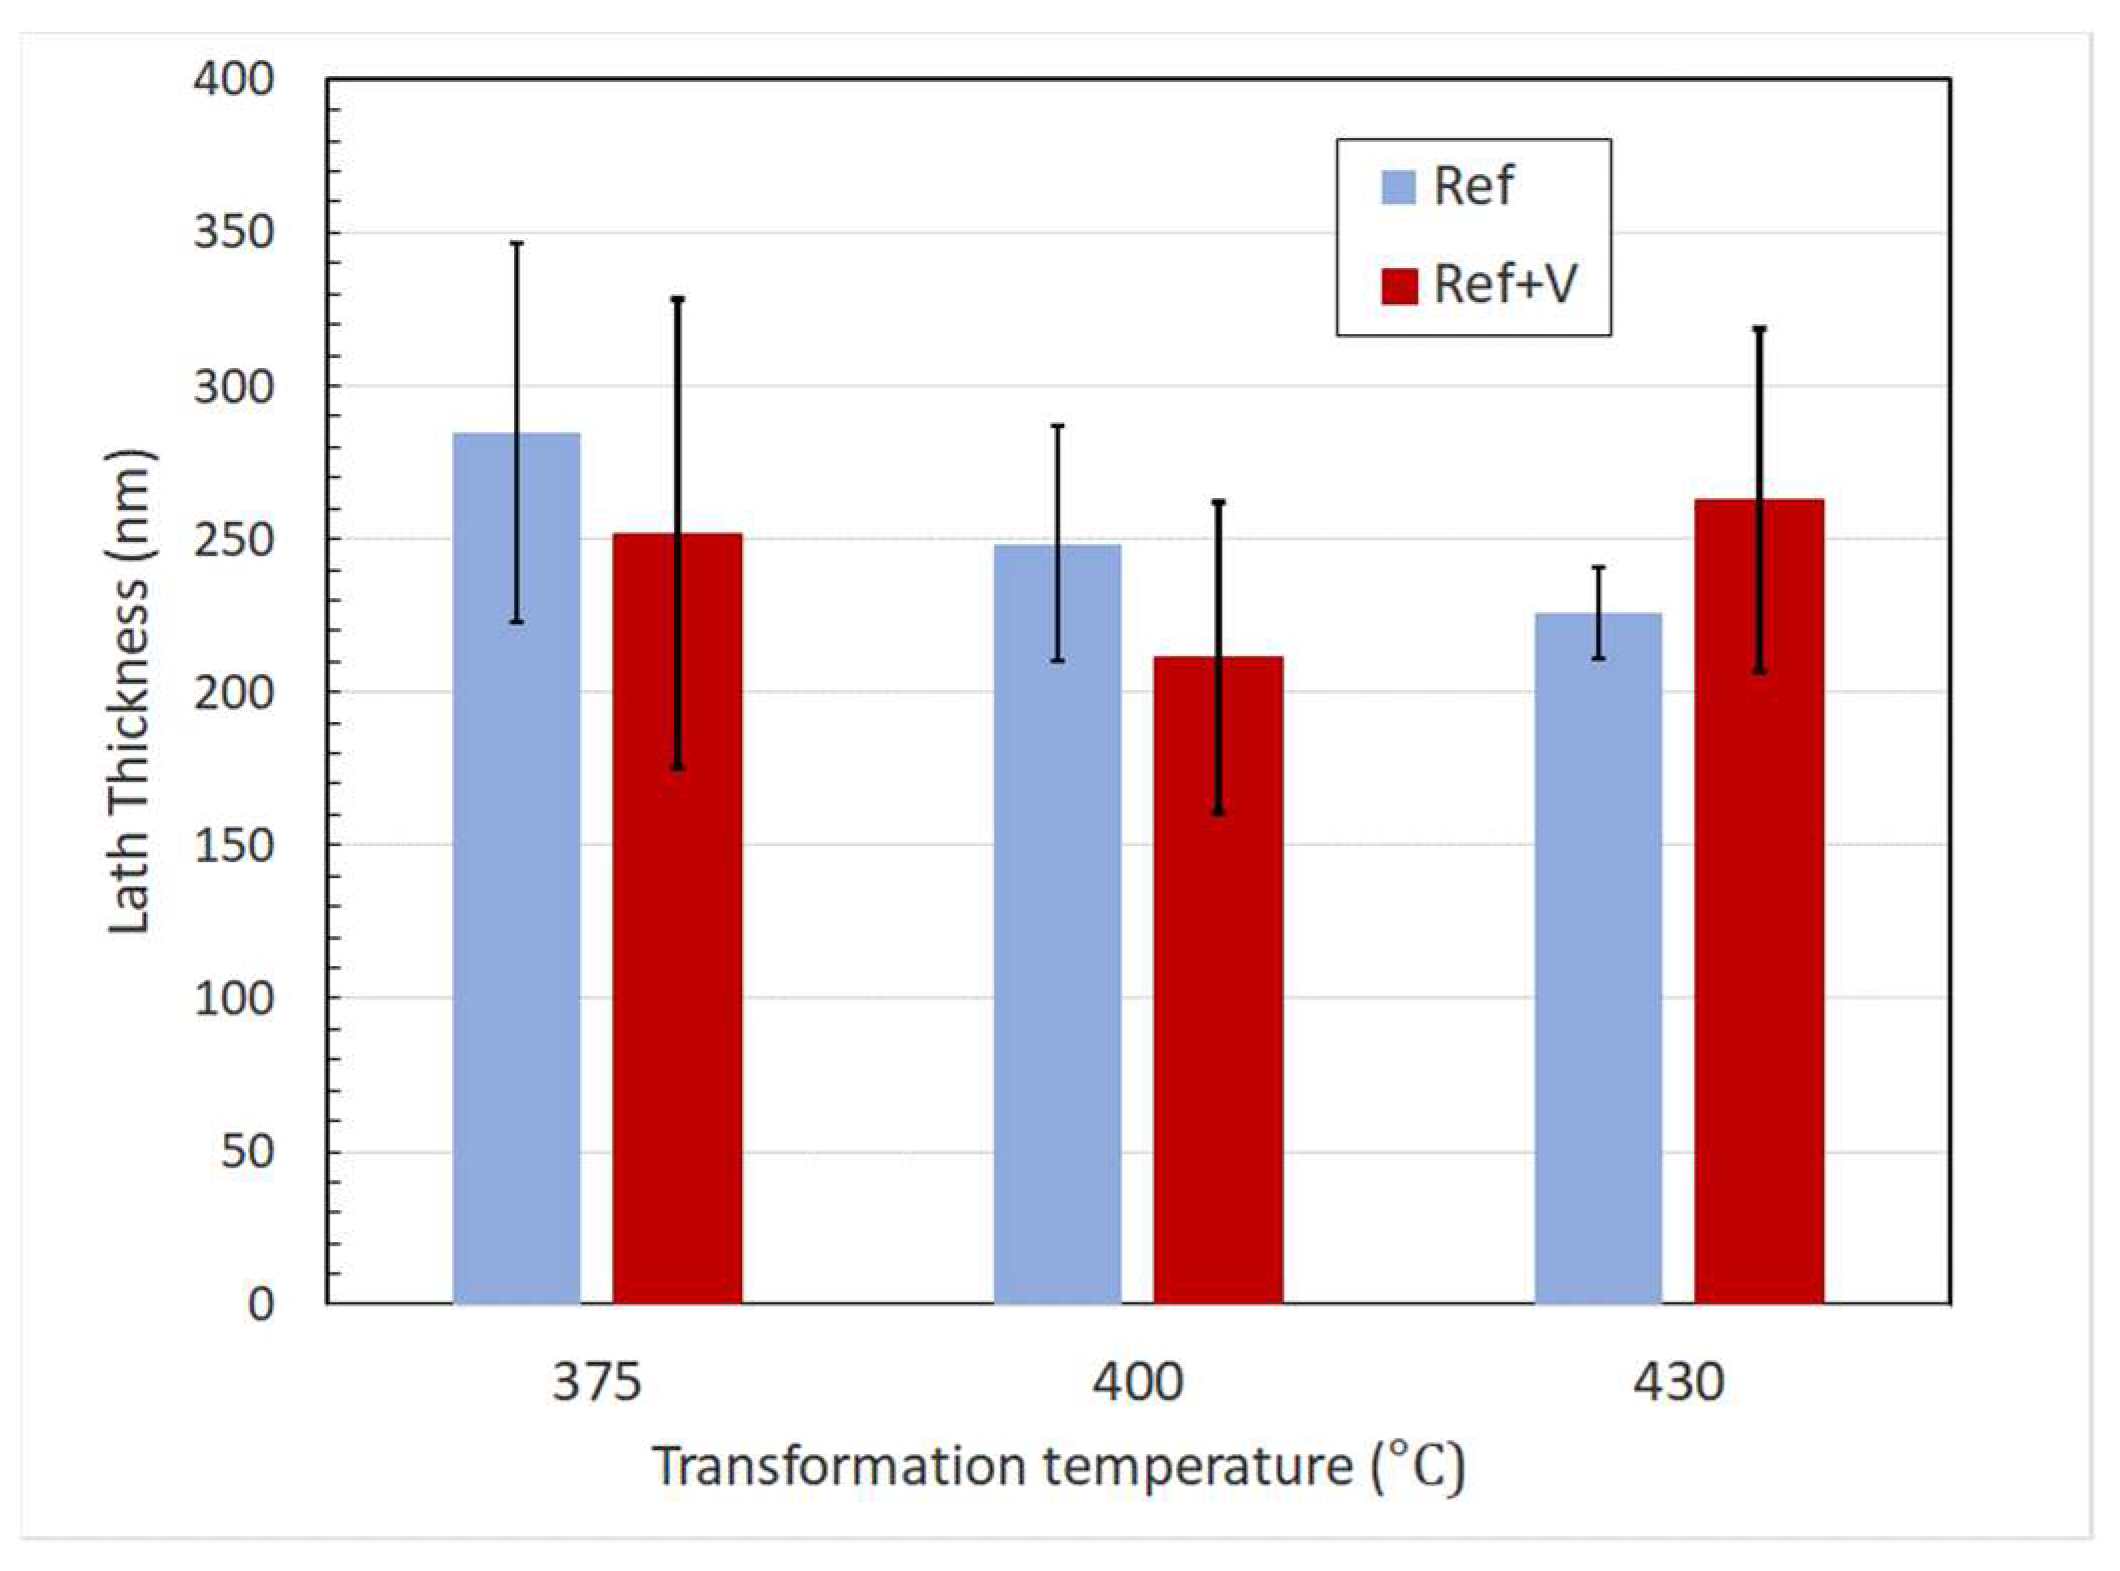
  • No clear influence of vanadium on bainite lath widths could be observed.
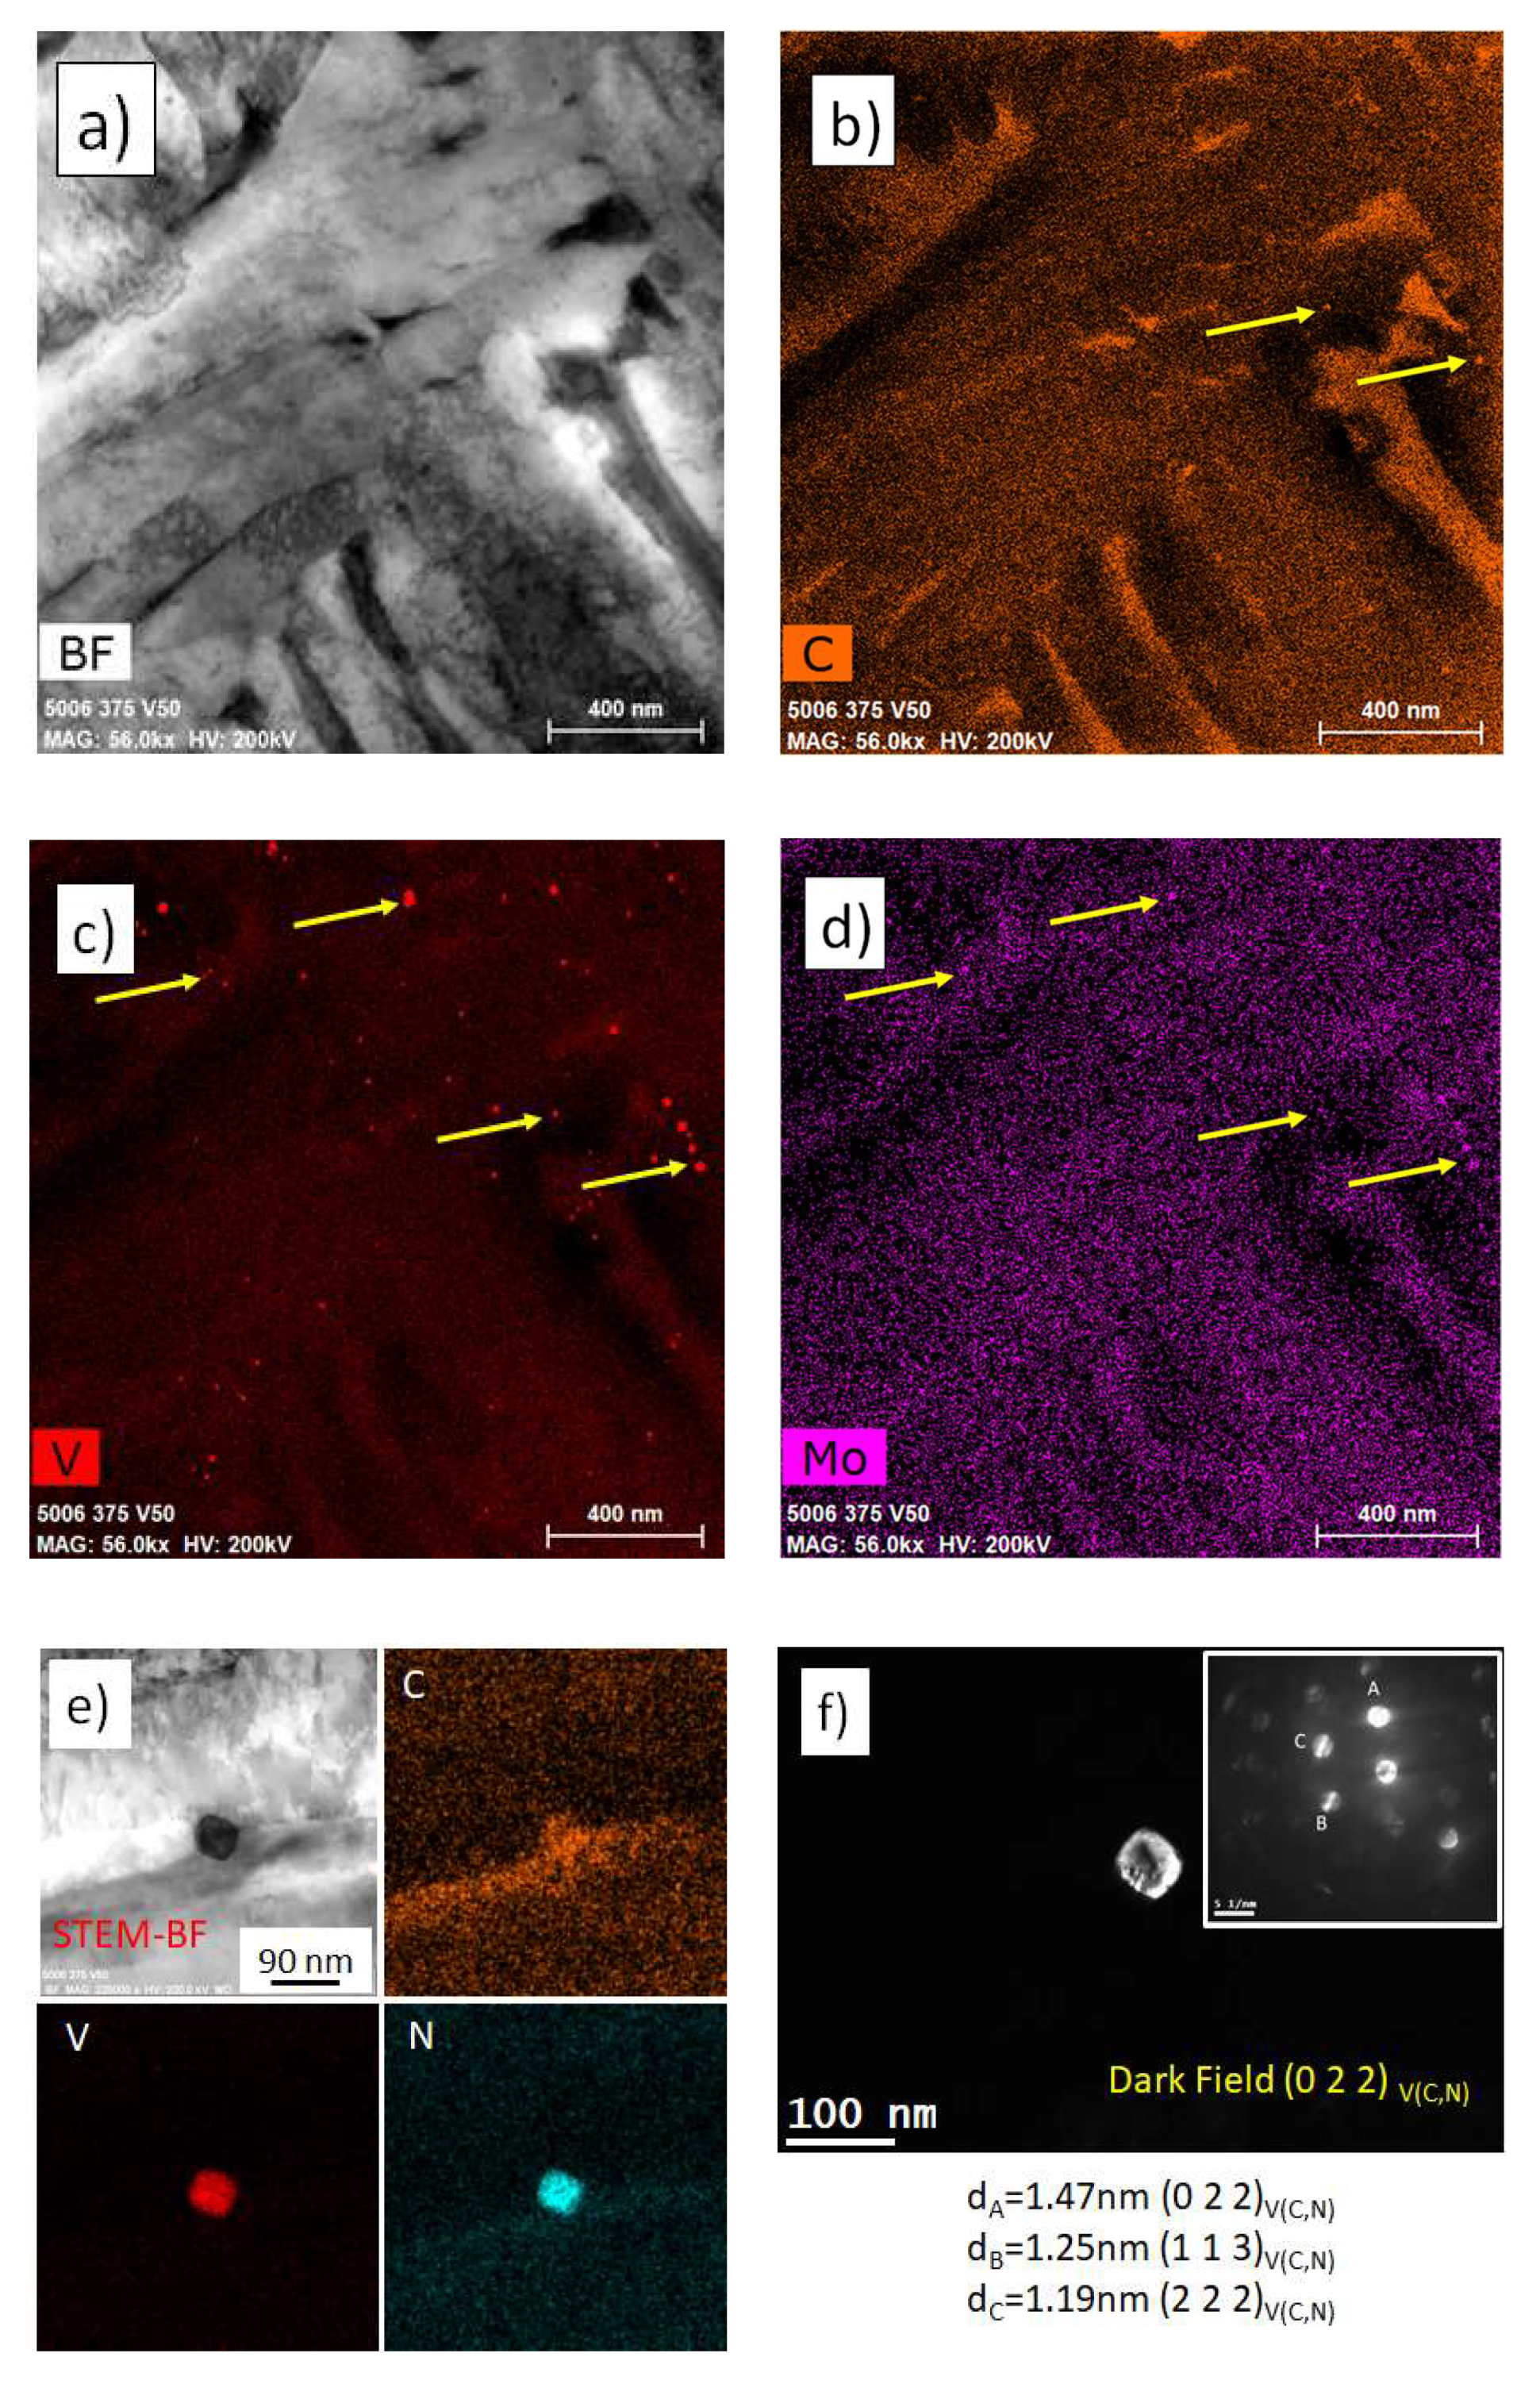
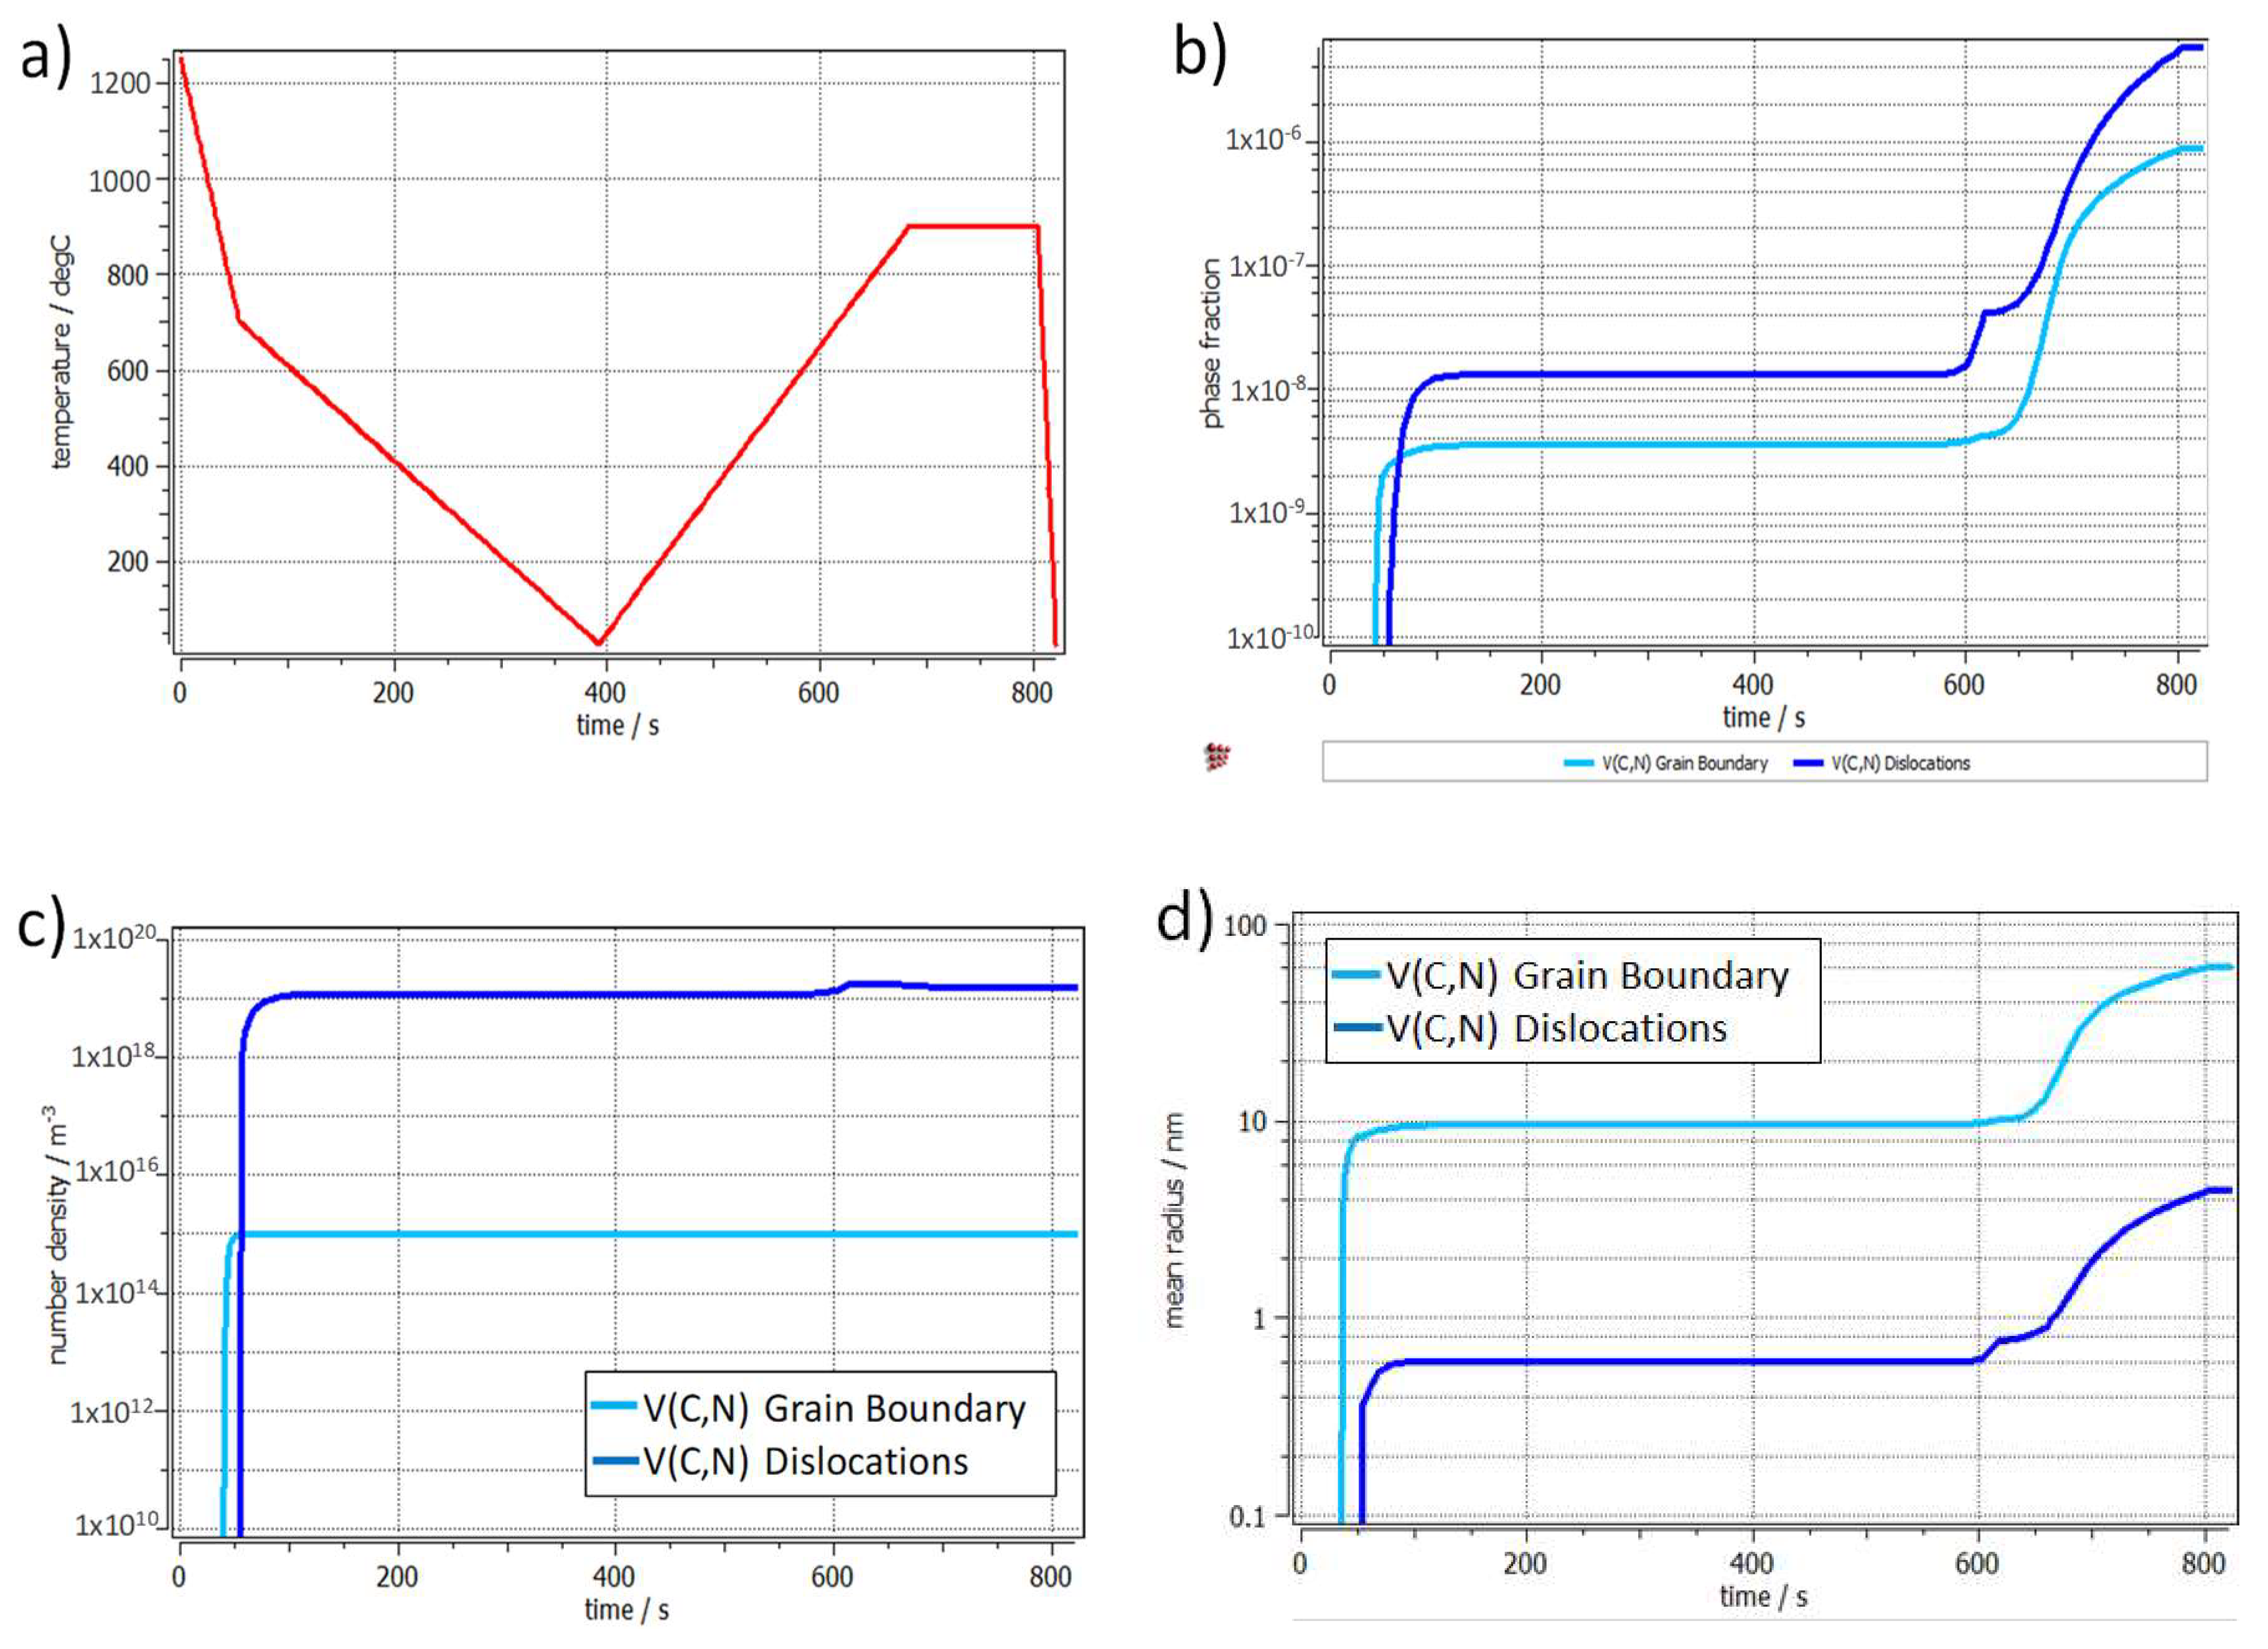
  • No significant vanadium precipitation occurred in bainite.
  • No direct evidence of bainitic ferrite carbon supersaturation levels showing a vanadium dependence was found. Indirect calculations (from carbon mass balance) suggest that Cb was slightly raised.
  • At low transformation temperatures, vanadium additions provided blocky MA and RA refinement.
  • Retained austenite carbon content was decreased. This is not believed to be due to competition with vanadium precipitation.
  • At low transformation temperatures (375 °C), retained austenite stability was enhanced due to a strong size effect.
  • More thermal martensite forms during cooling, especially after transformation at 430 °C.
  • Vanadium additions resulted in a modest increase in strength levels.
It is the author’s opinion that the main benefit of adding vanadium to these steels is to be found in the refinement of martensite and austenite islands at low transformation temperatures. This provides a strong size effect stabilization of RA that could result in a significant increase in the ductility. Further, refining of blocky martensite should improve the fracture toughness behavior. If more strengthening is required then a combination of vanadium with higher nitrogen levels should be studied.

Author Contributions

Conceptualization, C.S.; methodology, G.G., S.Y.P.A., C.S., F.F; formal analysis, I.P.; investigation, I.P., B.S.-A., G.G., S.Y.P.A., M.S.; writing—original draft preparation, I.P.; writing—review and editing, C.S., S.Y.P.A.; project administration, F.F. All authors have read and agreed to the published version of the manuscript.

Funding

This research was funded by the Canadian Office of Energy Research and Development (OERD) and the LABEX DAMAS (ANR-11-LABX-008-01) from Lorraine, France.

Acknowledgments

The authors would like to express their gratitude to the Canadian Office of Energy Research and Development (OERD) and the LABEX DAMAS (ANR-11-LABX-008-01) from Lorraine, France for their support. Finally, we wish to acknowledge the help and professionalism of all the staff at CanmetMATERIALS who participated in the study and in particular Jian Li for aid with the EBSD analysis.

Conflicts of Interest

The authors declare no conflict of interest.

References

  1. Fazeli, F.; Amirkhiz, B.S.; Scott, C.P.; Arafin, M.; Collins, L. Kinetics and microstructural change of low-carbon bainite due to vanadium microalloying. Mater. Sci. Eng. A 2018, 720, 248–256. [Google Scholar] [CrossRef]
  2. Garcia-Mateo, C.; Morales-Rivas, L.; Caballero, F.G.; Milbourn, D.; Sourmail, T. Vanadium Effect on a Medium Carbon Forging Steel. Metals 2016, 6, 130. [Google Scholar] [CrossRef] [Green Version]
  3. Sourmail, T.; Garcia-Mateo, C.; Caballero, F.G.; Cazottes, S.; Epicier, T.; Danoix, F.; Milbourn, D. The Influence of Vanadium on Ferrite and Bainite Formation in a Medium Carbon Steel. Metall. Mater. Trans. A 2017, 48, 3985–3996. [Google Scholar] [CrossRef]
  4. Wang, Z.; Hui, W.; Chen, Z.; Zhang, Y.; Zhao, X. Effect of vanadium on microstructure and mechanical properties of bainitic forging steel. Mater. Sci. Eng. A 2020, 771, 138653. [Google Scholar] [CrossRef]
  5. Scott, C.P.; Fazeli, F.; Amirkhiz, B.S.; Pushkareva, I.; Allain, S.Y.P. Structure-properties relationship of ultra-fine grained V-microalloyed dual phase steels. Mater. Sci. Eng. A 2017, 703, 293–303. [Google Scholar] [CrossRef]
  6. Rijkenberg, R.A.; Blowey, A.; Bellina, P.; Wooffindin, C. Advanced High Stretch-Flange Formability Steels for Chassis & Suspension Applications. In Proceedings of the 4th International Conference on Steels in Cars and Trucks (SCT2014), Braunschweig, Germany, 15–19 June 2014; pp. 426–433. [Google Scholar]
  7. Ioannidou, C.; Arechabaleta, Z.; Navarro-Lopez, A.; Rijkenberg, R.A.; Dalgliesh, R.M.; Kolling, S.; Bliznuk, V.; Pappas, C.; Sietsma, J.; Van Well, A.A.; et al. Interaction of precipitation with austenite-to-ferrite phase transformation in vanadium micro-alloyed steels. Acta Mater. 2019, 181, 10–24. [Google Scholar] [CrossRef] [Green Version]
  8. Scott, C.P.; Remy, B.; Collet, J.-L.; Cael, A.; Bao, C.; Danoix, F.; Malard, B.; Curfs, C. Precipitation strengthening in high manganese austenitic TWIP steels. Int. J. Mater. Res. 2011, 102, 538–549. [Google Scholar] [CrossRef]
  9. Gwon, H.; Kima, J.-K.; Shina, S.; Choa, L.; De Cooman, B.C. The effect of vanadium micro-alloying on the microstructure and the tensile behavior of TWIP steel. Mater. Sci. Eng. A 2017, 696, 416–428. [Google Scholar] [CrossRef]
  10. Lagneborg, R.; Siwecki, T.; Zajac, S.; Hutchinson, B. The Role of Vanadium in Microalloyed steels. Scand. J. Metall. 1999, 28, 186–241. [Google Scholar]
  11. Siwecki, T.; Eliasson, J.; Lagneborg, R.; Hutchinson, B. Vanadium microalloyed bainitic hot strip steels. ISIJ Int. 2010, 50, 760–767. [Google Scholar] [CrossRef] [Green Version]
  12. Matsumura, O.; Sakuma, Y.; Takechi, H. Enhancement of Elongation by Retained Austenite in Intercritical Annealed 0.4C-1.5Si-0.8Mn Steel. Trans. ISIJ 1987, 27, 570–579. [Google Scholar] [CrossRef] [Green Version]
  13. Perrard, F.; Scott, C. Vanadium Precipitation during Intercritical Annealing in Cold Rolled TRIP Steels. ISIJ Int. 2007, 47, 1168–1177. [Google Scholar] [CrossRef] [Green Version]
  14. Allain, S.Y.P.; Gaudez, S.; Geandier, G.; Hell, J.-C.; Gouné, M.; Danoix, F.; Soler, M.; Aoued, S.; Poulon-Quintin, A. Internal stresses and carbon enrichment in austenite of Quenching and Partitioning steels from high energy X-ray diffraction experiments. Mater. Sci. Eng. A 2018, 710, 245–250. [Google Scholar] [CrossRef] [Green Version]
  15. Available online: http://www.esrf.eu/computing/scientific/FIT2D/ (accessed on 18 March 2020).
  16. Rodriguez-Carvajal, J. Recent advances in magnetic structure determination by neutron powder diffraction. Phys. B 1993, 192, 55–69. [Google Scholar] [CrossRef]
  17. Cheng, L.; Bottger, A.; de Keijser, T.H.; Mittemeijer, E.J. Lattice parameters of iron-carbon and iron-nitrogen martensites and austenites. Scr. Metall. Mater. 1990, 24, 509–514. [Google Scholar] [CrossRef]
  18. Scott, C.P.; Drillet, J. A study of the carbon distribution in retained austenite. Scr. Mater. 2007, 56, 489–492. [Google Scholar] [CrossRef]
  19. Available online: https://www.matcalc-engineering.com/index.php/matcalc-software/matcalc-6 (accessed on 18 March 2020).
  20. Fazeli, F.; Scott, C.P.; Amirkhiz, B.S.; Pushkareva, I. Challenges with Design and Processing of Carbide-free Bainitic AHSS Sheets. In Proceedings of the International Symposium on New Developments in Advanced High-Strength Sheet Steels, Keystone, CO, USA, 30 May 2017; pp. 135–145. [Google Scholar]
  21. Venugopalan, D.; Kirkaldy, J. New Relations for Predicting the Mechanical Properties of Quenched and Tempered Low Alloy Steels. In Proceedings of the Hardenability Concepts with Application to Steel, Chicago, IL, USA, 26–28 October 1977; pp. 249–268. [Google Scholar]
  22. Andrews, K.W. Empirical Formulae for the Calculation of Some Transformation temperatures. JISI 1965, 203, 721–727. [Google Scholar]
  23. Zhu, K.; Bouaziz, O.; Oberbillig, C.; Huang, M. An approach to define the effective lath size controlling yield strength of bainite. Mater. Sci. Eng. A 2010, 527, 6614–6619. [Google Scholar] [CrossRef]
  24. Pavlina, E.J.; Van Tyne, C.J. Correlation of Yield Strength and Tensile Strength with Hardness for Steels. J. Mater. Eng. Perform. 2008, 17, 888–893. [Google Scholar] [CrossRef]
  25. Bhadeshia, H.K.D.H. Bainite in Steels; Maney Publishing: Leeds, UK, 2015. [Google Scholar]
  26. Takebayashi, S.; Kunieda, T.; Yoshinaga, N.; Ushioda, K.; Ogata, S. Comparison of the Dislocation Density in Martensitic Steels Evaluated by Some X-ray Diffraction Methods. ISIJ Int. 2010, 50, 875–882. [Google Scholar] [CrossRef] [Green Version]
  27. Williamson, G.K.; Hall, W.H. X-ray line broadening from filed aluminum and wolfram. Acta Metall. 1953, 1, 22–31. [Google Scholar] [CrossRef]
  28. Zak, A.K.; Majid, W.A.; Abrishami, M.E.; Yousefi, R. X-ray analysis of ZnO nanoparticles by Williamson–Hall and size–strain plot methods. Solid State Sci. 2011, 13, 251–256. [Google Scholar]
  29. He, S.H.; He, B.B.; Zhu, K.Y.; Ding, R.; Chen, H.; Huang, M.X. Revealing the role of dislocations on the stability of retained austenite in a tempered bainite. Scr. Mater. 2019, 168, 23–27. [Google Scholar] [CrossRef]
  30. Hulme-Smith, C.N.; Peet, M.J.; Lonardelli, I.; Dippel, A.C.; Bhadeshia, H.K.D.H. Further evidence of tetragonality in bainitic ferrite. Mater. Sci. Technol. 2015, 31, 254–256. [Google Scholar] [CrossRef] [Green Version]
  31. Gladman, T. The Physical Metallurgy of Microalloyed Steels; The Institute of Materials: London, UK, 1997. [Google Scholar]
  32. Available online: https://www.matcalc.at/wiki/doku.php?id=tutorials:t18 (accessed on 18 March 2020).
Figure 1. Optical Micrographs (Klemm etch) of Ref and Ref+V alloys isothermally transformed at 375 °C in the synchrotron (a) Ref and (b) Ref+V. The light colored phase is martensite/retained austenite.
Metals 10 00392 g001
Figure 2. Electron back scattered diffraction (EBSD) data from Ref and Ref+V alloys transformed at 375 °C: (a,b) Euler orientation maps with high angle (θ > 15°) boundaries shown; (c) low angle (θ < 5°) boundary size distributions; (d) misorientation frequencies and (e,f) image quality maps with superimposed austenite islands in red.
Metals 10 00392 g002
Figure 3. Vickers microhardness data from air-cooled as-rolled and isothermally transformed samples.
Metals 10 00392 g003
Figure 4. HEXRD data from Ref and Ref+V alloys as a function of the transformation temperature. (a) Body-centered cubic (bcc) phase fraction and (b) carbon content in austenite.
Metals 10 00392 g004
Figure 5. (a) HEXRD {011}α reflection for Ref and Ref+V transformed for 600 s at 375 °C. (b) Comparison of {011}α peak broadening for Ref and Ref+V transformed for 600 s at 375 °C, 400 °C and 430 °C.
Metals 10 00392 g005
Figure 6. (a) Bright field STEM image of the Ref alloy transformed at 430 °C; (b) dark field STEM image showing austenite films (γ(110) reflection) from Ref+V transformed at 430 °C and (c) bright field STEM image of Ref transformed at 430 °C showing RA partially transformed to martensite.
Metals 10 00392 g006
Figure 7. STEM measurement of bainite lath widths.
Metals 10 00392 g007
Figure 8. (a) Bright field STEM image of Ref+V transformed at 400 °C; (b) same as Figure 8a with a superimposed energy dispersive X-ray analysis (EDX) vanadium map (red) and (c) EDX carbon map (qualitative) from the same area.
Metals 10 00392 g008
Figure 9. Ref+V alloy transformed at 375 °C, (a) STEM bright field image, (b) EDX carbon map, (c) EDX vanadium map, (d) EDX molybdenum map from the same region, (e) STEM bright field image and EDX maps of a V(C,N) particle and (f) STEM dark field imaging and convergent beam electron diffraction (CBED) pattern confirming the crystal structure of the particle in e).
Metals 10 00392 g009
Figure 10. (a) Comparison of HEXRD and electron energy loss spectroscopy (EELS) carbon contents in austenite and (b) EELS carbon contents of austenite, martensite and bainitic ferrite. The error in the HEXRD carbon measurements is ±0.011 wt. % The error bars in the EELS data show the standard deviation in the range of the measured values.
Metals 10 00392 g010
Figure 11. (a) Simulation of the thermal path for V(C,N) precipitation in austenite and ferrite. (b) Calculated phase fractions of V(C,N) nucleated on GB and dislocation sites. (c) Precipitate number densities. (d) Mean radii.
Metals 10 00392 g011
Figure 12. (a) V(C,N) PTT in Ref+V ferrite containing 1 × 10¹⁴/m2 dislocations and (b) low temperature PTT for V(C,N) in Ref+V bainitic ferrite containing 5 × 10¹⁴/m2 dislocations.
Metals 10 00392 g012
Table 1. Chemical compositions of the studied steels, wt. %.
SteelCMnSiMoVAlN
Ref0.222.21.80.2-0.010.0028
Ref+V0.222.21.80.20.150.010.0027
Table 2. Experimental and calculated transformation temperatures.
SteelAe1 (calc)Ac1 (exp)Ae3 (calc)Ac3 (exp)Tsol V(CN)Bs (calc) [21]Ms (calc) [22]
Ref707 °C700 °C831 °C933 °C-423 °C375 °C
Ref+V713 °C748 °C840 °C975 °C1067 °C423 °C375 °C
Table 3. Phase fractions from synchrotron high energy synchrotron X-ray diffraction (HEXRD), EBSD and optical microscopy data.
AlloyAverage Cooling RateTransformation TemperatureBs (5%)Time for 95% CompletionHEXRD Final Bainite FractionHEXRD RA Fraction (25 °C)HEXRD Martensite FractionEBSD RA FractionEBSD MA FractionOM MA Fraction
Ref44 °C/s375 °C375 °C160 s87%12%0.3%5.4%1.5%5.1%
Ref50 °C/s400 °C400 °C129 s86%14%0.9%5.3%3.4%6.9%
Ref45 °C/s430 °C430 °C117 s78%19%2.5%NANA11.3%
Ref+V42 °C/s375 °C381 °C127 s89%11%0.6%4.8%5.4%2.3%
Ref+V50 °C/s400 °C504 °C94 s85%14%0.9%4.8%6.8%6.9%
Ref+V45 °C/s430 °C432 °C114 s75%19%5.9%NANA10.7%
Table 4. Microstructure parameters from EBSD, TEM and OM data.
AlloyTransformation TemperatureVickers HardnessEBSD Effective Grain Size q < 5°TEM Mean Lath WidthEBSD Mean MA AreaOM Mean MA Area
Ref375 °C412 HV1.01 mm0.285 mm0.53 mm20.22 mm2
Ref400 °C387 HV0.96 mm0.249 mm0.60 mm20.22 mm2
Ref430 °C357 HVNA0.226 mmNA0.44 mm2
Ref+V375 °C422 HV0.90 mm0.252 mm0.38 mm20.09 mm2
Ref+V400 °C390 HV1.04 mm0.211 mm0.49 mm20.16 mm2
Ref+V430 °C372 HVNA0.263 mmNA0.44 mm2
Table 5. Final carbon contents in austenite, martensite and bainitic ferrite.
AlloyTransformation TemperatureCg HEXRD (wt. %)Cg EELS (wt. %)Ca′ EELS (wt. %)Cb Calculated from Mass Balance (wt. %)Cb Measured from EELS (wt. %)
Ref375 °C0.941.120.70.120.12
Ref400 °C0.871.060.780.110.13
Ref430 °C0.750.610.530.080.06
Ref+V375 °C0.860.90.360.140.11
Ref+V400 °C0.850.830.630.110.1
Ref+V430 °C0.630.730.460.090.06

