Article

Effect of Laminar Flow on the Corrosion Activity of AA6061-T6 in Seawater

1
Applied Physics Department, Research Center for Advanced Study (CINVESTAV-IPN), Mérida 97310, Mexico
2
Centro de Innovación en Ingeniería Aplicada, Universidad Católica del Maule, Talca 3460000, Chile
*
Author to whom correspondence should be addressed.
Metals 2020, 10(2), 175; https://doi.org/10.3390/met10020175
Submission received: 17 December 2019 / Revised: 13 January 2020 / Accepted: 21 January 2020 / Published: 24 January 2020
(This article belongs to the Special Issue Localized Corrosion of Metals and Alloys)

Abstract

:
The electrochemical behaviour and surface changes on AA6061-T6 alloy exposed to Caribbean seawater from the Cozumel Channel for 30 days under laminar flow (0.1 m s−1) were studied, contrasting then with stationary (no flow) conditions. Monitoring of open-circuit potential and current fluctuations, both considered as electrochemical noise (EN), were employed as two nondestructive methods. The calculated corrosion current, based on Rn, was one order higher in laminar flow. The fluctuations of current were transformed in the frequency domain. Their power spectral density (PSD) plots were obtained in order to gain information concerning the dynamic of the spontaneous release of energy during the corrosion process. The value of the exponent β in PSD graphs suggested that the localised corrosion on AA6061-T6 surface occurs as a persistent stationary process, in which dynamic is controlled by oxygen diffusion and its renewal at the metal interface. The changes in the morphology and elemental composition of the formed layers revealed that the localized attacks occurred in the vicinity of intermetallic particles rich in Fe and Cu, which act as cathodes.

Graphical Abstract

1. Introduction

Aluminum alloy (AA) 6061-T6 is popular as a nonferrous material for structures in seawater [1] and is characterised by various properties, such as strength-to-weight ratio, extrudability—particularly for the manufacture of profiles with complex geometry—low thermal expansion coefficient, good wear resistance, and corrosion resistance [2]. The alloy presents good corrosion resistance in many environments having neutral pH because of the formation of a protective amorphous aluminum oxide film on its surface of approximately 2–3 nm thickness and its insolubility in water [3,4]. The addition of alloying elements to aluminum increases its mechanical properties [5]; however, the precipitated intermetallic particles (IMPs) have a harmful effect on the corrosion resistance of the Al alloys [4,6,7,8,9,10,11]. IMPs present electrochemical behaviour different from the alloy matrix, and they may be classified in two types: cathodic and anodic [7,9,10,11,12,13]. The electrochemically active anodic particles are rich in Mg, Si, and Al, with Mg preferential dissolution, leaving a cavity in the oxide layer, while the cathodic particles are rich in Fe, Si, and Cr, acting as preferential sites for oxygen reduction.
The localised corrosion becomes greater in the presence of aggressive ions, such as chlorides [4,14,15,16], and corrosion pits initiate in oxide film sites, weakened by chloride attack. Moreover, the heterogeneity of the surface could result in favourable nucleation sites.
Seawater is a complex electrolyte of different ions, with a high salinity (3.5 wt.%, density 1.023 g/cm3 at 25 °C), which causes damage to metals in a short time [17,18]. The principal parameters that affect the corrosion behaviour of metals immersed in this electrolyte are oxygen content, dissolved mineral salts, pH, temperature, specific contaminants, and flow velocity [17,19].
The characterisation of the corrosion process requires electrochemical nondestructive techniques, and preferred methods are those that do not apply external polarization. The monitoring of the open circuit potential (φcorr, free corrosion potential) or corrosion current is one of these and is easy to handle. Fluctuations may be interpreted as electrochemical noise (EN), which is a useful for the purposes of corrosion mechanism characterization. Electrochemical noise is presented by random fluctuations of corrosion potential or current, typically with frequencies below 10 Hz and with low amplitude [20]. This technique can provide information concerning the nature of the corrosion process and the rate thereof. The main sources of EN observed in corrosion systems are attributed to microscopic and macroscopic events [20,21,22]. EN measurements can be performed under corrosion potential or any constant potential/current, depending on the research objective, to analyse the corrosion mechanism and to obtain the corrosion rate [21].
EN measurements can be analysed by transforming the data in the frequency domain by fast Fourier transform (FFT) to obtain power spectral density (PSD) [23,24]. PSD plots display a slope, β exponent, which enables differentiation between series with fractional Gaussian noise (fGn, β from −1 to 1) and fractional Brownian motion (fBm, β from 1 to 3). The fGn is a stationary process and the fBm is nonstationary [25,26]. The β exponent is a parameter correlated with the strength of persistence in a process [27]. In our previous studies, EN technique was carried out to characterize the first stages of corrosion in stationary seawater of copper [28], aluminum [29], and aluminum alloys [30] as well as the initial stages of AZ31B Mg alloy in simulated body fluid [31].
The object of this study is to investigate the electrochemical behaviour and surface changes on AA6061-T6 alloy exposed to Caribbean seawater (Cozumel Channel) under laminar flow, contrasting these with stationary flow. Two nondestructive electrochemical methods were used to test the corrosion resistance of the alloy. The corrosion current and φcorr were considered as EN and transformed in the frequency domain in order to gain information on the dynamics of the spontaneous release of energy during the corrosion process. X-ray photoelectron spectroscopy (XPS) measurement was employed to analyse the composition of the formed corrosion layers, as well as SEM-EDS surface analysis. To the best of the authors’ knowledge, there is still no study on the initial stages of localised corrosion of AA6061-T6 alloy in laminar flow conditions.

2. Materials and Methods

The nominal composition of AA6061-T6 (Metal Plastic Mexicali) was (wt.%) 1.10% Mg, 0.5% Fe, 0.4% Si, 0.31% Cu, 0.19% Cr, 0.07% Zn, 0.05% Ti, and the remainder Al. The seawater was extracted from the Caribbean Cozumel Channel at 10 km offshore to minimize the effect of human pollution and at a depth of 10 m. The seawater composition and physicochemical properties were as follows: salinity 36.4 g L−1, chlorides 20.12 g L−1, sulfates 2.82 g L−1, nitrates 0.48 µmol L−1, nitrites 0.18 µmol L−1, ammonia 0.99 µmol L−1, pH 7.3, dissolved oxygen 5.8 mg L−1, and conductivity 51.6 mS.
Samples of 1 cm2 were embedded in Epofix resin as working electrodes for electrochemical tests. In addition, samples of 1 cm2 were cleaned with ethanol and immersed in 100 mL of seawater (triplicated) under flow conditions for 0, 5, 15, and 30 days. Before exposure, the specimens were ground with silicon carbide paper to 4000 grit, using distilled water as lubricant. They were washed with distillated water and dried in air.

2.1. Laminar Flow of Seawater

The speed range found in the Cozumel Channel indicates that the ocean current speed oscillates between 0.1 m s−1 to 1 m s−1. The tubing employed to connect the peristaltic pump (LAMBDA Laboratory Instrument) with the electrochemical cell has a diameter of 6 mm, and using the lower limit of the flow speed (0.1 m s−1), the calculated Reynolds number was 622.97, which corresponds to laminar hydrodynamic flow [32]. The dimensionless NRe characterises the diffusion-dependent system and is governed by the ratio of the inertial forces acting on the fluid to the viscous forces:
N R e = ρ u ¯ d μ
where ρ is the fluid density (seawater: 997.8 kg m−3), u ¯ is the flow speed (0.1 m s−1), d is the tubing diameter (6 mm), and μ is the seawater viscosity (0.961 × 10⁻³ N s m−2). All experiments were carried out at 21 °C.

2.2. Surface Analysis

AA6061-T6 samples were characterised before and after exposure in seawater by SEM-EDS (Phillips-XL30, Phillips, Amsterdam, The Netherlands) and ESEM-JEOL JSM-7600F (JEOL USA Inc., Peabody, MA, USA) in order to observe the microstructure and elemental changes on their surface. Corrosion products formed on AA6061-T6 sample surfaces were identified through X-ray photoelectron spectroscopy (XPS, K-alpha, Thermo Scientific, Waltham, MA, USA). In addition, corrosion products were removed in accordance with ASTM G1-90 standard [33] and the alloy surfaces were reexamined.

2.3. Electrochemical Tests

A multiport electrochemical cell kit (Gamry Instruments, Philadelphia, PA, USA, 1 L total volume) and a potentiostat (Interface-1000E, Gamry Instruments, Philadelphia, PA, USA) were used for all electrochemical measurements. The experimental setup employed was according to ASTM G199-09 standard [34]: two identical AA6061-T6 working electrodes (WEs) connected to a zero-resistance ammeter (ZRA) and a saturated calomel electrode (SCE, Hg2+/Hg2Cl2 = 0.244 V, CH Instruments Inc., Austin, TX, USA) as reference electrode. The electrodes were immersed in an electrochemical cell with seawater, employed as the test electrolyte. All tests were carried out in laminar and stationary (no flow) conditions up to 30 days. Electrochemical noise (EN) data of current and potential fluctuations were collected at different times for 3 h: initial, 1, 5, 15, and 30 days in open circuit potential, OCP, with a sampling frequency of 10 Hz. The obtained data were plotted vs. time. The current fluctuations were considered as electrochemical current noise (ECN) and processed in the frequency domain by fast Fourier transform (FFT) to graph power spectral density (PSD). The PSD as a function of low frequencies was analysed on a bi-logarithmic scale (10−3–1 Hz) of power per unit frequency (A2/Hz) vs. frequency (Hz). These procedures allowed the fitting of a straight line and obtention of the β slope. The β value characterises the corrosion mechanism on AA6061-T6 surface. The processing of data was realised with Electrochemical Signal Analyzer V.7.0.1 software (Gamry Instruments, Philadelphia, PA, USA). All measurements were checked in triplicate.

Energy Spectral Density

The energy spectral density expresses how the energy of a time series is dispersed with frequency; it can reflect the change in system dynamic. For a signal X(t), the energy E is as follows [35]:
E = | x ( t ) | 2 d t
For signals with a finite total energy, an equivalent expression for the energy is expressed as follows:
E = | x ( t ) | 2 d t = | x ^ ( f ) | 2 d f
It uses the Fourier transform of the signal:
x ^ ( f ) = e 2 π i f t x ( t ) d f
where f is the frequency in Hz.
The integral on the right-hand side of Equation (3) is the energy of the signal, and the integrand {\displaystyle \left|{\hat {x}}(f)\right|^{2}} | x ^ ( f ) | 2 describes the energy per unit frequency contained in the signal (ESD).

3. Results and Discussion

3.1. Surface Analysis

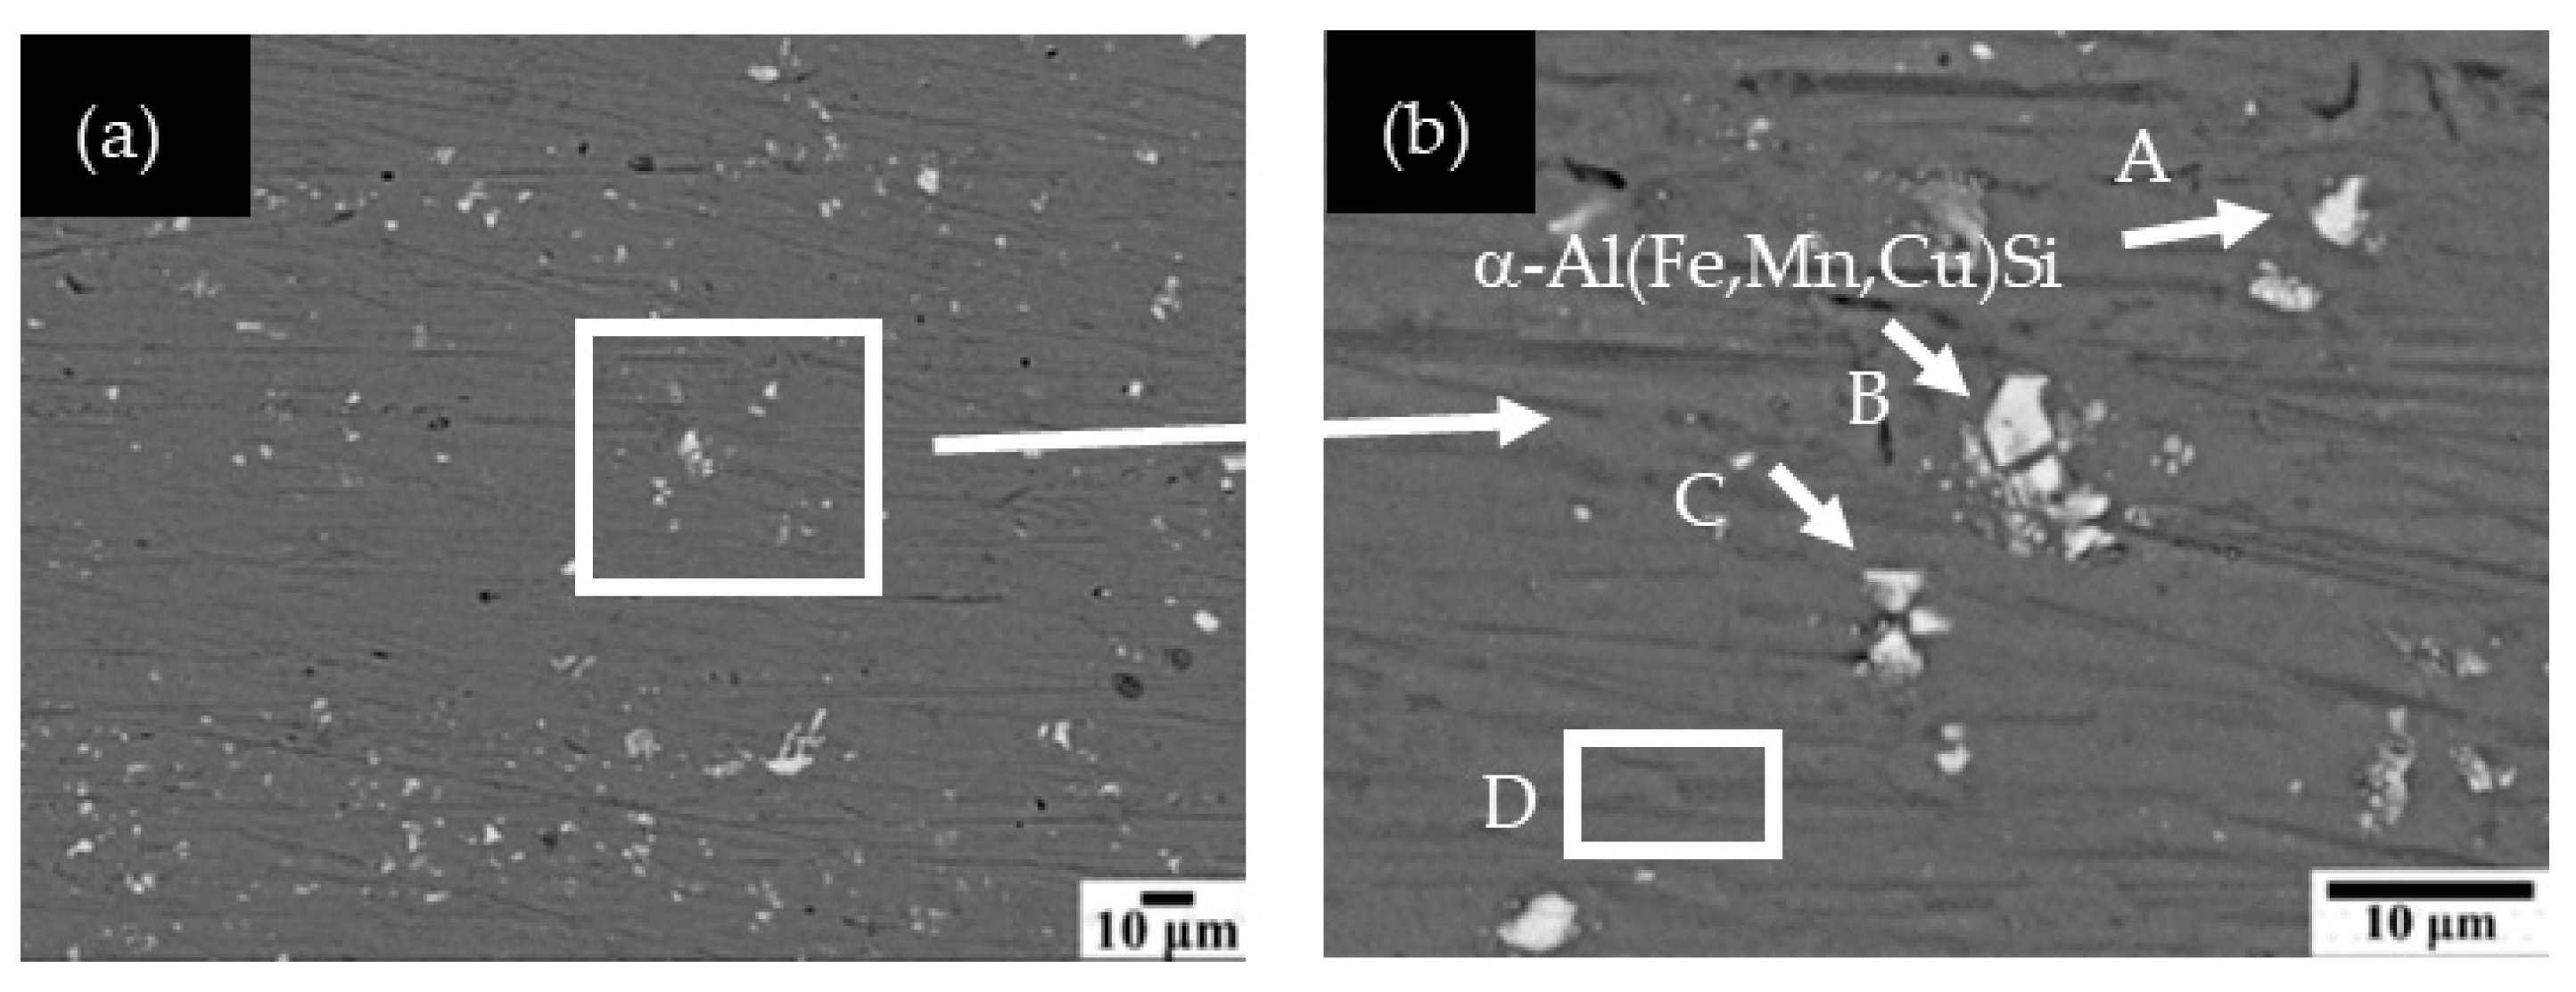
Figure 1 shows SEM images of the as-received specimen of 6061-T6 aluminum alloy surface. Small precipitates (labeled as A–C) may be seen (Figure 1b). In accordance with EDS, presented in Table 1, these precipitates correspond to particles rich in Fe and could be considered as elements of the following phases: Al3Fe, Al–Si–Mn–Fe, and α-Al(Fe, Mn, Cu) [9,10,36]. The elemental composition of the surface layer is indicated by zone D.
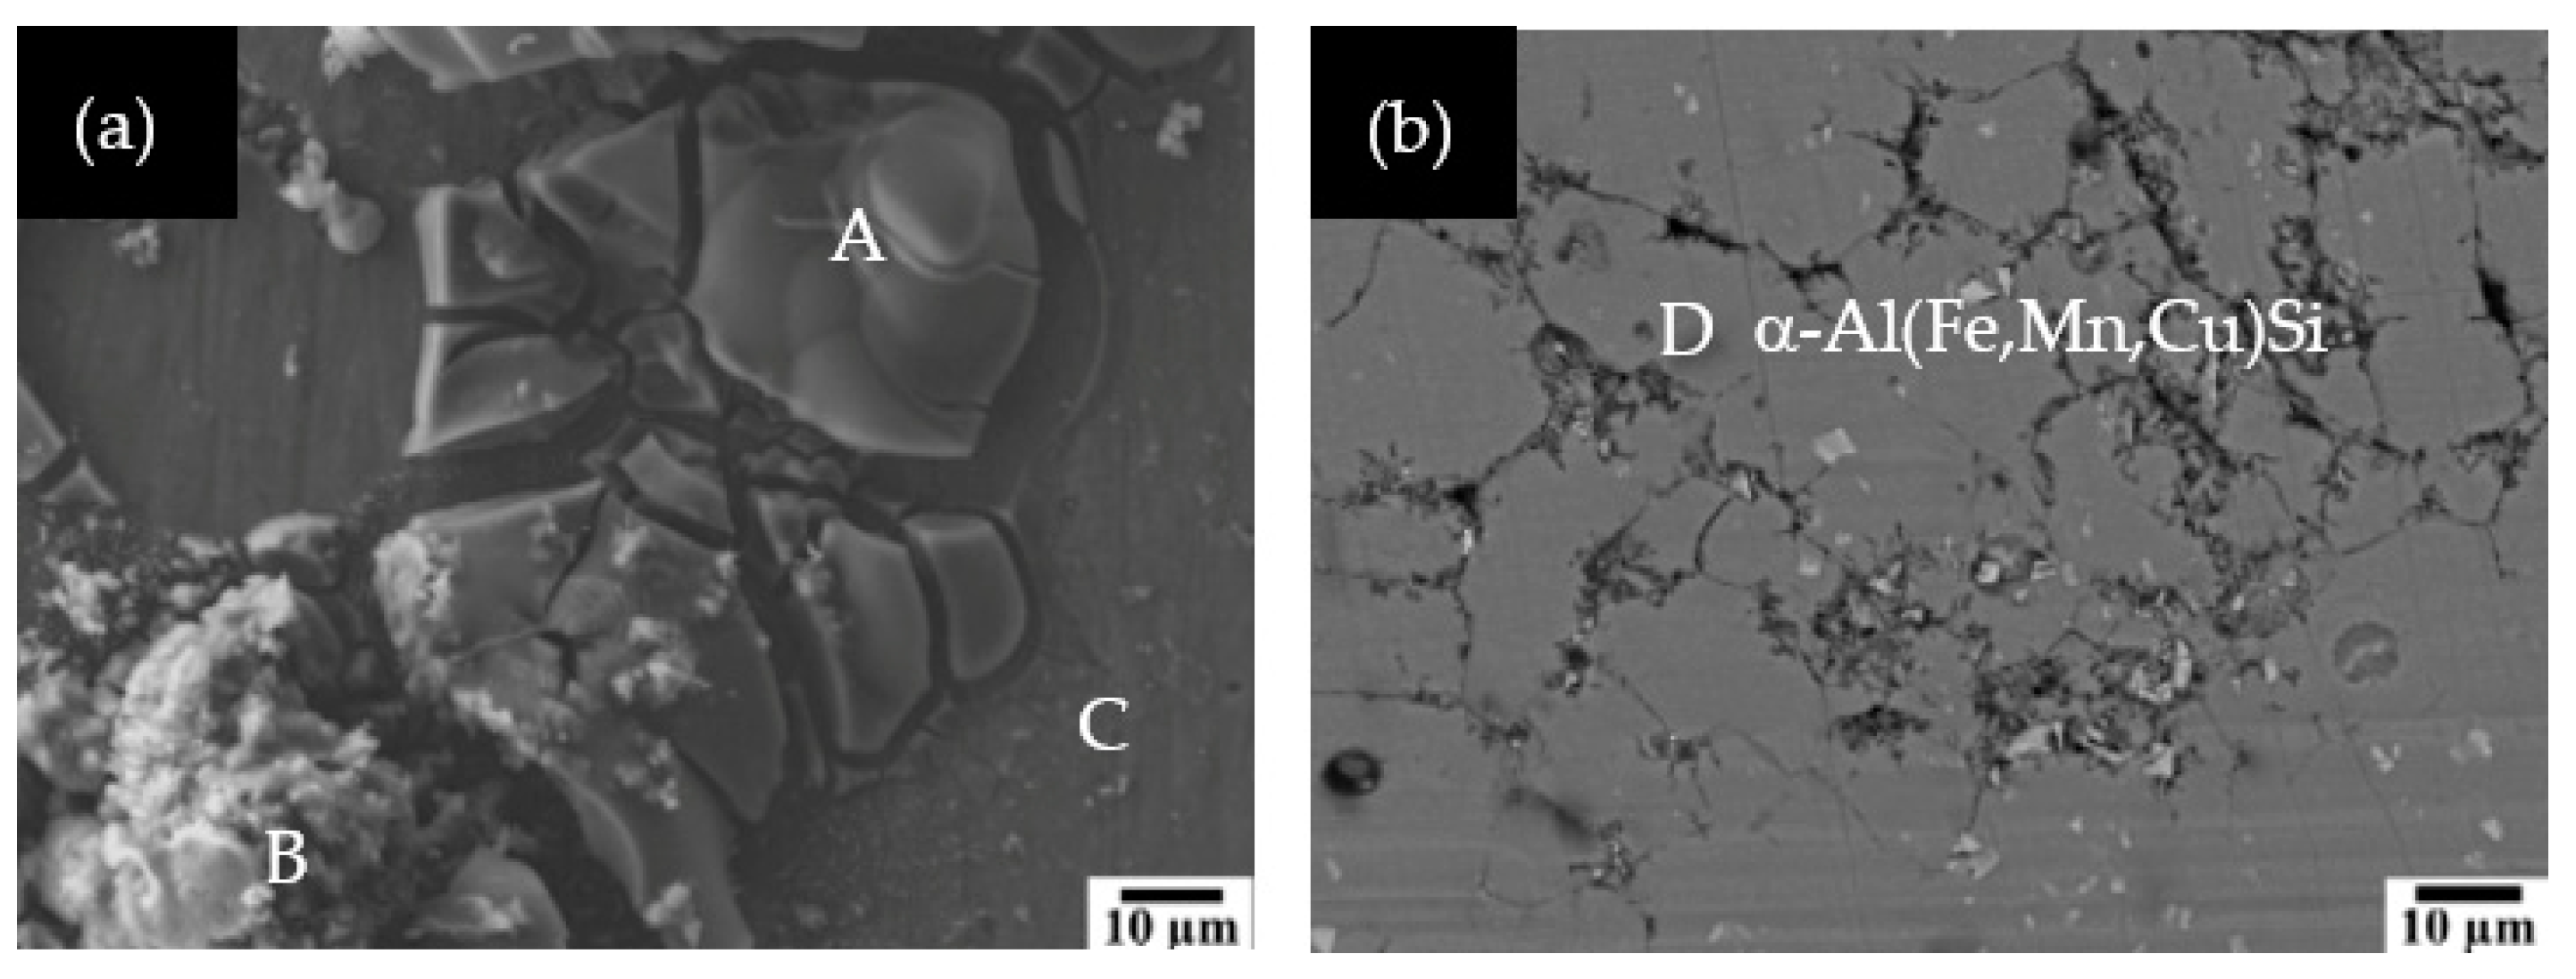
Figure 2a presents the SEM image of the film formed on the surface of the sample after 5 days of immersion in seawater from the Cozumel Channel under laminar flow. It can be clearly seen that the passive layer begins to break down around the alloying elements (Figure 2b). Probably, this layer is less protective in the vicinity of the intermetallic particles, causing the formation of local electrochemical cells with the Al matrix. EDS analysis (Table 2) confirmed the presence of particles mentioned above. According to EDS (Table 2), zone A is characterised by its higher content of Al, O, and Cl, which could relate to corrosion products. According to previous studies, at pH > 8.5, Al(H2O)63+ cations appear, while in the range of pH 4.5–8.5, Al(OH)3 predominates [37,38]. In chloride solutions, aluminum metal ionises rapidly to the Al3+ ion, which also hydrolyzes very rapidly (owing to the negative potential value) [39]. Both of these Al cations can react with chloride ions and form AlCl3 soluble in water (31.77 wt.%) [40]; this is converted later to a relatively stable species of basic aluminum chloride (AlCl3·H2O) and transformed slowly to Al(OH)3 and finally to Al2O3∙H2O, an important corrosion product for the repassivation process of the aluminum surface [39].
Based on EDS analysis, in zone B, in addition to oxygen and aluminum, elements of calcium and carbon were present, both possibly as a part of a CaCO3 precipitate originating from seawater. Meanwhile, the layer in zone C maintained a composition similar to that of the alloy, which indicates that the corrosion process was still beginning on the surfaces of similar areas.
After removal of the layer of corrosion products (Figure 2b), an area damaged by pitting and cracking was observed on the alloy surface. However, some precipitates remained on the surface of AA6061-T6, which according to EDS (Table 2) correspond to cathodic particles rich in Fe, α-Al(Fe,Mn,Cu)Si, that promoted the preferential dissolution of the aluminum matrix (local alkalisation) [10].
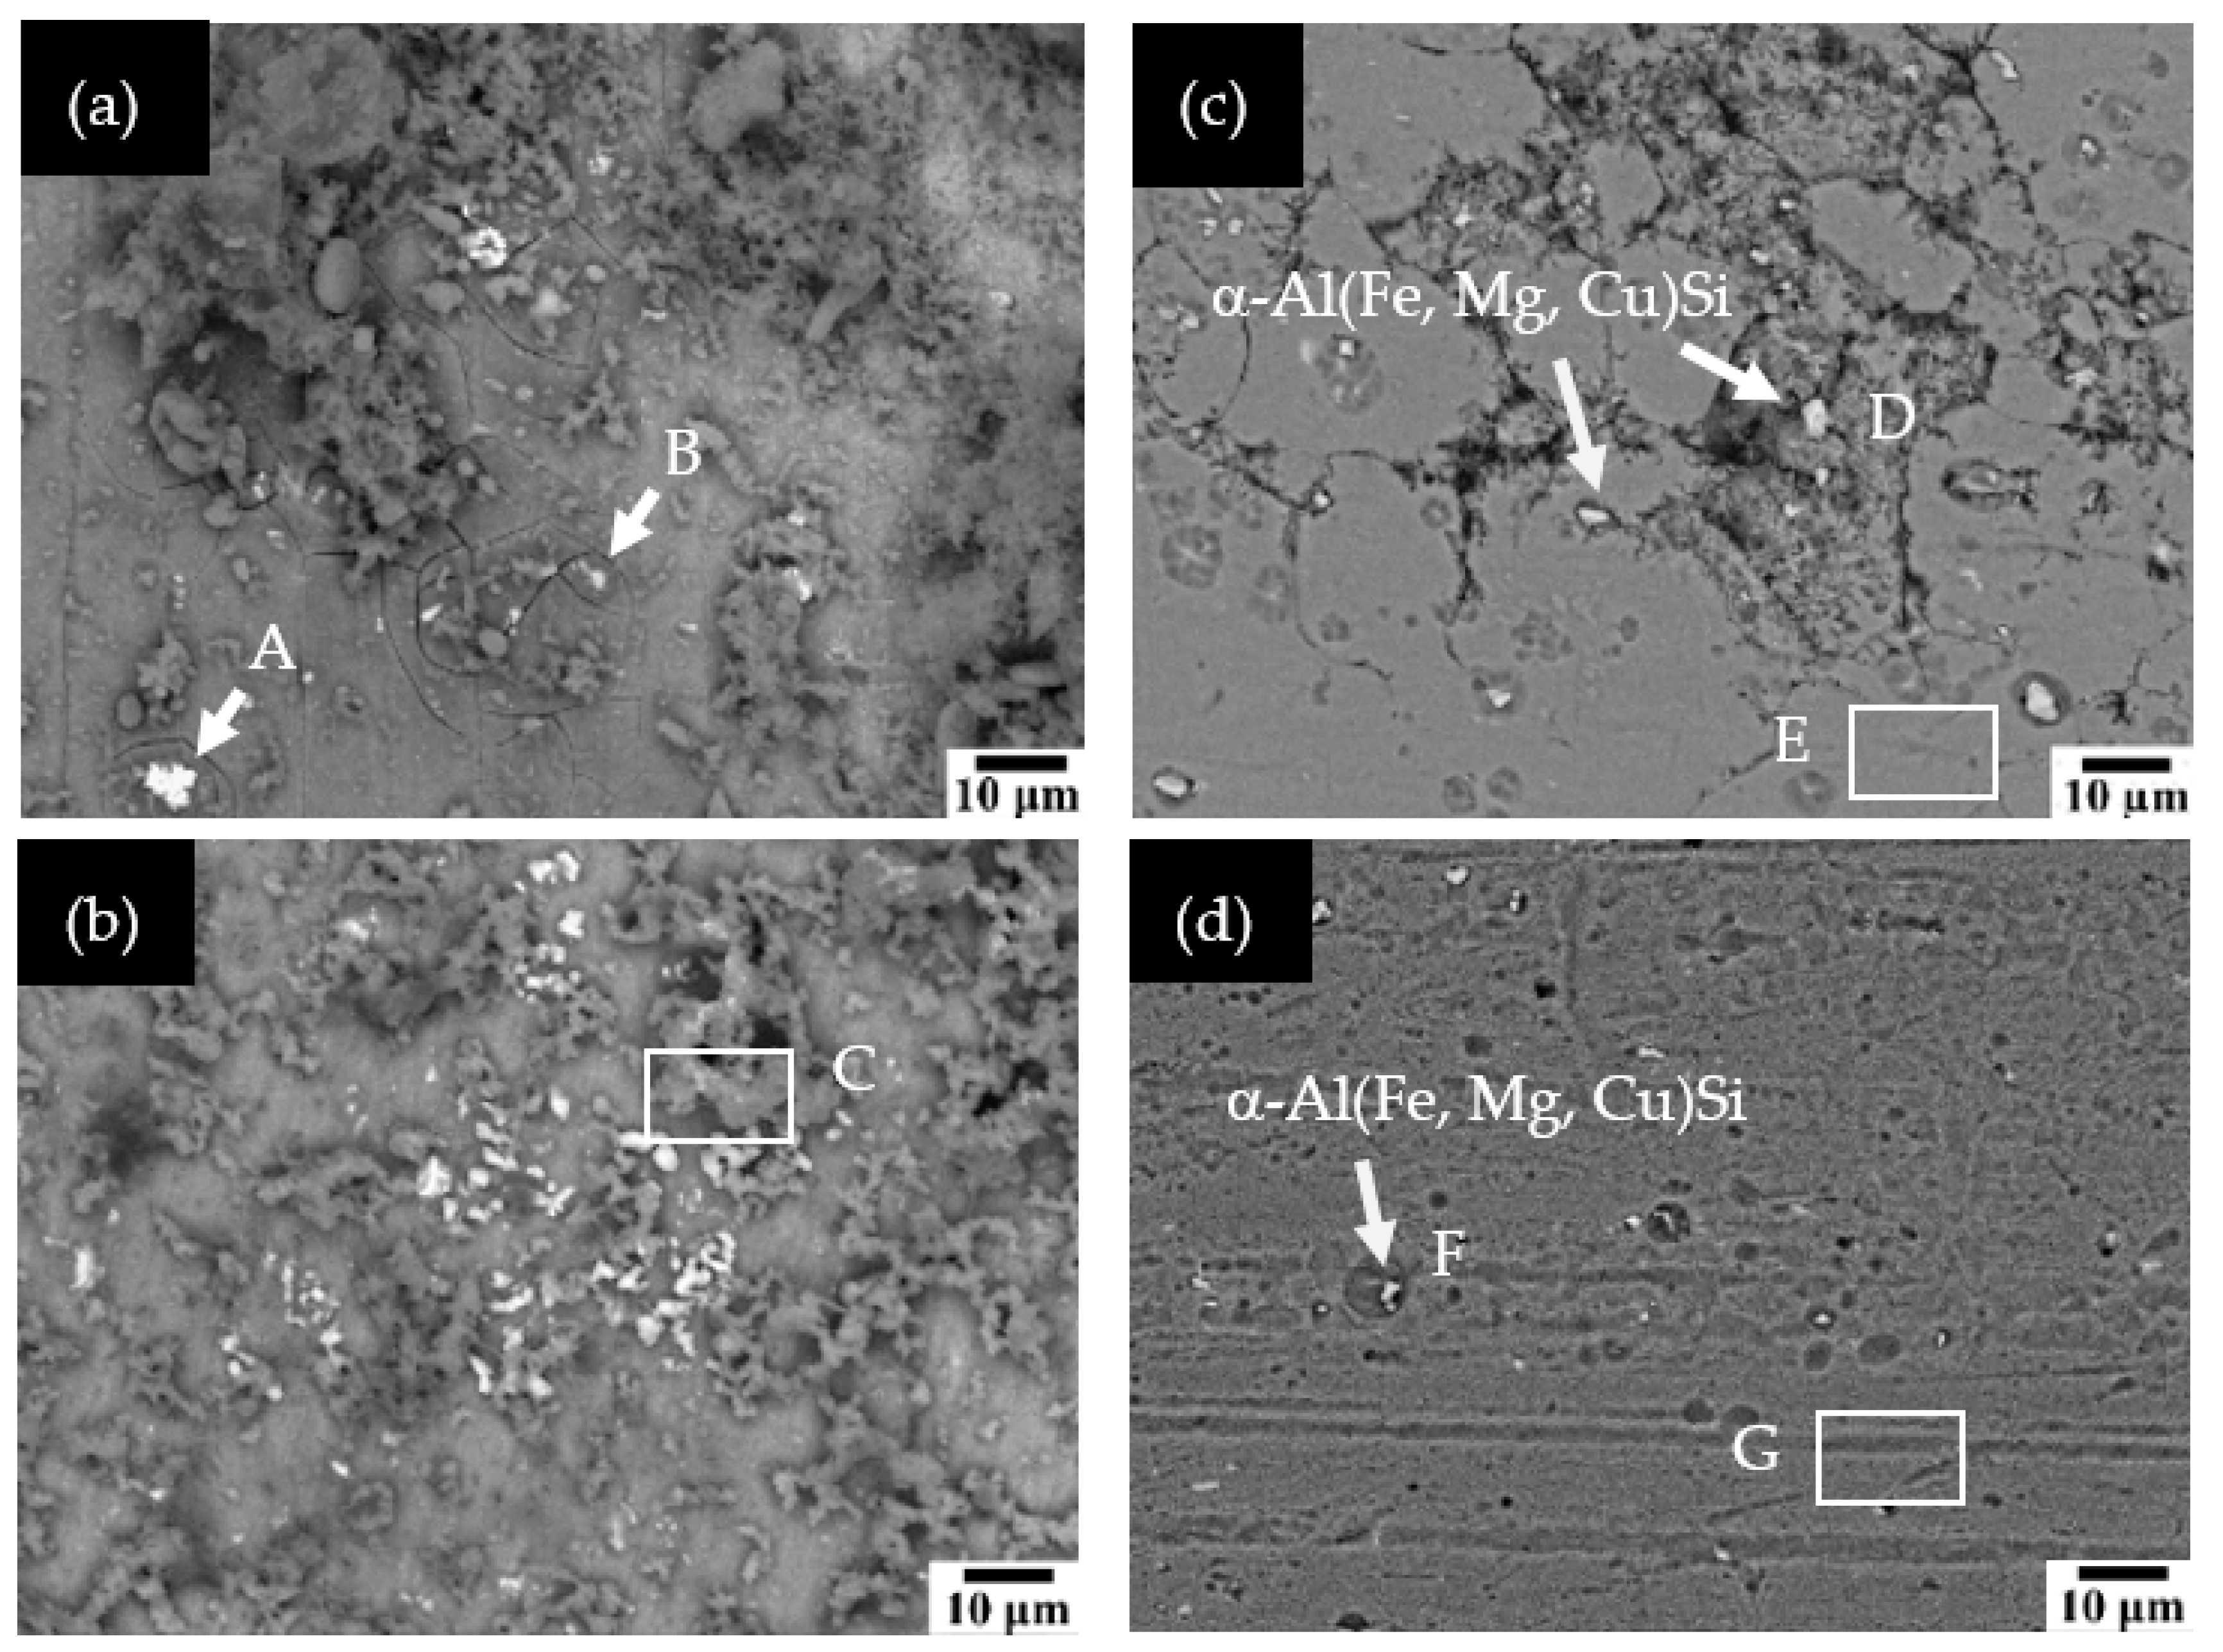
Figure 3 compares SEM images of the aluminum alloy 6061-T6 after exposure at 30 days in laminar flow (Figure 3a,c) and stationary flow (Figure 3b,d). In these micrographs, the products formed on the surfaces of the alloy (Figure 3a,b) can be seen and compared; EDS analysis is summarised in Table 3. In laminar flow (Figure 3a), the segregation of particles rich in Cu (particles A) with the presence of O and Al could be considered as the phases of Al2Cu, AlMgSiCu (Q-phase), and Al7Cu2Fe, both relatively resistant to corrosion because they are nobler than the aluminum matrix [4,13]. Q-phase acts as a cathode and does not contribute to intergranular corrosion when it is not connected to any other Cu particle. Otherwise, the Q-phase as cathode promotes the development of intergranular corrosion, initiated in the presence of chloride ions (NaCl). In the corrosion layer, particles without Cu appeared (particles B), rich in Fe, Al, and Mg, which could be attributed to the following phases: Al–Si–Mn–Fe and Al–Mg–Si, reported for aluminum alloy series 6xxx [36]. Zone C of the layer formed under stationary flow (Figure 3b) presented a similar composition of the alloy (Table 3), however, with the oxide layer of Al2O3·H2O on the alloy surface 6061-T6, as a transformation product of basic aluminum (AlCl3·H2O) in the presence of NaCl [39]. This layer is part of the entire surface (Figure 3a), since the three zones (A–C) have a high oxygen content (Table 3) [4].
Figure 3c corresponds to the SEM image of the aluminum alloy 6061-T6 exposed in seawater at 30 days with flow after removal of the layer of corrosion products. An area on the surface damaged by cracking and fissures can be observed, while the surface exposed to seawater without flow (Figure 3d) shows less damage, with pitting holes of several diameters. In contrast, on the surface exposed to laminar flow for this same time period, the pits are not clearly observable, but localised corrosion damage appeared in the form of fissures. This effect is due to the seawater flow, which facilitates the oxygen diffusion and its renewal at the metal interface, accelerating the corrosion process. Moreover, the seawater flow attributes to the detachment of the destroyed passive layer and the appearance of new “fresh” areas, where the oxygen diffuses at the cathodic sites, as an oxidising agent needed for the cathodic corrosion reaction. It is also observed that, on both surfaces (Figure 3c,d), some particles remained (named as D and F), and according to EDS (Table 3), they correspond to cathodic rich in Fe [7], reported in the reference sample as α-Al(Fe,Mn,Cu)Si [36]; these intermetallic particles promoted the preferential dissolution of the aluminum matrix [41,42].

3.2. OCP (Free Corrosion Potential, φcorr) Measurements

Figure 4 compares the φcorr fluctuations of AA6061-T6 specimens exposed for different periods of times (0, 5, and 30 days) under laminar flow conditions (Figure 4a) and without flow (Figure 4b). The average values are summarised in Table 4. The trends in the changes towards more or less negative values are a response to the transformations that have occurred on the surface of the aluminum alloy with the advance of the corrosion process. These are, in the morphology, elemental composition of the layers formed as well as the type of localised corrosion attack discussed previously. It can be seen (Table 4) that the initial values of φcorr are relatively similar, being 30 mV nobler with respect to the exposed surface in laminar flow. At 5 days, which implies the initial destruction of the passive layer (Figure 2a), it is 100 mV more negative with laminar flow than under stationary flow. At 30 days, the φcorr values in both seawater conditions (with and without laminar flow) are very similar (Table 4). However, when the product layer was removed (Figure 3c,d), the SEM images revealed a greater localised attack on the aluminum surface under laminar flow (Figure 3c), while in the absence of flow, this attack has been less aggressive, presenting shallow pits. Free corrosion potential tendency towards more or less negative values indicates periods of corrosion activation or repassivation of the surface, both facts related to the characteristics of the layers formed [4,43].

3.3. Surface Characterisation by XPS

In order to identify the composition of the corrosion product layer created on the alloy surface after 30 days of exposure in laminar flow, XPS analysis was carried out on the specimen immersed, taking into account that aluminum corrosion products were not provided by XRD analysis as crystalline phases and are possibly amorphous.
Figure 5a shows the full XPS spectrum of the corrosion products formed on the aluminum alloy surface of 6061-T6. The XPS spectrum revealed signals of Mg, Na, O, Cl, C, Si, and Al, which accord with EDS analysis. The signal of O1s (Figure 5b) centered in 531.88 eV could be attributed to aluminum oxide (Al2O3), an important product of the repassivation process of the aluminum surface. The high-resolution peak for Al2p (Figure 5c), situated at 74.38 eV, has been associated with the presence of aluminum hydroxide [Al(OH)3] [44], possibly derived from the transformation of basic aluminum chloride (AlCl3∙H2O) [39].

3.4. Electrochemical Current Noise Measurement (ECN)

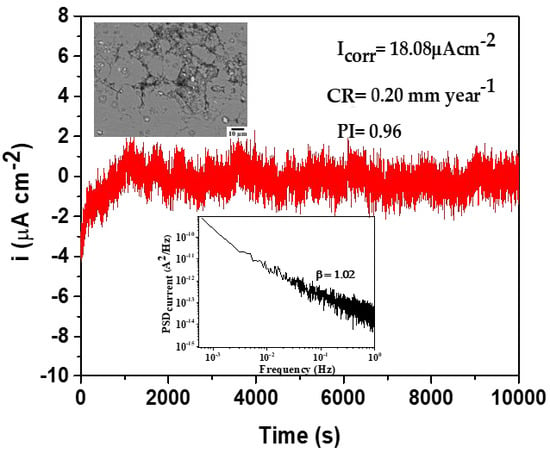
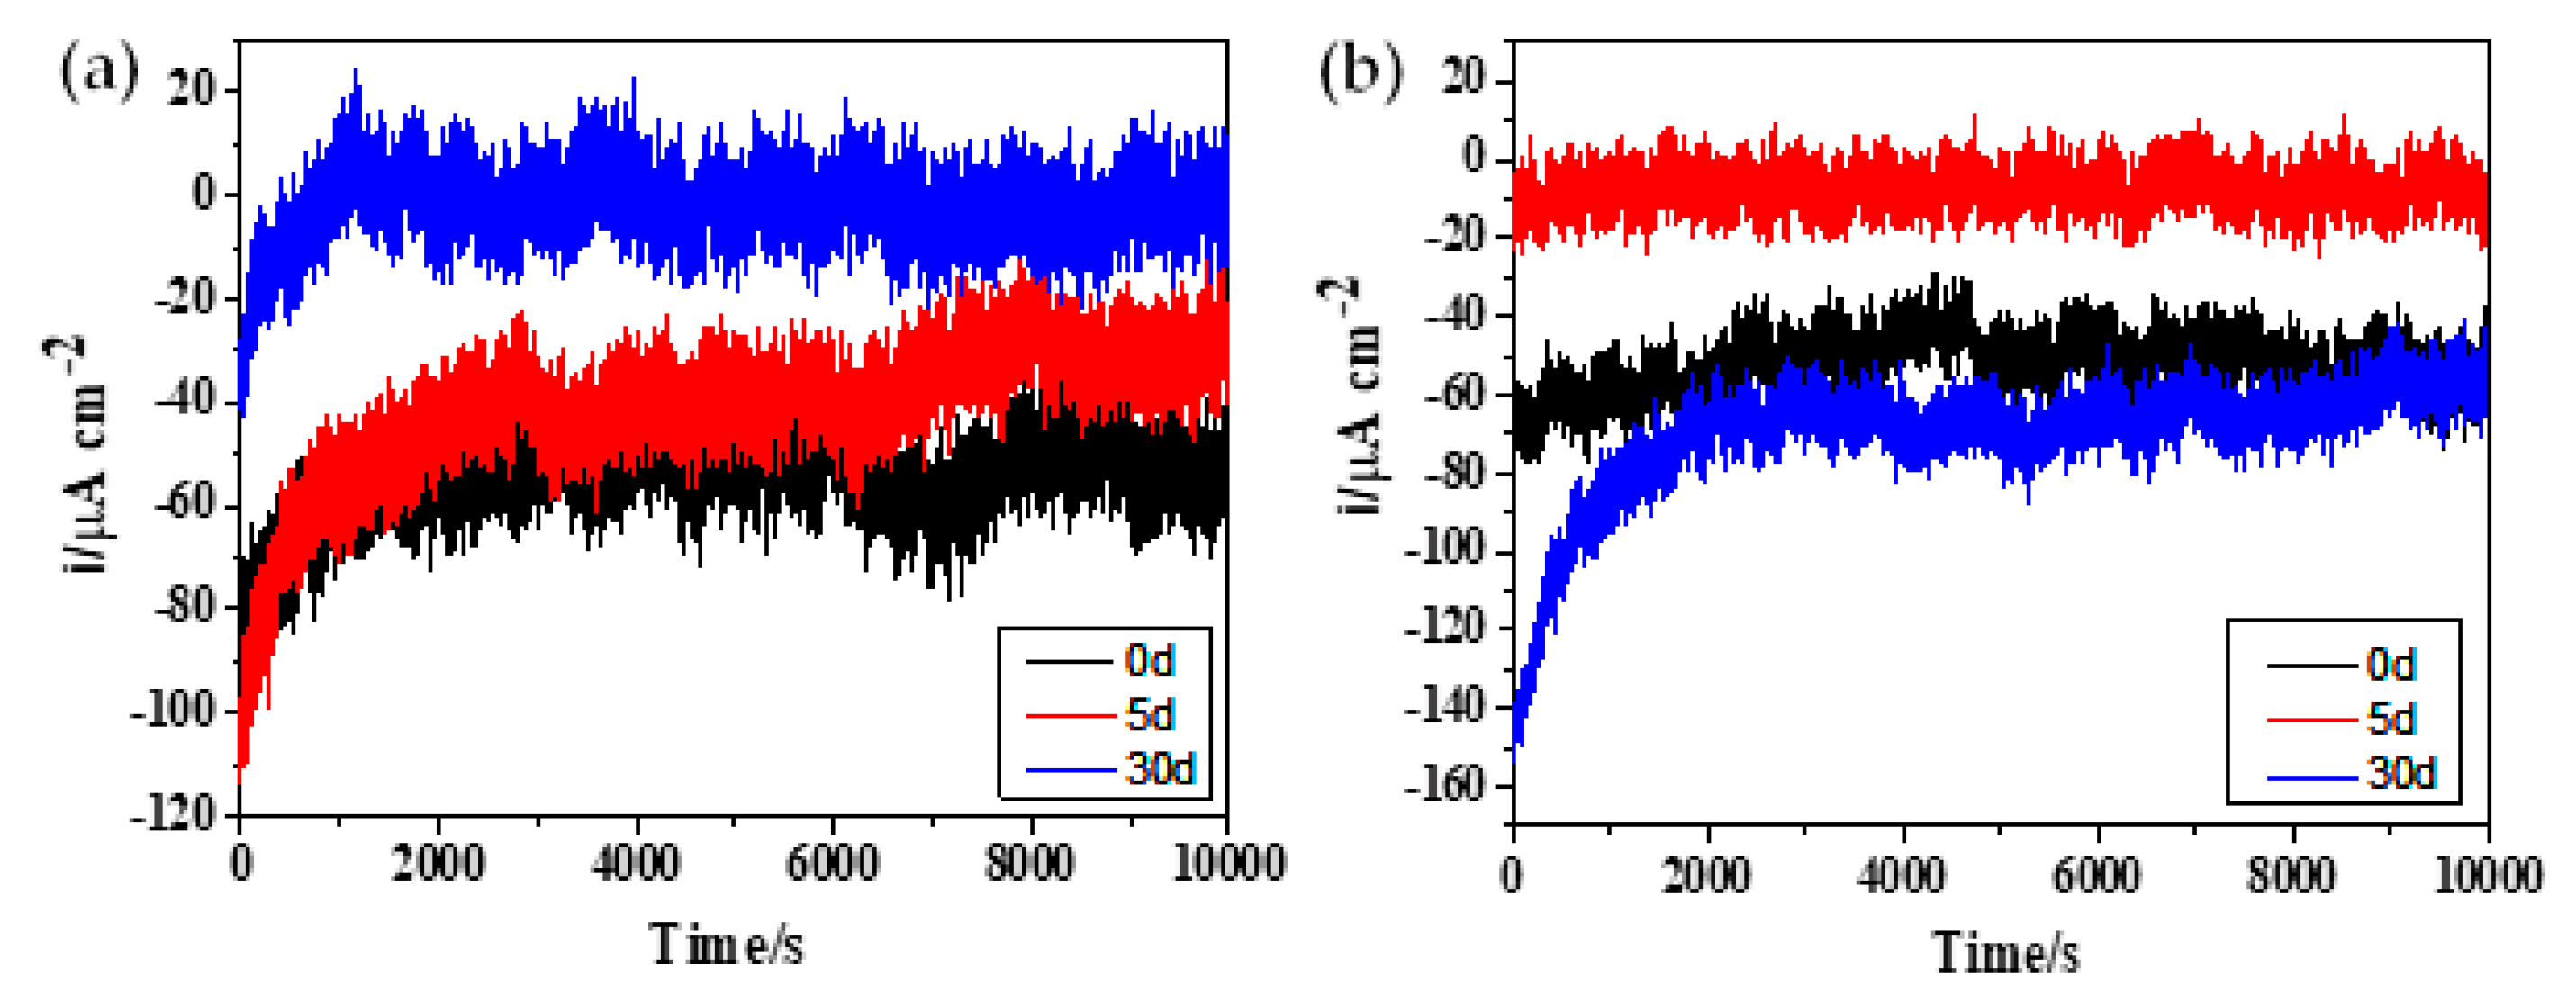
Figure 6 shows the current oscillations, and it can be seen that, at the beginning of the experiment (0 days), the current density of AA6061-T6 surface immersed in laminar flow of seawater is higher in approximately 50 µA cm−2 than that current in stationary flow. This suggested that the corrosion of the aluminum alloy 6061-T6 surface in laminar flow initiates faster, when the oxide layer on the alloy begins to break down. However, at the end of the experiment (30 days), the current value diminished suddenly compared with the initial values. However, in stationary flow, the current shifted to one order higher values than those in laminar flow, suggesting an acceleration of the corrosion process at that time [45]. Conversely, the current oscillations in stationary conditions (Figure 6b) presented slow variations, while for flow conditions (Figure 6a), intense current fluctuations were acquired with greater amplitude, which suggest greater corrosion [
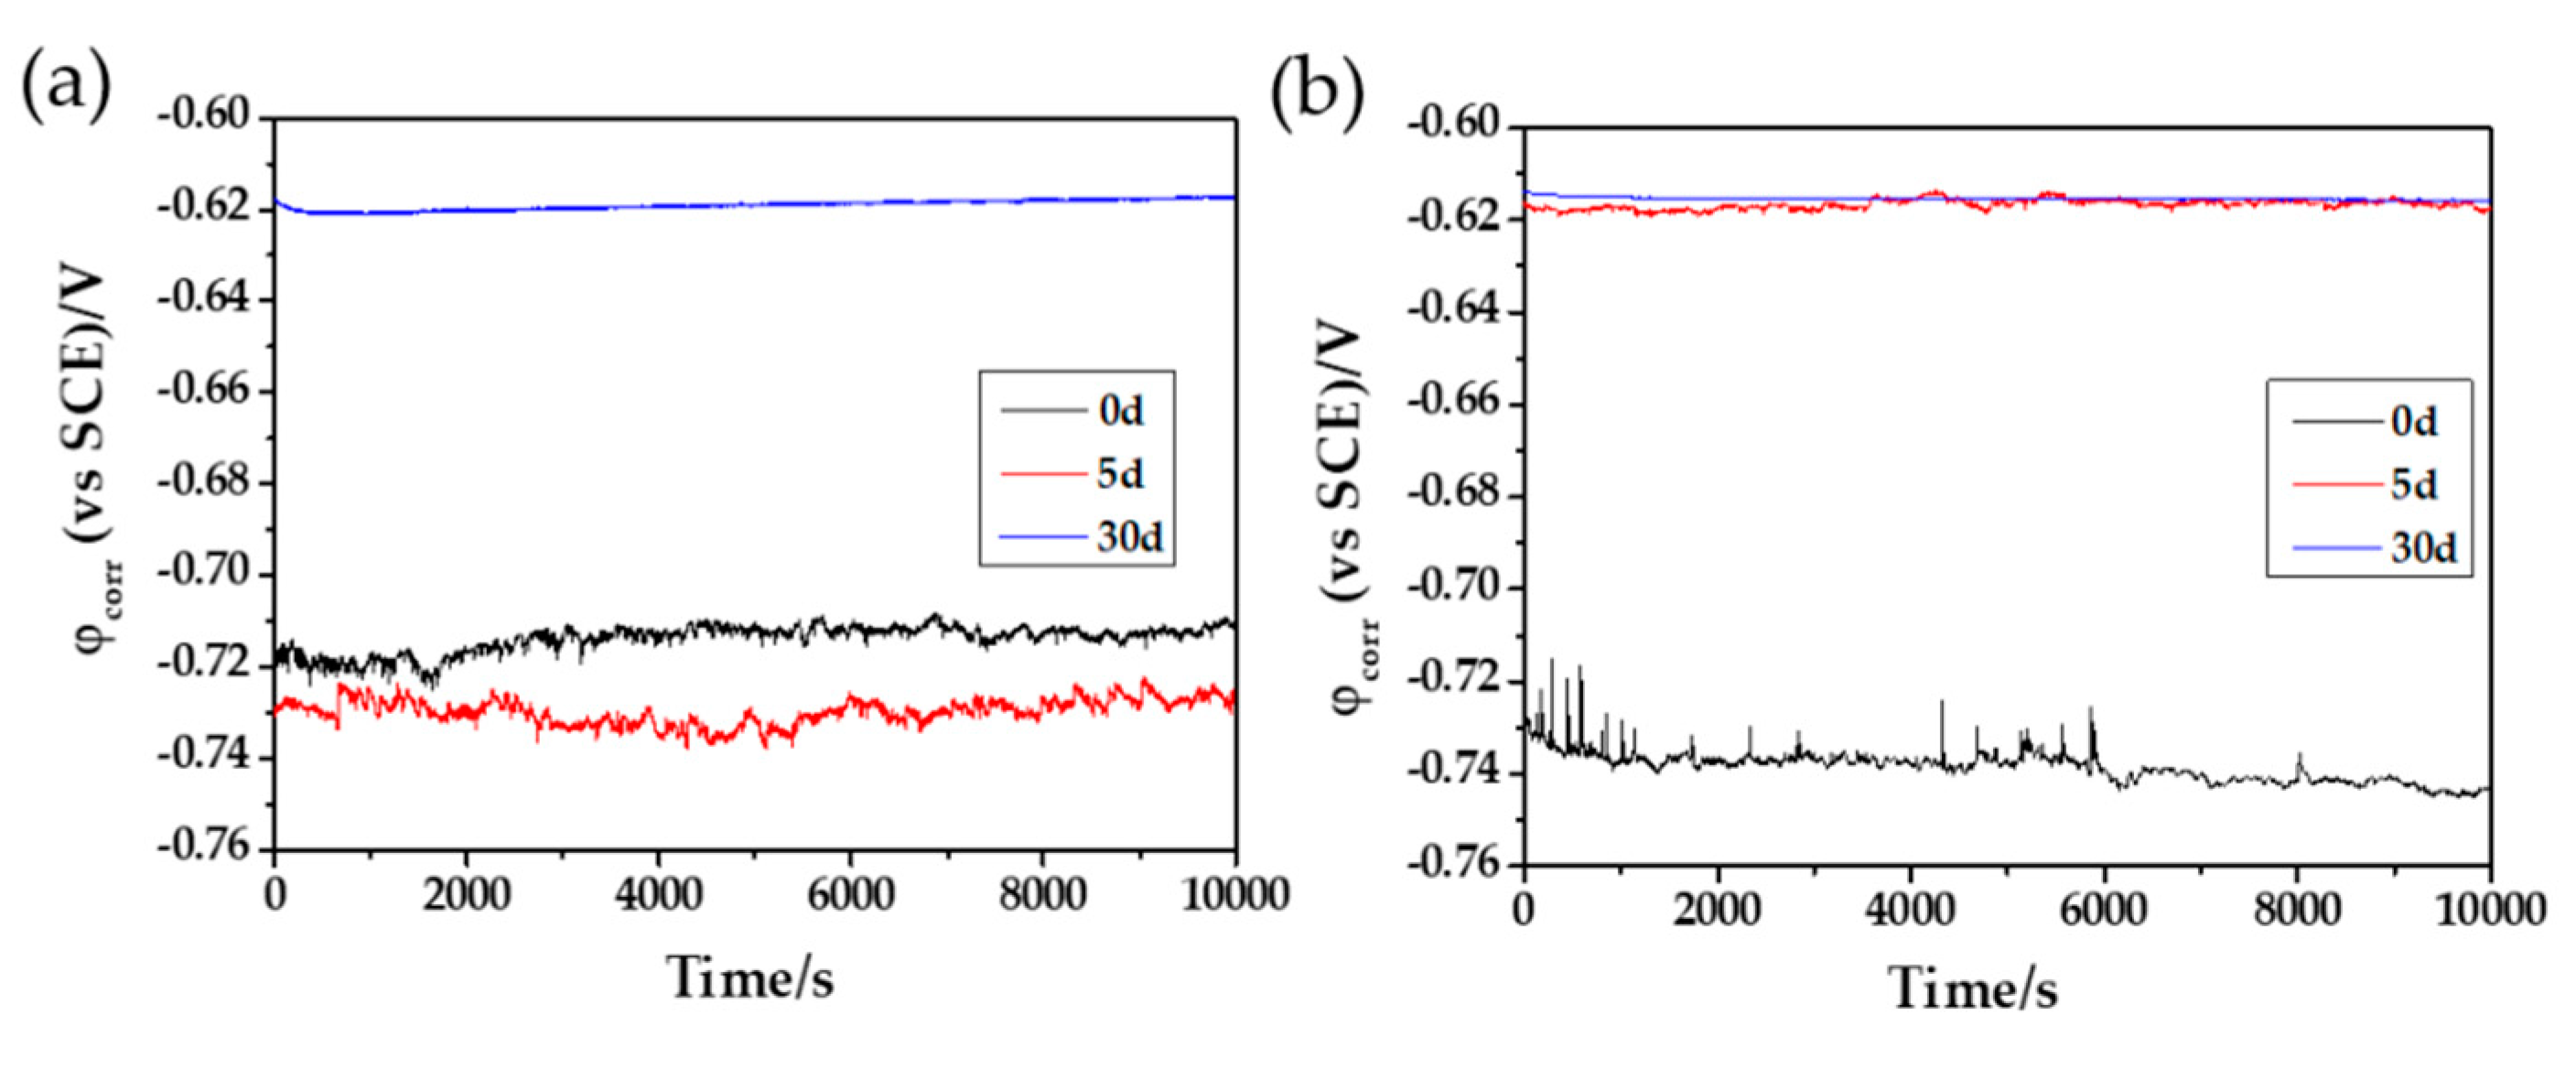
46]. The observed current oscillations registered in (μA cm−2) (Figure 6) correspond to the variation of the free corrosion potential (φcorr) values in several mV (Figure 4).
The corrosion current density was calculated from the value of polarisation resistance Rp (on the assumption that Rp is equivalent to polarisation resistance noise Rn) obtained by ECN tests, according to the Stern–Geary equation (Equation (5)). Rn is calculated by dividing the standard deviation of potential by standard deviation of current. (The potential noise can be modeled as the action of the current noise on the metal-solution impedance):
  i c o r r = B R p = 1 R p × b a b c 2.303   ( b a + b c )
where Rp is the polarisation resistance, and ba and bc are the Tafel coefficients. In this research, the B value employed was 0.26 V, taking common values for ba and bc of aluminum alloys [47,48]. The calculated values (Table 5) show that the corrosion current of AA6061-T6 increases with the time of exposure, being more than one order higher when the alloy is exposed under laminar flow of seawater, while in stationary conditions, it maintains almost similar values up to 30 days.
Subsequently, Faraday’s law was applied to calculate the corrosion rate (CR, Table 6) in the following form:
C R = i c o r r K E w ρ A
where Ew stands for the equivalent mass of AA6061-T6, icorr is the corrosion density (A cm−2), ρ is the metal density, K is a constant (3272 mm/A cm year), and A is the exposed specimen area (1 cm2) [49].
The corrosion rate values presented in Table 6 indicate that, under laminar flow, the values varied 0.08 and 0.20 mm per year while, in stationary conditions, they were between 0.012 and 0.162 mm per year.
With the statistical data obtained from the corrosion current, the pitting index (PI) [20] was calculated in order to reveal AA606-T6 susceptibility to localised corrosion for the laminar and stationary:
P I = σ i ( i r m s ) 1 = ( 639.17   n A ) ( 666.42   n A ) 1 = 0.96
where σi is the standard deviation and irms the main square root of current noise.
Values of PI above 0.1 may indicate localised corrosion [21,50]. The pitting indexes are shown in Table 7. Thus, the calculated PI value suggests that, at the end of the experiment (30 days), for both flow cases, AA606-T6 showed pitting corrosion approximately four times higher in flow conditions, reaching PI = 0.96. These facts agree with the SEM images (Figure 3) comparing the corrosion attacks on AA6061-T6 exposed to both flow conditions.
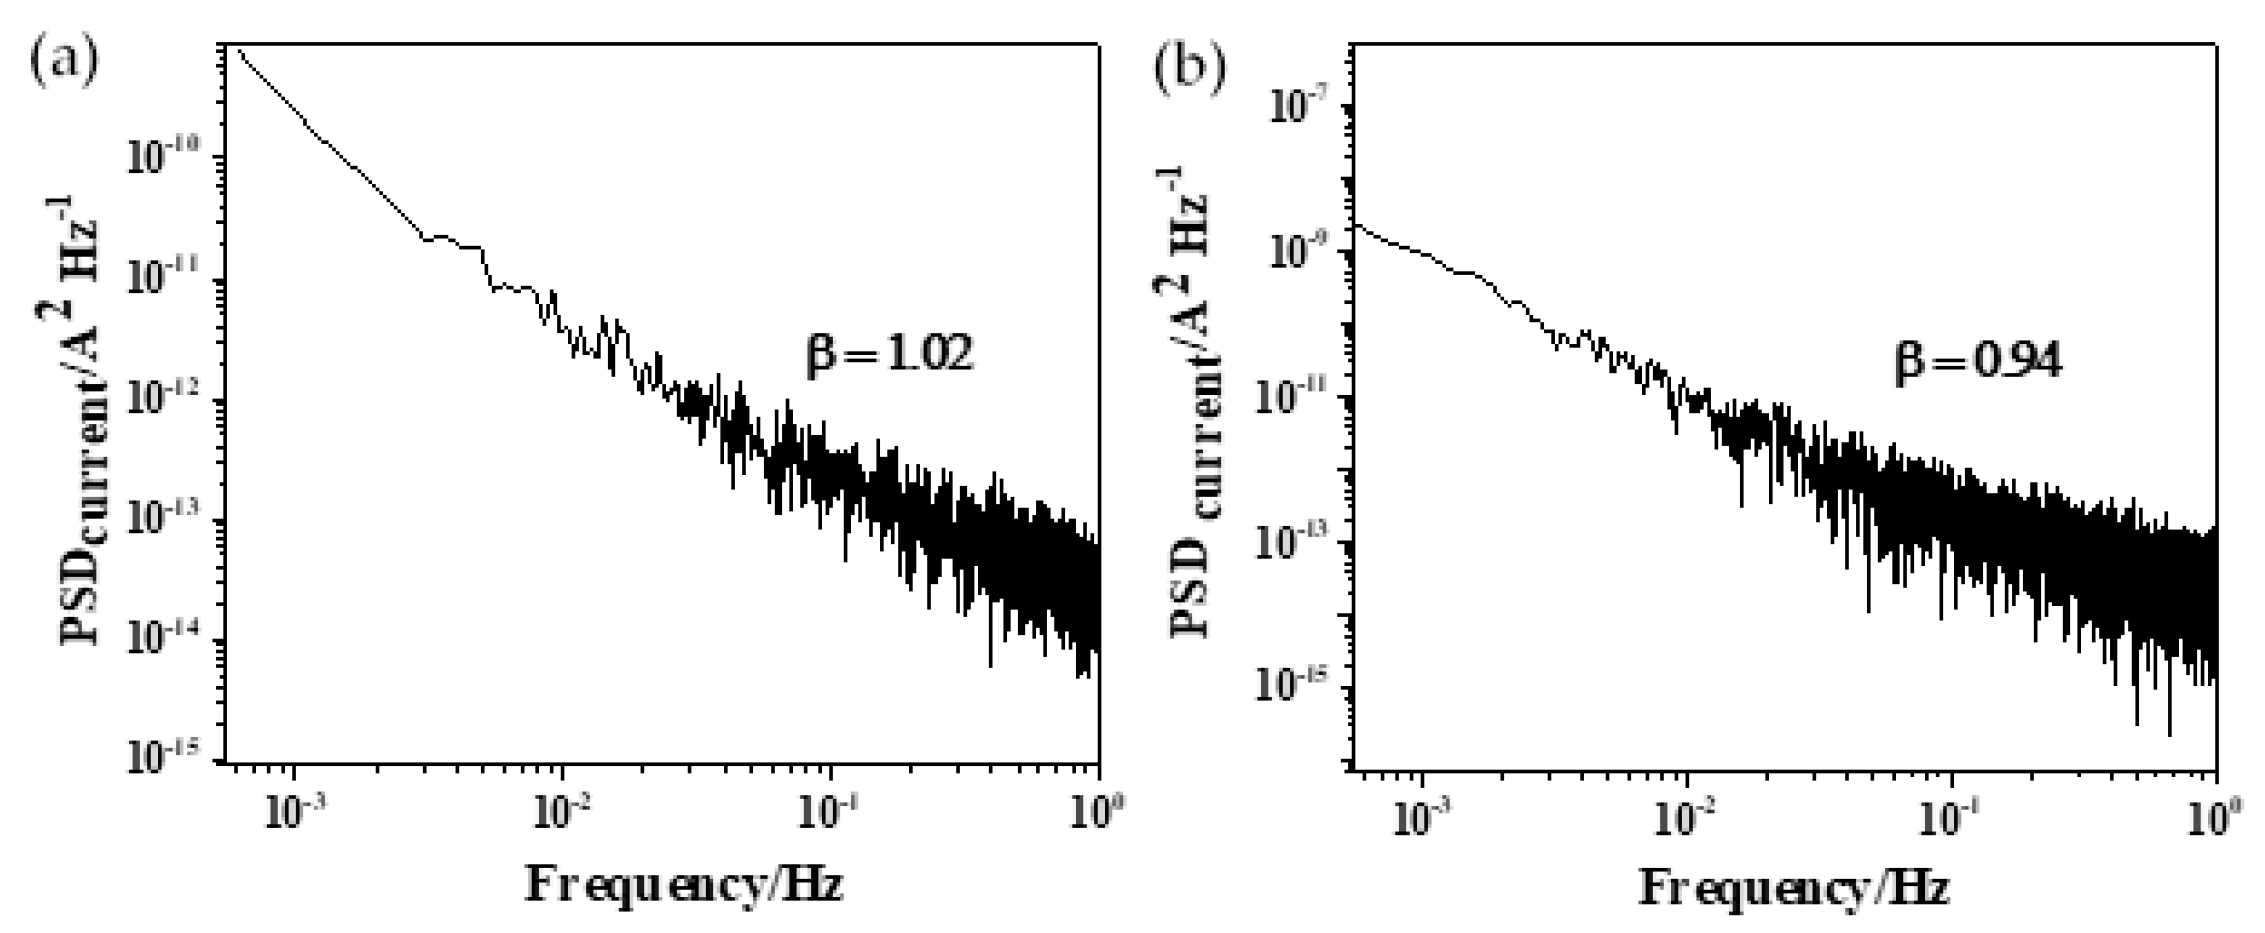
The current fluctuations, considered as ECN, were transformed into the frequency domain to estimate PSD slopes (β exponent). Figure 7 compares the PSD plots in bi-logarithmic scale, corresponding to AA6061-T6 surfaces after 30 days of exposure in seawater under laminar and stationary flows. In each case, the β exponent decreases as the frequency increases, and this fact could be associated with the advance of the localised corrosion attacks on the alloy surface [35]. At 30 days, β values are similar in laminar and stationary flows (1.0 and 0.94, respectively) and may be attributed to the fractional Gaussian noise (fGn), associated with a persistent process [27]. This type of noise (fGn) is considered also as a stationary process [25].
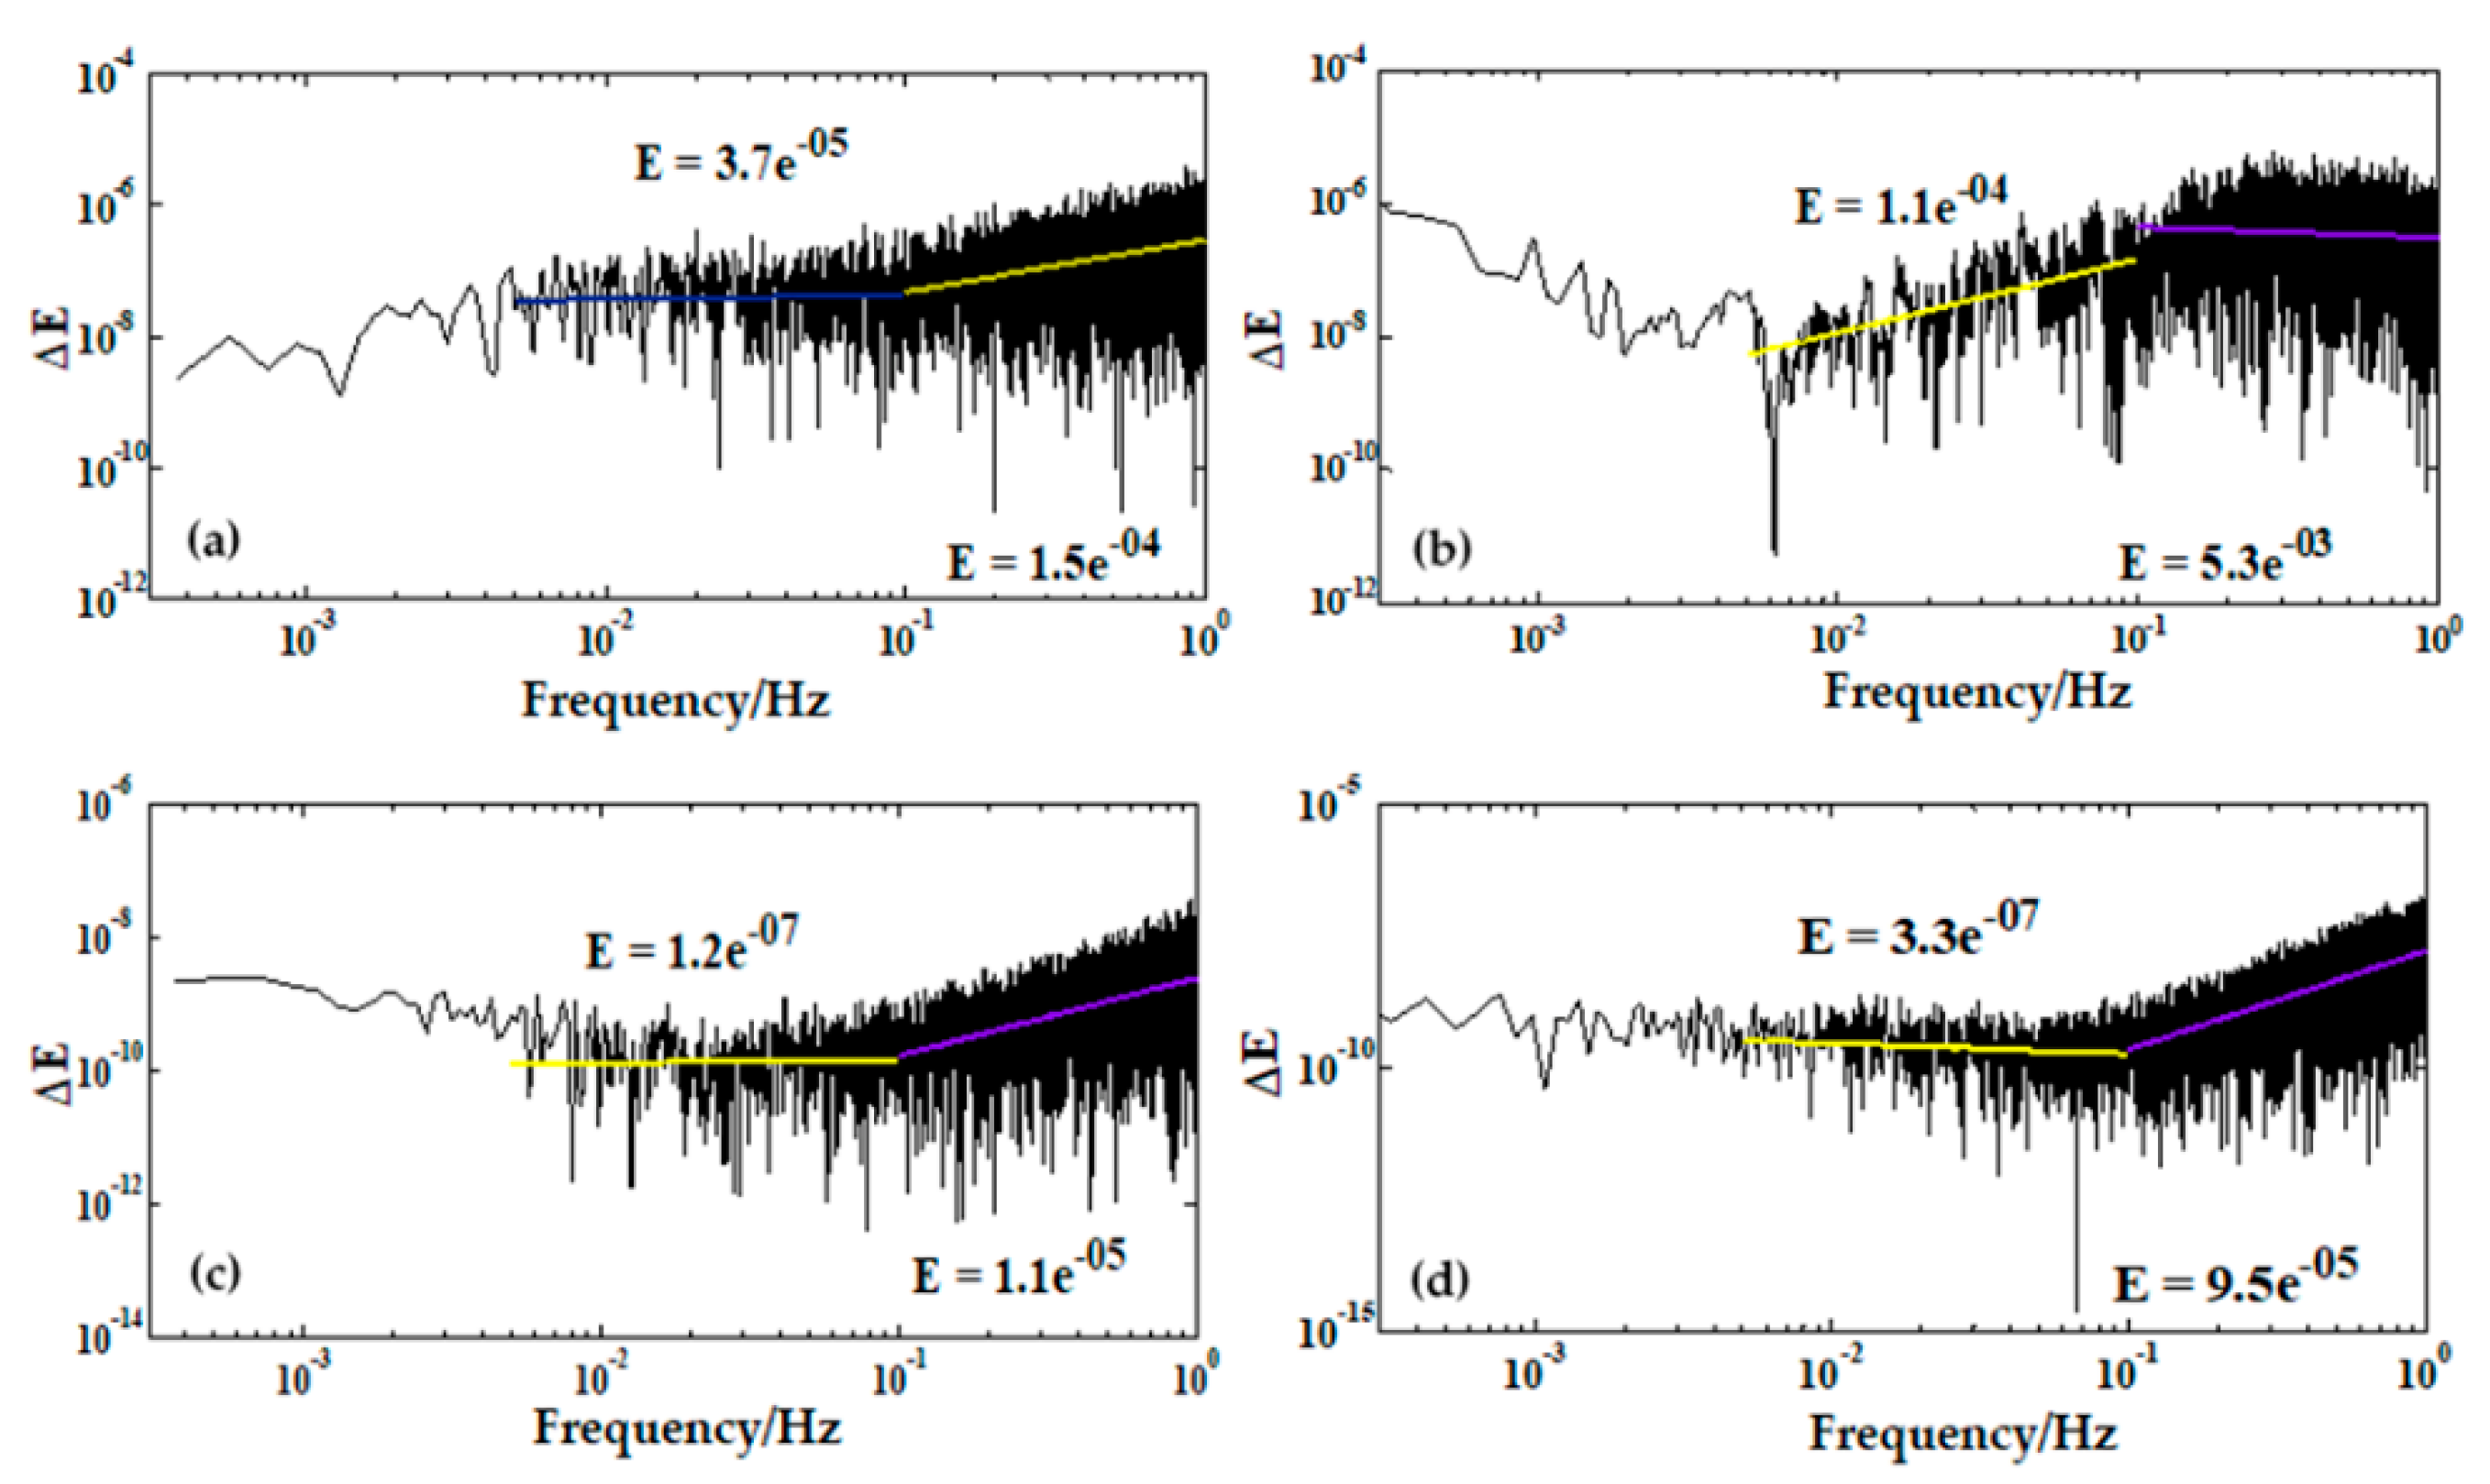
Figure 8 shows the spontaneous energy E during the corrosion process. At the beginning, after 5 days, the energy was of an order of magnitude higher in laminar flow (1.1 × 10⁻⁴). This fact is consistent with the SEM image presented in Figure 2, which showed the accelerated corrosion process causing severe damage to the alloy surface exposed to laminar flow.
However, at the end of the experiment (30 days), the energy diminished in magnitude, being very similar in the order of 10−7, for both flows probably on account of the formation of layers of corrosion products with different characteristics that act as a physical barrier on the alloy surfaces, slowing down the corrosion attack.

4. Conclusions

  • The initial electrochemical activity of 6061-T6 aluminum alloy surface, immersed in Caribbean seawater, was studied for 30 days under laminar flow (0.1 m s−1, 21 °C). The changes in the morphology and elemental composition of the formed layers have revealed localised corrosion (fissures and deep cracks) in the vicinity of intermetallic particles rich in Fe and Cu, which act as cathodes. The attack was less aggressive in stationary (no flow) seawater, with shallow pits occurring on the surface at 30 days of exposure.
  • The calculated values showed that the corrosion current (icorr) of AA6061-T6 increases with the time of exposure more than one order higher when the alloy is exposed under laminar flow of seawater (7.12–18.08 µA cm−2) while, in stationary conditions, it maintains almost similar values (17.51–19.32 µA cm−2). With the statistical data obtained from the corrosion current, the calculated pitting index (PI) revealed that AA606-T6 is four times more susceptible to localised corrosion in seawater under laminar flow (PI = 0.96) compared to that in stationary conditions (PI = 0.22). The estimated PSD slopes (β exponent) of the current fluctuations transformed into the frequency domain revealed that, in laminar and stationary flows (β = 1.0 and 0.94, respectively), the electrochemical corrosion may be attributed to the fractional Gaussian noise (fGn), associated with a persistent stationary process.
  • The spontaneous energy release in the initial stages is one order higher in laminar flow (ΔE = 1.1 × 10⁻⁴). However, at the end of the experiment (30 days), the energy diminished in magnitude, being very similar in an order of 10−7, for both flows probably on account of the formation of layers of corrosion products with different characteristics that act as a physical barrier on the alloy surfaces, slowing down the corrosion attack.
  • The observed effect of the laminar seawater flow on the AA6061-T6 corrosion process should be considered as a consequence of the facilitated diffusion of the oxygen at the metal–seawater interface, resulting in specific transformation in the composition of the formed corrosion layers. The presented surface SEM-EDS and XPS analysis agree positively with the results obtained with both nondestructive electrochemical methods.

Author Contributions

G.A. and L.C. performed the corrosion test. LV. and G.A. discussed the results and wrote the manuscript; J.L.L. contributed in the PSD software. L.V. supervised the project. All correspondence should be addressed to L.V. All authors have read and agreed to the published version of the manuscript.

Funding

This research was funded by Centro Mexicano de Inovación en Energía del Océano (CEMIE) grant number (00249795).

Acknowledgments

The authors acknowledge LANNBIO for permitting the use of their facilities as well as M. Sci. Dora Huerta and W. J. Cauich-Ruiz for their technical assistance in data acquisition. Luis Chávez gratefully thanks CONACYT for his scholarship as a M.Sci. student at CINVESTAV-IPN.

Conflicts of Interest

The authors declare no conflict of interest.

References

  1. Davis, J.R.; David, J.R. Understanding the Basics; Davis, J.R., Ed.; ASM International: Materials Park, OH, USA, 2001; pp. 351–416. [Google Scholar]
  2. Altenpohl, D.G. Aluminum Viewed from within: An Introduction into the Metallurgy of Aluminum Fabrication; Aluminum-Verlag: Düsseldorf, Germany, 1982; pp. 1–225. [Google Scholar]
  3. Pourbaix, M. Atlas of Electrochemical Equilibria in Aqueous Solutions; NACE: Houston, TX, USA, 1974; pp. 168–176. [Google Scholar]
  4. Szklarska-Smialowska, Z. Pitting Corrosion of Aluminum. Corros. Sci. 1999, 41, 743–1767. [Google Scholar] [CrossRef]
  5. Tiryakioğlu, M.; Staley, J. Physical metallurgy and the effect of alloying additions in aluminum alloys. In Handbook of Aluminum; Totten, G.E., MacKenzie, D.S., Eds.; Marcel Dekker, Inc.: New York, NY, USA, 2003; pp. 81–210. [Google Scholar]
  6. Reboul, M.C.; Baroux, B. Metallurgical aspects of corrosion resistance of aluminium alloys. Mater. Corros. 2011, 62, 215–233. [Google Scholar] [CrossRef]
  7. Mutombo, K. Intermetallic Particles-induced pitting corrosion in 6061-T651 aluminium alloy. Mater. Sci. Forum 2011, 690, 389–392. [Google Scholar] [CrossRef]
  8. Li, J.; Dang, J.G. A Summary of corrosion properties of Al-rich solid solution and secondary phase particles in Al alloys. Metals 2017, 7, 84. [Google Scholar] [CrossRef]
  9. Alodan, M.A.; Smyrl, W.H. Detection of localized corrosion of aluminum alloys using fluorescence microscopy. J. Electrochem. Soc. 1998, 145, 1571–1577. [Google Scholar] [CrossRef]
  10. Zheng, Y.; Luo, B.; Bai, Z.; Wang, J.; Yin, Y. Study of the precipitation hardening behavior and intergranular corrosion of Al-Mg-Si alloy with differing Si contents. Metals 2017, 7, 387. [Google Scholar] [CrossRef]
  11. Ku, M.-H.; Hung, F.-Y.; Lui, T.-S.; Lai, J.-C. Enhanced formability and accelerated precipitation behavior of 7075 Al alloy extruded rod by high temperature aging. Metals 2018, 8, 648. [Google Scholar] [CrossRef] [Green Version]
  12. Davoodi, A.; Pan, J.; Leygraf, C.; Norgren, S. The role of intermetallic particles in localized corrosion of an aluminum alloy studied by SKPFM and integrated AFM/SECM. J. Electrochem. Soc. 2008, 155, C211–C218. [Google Scholar] [CrossRef] [Green Version]
  13. Birbilis, N.; Buchheit, R. Electrochemical characteristics of intermetallic phases in aluminum alloys an experimental survey and discussion. J. Electrochem. Soc. 2005, 152, B140–B151. [Google Scholar] [CrossRef] [Green Version]
  14. McCafferty, E. Sequence of steps in the pitting of aluminum by chloride ions. Corros. Sci. 2003, 5, 1421–1438. [Google Scholar] [CrossRef]
  15. Burstein, G.T.; Liu, C.; Souto, R.M.; Vines, S.P. Origins of pitting corrosion. Corros. Eng. Sci. Technol. 2004, 39, 25–30. [Google Scholar] [CrossRef]
  16. Guseva, O.; DeRose, J.A.; Schmutz, P. Modelling the early stage time dependence of localised corrosion in aluminium alloys. Electrochim. Acta. 2013, 88, 821–831. [Google Scholar] [CrossRef]
  17. LaQue, F.L. Marine Corrosion: Causes and Prevention; John Wiley & Sons, Inc.: Hoboken, NJ, USA, 1975. [Google Scholar]
  18. Al-Fozan, S.A.; Malik, A.U. Effect of seawater level on corrosion behavior of different alloys. Desalination 2008, 228, 61–67. [Google Scholar] [CrossRef]
  19. Roberge, P. Handbook of Corrosion Engineering; The McGraw-Hill Companies, Inc.: New York, NY, USA, 2000. [Google Scholar]
  20. Dawson, J.L. Electrochemical noise measurement: The definitive in-situ technique for corrosion applications. In Electrochemical Noise Measurement for Corrosion Applications; Kearns, J., Scully, J., Roberge, P., Reichert, D., Dawson, J.L., Eds.; ASTM STP 1277; ASTM International: West Conshohocken, PA, USA, 1996; pp. 3–35. [Google Scholar]
  21. Xia, D.H.; Song, S.Z.; Behnamian, Y. Detection of corrosion degradation using electrochemical noise (EN): Review of signal processing methods for identifying corrosion forms. Corros. Eng. Sci. Techn. 2016, 51, 527–544. [Google Scholar] [CrossRef]
  22. Jiemin, L.; Yang, X.; Zhu, R.; Zhang, Y. Corrosion and serration behaviors of TiZr0.5NbCr0.5VxMoy high entropy alloys in aqueous environments. Metals 2014, 4, 597–608. [Google Scholar]
  23. Tang, Y.; Dai, N.; Wu, J.; Jiang, Y.; Li, J. Effect of surface roughness on pitting corrosion of 2205 duplex stainless steel investigated by electrochemical noise measurements. Materials 2019, 12, 738. [Google Scholar] [CrossRef] [PubMed] [Green Version]
  24. Roberge, P.R. Quantifying the stochastic behavior of electrochemical noise measurement during the corrosion of aluminum. In Electrochemical Noise Measurement for Corrosion Applications; Kearns, J.R., Scully, J.R., Roberge, P.R., Reichert, D.L., Dawson, J.L., Eds.; ASTM STP 1277; ASTM International: West Conshohocken, PA, USA, 1996; pp. 142–156. [Google Scholar]
  25. Eke, A.; Hermán, P.; Bassingthwaighte, J.B.; Raymond, G.M.; Percival, D.B.; Cannon, M.; Balla, I.; Ikrényi, C. Physiological time series: Distinguishing fractal noises from motions. Pflugers Arch. Eur. J. Phy. 2000, 439, 403–415. [Google Scholar] [CrossRef]
  26. Delignieres, D.; Ramdani, S.; Lemoine, L.; Torre, K.; Fortes, M.; Ninot, G. Fractal analyses for ‘short’ time series: A re-assessment of classical methods. J. Math. Psychol. 2006, 50, 525–544. [Google Scholar] [CrossRef]
  27. Planinšič, P.; Petek, A. Characterization of corrosion processes by current noise wavelet-based fractal and correlation analysis. Electrochim. Acta 2008, 53, 206–5214. [Google Scholar] [CrossRef]
  28. López, J.L.; Veleva, L.; López-Sauri, D.A. Multifractal detrended analysis of the corrosion potential fluctuations during copper patina formation on its first stages in sea water. Int. J. Electrochem. Sci. 2014, 9, 1637–1649. [Google Scholar]
  29. Acosta, G.; Veleva, L.; López, J.L. Power spectral density analysis of the corrosion potential fluctuation of aluminium in early stages of exposure to Caribbean sea water. Int. J. Electrochem. Sci. 2014, 9, 6464–6474. [Google Scholar]
  30. Acosta, G.; Veleva, L.; López, J.L.; López-Sauri, D.A. Contrasting initial events of localized corrosion on surfaces of 2219-T42 and 6061-T6 aluminum alloys exposed in Caribbean seawater. Trans. Nonferrous Met. Soc. China 2019, 29, 34–42. [Google Scholar] [CrossRef]
  31. Mena-Morcillo, E.; Veleva, L.P.; Wipf, D.O. Multi-scale monitoring the first stages of electrochemical behavior of AZ31B magnesium alloy in simulated body fluid. J. Electrochem. Soc. 2018, 165, C749–C755. [Google Scholar] [CrossRef]
  32. McCabe, W.L.; Smith, J.C.; Harriott, P. Unit Operations of Chemical Engineering, 4th ed.; McGraw Hill: New York, NY, USA, 1985; p. 43. [Google Scholar]
  33. ASTM G1−90. In Standard Practice for Preparing, Cleaning, and Evaluation corrosion Test Specimens; ASTM International: West Conshohocken, PA, USA, 1999.
  34. ASTM G199-09. In Standard Guide for Electrochemical Noise Measurement; ASTM International: West Conshohocken, PA, USA, 2014.
  35. Stein, J.Y. Digital Signal Processing: A Computer Science Perspective, 2nd ed.; John Wiley & Sons, Inc: New York, NY, USA, 2000; p. 115. [Google Scholar]
  36. Yasakau, K.A.; Zheludkevich, M.L.; Ferreira, M.G.S. Role of intermetallics in corrosion of aluminum alloys. Smart Corrosion Protection. In Intermetallics Matrix Composites: Properties and Applications; Mitra, R., Ed.; Woodhead Publishing: Aveiro, Portugal, 2018; pp. 425–462. [Google Scholar]
  37. Li, Y.; Gao, G.; Wang, Z.; Di, H.; Li, J.; Xu, G. Effects of the Mg/Si Ratio on microstructure, mechanical properties, and precipitation behavior of Al–Mg–Si–1.0 wt %-Zn alloys. Materials 2018, 11, 2591. [Google Scholar] [CrossRef] [Green Version]
  38. Afzal, S.N.; Shaikh, M.A.; Mustafa, C.M.; Nabi, M.; Ehsan, M.Q.; Khan, A.H. Study of aluminum corrosion in chloride and nitrate media and its inhibition by nitrite. J. Nepal Chem. Soc. 2006, 22, 26–33. [Google Scholar] [CrossRef]
  39. Foley, R.T.; Nguyen, T.H. The chemical nature in aluminum corrosion, V. Energy transfer in aluminum dissolution. J. Electrochem. Soc. 1982, 129, 464–467. [Google Scholar] [CrossRef]
  40. Brown, R.R.; Daut, G.E.; Mrazek, R.V.; Gokcen, N.A. Solubility and Activity of Aluminum Chloride in Aqueous Hydrochloric Acid Solutions; U.S. Dept. of the interior, Bareau of Mines: Washington, DC, USA, 1979.
  41. Nikseresht, Z.; Karimzadeh, F.; Golozar, M.A.; Heidarbeigy, M. Effect of heat treatment on microstructure and corrosion behavior of Al6061 alloy weldment. Mater. Des. 2010, 31, 2643–2648. [Google Scholar] [CrossRef]
  42. Zhu, Y.; Sun, K.; Frankel, G.S. Intermetallic phases in aluminum alloys and their roles in localized corrosion. J. Electrochem. Sci. 2018, 165, C807–C820. [Google Scholar] [CrossRef]
  43. Ghali, E. General, galvanic, and localized corrosion of aluminum and its alloys. In Corrosion Resistance of Aluminum and Magnesium Alloys: Understanding, Performance, and Testing; Winston Revie, R., Ed.; John Wiley & Sons: Hoboken, NJ, USA, 2010; pp. 176–214. [Google Scholar]
  44. John, F.M.; William, F.S.; Peter, E.S.; Kenneth, D.B. Handbook of X-ray Photoelectron Spectroscopy; Physical Electronics Inc.: Chanhassen, MN, USA, 1992. [Google Scholar]
  45. Loto, C.A. Electrochemical Noise Measurement Technique in Corrosion Research. Int. J. Electrochem. Sci. 2012, 7, 9248–9270. [Google Scholar]
  46. Malo, J.M.; Velazco, O. Elecrochemical noise response of steel under hydrodynamic conditions. In Electrochemical Noise Measurement for Corrosion Applications; Kearns, J.R., Scully, J.R., Roberge, P.R., Reichert, D.L., Dawson, J.L., Eds.; ASTM STP 1277; ASTM International: West Conshohocken, PA, USA, 1996; pp. 387–397. [Google Scholar]
  47. Sanchez-Amaya, J.M.; Cottis, R.A.; Botana, F.J. Shot noise and statistical parameters for the estimation of corrosion mechanisms. Corros. Sci. 2005, 47, 3280–3299. [Google Scholar] [CrossRef]
  48. Curioni, M.; Cottis, R.A.; Thompson, G.E. Application of electrochemical noise analysis to corroding aluminium alloys. Surf. Interface Anal. 2013, 45, 1564–1569. [Google Scholar] [CrossRef]
  49. G102-89. In Standard Practice for Calculation of Corrosion Rates and Related Information from Electrochemical Measurements; ASTM International: West Conshohocken, PA, USA, 1994.
  50. Eden, D.A.; John, D.A.; Dawson, J.L. International Patent WO 87/07022; World Intellectual Property Organization: Manchester, UK, 1987. [Google Scholar]
Figure 1. (a) SEM images (×500) of AA6061-T6 surface before immersion in Caribbean seawater and (b) zoom zone (×2000).
Metals 10 00175 g001
Figure 2. SEM images of AA6061-T6 surface after exposure in Caribbean seawater under laminar flow for 5 days (a) and after removal of corrosion layer (b).
Metals 10 00175 g002
Figure 3. SEM images of AA6061-T6 surface after 30 days of exposure in Caribbean seawater for (a) laminar and (b) stationary flow conditions and after removal of corrosion products for (c) laminar and (d) stationary flow conditions.
Metals 10 00175 g003
Figure 4. Free corrosion potential (φcorr) values of AA6061-T6 samples in Caribbean seawater during 30 days: (a) with laminar and (b) stationary flows.
Metals 10 00175 g004
Figure 5. Overview XPS spectra acquired from AA6061-T6 after 30 days of immersion in Caribbean seawater with laminar flow: (a) full spectrum; (b) and (c) spectrum for O1s and Al2p, respectively.
Metals 10 00175 g005
Figure 6. Current density fluctuation for AA6061-T3 immersed in Caribbean seawater up to 30 days under (a) laminar and (b) stationary flows.
Metals 10 00175 g006
Figure 7. PSD plot (A2/f) of current noise signal vs frequency (Hz) for AA6061-T6 after 30 days of exposure to seawater: (a) with laminar and (b) stationary flows.
Metals 10 00175 g007
Figure 8. Energy (E) from AA6061-T6 surface after immersion in seawater under laminar flow (a) at 5 days and (b) after 30 days of exposure and stationary flow (c) at 5 days and (d) after 30 days of exposure.
Metals 10 00175 g008
Table 1. EDS analysis (wt.%) of reference aluminum alloy 6061-T6 surface.
ElementCOMgAlSiCrMnFeCu
A2.43.3-60.36.51.31.623.70.9
B2.32.7-59.37.41.31.524.21.3
C2.24.5-71.74.80.60.914.60.7
D2.02.11.793.70.5----
Table 2. EDS analysis (wt.%) of aluminum alloy 6061-T6 surface after 5 days of exposure (zone A, B, C) in Caribbean seawater under laminar flow at 21°C; zone D - after removal of corrosion products.
ElementCONaMgAlSiCrSMnClKCaFeCu
A-47.40.71.225.11--1.8-23.3-0.5--
B6.456.61.91.029.2--0.4-0.50.53.5--
C4.411.5-0.881.20.4-0.4-0.30.80.2--
D10.94.7-0.458.05.80.6-1.2---17.60.8
Table 3. EDS analysis (wt.%) of aluminum alloy 6061-T6 surfaces: after 30 days of exposure in seawater under laminar flow (zones A, B, C) and after removal the layer of corrosion products (zones D, E, F, G).
ElementCONaMgAlSiCrMnClCaFeCu
A3.322.32.23.310.20.7--1.00.31.055.7
B4.231.31.71.839.63.90.50.80.80.514.20.7
C12.744.90.53.037.80.1--0.50.5--
D4.1---63.36.01.01.21.5-21.81.1
E5.74.4-0.584.63.20.70.9----
F5.71.5--69.65.11.31.0--15.00.8
G5.84.6-0.788.20.40.2-----
Table 4. Average of free corrosion potential (φcorr) values for AA6061-T6 in Caribbean seawater under laminar and stationary flows at different times.
Exposure Time/Daysφcorr vs SCE/mV (Laminar Flow)φcorr vs SCE/mV (Stationary Flow)
0−713 ± 2.80−741 ± 16.40
5−729 ± 2.70−619 ± 0.95
30−618 ± 1.00−614 ± 0.28
Table 5. Polarisation resistance (Rp) and corrosion current density values for AA6061-T6 immersed up to 30 days in Caribbean seawater with laminar and stationary flows.
Time/dRp/kΩ cm2icorr /µA cm−2
Laminar FlowStationary FlowLaminar FlowStationary Flow
03.6523.467.121.11
52.2417.511.601.49
301.4419.318.081.35
Table 6. Corrosion rate of AA6061-T6 in Caribbean seawater from the Cozumel Channel under laminar and stationary flows.
Time/dCR/mm year−1
Laminar FlowStationary Flow
00.080.012
50.130.016
300.200.014
Table 7. Pitting index of AA6061-T6 immersed for 30 days in Caribbean seawater (Cozumel Channel) under laminar and stationary flows.
Time/dσi/nAirms/nAPitting index
LaminarStationaryLaminarStationaryLaminarStationary
0772639546252550.140.12
512791146425228660.300.40
30639147166667330.960.22

