Abstract
The corrosion behavior of a 15Cr-6Ni-2Mo martensitic stainless steel (15Cr stainless steel) in a CO2/H2S environment was investigated by conducting high-temperature/high-pressure immersion tests combined with scanning electron microscopy and metallographic microscopy. The presence of H2S decreased the corrosion resistance of the 15Cr tubing steel. The critical H2S partial pressure (PH2S) for stress corrosion cracking in the 15Cr tubing steel in the simulated oil field environment with a CO2 partial pressure of 4 MPa and an applied stress of 80% σs was identified. The 15Cr tubing steel mainly suffered uniform corrosion with no pitting and cracking when the PH2S was below 0.5 MPa. When the PH2S increased to 1 MPa and the test temperature was 150 °C, the pitting and cracking sensitivity increased. The stress corrosion cracking at a higher PH2S is attributed to the sulfide-induced brittle fracture.
1. Introduction
Corrosion is a difficult problem and a pervasive issue encountered during the development and exploitation of oil and gas fields. In particular, with the deep exploitation and the aging of oil fields, the environments for oil and gas exploitation are becoming more complex and harsher for the metal pipes, leading to their severe deterioration [1]. Therefore, the corrosion damage of oil casing tubes has increased significantly, causing frequent production halts or oil spill accidents, which leads to substantial economic losses [2,3,4,5]. Therefore, effective anti-corrosion technology and measures are urgently needed. To date, various anti-corrosion measures have been developed, which play an important role in the prevention and mitigation of oil field corrosion. At present, the main anti-corrosion measures include the use of corrosion-resistant alloys, coatings and corrosion inhibitors, and the combinations thereof [6,7,8,9,10,11,12,13]. A comparative analysis of the economic situation [14] indicated that, in terms of long-term cost investments, the application of corrosion-resistant materials showed distinct superiority. The use of corrosion-resistant materials during the exploitation of oil and gas fields not only prevents initial investments but also reduces maintenance, repair, and other associated expenses [15,16,17]. The main objective of developing a new type of oil pipe material is to further reduce the costs. The material 15Cr is a relatively new type of martensitic stainless steel, and compared with 13Cr stainless steel [18,19,20], it has an increased content of Cr and Ni, which possibly increases the corrosion resistance of the material. To date, the basic properties of 15Cr stainless steel and its corrosion resistance in the oil field acidification environment have been reported [21,22,23]. The influences of pH and Cl− content on the corrosion resistance of 15Cr have also been investigated and the threshold PH2S of 15Cr SS was calculated at 1.5 psi; above this value, 15Cr might suffer sulfide stress cracking [24,25]. Ishiguro et al. [26] studied the stress corrosion cracking of 15Cr-125ksi materials with a 100% specified minimum yield strength (SMYS) applied stress in a H2S environment, and showed no sulfide stress cracking (SSC) at PH2S = 0.1 MPa. However, there are few reports on the corrosion behavior of 15Cr tubing with applied stress under the co-existence of CO2 and H2S in simulated oil fields, and the critical value of H2S affecting 15Cr-110ksi tubing under certain partial pressures of CO2 still needs to be further determined.
In this study, the corrosion behavior of 15Cr martensitic stainless steel tubing under applied stress was studied under the co-existence of H2S and CO2, and the environmentally assisted cracking susceptibility of the materials under stress and stress-free conditions was compared. Moreover, the threshold values of the H2S concentration for the 15Cr tubing steel in the H2S and CO2 environment were obtained.
2. Experimental
2.1. Materials and Methods
The samples were cut from 15Cr-6Ni-2Mo (UNS S42625) martensitic stainless steel commercial tubing, with the chemical compositions: 0.024 wt.% of C, 0.002 wt.% of S, 0.013 wt.% of P, 0.28 wt.% of Si, 15.22 wt.% of Cr, 0.18 wt.% of Mn, 6.31 wt.% of Ni, 2.11 wt.% of Mo, 0.41 wt.% of Cu, 0.02 wt.% of N, and the remaining (up to 100) wt.% of Fe, and an actual yield strength (σs) of 825 MPa was used. The samples were divided into two groups: with and without applied stress. The samples without applied stress were cut to the size of 40 × 10 × 3 mm (length × width × thickness), and the size of the samples for the stress corrosion test was 57 × 10 × 3 mm. Prior to each experiment, all the samples were carried out in accordance with the treatment procedures specified in the standard GB/T 15970.2-2000 (ISO 7539-2), so as to avoid and reduce the existence of residual stress. For the samples with applied stress, the longitudinal edge was polished to prevent stress concentration caused by the edges and corners. After polishing, the samples were cleaned with distilled water and ethanol, dried under cool air, and stored in a dry N2 atmosphere.
The tests were carried out in an autoclave at 90 and 150 °C at the CO2 partial pressure of 4 MPa. The H2S partial pressures (PH2S) were 0.1, 0.5, and 1 MPa, respectively. The test solution with the Cl− concentration of 150 g·L−1, simulating the formation water in oil fields, was prepared from analytical grade sodium chloride and deionized water.
2.2. Immersion Tests
The immersion tests were conducted in an autoclave. Prior to the weight loss tests, the samples were cleaned with distilled water and acetone, dried, and then weighed using a balance with a precision of 0.1 mg. The weight values were recorded as the original weight (W0i, i = 1, 2…). In order to ensure the reproducibility of the results, four parallel samples were taken from each group. The solution was deoxygenated by bubbling pure nitrogen to ensure that the low oxygen concentration was below 10 ppb (according to the requirement of oil field water quality). Then, H2S, CO2, and heat were introduced. The total pressure was brought up to 10 MPa by purging nitrogen through the system.
After the completion of the tests, the corroded samples were divided into two groups. One sample was used to observe the corrosion morphology, and the other three were used to calculate the average corrosion rate to ensure the reproducibility of the results. The corrosion products were removed via the chemical method according to GB/T 16545-1996 (idt ISO 8407: 1991), then rinsed and dried, and then finally reweighed to obtain the final weight (W1i). The corrosion rate (Vi) was calculated in mm/y (average corrosion thinning depth in years) from the weight loss by using Equation (1) [27] as follows
where W0i and W1i are, respectively, the original and final weights of the samples in g, S is the exposed surface area of the samples in mm2, t represents the immersion time in h, and ρ is the steel density equaling 7.8 × 10⁻³ g·mm−3. An average corrosion rate of the three different samples for each test condition was reported as an overall corrosion rate for each set of conditions.
Vi = 8.76 × 10⁶ × (W0i − W1i)/(t × ρ × S) (i = 1,2…)
2.3. SCC Testing
Stress corrosion cracking testing was carried out by the immersion method under high-temperature and high-pressure conditions in an autoclave. To ensure the reproducibility of the results, there were three parallel specimens in each stress test, and the test was only effective when the specimen broke or cracked in the working area. In these tests, all sample surfaces required precision machining and a surface roughness of Ra ≤ 0.2 μm. These stress corrosion cracking tests were adopted a four-point bending loading method [28]; this method was operated according to the standard GB/T 15970.2-2000 (ISO 7539-2: Corrosion of metals and alloys-Stress corrosion testing—Part 2: Preparation and use of bent-beam specimens). The schematic diagram of the four-point bending loading device is shown in Figure 1.
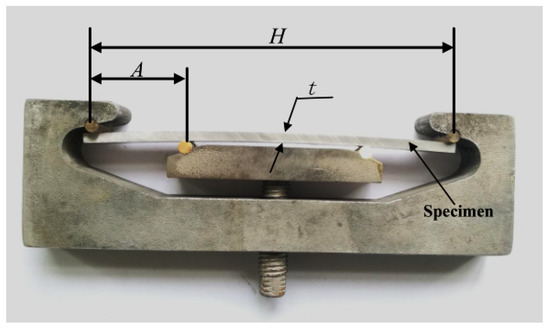
Figure 1.
Schematic presentation of the four-point bending loading method.
In this study, according to the engineering requirements, the actual yield strength (825 MPa) value of the material was used to calculate the stress value loaded on the sample, rather than the specified minimum yield strength (SMYS) (758 MPa), so an appropriate stress ratio coefficient of 80% was used. Stress loading can be achieved by Equation (2) as follows [29]
where H represents the distance between the two outermost fulcrums, E is the elastic modulus, A represents the distance between the inner and outer fulcrums, t is the sample thickness, and σ represents the stress value of the loading. Using these known parameters to calculate the maximum deflection y between the outer fulcrums, the stress is loaded by detecting the deflection change of the specimen.
σ = 12E × t × y/(3H2 − 4A2)
2.4. Characterization
After the corrosion tests, the samples used for the surface analysis were removed and rinsed with deionized water, followed by an alcohol rinse, and then dried.
The corrosion products and cracks were studied using scanning electron microscopy (SEM) and optical microscopy (OM). Energy-disperse spectroscopy (EDS) was used to analyze the compositions of the corrosion products.
3. Results and Discussion
3.1. Average Corrosion Rate
The average corrosion rates under different H2S partial pressures are listed in Table 1. When the PCO2 and PH2S equals 4 and 1 MPa, respectively, the specimen breaks and the fracture surface becomes corroded, and thus the corrosion rate cannot be calculated accurately.

Table 1.
The average corrosion rates of samples under high-temperature and high-pressure.
The corrosion rates of the samples with 80% σs were higher than those of the samples without applied stress. The average corrosion rate of the samples increased gradually with the increase in the H2S partial pressure and test temperature. Under the high H2S partial pressure, the sample under the applied stress cracked, indicating that the sulfide-caused stress corrosion cracking gradually became more dominant with the increase in the H2S concentration [24]. H2S dissolves in water and reacts chemically to form metal sulfides and hydrogen atoms. The hydrogen atom diffuses into the material at the crack tip with the highest tensile stress. The diffusion and accumulation of hydrogen on the lattice, the surface of the lattice, and the grain boundary reduce the plastic deformation ability of the material and cause hydrogen embrittlement, making it easier for the crack to expand.
On the other hand, H2S is a hydrogen recombination poison which significantly affects brittle fractures of materials [30]. The hydrogen ions formed on the cathode cannot effectively form hydrogen molecules due to the poisoning effect of the HS− and S2− ions [31,32], and thus the hydrogen concentration on the surface of the steel increases, resulting in the diffusion of hydrogen into the steel. Steel enrichment by hydrogen eventually makes the steel brittle. Moreover, under the applied stress, the surface activity of the samples gets enhanced, and fractures are more likely to occur [33]. The H2S partial pressure also directly affects the pH of the solution [34]. When the partial pressure increases, the corrosion products on the metal surface become loose and they gradually increase the corrosion rate [35,36]. At the same time, when the loose product film falls off, there is a potential difference between the exposed substrate and the product film with good adhesion, and thus many tiny corrosion couples are formed on the surface of the sample which promote the accelerated corrosion in the anode region with a low potential.
Under the co-existence of CO2 and H2S, the corrosive medium has a competitive and synergistic effect on the corrosion behavior of the materials. With the increase in the test temperature, the solubility of the CO2/H2S corrosion gas decreases, yet the reaction rate in the solution system accelerates, promoting corrosion. Therefore, the overall outcome depends on the synergistic effect among the temperature, stress, and corrosive gases.
3.2. Observation of Corrosion Morphology
After the high-temperature and high-pressure tests, the surface corrosion morphology was inspected. Figure 2 and Figure 3 show the microscopic morphologies of the corroded samples without applied stress. The corrosion scales were even. Polishing marks on the surface indicate that the corrosion film was thin (see Figure 2). Figure 3 shows that with the increase in the test temperature, the surface corrosion morphology was relatively rough, and when at PH2S = 1 MPa, similar pitting morphology was found on the surface of the samples at 150 °C (see Figure 3c). The results show that the pitting corrosion sensitivity of 15Cr stainless steel increases due to the synergistic action between a high temperature and high H2S concentration.
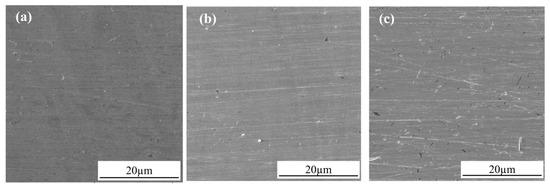
Figure 2.
Micro-corrosion morphology of the samples without stress at 90 °C, with different experimental conditions (a) PH2S = 0.1 and PCO2 = 4 MPa, (b) PH2S = 0.5 and PCO2 = 4 MPa and (c) PH2S = 1 and PCO2 = 4 MPa.
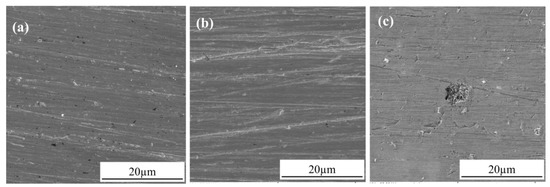
Figure 3.
Micro-corrosion morphology of the samples without stress at 150 °C, with different experimental conditions (a) PH2S = 0.1 and PCO2 = 4 MPa, (b) PH2S = 0.5 and PCO2 = 4 MPa and (c) PH2S = 1 and PCO2 = 4 MPa.
Figure 4 shows the surface corrosion morphology (as shown in the red box area) of the samples under the condition of applied stress. At PH2S ≤ 0.5 MPa, and with an increase in the temperature, the corrosion film on the sample’s surface is similar to that on the surface of the samples without stress, and no cracking or fractures are observed (see Figure 4a), indicating that the applied stress of 80% σs under the experimental conditions has no obvious effect on the surface activity of the samples. However, at PH2S of 1 MPa and a test temperature of 150 °C, the samples exhibit cracks and fractures at their center regions. Nonetheless, there are more micro-cracks around the main crack (see Figure 4b).
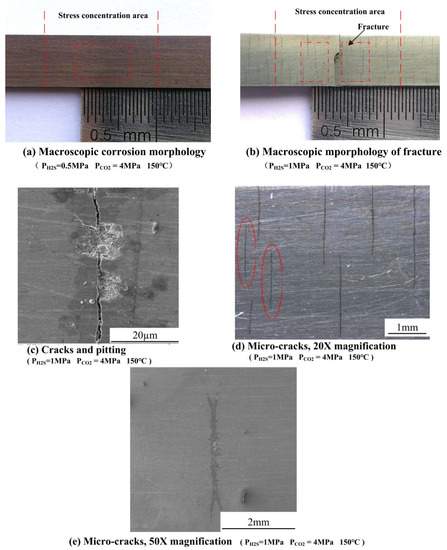
Figure 4.
The surface corrosion morphology of the samples under the applied stress at 150 °C: (a) Macro-corrosion morphology of stress concentration surface, (b) Macro-corrosion morphology of fracture area, (c) Micro-morphology of crack and pitting in the stress concentration region, (d) Micro-cracks morphology originating from the center of the sample in the stress concentration region (20× magnification), and (e) Micro-crack morphology under 50× magnification.
Figure 4c exhibits that the pitting corrosion occurred around the crack, indicating that when the PH2S equals 1 MPa, the pitting susceptibility of the material under the stress-state reaches its critical value. Pitting corrosion plays an important role in stress corrosion cracking. Surface cracks were also observed on the fractured samples. Clearly, some micro-cracks originated from the center of the sample along its width direction and extended to both ends of the sample, and the two red rings in Figure 4d indicate the origin of the cracks in the middle of the samples. Figure 4e is a high-magnification of the cracks marked with red rings, and the typical characteristics of sulfide stress corrosion cracking at both ends of the crack can be observed, which indicates that the stress corrosion cracking sensitivity of 15Cr stainless steel is higher, and that cracking failure occurs under these simulated test conditions.
The cross-sections of the fracture side morphologies are shown in Figure 5. The main crack propagated almost through the thickness of the sample. Many smaller sub- and micro-cracks were located around the main crack. Distinct dendritic cracks were found at the crack tips, showing typical sulfide stress corrosion features (marked by the red circles in Figure 5a,b). Thus, 15Cr stainless steel tubing is not suitable for use in the simulated oil field environment, as H2S-related corrosion occurs easily.
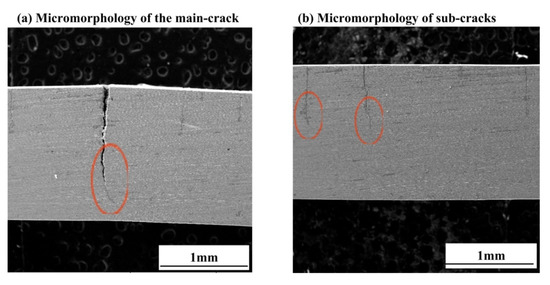
Figure 5.
The side morphology of the fractured sample: (a) Main crack tip propagation morphology and (b) Growth morphology of sub-cracks tip.
The color of the corrosion products near the cracks (marked as the “A” region in Figure 6a) was different from that of the other no-cracking areas (marked as the “B” region): the “A” region appears dark gray and the “B” region has a lighter color.
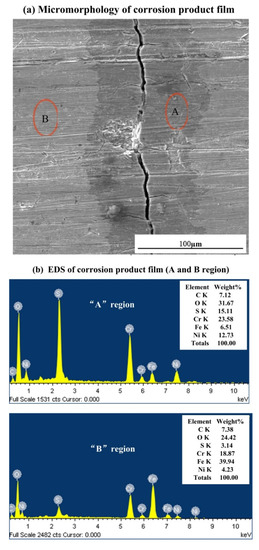
Figure 6.
Surface morphologies (a) corrosion products of two different regions near the crack and (b) Energy-dispersive spectroscopy (EDS) analyses.
The EDS analysis (shown in Figure 6b) revealed that the “A” and “B” regions were mainly composed of S, C, O, and Fe elements. However, the sulfur content in the “A” region was higher than in the “B” region. This indicates that the adsorption of H2S on the active surface, and the anodic dissolution of the matrix, promote the occurrence of stress cracking. However, the higher content of sulfide at the fracture region further demonstrates that the H2S can elevate the cracking susceptibility of the samples under applied stress [37,38]. Thus, the surface activity of the stress-concentrated region is much higher, and the chemical reaction between the alloy and H2S is favored over the reaction of CO2 and the material. Moreover, at a high temperature, H2S dissolves in the solution and the H atoms get adsorbed and penetrate the sample surface, accelerating the chemical reaction between S2− and the material [39]. Owing to this effect, increased amounts of sulfides were generated in the stress-concentrated regions of the samples. Therefore, the synergistic effect of the applied stress and H2S corrosion medium contributed to the much more severe localized corrosion in the stress-concentrated region, prompting the formation and extension of the crack [38], and finally inducing the sample fracture. The results are consistent with the stress corrosion cracking characteristics of the preceding broken sample, indicating that the failure of the specimens mainly belongs to the sulfide stress cracking mode. The mechanism for the reaction between H2S and the materials in the test solution is shown by Equations (3)–(7) [40]:
Fe + H2S → Fe + H2Sadsorbed
Fe + H2Sadsorbed → Fe + HS− adsorbed + H+ adsorbed
Fe+ HS−adsorbed + H+ adsorbed → FeHS−adsorbed + H+ adsorbed
FeHS−adsorbed + H+ adsorbed → FeHS+adsorbed + H adsorbed + e−
FeHS+adsorbed + H adsorbed + e− → FeSadsorbed + 2H adsorbed
The fractured samples are separated along the fracture direction. Subsequently, the corrosion morphologies of the fracture surface are shown in Figure 7. The low-magnification of the fracture surface does not reveal metallic luster (see Figure 7a). The higher magnification microscopy images show a thick corrosion film covering the fracture surface (see Figure 7b), and as a result, the exact fracture morphology of the crack is hard to detect. This corrosion film is mainly composed of S, Fe, C, and O elements (see Figure 7c). This can infer that the sample fractured during the test and the fresh fracture surface were further corroded when exposed to the corrosive medium.
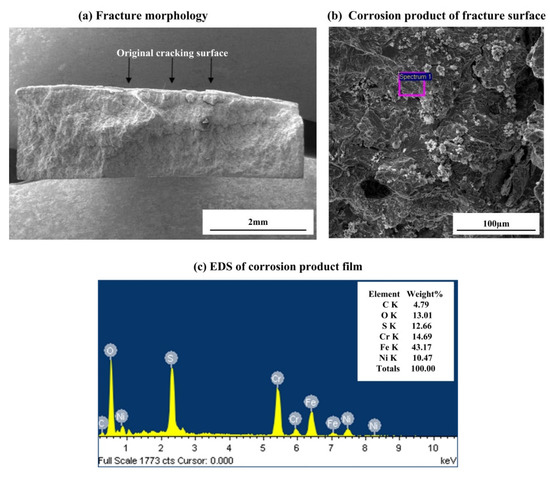
Figure 7.
(a) Low and (b) high magnification of the fracture morphology, and its (c) EDS analysis.
Figure 8 shows the micro-morphology of the fracture surface after cleaning the corrosion products, and intergranular corrosion characteristics can be clearly observed (see Figure 8). Secondary cracks along the grain boundaries can also be seen (see Figure 8b). This further illustrates that the samples loaded with 80% σs sustained brittle sulfide stress corrosion cracking at a 1 MPa H2S partial pressure. Thus, this material has a high sensitivity to stress corrosion cracking at the given experimental condition, and therefore is not suitable for oil field environments with similar conditions.
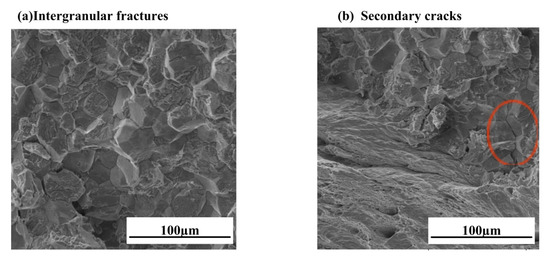
Figure 8.
Intergranular corrosion characteristics of fracture surfaces. (a) Micromorphology of intergranular corrosion on the fracture surface and (b) Secondary crack morphology on fracture surface.
4. Conclusions
In this study, the corrosion and stress corrosion cracking behaviors of a 15Cr tubing steel with and without applied stress were studied by the weight loss and four-point bending methods in a high-temperature and high-pressure environment. The main results and conclusions are as follows:
(1) When the PCO2 was 4 MPa and the PH2S was less than or equal to 0.5 MPa, the average corrosion rate of the 15Cr tubing increased in the simulated oil field environment with the increase of H2S pressure. The 15Cr tubing steel mainly showed uniform corrosion. No clear signs of pitting were found, and no crack or fracture occurred when the samples were loaded with 80% σs;
(2) At 150 °C, and at PCO2 = 4 MPa and PH2S = 1 MPa, the pitting sensitivity of the 15Cr tubing steel was higher, and cracking occurred when the samples were loaded at 80% σs.
Author Contributions
X.Z. conducted the research and result analysis under the supervision of Y.F., W.H. and J.Z. contributed in design of the experiments and morphology analysis during the research activities, and G.L. contributed in image processing and data calculation. All authors have read and agreed to the published version of the manuscript.
Funding
This research was founded by the National Key R&D Program of China (2017YFB0304905) and Major projects of China national petroleum corporation (2014E-3603)”.
Acknowledgments
The authors greatly acknowledge the financial support from the National Key R&D Program of China and the CNPC Science and Technology Project, and also acknowledge the state key laboratory for its support of high-temperature and high-pressure experiments.
Conflicts of Interest
The authors declare no conflict of interest.
References
- Zhao, X.H.; Han, Y.; Bai, Z.Q.; Wei, B. The experiment research of corrosion behavior about Ni-based alloys in simulant solution containing H2S/CO2. Electrochim. Acta 2011, 56, 7725. [Google Scholar] [CrossRef]
- Wang, H.T.; Han, E.H. Simulation of metastable corrosion pit development under mechanical stress. Electrochim. Acta 2013, 90, 128. [Google Scholar] [CrossRef]
- Zanotto, F.; Grassi, V.; Balbo, A. Stress corrosion cracking of LDX2101 duplex stainless steel in chloride solutions in the presence of thiosulphate. Corros. Sci. 2014, 80, 205. [Google Scholar] [CrossRef]
- Bueno, A.H.S.; Moreir, E.D.; Gomes, J.A.C.P. Evaluation of stress corrosion cracking and hydrogen embrittlement in an API grade steel. Eng. Fail. Anal. 2014, 36, 423. [Google Scholar] [CrossRef]
- Lu, L.S.; Song, W.W.; Yang, X.T. Corrosion Causes of Premium Connection S13Cr Tubing in a well. Corros. Prot. 2015, 36, 76. [Google Scholar]
- Fajardo, S.; Bastidas, D.M.; Criado, M. Electrochemical study on the corrosion behavior of a new low-nickel stainless steel in carbonated alkaline solution in the presence of chlorides. Electrochim. Acta 2014, 129, 60. [Google Scholar] [CrossRef]
- Machuca, L.L.; Bailey, S.I.; Gubner, R. Systematic study of the corrosion properties of selected high-resistance alloys in natural seawater. Corros. Sci. 2012, 64, 8. [Google Scholar] [CrossRef]
- Zhao, X.H.; Bai, Z.Q.; Feng, Y.R.; Wei, B.; Yin, C.X.; Wang, J.Z. Effects of heat treatment and precipitated phase on corrosion resistance of Ni-based alloy. Trans. Mater. Heat Treat. 2011, 33, 39. [Google Scholar]
- Sun, Y.L.; Bai, Z.Q.; Zhang, G.C.; Wei, B.; Zhu, S.D. Research Statue on Anticorrosion Properties of Bimetallic Composite Tubes in Oil and Gas Field. Total Corros. Control 2011, 25, 10. [Google Scholar]
- Zhao, S.; Lan, W. Present status and research progress of anticorrosion technology in pipeline. Surf. Technol. 2015, 44, 112. [Google Scholar]
- Palimi, M.J.; Peymannia, M.; Ramezanzadeh, B. An evaluation of the anticorrosion properties of the spinel nanopigment filled epoxy composite coatings applied on the steel surface. Prog. Org. Coat. 2015, 80, 164–175. [Google Scholar] [CrossRef]
- Prabhu, R.A.; Venkatesha, T.V.; Shanbhag, A.V. Inhibition effects of some Schiff’s bases on the corrosion of mild steel in hydrochloric acid solution. Corros. Sci. 2008, 50, 3356. [Google Scholar] [CrossRef]
- Sumithra, K.; Kavita, Y.; Manivannan, R.; Noyel, V.S. Electrochemical investigation of the corrosion inhibition mechanism of Tectona grandis leaf extract for SS304 stainless steel in hydrochloric acid. Corros. Rev. 2017, 35, 111–121. [Google Scholar]
- Xiang, R.; Luo, D.D.; Wei, D. Economic evaluation of corrosion protection measures based on corrosion status of typical gathering pipelines. Saf. Environ. 2013, 13, 207. [Google Scholar]
- Ningshen, S.; Sakairi, M.; Suzuki, K.; Ukai, S. The corrosion resistance and passive film compositions of 12% Cr and 15% Cr oxide dispersion strengthened steels in nitric acid media. Corros. Sci. 2014, 78, 322. [Google Scholar] [CrossRef]
- Jiménez, H.; Olaya, J.J.; Alfonso, J.E.; Pineda-Vargas, C.A. Corrosion resistance of Ni-based coatings deposited by spray and fuse technique varying oxygen flow. Surf. Coat. Technol. 2017, 321, 341. [Google Scholar] [CrossRef]
- Mesquita, T.J.; Chauveau, E.; Mantel, M. Corrosion and metallurgical investigation of two supermartensitic stainless steels for oil and gas environments. Corros. Sci. 2014, 81, 152. [Google Scholar] [CrossRef]
- Zhang, Z.; Zheng, Y.S.; Li, J.; Liu, W.Y.; Liu, M.Q.; Gao, W.X.; Shi, T.H. Stress corrosion crack evaluation of super 13Cr tubing in high-temperature and high-pressure gas wells. Eng. Fail. Anal. 2019, 95, 263. [Google Scholar] [CrossRef]
- Nacéra, S.M.; Brian, C.; Russell, K.; Tanmay, A.; James, S. Sour Service Limits of Martensitic Stainless Steels: A Review of Current Knowledge, Test Methods and Development Work. In CORROSION 2013; NACE International: Houston, TX, USA, 2013; p. 2639. [Google Scholar]
- Qiu, Z.C.; Liu, X.; Zhang, N. Corrosion Behavior of 13Cr Steel in Different Temperature. Adv. Mater. Res. 2014, 37, 168. [Google Scholar] [CrossRef]
- Lv, X.H.; Zhang, F.X.; Yang, X.T. Corrosion Performance of High Strength 15Cr Martensitic Stainless Steel in Severe Environments. J. Iron Steel Res. Int. 2014, 21, 774. [Google Scholar]
- Wan, J.Q.; Ran, Q.X.; Li, J.; Xu, Y.L. A new resource-saving, low chromium and low nickel duplex stainless steel 15Cr-xAl-2Ni-yMn. Mater. Des. 2014, 53, 43. [Google Scholar] [CrossRef]
- Meng, J.; Chambers, B.; Kane, R.; Skogsberg, J.; Kimura, M.; Shimamoto, K. Environmentally Assisted Cracking Testing of High Strength 15 Cr Steel in Sour Well Environments. In CORROSION 2011; NACE International: Houston, TX, USA, 2011; p. 100. [Google Scholar]
- Brian, C.; James, S.; John, M.; Mitsuo, K. Evaluation of Environmentally Assisted Cracking Resistance of High Strength 15Cr Steel in Sour Well Environments. In CORROSION 2012; No.C0001353; NACE International: Houston, TX, USA, 2012. [Google Scholar]
- ISO 15156-3-2015. Petroleum and Natural Gas Industries-Materials for Use in H2S-Containing Environments in Oil and Gas Production–Part 3: Cracking-Resistant CRAS (Corrosion-Resisitant Alloys) and Other Alloys; ISO: Geneva, Switzerland, 2015. [Google Scholar]
- NACE International. Available online: http://eurocorr.efcweb.org/2014/abstracts/10/7368.pdf (accessed on 10 March 2020).
- JB/T (1999). GB/T Standard 7901. Metal Materials-Uniform Corrosion-Methods of Laboratory Immersion Testing; Institute of Integrated Technology and Economics of Mechanical Industrial Instruments and Meters: Beijing, China, 2001. [Google Scholar]
- GB/T (2000). GB/T Standard 15970.2. Corrosion of Metals and Alloys-Stress Corrosion Testing-Part 2: Preparation and Use of Bent-Beam Specimens; China Standards Press: Beijing, China, 2001. [Google Scholar]
- Hinds, G.; Wickstrom, L.; Mingard, K.; Turnbull, A. Impact of surface condition on sulphide stress corrosion cracking of 316L stainless steel. Corros. Sci. 2013, 71, 43–52. [Google Scholar] [CrossRef]
- Jiang, W.J. Piping Material Selection for Wet H2S Environment of Hydrotreating Unit. Shandong Chem. Ind. 2019, 48, 118. [Google Scholar]
- Kittel, J.; Ropital, F.; Grosjean, F.; Sutter, E.M.M.; Tribollet, B. Corrosion mechanisms in aqueous solutions containing dissolved H2S. Part 1: Characterisation of H2S reduction on a 316L rotating disc electrode. Corros. Sci. 2013, 66, 324. [Google Scholar] [CrossRef]
- Smith, S.N. Current Understanding of Corrosion Mechanisms Due to H2S in Oil and Gas Production Environments. In CORROSION 2015; NACE: Dallas, TX, USA, 2015; p. 5485. [Google Scholar]
- Bao, M.Y.; Ren, C.Q.; Hu, J.S.; Liu, B.; Li, J.; Wang, F.; Guo, X. Stress Induced Corrosion Electrochemical Behavior of Steels for Oil and Gas Pipes. Chin. Soc. Corros. Prot. 2017, 37, 504. [Google Scholar]
- Plennevaux, C.; Kittel, J.; Frégonèse, M.; Normand, B.; Ropital, F.; Grosjean, F.; Cassagne, T. Contribution of CO2 on hydrogen evolution and hydrogen permeation in low alloy steels exposed to H2S environment. Electrochem. Commun. 2013, 26, 17. [Google Scholar] [CrossRef]
- Sun, W.; Nesic, S.; Papavinasam, S.K. Kinetics of Iron Sulfide and Mixed Iron Sulfide/Carbonate Scale Precipitation in CO2/H2S Corrosion. In Corrosion 2006; No. 06644; NACE International: San Diego, CA, USA, 2006. [Google Scholar]
- Choi, Y.S.; Nesic, S.; Ling, S. Effect of H2S on the CO2 corrosion of carbon steel in acidic solutions. Electrochim. Acta 2011, 56, 1752. [Google Scholar] [CrossRef]
- Zhang, N.Y.; Zhang, Z.; Zhao, W.T.; Liu, L.; Shi, T.H. Corrosion Evaluation of Tubing Steels and Material Selection in the CO2/H2S Coexistent Environment. In CORROSION 2018; NACE International: Phoenix, AZ, USA, 2018. [Google Scholar]
- Lu, Y.; Zhang, Y.; Liu, Z.G.; Zhang, Y.; Wang, C.M.; Guo, H.J. Corrosion control in CO2/H2S-produced water of offshore oil fields. Anti Corros. Methods Mater. 2014, 61, 166. [Google Scholar] [CrossRef]
- Jingen, D.; Wei, Y.; Xiaorong, L.; Xiaoqin, D. Influence of H2S Content on CO2 Corrosion Behaviors of N80 Tubing Steel. Pet. Sci. Technol. 2011, 29, 1387. [Google Scholar] [CrossRef]
- Zhang, G.A.; Zeng, Y.; Guo, X.P.; Jiang, F.; Shi, D.Y.; Chen, Z.Y. Electrochemical corrosion behavior of carbon steel under dynamic high pressure H2S/CO2 environment. Corros. Sci. 2012, 65, 37. [Google Scholar] [CrossRef]
© 2020 by the authors. Licensee MDPI, Basel, Switzerland. This article is an open access article distributed under the terms and conditions of the Creative Commons Attribution (CC BY) license (http://creativecommons.org/licenses/by/4.0/).