Abstract
The AA7050 alloy prepared through the standard industrial hot-forging cycle has been investigated by means of isothermal mechanical spectroscopy (MS) from room temperature up to 185 °C. Each MS test consisted of a cycle with two stages, at increasing and decreasing strain. After each cycle the damping value resulted to be higher than the original one indicating the occurrence of an irreversible transformation. Such phenomenon, observed for all the test temperatures, becomes more relevant for T ≥ 150 °C. The irreversible transformation has been discussed and explained by considering the evolution of the mean dislocation link length between pinning points represented by nanometric MgZn2 precipitates. The breakaway of dislocation segments from pinning points occurs in the stage at increasing strain and is not fully recovered during the second stage at decreasing strain thus the mean link length increases in a MS test cycle. The onset of thermal activated dislocation cross-slip at about 150 °C favors the dislocation breakaway and consequently enhances the effect on damping.
1. Introduction
Thanks to their light weight, workability and relative low cost, the Al alloys are widely used for structural aeronautic applications [1,2,3]. AA7050 is one of the best performing alloys of the 7XXX series for the good balance of high strength, corrosion resistance and toughness [4,5] achieved by controlling recrystallization during and after hot forming processes [6,7,8,9,10] and is mainly employed for fuselage structures, wing coverings, landing gear supports and rivets.
Components with complex geometric shape are often produced by closed-die forging and several works about the hot deformation behavior can be found in literature [11,12,13]. To reach the optimal precipitate distribution and guarantee the best mechanical properties, the AMS 4333 International Standard prescribes that components made of AA7050 alloy undergo a cold deformation step (5% max) between quenching and aging steps [14,15].
Instead of cold deformation, an innovative process, proposed by the present investigators [16,17], adopts an intermediate warm deformation step in the temperature range 150–200 °C. This process improves fracture toughness without detrimental effects on yield stress and ultimate tensile strength. Moreover, it reduces the microstructural heterogeneity by grain refining. In fact, dislocation cross-slip occurring during deformation in this temperature range allows a general grain re-orientation and the sub-boundaries present inside the grains tend to evolve towards high-angle boundaries: the higher the deformation temperature, the easier the process. The process, described in many papers [7,18,19,20], is defined by some investigators Continuous Dynamic Recrystallization (CDR). Other phenomena, such us strain hardening [21,22] and recovery [23], depend on how the dislocation structure evolves and how dislocations interact with other defects. Cross-slip is recognized as an effective mechanism that favors the bypass of obstacles by dislocations and affects their final structure [24].
In order to better understand the phenomena occurring during warm deformation of AA7050 alloy isothermal mechanical spectroscopy (MS) measurements have been performed at different temperatures, from room temperature to 185 °C. The knowledge of damping under different conditions of strain and temperature can be useful for solving practical industrial problems [25,26,27,28,29] and investigating basic aspects of materials science [30,31]. Damping is connected to anelastic phenomena occurring in a solid body and its variations provide information about a number of microstructural processes, some of them not detectable by other experimental techniques; the formal theory of anelasticity and an exhaustive description of specific physical mechanisms leading to an anelastic response of a material to an applied stress can be found in the classic book of Nowick and Berry [32]. MS has been used to study a great variety of metals and alloys after different thermo-mechanical treatments. For example, recently damping variations depending on microstructural features (dislocations, stacking faults and twins) in extruded pure Mg after plastic deformation and subsequent annealing treatments have been investigated by Kim and Park [33] while Tang et al. [34] studied the effect of Y content in extruded Mg. The effects of the annealing temperature on damping in an Fe11Cr-2.5Mo-0.1Zr-1.0Ni forged alloy have been investigated by Chen et al. [35].
The MS technique is quite sensitive to the motion of lattice defects like dislocations, therefore isothermal MS tests have been performed along a cycle with increasing and decreasing strain for investigating the mechanical behavior at strain levels well below those typical of the macroscopic plastic deformation.
2. Materials and Methods
The nominal chemical composition of the AA7050 alloy is reported in Table 1.

Table 1.
Nominal chemical composition of the AA7050 alloy (wt %).
The samples for the MS experiments have been prepared by using the standard industrial hot-forging cycle for AA7050 alloy (according to AMS2770R) which prescribes a cold deformation step (5% max) followed by two aging steps (see Table 2). The aging steps produce the precipitation of MgZn2 phase [17] that is responsible for the increased tensile properties compared to those of the un-aged alloy [36].
Table 2.
Standard industrial hot-forging cycle of AA7050 alloy (according to AMS 4333 International Standard).
The microstructure of the samples has been characterized by means of a scanning electron microscope SEM-FEG (SEM FEG LEO 1550 ZEISS McQuairie, London, UK) equipped with an EDS OXFORD X ACT system (v2.2, Oxford Instruments, Abington, UK). MgZn2 phase forms both along grain boundaries and inside the grains (see Figure 1a,b). The image in Figure 1a shows particles of ~200–300 nm along grain boundaries while finer precipitates of ~10–20 nm in the grain interior are evidenced in (b). Through the image analysis of ten micrographs taken at the same magnification of that in Figure 1b, a mean distance between the nanometric precipitates inside the grains of ~30 nm was determined. The image processing and quantitative analysis has been performed by using the software IMAGE-J Fiji 1.46 (National Institute of Health, 20892 Bethesda, Rockville Pike, MD, USA).
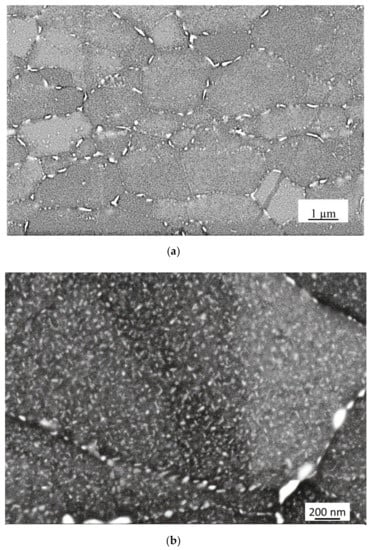
Figure 1.
Precipitation of MgZn2 phase following the standard industrial hot-forging cycle. The image in (a) shows the precipitation of large MgZn2 particles along grain boundaries. The image in (b) at higher magnification displays the presence of nanometric precipitates inside the grains.
MS experiments were carried out using bar-shaped samples (60 mm × 7 mm × 0.5 mm) excited by flexural vibrations and operating in conditions of resonance with resonance frequency in the range of kHz. The VRA 1604 apparatus (CANTIL Srl, Bologna, Italy) used in MS experiments has been described in ref. [37]. Isothermal measurements at different temperatures (50, 100, 150, 165, 175 and 185 °C) were carried out by changing the strain step by step from 8 × 10⁻⁶ to 6 × 10⁻⁴ and vice versa. The strain levels, which are well below those typical of macroscopic plastic deformation, are high enough to induce strain dependent damping.
To prevent possible microstructure transformations before MS tests the samples were heated to the test temperature with an average rate of 100 °C/minute. The apparatus has an automatic system for controlling the temperature that slows down the heating rate when the final temperature is approaching. The final temperature is stabilized in 1–2 min (depending on the temperature), namely a time whose effect on precipitation of MgZn2 particles can be considered negligible for the temperatures examined in present work.
The damping (Q−1) was determined from the logarithmic decay δ of flexural vibrations:
being An and An+k the amplitude of the n -th and n + k-th vibration, respectively.
The samples before and after the MS run tests have been examined through X-ray diffraction (Philips, Eindhoven, The Netherlands) (XRD) by using the radiation Cu-Kα (λ = 0.15408 nm). The spectra were collected in step-scanning mode with 2Θ steps of 0.05° and counting time of 10 s per step in the angular range 20–100°.
Figure 2 shows the XRD pattern of the original material. The relative intensities of the strongest diffraction lines are reported in Table 3 and compared with those of International Centre for Diffraction Data (ICCD) database (4-787 file) [38] corresponding to Al with random oriented grains. From the comparison it is evident that the examined material exhibits a strong cubic texture, namely the grains are mainly oriented along the (100) direction.
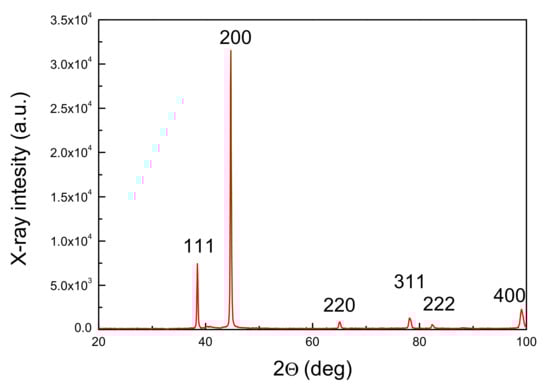
Figure 2.
XRD pattern of the AA7050 alloy after the standard industrial hot-forging cycle.
Table 3.
Relative intensities of the XRD peaks of the AA7050 alloy after standard industrial hot-forging cycle. Data from the 4-787 file of JCPDS-ICCD database corresponding to Al with random oriented grains are reported for comparison.
Electron backscatter diffraction (EBSD) characterization published in a previous paper [17] showed the presence of sub-grains inside the grains of larger size. The mean size of grains was 9.4 ± 0.6 µm and that of sub-grains was 4 ± 0.3 µm.
High precision peak profiles of the most intense reflections were recorded with 2θ steps of 0.005° and counting time of 20 s per step. The dislocation density ρ in original material and after MS test runs was determined by analyzing the broadening of high precision peak profiles. The total half height linewidth βT of the XRD lines can be expressed as:
being λ the X-ray wavelength, θ the Bragg’s angle, and the contributions due to the size D of coherently diffracting domains and microstrains ε, respectively. From EBSD results, the first term ( in the Equation (2) can be neglected and βT ≅ βε. By introducing the measured βT values the micro-strains ε have been determined and the corresponding dislocations density has been then calculated through the Williamson–Smallman relationship [39]:
where K is a parameter = 16, b = 0.2856 nm is the modulus of Burgers vector and k0 ≅ 1 is a factor depending on dislocation interaction. After the standard industrial hot-forging cycle the dislocation density of AA7050 alloy resulted to be 1.4 × 10¹⁶ m−2.
3. Results and Discussion
Isothermal MS tests provided internal friction (Q−1) vs. strain (ε) curves at different temperatures. Figure 3 shows the curves obtained in test runs at 50, 100, 150, 165 and 185 °C; open circles indicate the values measured during the stage at increasing strain, solid circles at decreasing strain. In the first stage of all the curves Q−1 progressively increases with strain and exhibits a sharp slope change in corresponding of a critical strain. In general, damping can be considered as the sum of two contributions, one independent (Q−1I) and the other one dependent on the strain (Q−1D):
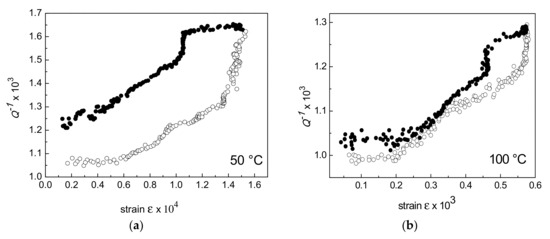
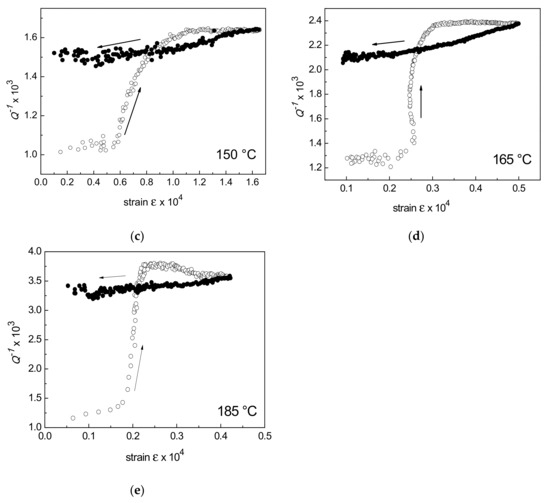
Figure 3.
Q−1 vs. ε curves obtained in test runs carried out at 50 °C (a), 100 °C (b), 150 °C (c), 165 °C (d) and 185 °C (e).
For the strains involved in present experiments, there is a strain dependent Q−1 contribution. According to the Granato–Lücke (GL) string model [32,40,41], the strain dependent damping is connected to dislocation breakaway from pinning points and can be expressed by the equation:
being C1 and C2 two constants related to the microstructural features:
where Ω is an orientation factor taking into account the contributions of dislocations in each of the slip systems, Δ0 ≅ 4(1 − ν)/π2, being ν the Poisson’s ratio, ρ the dislocation density, l0 the average dislocation link length, Ξ a factor depending on the anisotropy of elastic constants, a = 0.404 nm the lattice parameter, η the size factor of the pinning solute atoms with respect to the solvent.
According to Equation (5), the GL plot, i.e., log (ε.Q−1D) vs. ε−1, should exhibit a linear trend, however this is not observed in present experiments. For example, Figure 4 shows the GL plot of a sample tested at 50 °C which substantially exhibits two different slopes. On the other hand, it is evident that all the curves in Figure 3 do not have a simple exponential trend.
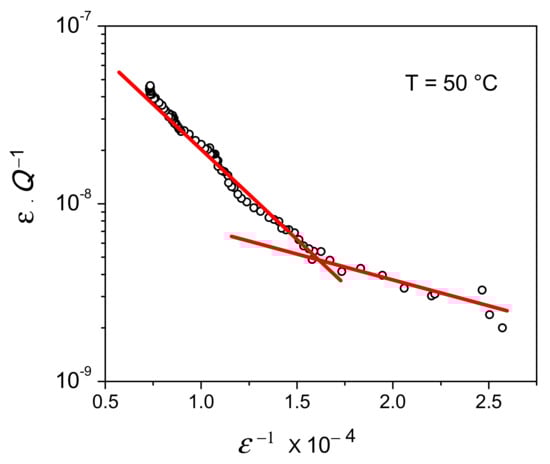
Figure 4.
Mechanical spectroscopy (MS) test at 50 °C: the Granato–Lücke (GL) plot exhibits a change of slope.
The GL model has been developed to explain the behavior of pure metals where point defects represent the only pinning points of dislocation segments. In the case of the AA7050 alloy submitted to the standard industrial hot-forging cycle, the microstructure exhibits a diffuse precipitation inside the grains (see Figure 1b) and MgZn2 particles strongly contribute to pin the dislocations. Therefore, in the present experiments, two types of pinning points with different characteristics are present and the two slopes observed in Figure 4 can be explained by considering the depinning from point defects (low strain branch) and from precipitates (high strain branch). The presence of different mechanisms playing a key role on damping in the low and high strain regions has been observed also in other Al alloys; for instance, in Al-Mg alloys the absorption of Mg atoms into the stacking faults is dominant at low strain whereas the movement of extended dislocations is prevalent at high strain [42].
MgZn2 particles are immobile obstacles to dislocation motion and their density is scarcely affected by the test temperatures and times involved in present experiments whereas vacancy concentration and mobility are strongly temperature dependent (see Figure 5). The curves of vacancy concentration (n/N) and migration speed v have been calculated by means of the relationships:
where n is the number of vacancies, N the total number of atoms, R the gas constant, T the temperature, Ef the vacancy formation energy (17.525 cal/mole), Em the vacancy migration energy (14.300 cal/mole) and A is a constant (≅1015). In spite of the strong dependency on temperature, the vacancy concentration reaches a maximum value of about 5 × 10⁻⁹ at the maximum test temperature considered here (185 °C); thus, the effect of pinning due to point defects is quite lower with respect to that due to particles. In turn, vacancies are quite mobile and dislocation pinning can be easily restored. Moreover, data in Figure 5 highlight that the mean distance between vacancies is greater than that between precipitates. For example, at 185 °C the mean distance between vacancies is estimated to be of the order of 170 nm whereas the mean spacing between MgZn2 nanoparticles is about 30 nm. Of course, at temperatures below 185 °C, the concentration of vacancies is lower and the distance between them is still greater.
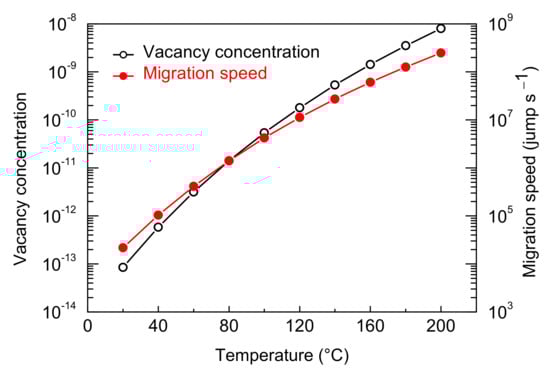
Figure 5.
Vacancy concentration and migration speed vs. temperature in the range of MS experiments.
Another relevant aspect of the curves in Figure 3 is that after a complete test run (increasing and decreasing strain) the final damping value (Q−1)2 is always higher than the initial one (Q−1)1. To highlight this phenomenon, the case of the curve obtained by testing the alloy at 50 °C is examined in detail in Figure 6.
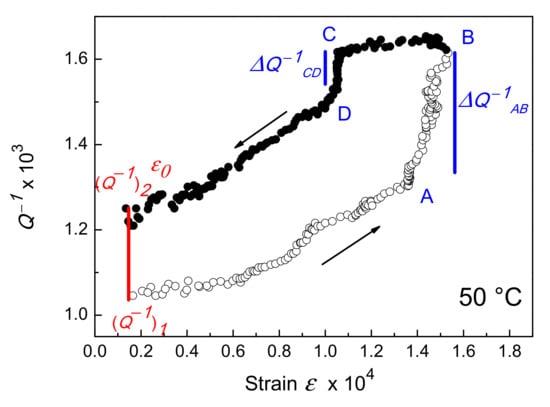
Figure 6.
Q−1 vs. ε curve obtained by testing the alloy at 50 °C.
As strain increases damping (open circles) increases too with a trend which can be described by an exponential law up to point A where the curve slope abruptly changes and becomes steeper. At point B, the value of Q−1 does not change anymore and exhibits a plateau (not displayed in Figure 6). In the reverse part of the test cycle, when ε decreases damping (close circles) remains nearly constant from B to C, then it drops down to point D and finally exhibits a slower decrease. After the completion of the test run, when the strain equals the initial one, the damping value (Q−1)2 is higher than the initial one (Q−1)1. Such a difference indicates the occurrence of an irreversible transformation of the microstructure.
In the specific case displayed in Figure 6 (Q−1)2 − (Q−1)1 ≅ Δ(Q−1)AB − Δ(Q−1)CD; therefore, the damping increase Δ(Q−1)AB due to dislocation depinning from MgZn2 particles is partially recovered in the stage at decreasing strain, −Δ(Q−1)CD, and the difference between final and initial damping, (Q−1)2 − (Q−1)1, represents the effect of dislocation segments remaining unpinned. Figure 7 schematically shows the steps of such a process.
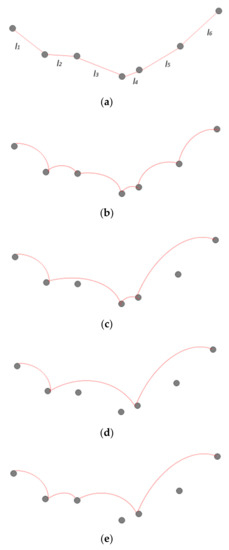
Figure 7.
Evolution of pinning of dislocation segments during the MS test cycle: (a) original condition without strain; (b) dislocation segments bow owing to the applied strain that is not enough high to cause breakaway; (c) as strain increases some segments become free from pinning points; (d) further strain increase leads to the breakaway of more segments; (e) in the cycle stage with decreasing strain, partial pinning of segments occurs.
The initial curve branch (up to point A) is connected to depinning from point defects and, as expected due to the high vacancy mobility (Figure 5), the damping effect is fully recovered in the final branch (from point D to the cycle end). In other terms, the increase of strain causes dislocation depinning from both point defects and precipitates, however in the successive stage at decreasing strain pinning by point defects is fully recovered whereas that by MgZn2 particles only in part. Some dislocation segments, which unlock from particles in the first stage of the strain cycle, remain free during the second stage; thus, the mean dislocation link length increases with a consequent damping increase. In the following, the final damping will be used to calculate the variation of dislocation link length in MS tests at the examined temperatures.
If the test temperature T ≥ 150 °C (Figure 3c–e) the damping drop Δ(Q−1)CD during the cycle stage at decreasing strain (Figure 6) is no more observed but the final value of Q−1 is always higher than the initial one. That means that dislocation segments which are depinned from precipitates during the stage at increasing strain remain free during the second stage.
The high-temperature interaction of dislocations with precipitates in Al alloys has been investigated in real time by Clark et al. [43]. In situ TEM observations of samples deformed at elevated temperature evidenced a bypass mechanism involving the interaction of lattice dislocations with the precipitate–matrix interface dislocations. It is well known from creep data [44] that Al has three different regimes of deformation with specific activation energies H of dislocation motion: (i) H = 0.15 eV for the motion through the stress field due to other dislocations, (ii) H = 1.21 eV for thermally activated cross-slip and (iii) H = 1.55 eV for climb. These regimes are specific of different temperature ranges and the transition from regime 1 to 2 spans from about 130 to 260 °C. Therefore, for T ≥ 150 °C, thermally activated cross-slip contributes to dislocation depinning from MgZn2 particles and its role increases with temperature. Breakaway of dislocation segments from precipitates by cross-slip is irreversible and after a test cycle the mean length of dislocation segments is expected to increase with consequent damping increase.
By the comparison of the curves in Figure 3, it is evident that temperature plays a key role and affects the critical strain ε* corresponding to the slope change, the damping saturation Q−1S value (point B in Figure 6) and the final damping (Q−1)2. As temperature increases, the critical strain determining the slope change in the Q−1 vs. ε curves becomes progressively smaller; therefore, the origin of such variation is clearly connected to a thermally activated process, i.e., cross-slip.
Another effect of temperature is to enhance both the damping saturation, which passes from ~1.6 × 10⁻³ for tests at 50 °C to ~3.7 × 10⁻³ at 185 °C, and the final value (Q−1)2. These results are shown in Figure 8.
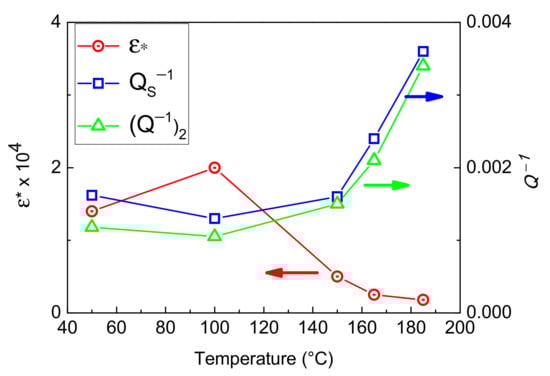
Figure 8.
Critical strain ε* corresponding to the slope change, damping saturation Q−1S and final damping (Q−1)2 plotted vs. MS test temperature.
Since MS tests up to 185 °C do not remarkably affect the mean grain size, the damping behavior of the alloy can be discussed by considering the evolution of dislocation structures. Dislocations behave like strings oscillating under the external periodic stress and the damping due a single dislocation segment depends on the distance between pinning points. According to the GL model, at low frequencies the damping can be expressed by the following relationship:
where ω = 2πf (f resonance frequency) and
being G = 26.9 GPa the Al shear modulus, b the modulus of Burgers vector and B the Al dislocation damping parameter whose dependence on temperature has been determined by Hikata et. al. [45].
Q−1 = γ ρ l04ω
According to Equation (10), if during the MS test, at a given strain, a dislocation unlocking process occurs, the mean dislocation link length between pinning points changes and consequently the damping.
The breakaway of dislocation segments from pinning points represents a microstructural transformation which could be recovered when strain decreases, however the different values of initial (Q−1)1 and final (Q−1)2 damping after a complete test cycle (see Figure 3) testify that such recovery is partial. In fact, Table 4 shows that the dislocation density determined by XRD after the test runs at different temperatures does not appreciably change thus the difference between initial and final Q−1 values must be ascribed to the increase of the mean length l0 of dislocation segments.
Table 4.
Dislocation density, resonance frequency and (Q−1)2 values obtained after MS test carried out at different temperatures.
The mean link length l0 of dislocation segments after MS test cycles at different temperatures has been calculated through Equations (10) and (11) by considering the dislocation density, resonance frequency and (Q−1)2 values reported in Table 4. The results are plotted vs. test temperature in Figure 9.
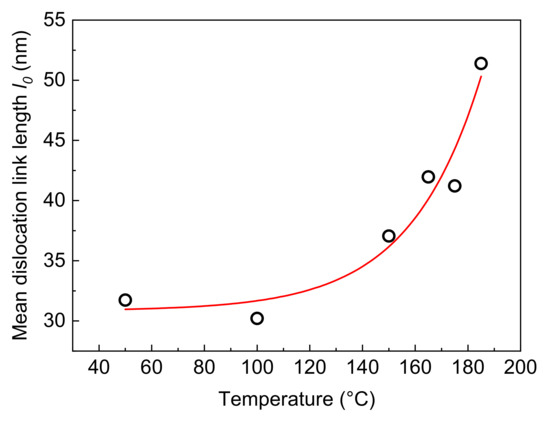
Figure 9.
Mean dislocation link length vs. MS test temperature.
The initial l0 is very close to the mean distance (30 nm) between the MgZn2 precipitates (see Figure 1b) and increases for MS tests at higher temperatures to reach a value that is almost double at 185 °C; such evolution mainly occurs for T ≥ 150 °C. The irreversible transformation corresponding to the permanent depinning of dislocations takes place at every MS test temperature examined here, however it becomes relevant after the onset of thermally activated cross-slip.
As shown in Figure 8, also the critical strain ε* shifts towards lower values as MS test temperature reaches the range for the activation of cross-slip and clearly demonstrates how it favors dislocation depinning.
On the other hand, further support to the key role of cross-slip comes from damping saturation Q−1S and final damping (Q−1)2 trends which also exhibit a strong increase for T ≥ 150 °C.
In a previous work [17] it was demonstrated that a warm deformation step (upsetting in the temperature range 150–200 °C) of the AA7050 alloy enhances fracture toughness and reduces material heterogeneity by producing finer grains and sub-grains, and it was suggested the application of the novel process to forged components with non-uniform thickness and complex 3D shape. Present results show that the mechanical behavior of the alloy is strongly temperature sensitive in the range of aforesaid upsetting: owing to the onset of thermally activated cross-slip, dislocation segments tend more easily to unlock from MgZn2 precipitates and remain free even if the material is subjected to strains of the order of 10−4, namely well below those typical of macroscopic plastic deformation. Therefore, the warm deformation step which is specific to the forging process proposed by us leads to finer grains and a more homogeneous microstructure because at ≥150 °C dislocations easily breakaway from precipitates.
4. Conclusions
The anelastic behavior of AA7050 alloy after the standard industrial hot-forging cycle has been investigated through isothermal MS tests carried out at temperatures up to 185 °C. Damping has been measured along a cycle of increasing and decreasing strain and the results can be summarized as follows.
- (i)
- Q−1 progressively increases with strain and exhibits a sharp slope change in corresponding of a critical strain ε*. The two branches of the Q−1 vs. ε curve correspond to the depinning of dislocation segments from point defects (low strain branch) and MgZn2 precipitates (high strain branch).
- (ii)
- After a complete cycle, the final Q−1 value is always higher than the initial one. Thus, an irreversible transformation takes place. Such transformation consists in the increase of mean link length of dislocation segments: part of dislocation segments, which unlock from MgZn2 precipitates during the cycle stage at increasing strain, remain free also after the stage at decreasing strain.
- (iii)
- The phenomenon, that has been observed at every MS test temperature examined here, becomes relevant after the onset of thermally activated cross-slip (T ≥ 150 °C).
- (iv)
- The ε* shift towards lower strain values and the increase of damping saturation Q−1S as temperature increases represent further evidence of the favorable conditions for depinning of dislocation segments due to thermally activated cross-slip.
- (v)
- The mean link length of dislocation segments increases with temperature and at 185 °C, the maximum temperature considered in present work, it becomes almost double of the original value.
Recently, we have proposed a novel forging process for the AA7050 alloy with a warm deformation stage instead of the conventional cold deformation one because thermally activated cross-slip involves favorable conditions for dislocation motion. The present work further supports such an idea because the results show that cross-slip affects even anelastic phenomena induced by stresses much lower than those involved in forging.
Author Contributions
Conceptualization, A.V. and R.M.; material preparation, A.D.S. and C.T.; MS tests, A.V.; SEM observations, A.D.S. and C.T.; writing, A.V. and R.M. All the authors discussed the data. All authors have read and agreed to the published version of the manuscript.
Funding
This research received no external funding.
Acknowledgments
Authors are grateful to Piero Plini and Benedetto Iacovone of the Department of Industrial Engineering at the University of Rome “Tor Vergata” for assistance in experimental work.
Conflicts of Interest
The authors declare no conflict of interest.
References and Notes
- Warren, A.S. Developments and challenges for aluminium—A Boeing perspective. Mater. Forum 2004, 28, 24–31. [Google Scholar]
- Gloria, A.; Montanari, R.; Richetta, M.; Varone, A. Alloys for Aeronautic Applications: State of the Art and Perspectives. Metals 2019, 9, 662. [Google Scholar] [CrossRef]
- Aerospace Structural Materials Handbook; DoD, Wright-Patterson Air Force Base: Dayton, OH, USA, 2001.
- Sanchez, J.M.; Rubio, E.; Alvarez, M.; Sebastian, M.A.; Marcos, M. Microstructural characterization of material adhered over cutting tool in the dry machining of aerospace aluminium alloys. J. Mater. Proc. Technol. 2005, 164–165, 911–918. [Google Scholar] [CrossRef]
- Rambabu, P.; Prasad, N.E.; Kutumbarao, V.V.; Wanhill, R.J. Aluminium Alloys for Aerospace Applications. In Aerospace Materials and Material Technologies; Aerospace Materials; Springer: Singapore, 2017; Volume 1, pp. 29–52. [Google Scholar]
- Adam, K.F.; Long, Z.; Field, D.P. Analysis of Particle-Stimulated Nucleation (PSN)-Dominated Recrystallization for Hot-Rolled 7050 Aluminum Alloy. Metall. Mater. Trans. A 2017, 48, 2062–2076. [Google Scholar] [CrossRef]
- Maizza, G.; Pero, R.; Richetta, M.; Montanari, R. Continuous dynamic recrystallization (CDRX) model for aluminum alloys. J. Mater. Sci. 2018, 53, 4563–4573. [Google Scholar] [CrossRef]
- Parker, C.G.; Field, D.P. Observation of Structure Evolution during Annealing of 7xxx Series Al Deformed at High Temperature. Light Met. 2012, 383–386. [Google Scholar]
- Wang, S.; Luo, J.; Hou, L.; Zhang, J.; Zhuang, L. Physically based constitutive analysis and microstructural evolution of AA7050 aluminum alloy during hot compression. Mater. Des. 2016, 107, 277–289. [Google Scholar] [CrossRef]
- Angella, G.; Bassani, P.; Tuissi, A.; Ripamonti, D.; Vedani, M. Microstructure evolution and aging kinetics of Al-Mg-Si and Al-Mg-Si-Sc alloys processed by ECAP. Mater. Sci. Forum 2006, 503–504, 493–498. [Google Scholar] [CrossRef]
- Kaibyshev, R.; Sitdikov, O.; Goloborodko, A. Grain refinement in as-cast 7475 aluminum alloy under hot deformation. Mater. Sci. Eng. A 2003, 344, 348–356. [Google Scholar] [CrossRef]
- Rokni, M.R.; Zarei-HAnzaki, A.; Roostaei, A.; Abedi, H.R. An investigation into the hot deformation characteristics of 7075 aluminum alloy. Mater. Des. 2011, 32, 2339–2344. [Google Scholar] [CrossRef]
- Li, D.; Zhang, D.; Liu, S.; Shan, Z.; Zhang, X.; Wang, Q.; Han, S. Dynamic recrystallization behavior of 7085 aluminum alloy during hot deformation. Trans. Nonferrous Met. Soc. China 2016, 26, 1491–1497. [Google Scholar] [CrossRef]
- Scott MacKenzie, D. Heat Treating Aluminum for Aerospace Applications. Heat Treat. Prog. 2005, 5, 37–43. [Google Scholar]
- Mott, N.F.; Nabarro, F.R.N. An attempt to estimate the degree of precipitation hardening, with a simple model. Proc. Phys. Soc. 1940, 52, 86–89. [Google Scholar] [CrossRef]
- Tedde, M.; Di Schino, A.; Donnini, R.; Montanari, R.; Richetta, M.; Santo, L.; Testani, C.; Varone, A. An innovative industrial process for forging 7050 Al alloy. Mater. Sci. Forum 2018, 941, 1047–1052. [Google Scholar] [CrossRef]
- Angella, G.; Di Schino, A.; Donnini, R.; Richetta, M.; Testani, C.; Varone, A. AA7050 Al alloy hot-forging process for improved fracture toughness properties. Metals 2019, 9, 64. [Google Scholar] [CrossRef]
- Gourdet, S.; Montheillet, F. Effects of dynamic grain boundary migration during the hot compression of high stacking fault energy metals. Acta Mater. 2002, 50, 2801–2812. [Google Scholar] [CrossRef]
- McQueen, H.J. Development of dynamic recrystallization theory. Mater. Sci. Eng. A 2004, 387–389, 203–208. [Google Scholar] [CrossRef]
- Humphreys, F.J.; Hatherly, M. Recrystallization and Related Annealing Phenomena, 2nd ed.; Elsevier: Amsterdam, The Netherlands, 2004. [Google Scholar]
- Jackson, P.J. The role of cross-slip in the plastic deformation of crystals. Mater. Sci. Eng. 1983, 57, 39–47. [Google Scholar] [CrossRef]
- Saada, G. Cross-slip and work hardening of fcc crystals. Mater. Sci. Eng. A 1991, 137, 177–183. [Google Scholar] [CrossRef]
- Poirier, J.P. On the symmetrical role of cross-slip of screw dislocations and climb of edge dislocations as recovery process controlling high-temperature creep. Rev. Phys. Appl. 1976, 11, 731. [Google Scholar] [CrossRef]
- Hussein, A.M.; Rao, S.I.; Uchic, M.D.; Dimiduk, D.M.; El-Awady, J.A. Microstructurally based cross-slip mechanisms and their effects on dislocation microstructure evolution in fcc crystals. Acta Mater. 2015, 85, 180–190. [Google Scholar] [CrossRef]
- Balijepalli, S.K.; Donnini, R.; Kaciulis, S.; Montanari, R.; Varone, A. Young’s modulus profile in kolsterized AISI 316l steel. Mater. Sci. Forum 2013, 762, 183–188. [Google Scholar] [CrossRef]
- Mayencourt, C.; Schaller, R. Mechanical-stress relaxation in magnesium-based composites. Mater. Sci. Eng. A 2002, 325, 286–291. [Google Scholar] [CrossRef]
- Costanza, G.; Montanari, R.; Richetta, M.; Tata, M.E.; Varone, A. Evaluation of structural stability of materials through Mechanical Spectroscopy. Four case studies. Metals 2016, 6, 306. [Google Scholar] [CrossRef]
- Bonetti, E.; Montanari, R.; Testani, C.; Valdrè, G. Irreversible transformation in as-cast FeAl B2-ordered alloy obtained by melt spinning. J. Mater. Res. 2000, 3, 659–664. [Google Scholar] [CrossRef]
- Campari, E.G.; Amadori, S.; Bonetti, E.; Berti, R.; Montanari, R. Anelastic Behavior of Small Dimensioned Aluminum. Metals 2019, 9, 549. [Google Scholar] [CrossRef]
- Montanari, R.; Varone, A. Synergic role of self-interstitials and vacancies in indium melting. Metals 2015, 5, 1061–1072. [Google Scholar] [CrossRef]
- Fava, A.; Montanari, R.; Varone, A. Mechanical spectroscopy investigation of point defects driven phenomena in a Cr martensitic steel. Metals 2018, 8, 870. [Google Scholar] [CrossRef]
- Nowick, A.S.; Berry, B.S. Anelastic Relaxation in Crystalline Solids; Academic Press: New York, NY, USA; London, UK, 1972. [Google Scholar]
- Kim, S.; Park, S.H. Improvement in damping capacity of extruded pure magnesium through precompression and subsequent annealing: Effects of dislocation and twin boundary motions. J. Alloys Compd. 2020, 835, 155257. [Google Scholar] [CrossRef]
- Tang, Y.T.; Zhang, C.; Ren, L.B.; Yang, W.; Yin, D.D.; Huang, G.H.; Zhou, H.; Zhang, Y.B. Effects of Y content and temperature on the damping capacity of extruded Mg-Y sheets. J. Magnes. Alloy. 2019, 7, 522–528. [Google Scholar] [CrossRef]
- Chen, K.; Yan, J.; Li, N.; Luo, M.; Shi, H.; Zhu, X.; Liu, Y.; Zhao, X.; Zhang, R. The effect of the annealing temperature on the damping capacity under constant prestress, mechanical properties and microstructure of an Fee11Cr-2.5Mo-0.1Zr-1.0Ni forged damping alloy. J. Alloys Compd. 2020, 815, 152429. [Google Scholar] [CrossRef]
- Wang, H.; Yi, Y.; Huang, S. Microstructure Evolution and Mechanical Properties of 2219 Al Alloy During Aging Treatment. J. Mater. Eng. Perform. 2017, 26, 1475–1482. [Google Scholar] [CrossRef]
- Amadori, S.; Campari, E.G.; Fiorini, A.L.; Montanari, R.; Pasquini, L.; Savini, L.; Bonetti, E. Automated resonant vibrating reed analyzer apparatus for a non destructive characterization of materials for industrial applications. Mater. Sci. Eng. A 2006, 442, 543–546. [Google Scholar] [CrossRef]
- JCPDS-International Centre for Diffraction Data, Newtown Square, PA, USA, 1993.
- Williamson, G.K.; Smallman, R.A. III. Dislocation densities in some annealed and cold-worked metals from measurements on the X-ray debye-scherrer spectrum. Philos. Mag. 1956, 1, 34–46. [Google Scholar] [CrossRef]
- Granato, A.; Lucke, K. Application of Dislocation Theory to Internal Friction Phenomena at High Frequencies. J. Appl. Phys. 1956, 27, 789–805. [Google Scholar] [CrossRef]
- Granato, A.; Lucke, K. Temperature dependence of amplitude-dependent dislocation damping. J. Appl. Phys. 1981, 52, 7136–7142. [Google Scholar] [CrossRef]
- Li, Z.; Yan, H.; Chen, J.; Xia, W.; Su, B.; Zhao, L.; Song, M. Effect of Mg Content on the Damping Behavior of Al–Mg Alloys. Met. Mater. Int. 2020. [Google Scholar] [CrossRef]
- Clark, B.G.; Robertson, I.M.; Dougherty, L.M.; Ahn, D.C. High-temperature Dislocation-precipitate Interactions in Al Alloys: An in situ Transmission Electron Microscopy Deformation Study. J. Mater. Res. 2005, 20, 1792–1801. [Google Scholar] [CrossRef]
- Lytton, J.L.; Shepard, L.A.; Dorn, J.E. The activation energies for creep of single aluminium crystals favorably oriented for (111) /anti 1/ 0 1 slip. Trans. Met. Soc. AIME 1958, 212–223. [Google Scholar]
- Hikata, A.; Johnson, R.A.; Elbaum, C. Interaction of Dislocations with Electrons and with Phonons. Phys. Rev. Lett. 1970, 2, 4856. [Google Scholar]


Publisher’s Note: MDPI stays neutral with regard to jurisdictional claims in published maps and institutional affiliations. |
© 2020 by the authors. Licensee MDPI, Basel, Switzerland. This article is an open access article distributed under the terms and conditions of the Creative Commons Attribution (CC BY) license (http://creativecommons.org/licenses/by/4.0/).