Article

Experimental and Numerical Analysis of Fatigue Life of Aluminum Al 2024-T351 at Elevated Temperature

by
Shahan Mazlan
1,
Noorfaizal Yidris
1,*,
Seyed Saeid Rahimian Koloor
1,2 and
Michal Petrů
2
1
Department of Aerospace Engineering, Universiti Putra Malaysia, Serdang 43400 UPM, Selangor, Malaysia
2
Institute for Nanomaterials, Advanced Technologies and Innovation (CXI), Technical University of Liberec (TUL), Studentska 2, 461 17 Liberec, Czech Republic
*
Author to whom correspondence should be addressed.
Metals 2020, 10(12), 1581; https://doi.org/10.3390/met10121581
Submission received: 31 October 2020 / Revised: 17 November 2020 / Accepted: 20 November 2020 / Published: 26 November 2020
(This article belongs to the Special Issue Microstructure, Deformation, and Fatigue Behavior in Metals)

Abstract

:
This paper presents the prediction of the fatigue life of aluminum Al 2024-T351 at room and elevated temperatures under uniaxial loading using finite element simulation. Structural parts such as fuselage, wings, aircraft turbines and heat exchangers are required to work safely at this working condition even with decreasing fatigue strength and other properties. The monotonic tensile and cyclic tests at 100 °C and 200 °C were conducted using MTS 810 servo hydraulic equipped with MTS 653 high temperature furnace at a frequency of 10 Hz and load ratio of 0.1. There was an 8% increase in the yield strength and a 2.32 MPa difference in the ultimate strength at 100 °C. However, the yield strength had a 1.61 MPa difference and 25% decrease in the ultimate strength at 200 °C compared to the room temperature. The mechanical and micro-structural behavior at elevated temperatures caused an increase in the crack initiation and crack propagation which reduced the total fatigue life. The yield strength, ultimate strength, alternating stress, mean stress and fatigue life were taken as the input in finite element commercial software, ANSYS. Comparison of results between experimental and finite element methods showed a good agreement. Hence, the suggested method using the numerical software can be used for predicting the fatigue life at elevated temperature.

1. Introduction

Aluminum alloy is one of the leading materials in aircraft, automotive and heavy industries due to its lightweight, high strength, good electrical conductivity, high elastic modulus and thermal resistance properties [1,2]. All these properties have an impact on the budgeting in terms of cost, performance and production. Furthermore, the designed components must meet the anticipated requirement and factor of safety of the parts for various working conditions. The study of fatigue is important because the components can experience catastrophic failure due to the condition of loading and unloading after a certain amount of time [3]. The fatigue behavior is quite important in order to estimate changes in the properties and cumulative damage of the material related to the life cycle [4,5]. Several coefficients such as size, shape, surface finish and fatigue strength are important to determine the characteristics of the structural components. These characteristics are used in plotting the stress-life curve or strain-life curve [6]. In addition, the collection of data from experimental tests [7], and analytical or numerical models [8] is the common practice to determine the fatigue properties. A standard machine testing for axial loading can have frequency of up to 20 Hz and the commonly applied frequency is 10 Hz [9]. A study on the damage accumulation proposed an approach that takes the amplitude from below the fatigue limit [10]. Moreover, a fatigue prediction without material constant is also possible [11] and the calculation method for variable types of loading [12] with a combination of high and low cycle curves [13]. The effect of the mean stress in the surface crack growth [14] and multiple types of loading [15] related to fatigue prediction have also been studied.
There are several standards and codes [16,17,18] to follow in order to ensure the reliability of the product under fatigue testing evaluation. Several studies on low cycle fatigue (LCF < 104) and high cycle fatigue (HCF < 107) [19,20,21,22,23] were conducted on aluminum alloy. In addition, fatigue life that is more than 107 is considered as a very high cycle fatigue (VHCF).
The temperature during cruising speed at Mach 2.2 can reach up to 120 °C and 240 °C at most for frame generators [24]. Furthermore, some working conditions will require the components such as aircraft turbine, heat exchanger and steam turbine to be able to run under elevated temperatures [25]. The definition of elevated temperature is the temperature at which material can operate safely despite decreasing in strength and other properties [26]. Therefore, the low cycle fatigue (LCF) testing is important for designers to gain information and concern for the components that are working under this condition. Moreover, for aluminum alloy, as the temperature increases, the fatigue life and strength decreases under constant loading [27]. The strain deformation, crack growth and crack initiation are also influenced by an increase in temperature [28]. Numerous studies on damage accumulation [29,30,31] have been able to predict fatigue at elevated temperatures, but they are time consuming and require expensive setup and equipment. The unpolished surfaces or scratches contribute to faster crack initiation that starts from micro to macro scale [32]. Moreover, the crack initiation process is faster at elevated temperatures continued by rapid crack propagation rate than at room temperature [33].
The approach of using numerical software to solve problems of multiphysics solutions related to thermal, structural or fluid has been widely accomplished by other researchers. The advantage of using numerical software is that the strengths and weaknesses of the model are known before the final products manufactured. The commonly used numerical software programs for predicting fatigue life are ABAQUS, MSC NASTRAN, SolidWorks and ANSYS Workbench. Several studies were reported [34,35,36,37,38] predicting the fatigue life theoretically or by comparing with experimental results. ANSYS was used [39,40] in predicting the stress concentration areas. However, the design of the 3D model was by different computer aided design (CAD) software before being imported to the desired numerical software to run the fatigue analysis. This is due to experience in accustomed CAD software that reduces the time taken to design.
This study presented the prediction of fatigue life of aluminum Al 2024-T351 at elevated temperatures of 100 °C and 200 °C under uniaxial loading using ANSYS Workbench. To the author’s knowledge, there is still no study conducted using this numerical software to predict the fatigue life at elevated temperatures. Several numerical software programs can predict fatigue life at room temperature. The author tried to implement the same procedure using the test data from the elevated temperature to the numerical software. The latest literature [34] showed the effectiveness of fatigue life prediction using ANSYS Workbench. The numerical software is user friendly that enables the author to complete the study. The fatigue life prediction of components that operate under elevated temperature can be conducted in the future using this study as a reference. The monotonic tensile and cyclic tests with different percentages of loadings were conducted to obtain the yield strength, ultimate strength, elastic modulus and life cycle as input to the numerical software. The results were also compared with a cyclic test at room temperature. It was expected that the results between experimental and numerical simulation be in good agreement to display the efficiency of the software in predicting fatigue life at elevated temperature.

2. Methodology

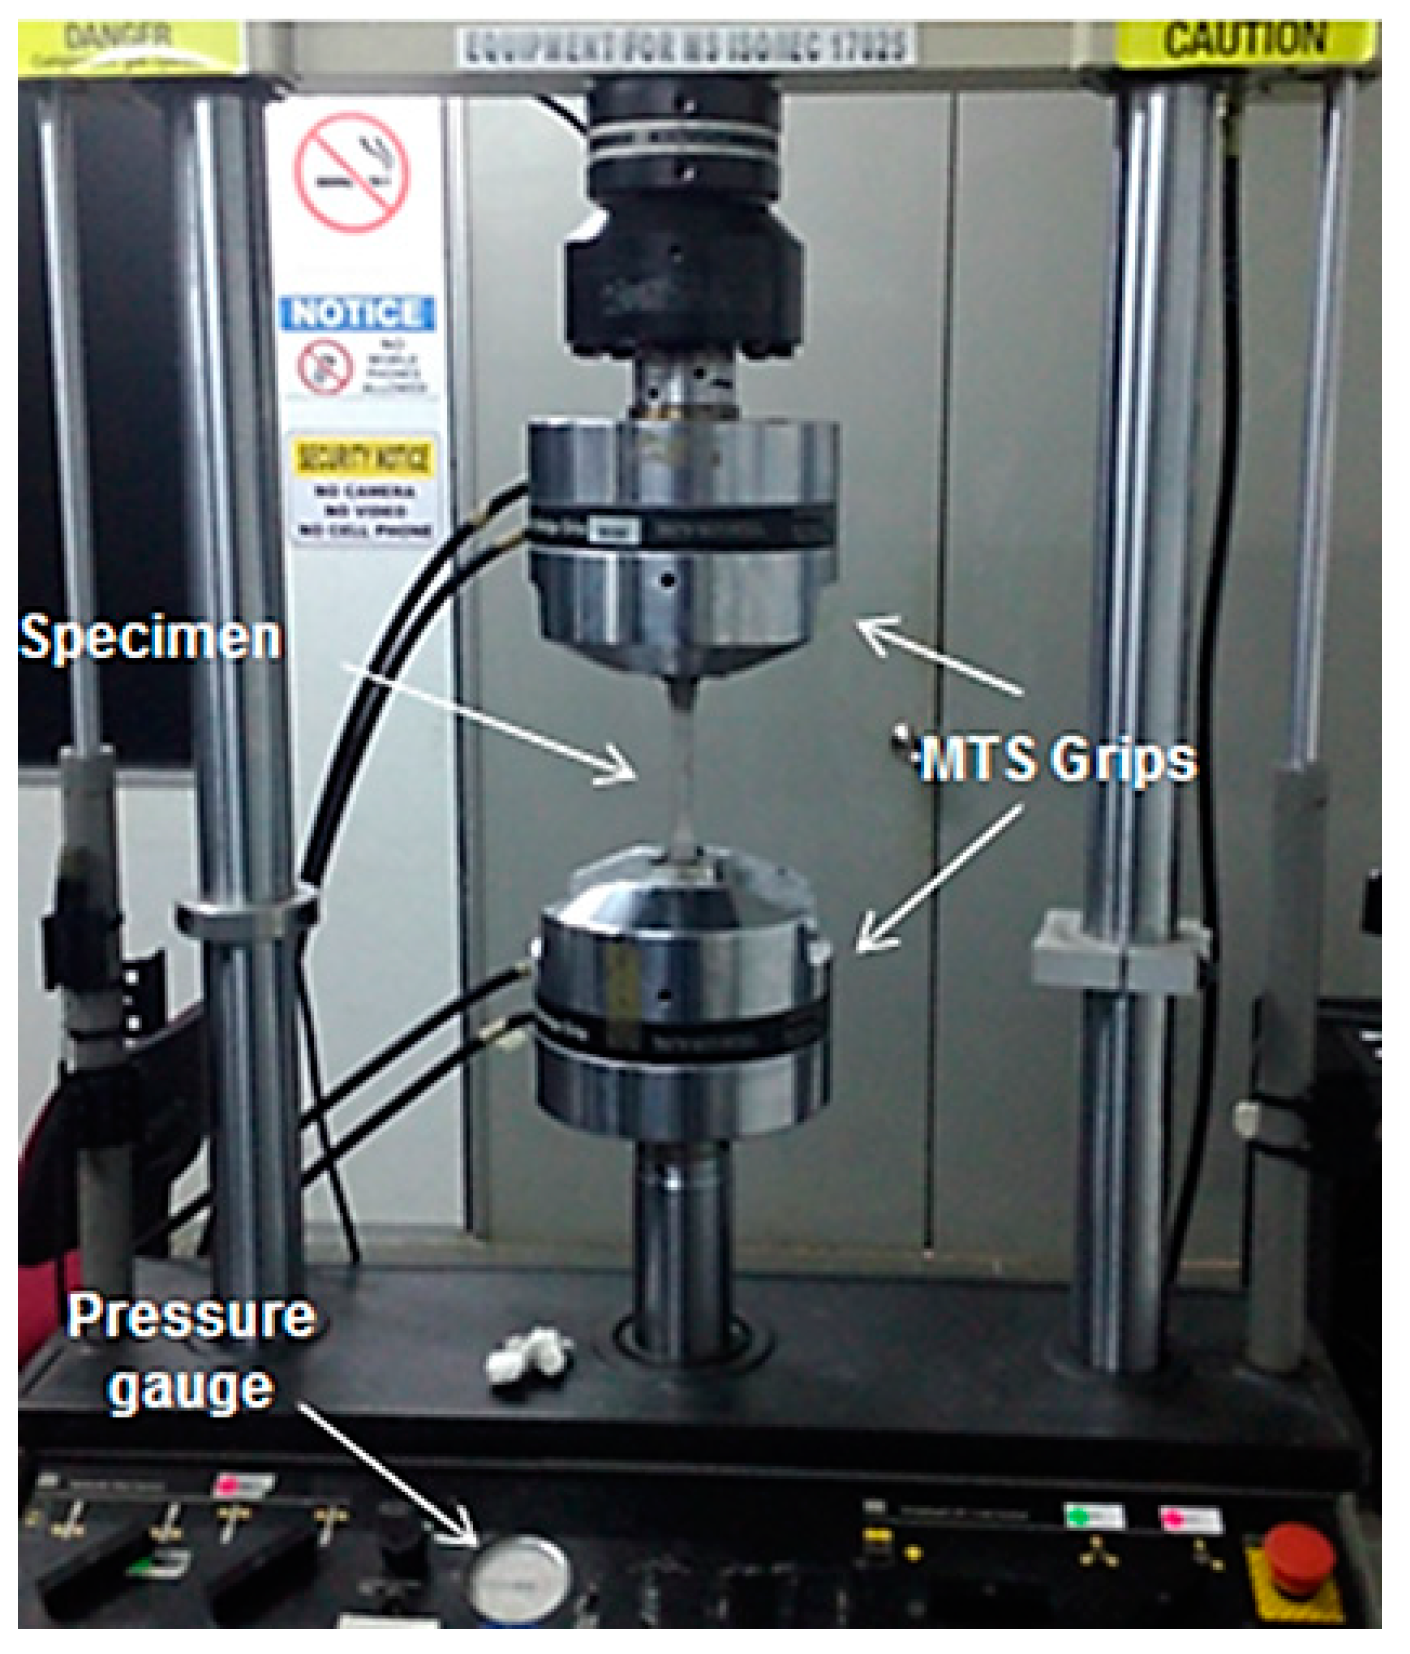
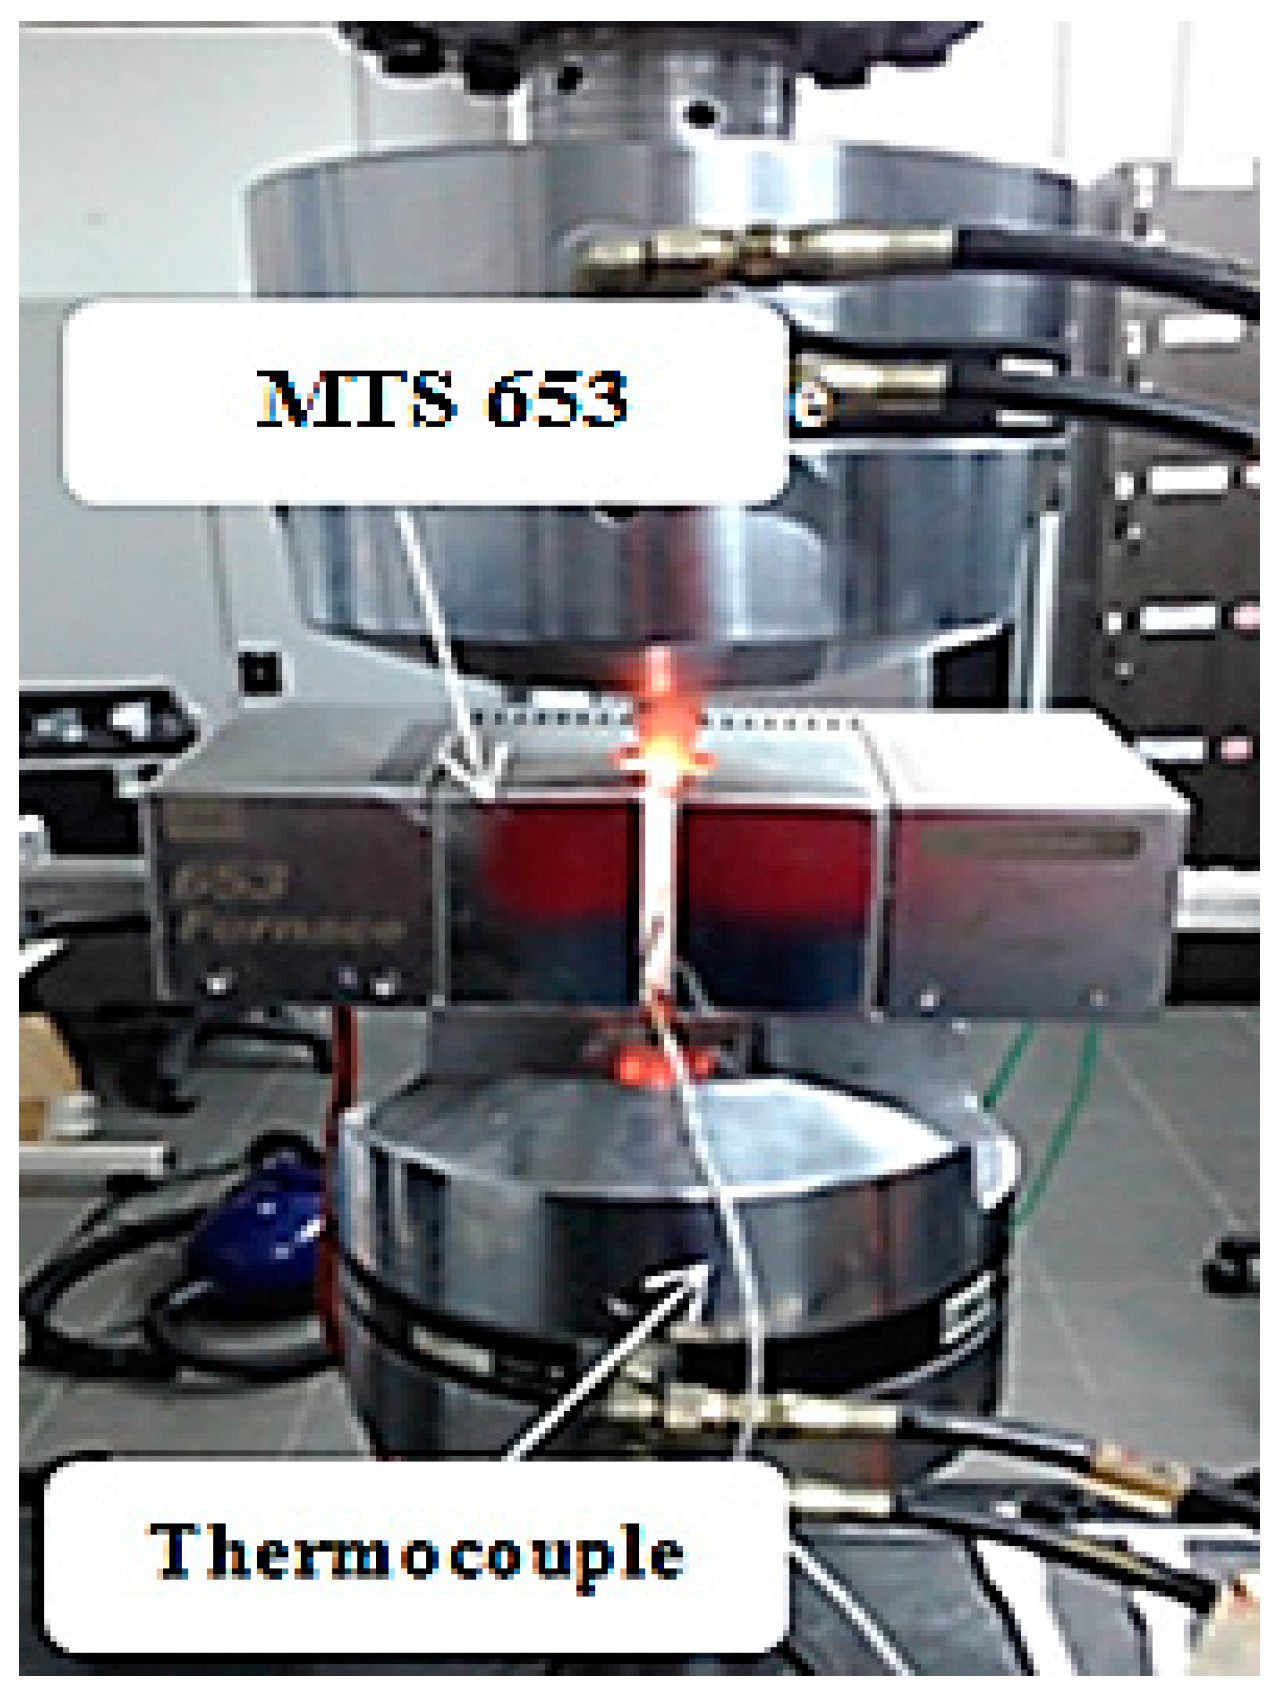
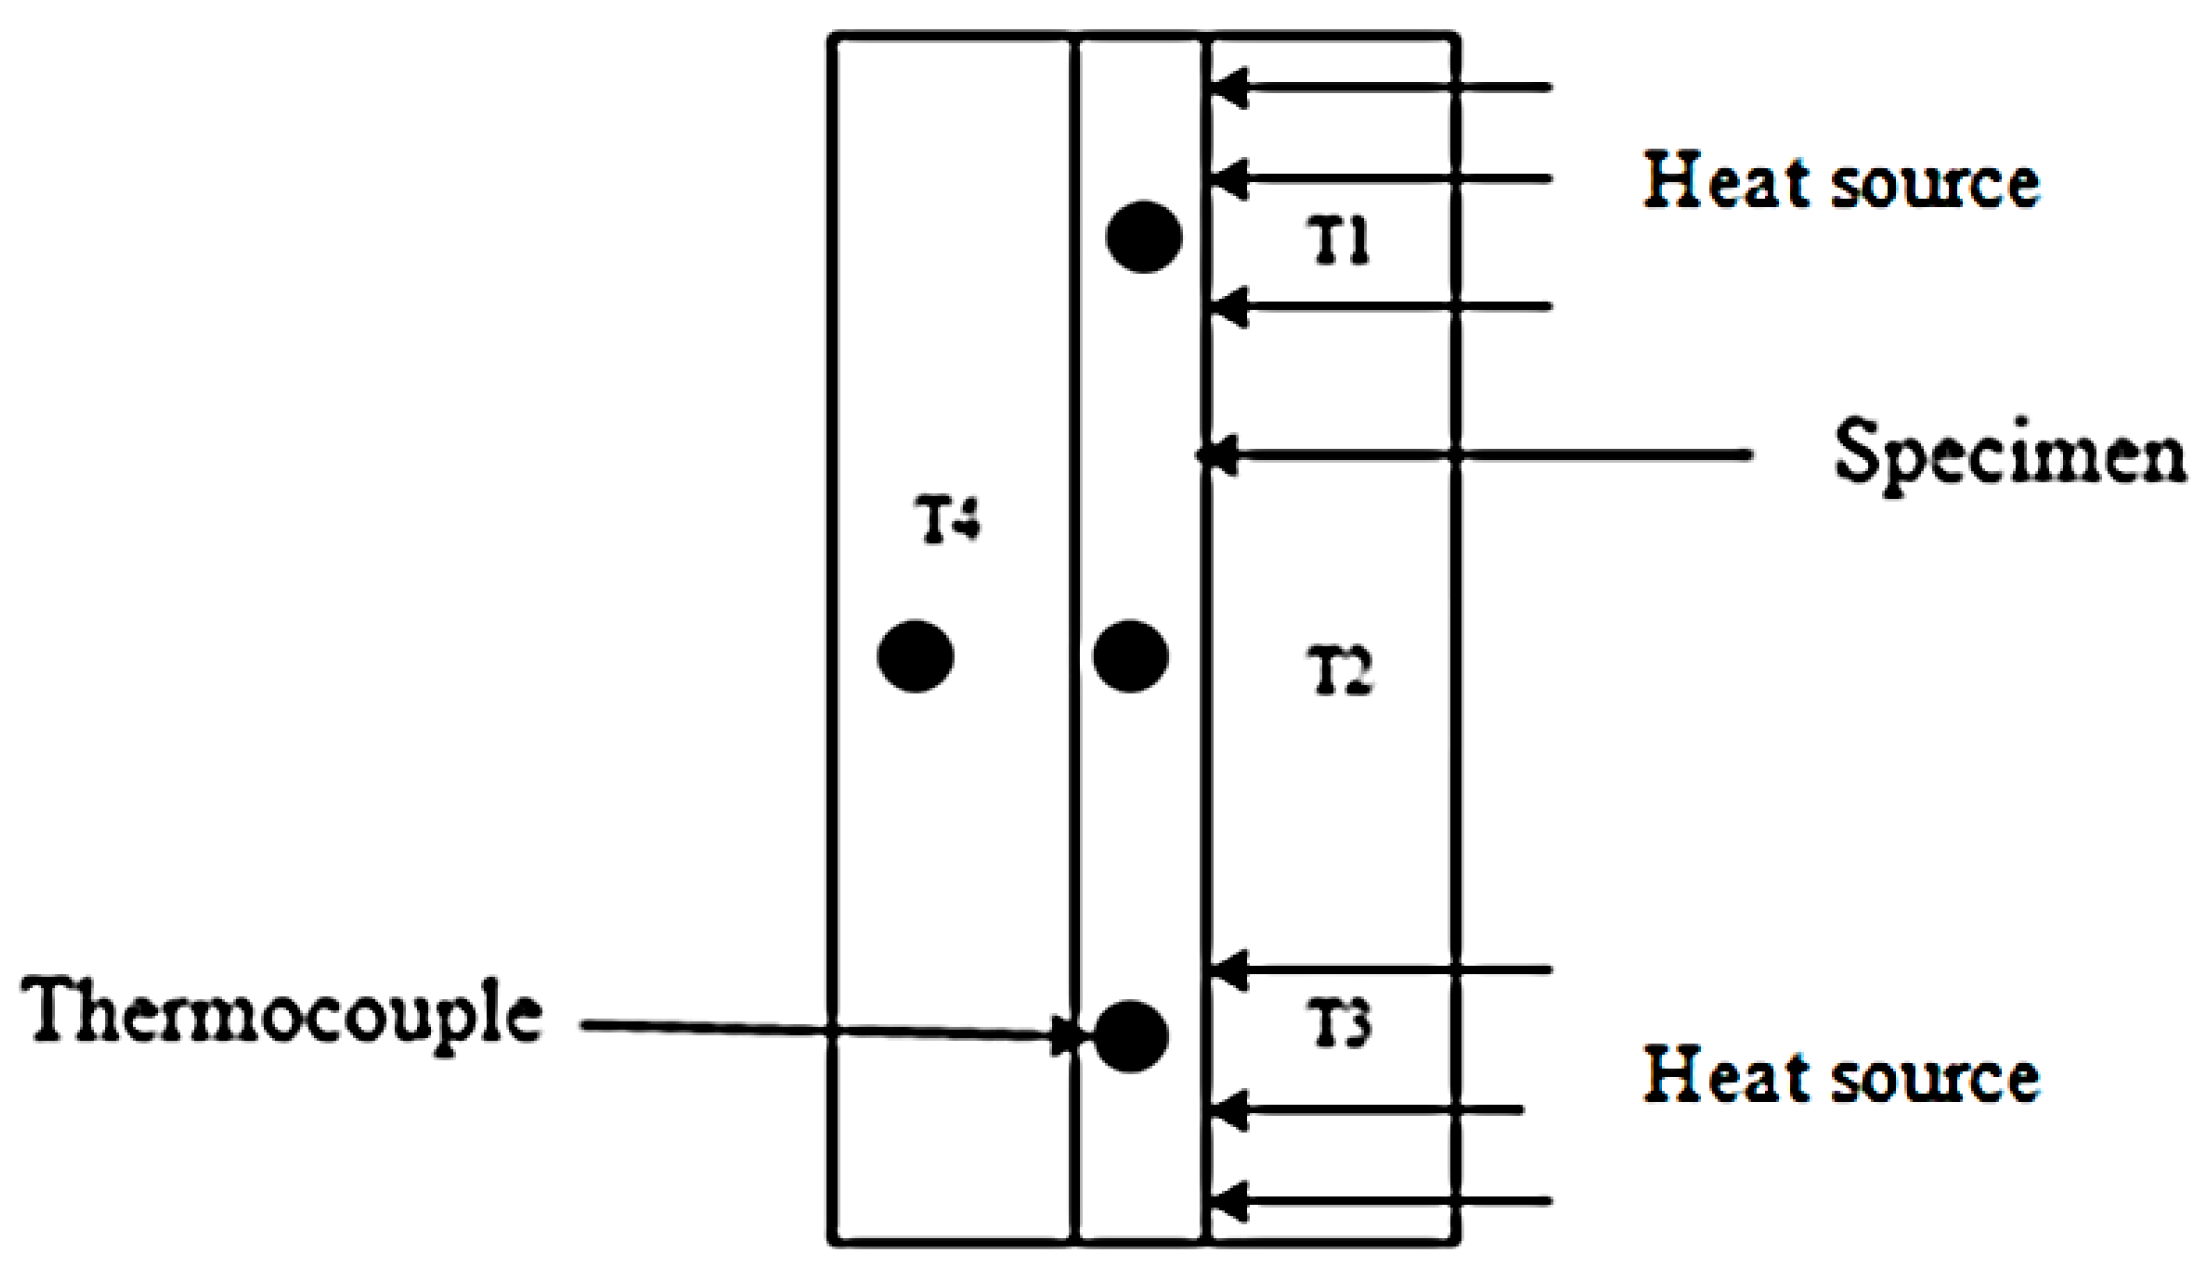
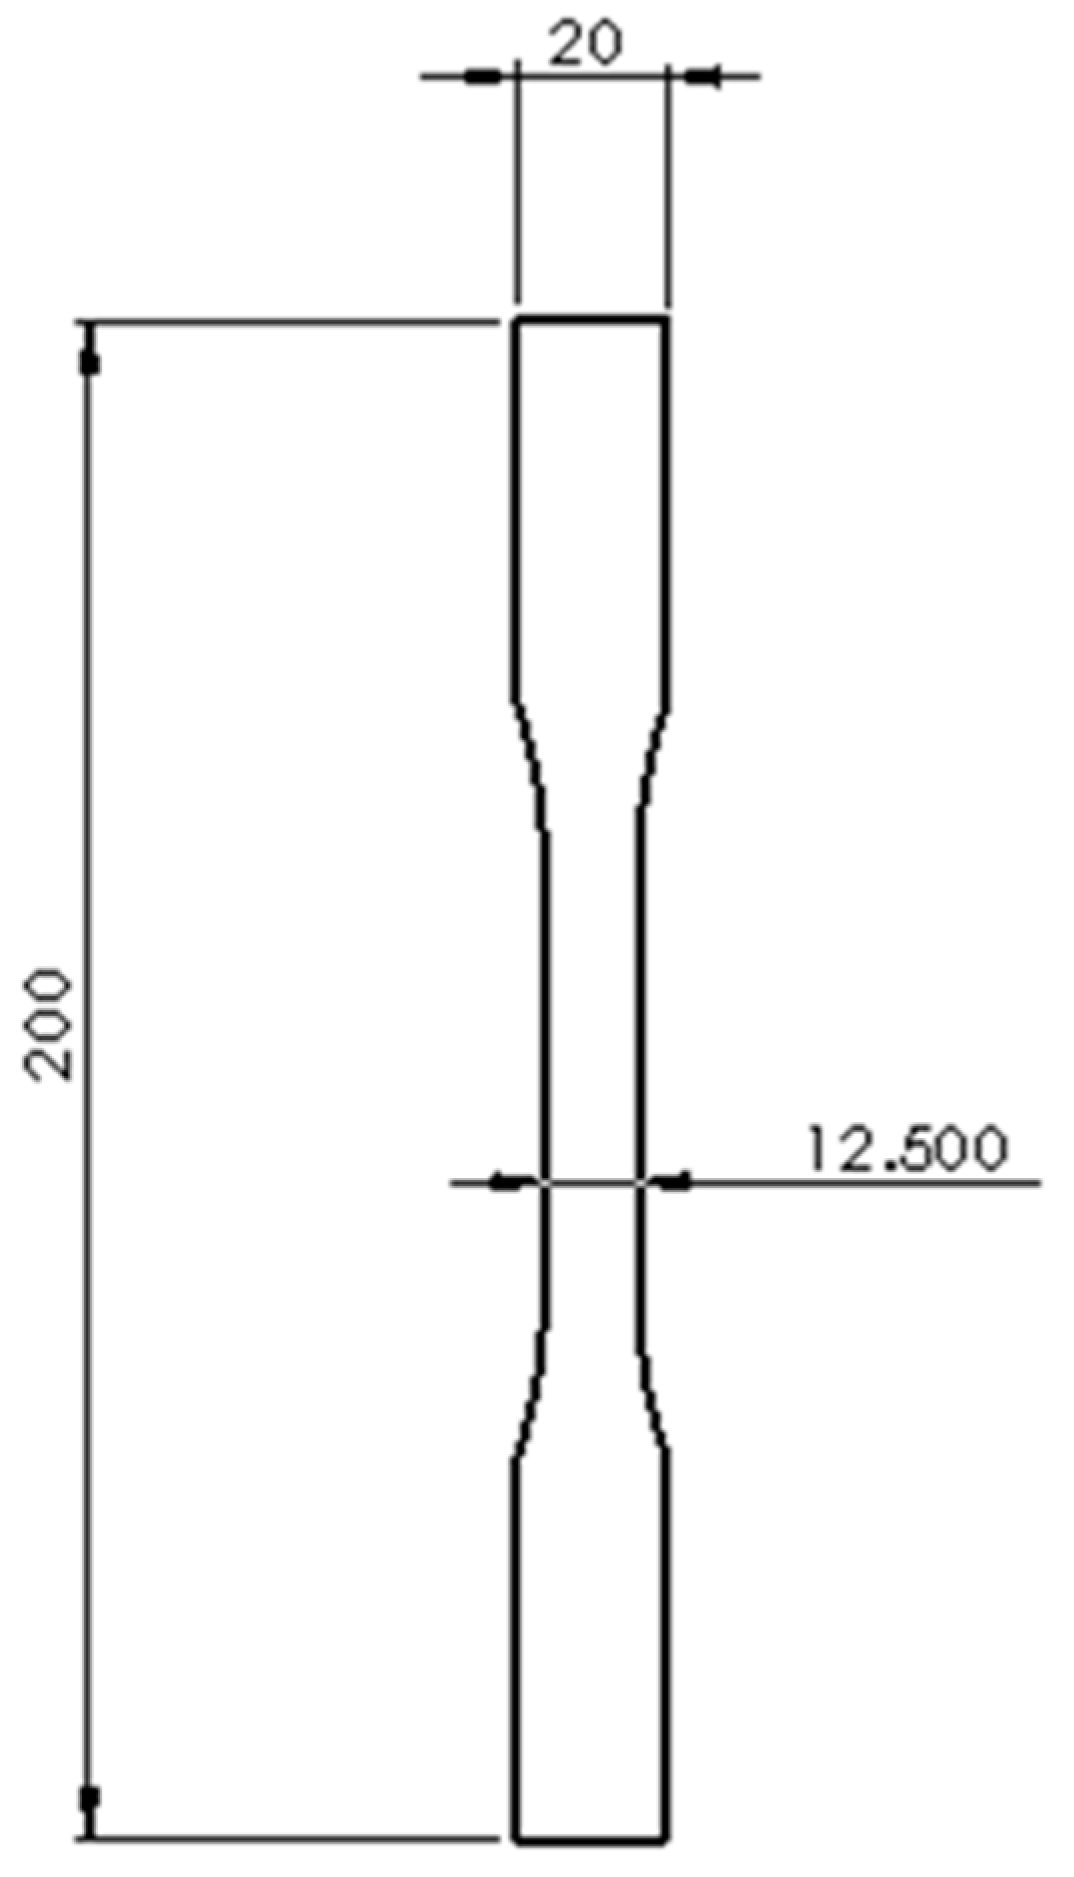
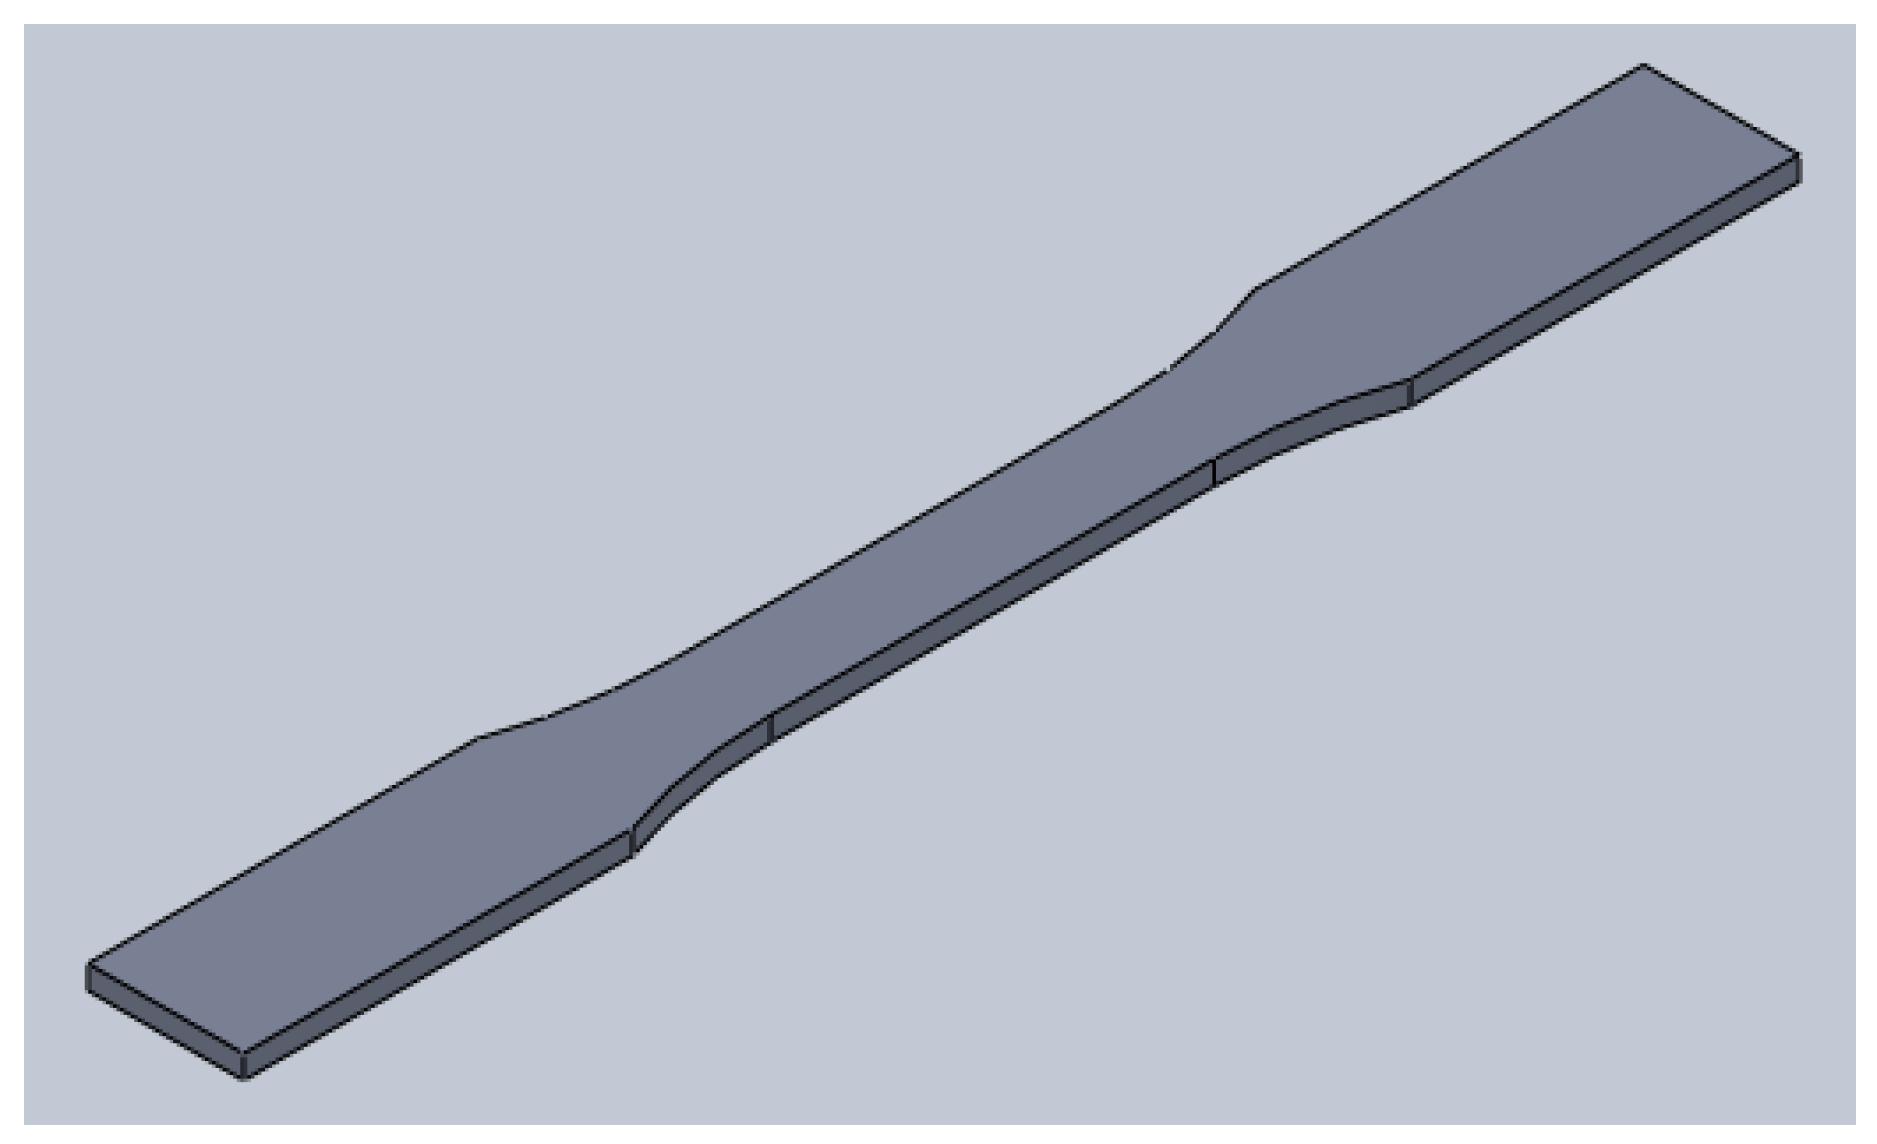
2.1. Experimental Procedures

The material aluminum Al 2024-T351 was selected for the test due to good fatigue strength, corrosion resistance and lightweight properties. This material is widely used in transportation such as in the automotive and aerospace field. The lightweight properties require less force to move or fly a vehicle that leads to higher fuel efficiency and lower manufacturing cost. This strong and flexible material is ideal for the design of frames, aircraft fuselage, wings and other component structures. The specimen was cut from an aluminum plate using water jet technology with a dimension of 200 mm × 20 mm × 3 mm rendering to ASTM E8M standard. The tensile tests were conducted at room and elevated temperatures—100 °C and 200 °C, correspondingly.
A grip pressure of 4.83 MPa was applied to the test specimens at both ends. The alignment of grip was reset before running the test. The monotonic tensile tests were conducted at a crosshead speed of 1 mm/min using 100 kN MTS 810 servo hydraulic (MTS Systems Corporation, Eden Prairie, MN, USA) at room temperature conditions, as shown in Figure 1. For tests at elevated temperature, the MTS 810 was equipped with MTS 653 high temperature furnace (MTS Systems Corporation, Eden Prairie, MN, USA) as in Figure 2 with a capability to reach a maximum temperature of 1000 °C. The entire gauge area of the specimen was covered with MTS 653. The tests were performed to acquire the mechanical properties such as yield strength and ultimate strength.
The temperature was measured using digital thermometer TM902C (Reland Sung, Fujian, China). Four thermocouples, T1, T2, T3 and T4 were placed in the high temperature furnace. Three thermocouples, T1, T2 and T3 were attached to the specimen and T4 hanging in the middle area, as shown in Figure 3.
The cyclic tests were performed according to ASTM E466 standard at a frequency of 10 Hz, sinusoidal waveform and load ratio of 0.1. Each test was loaded with a specific mean load and for tests at room temperature, the test started at the maximum load value of 90% of the yield and decremented by 5% for the next tests until 70% of the yield strength. Similarly, the maximum load for 100 °C started from 90% to 75% of the yield strength; the maximum load decreased by 5% in each test. For tests at 200 °C, the maximum load started from 90% to 70% of the yield strength; the maximum load decreased by 10% in each case. The results were plotted in the form of stress-life curves to estimate the cycles to failure after definite loading. The loads applied were shown in Table 1.
The cyclic test can only be conducted after certain inputs such as mean load, amplitude and frequency are known. The load ratio, Lr can be calculated by the given Equation (1) [41].
L r = L min L max
The range of load, LR can be calculated by the difference between maximum load, Lmax and minimum load, Lmin in the following Equation (2).
LR = LmaxLmin
The amplitude load, La is half of range of load, LR is given by Equation (3).
L a = L max L min 2
Moreover, the mean load, Lm is important as higher load means the lower fatigue life of the tested components. The Equation (4) can be used to calculate the mean load.
L m = L max + L min 2

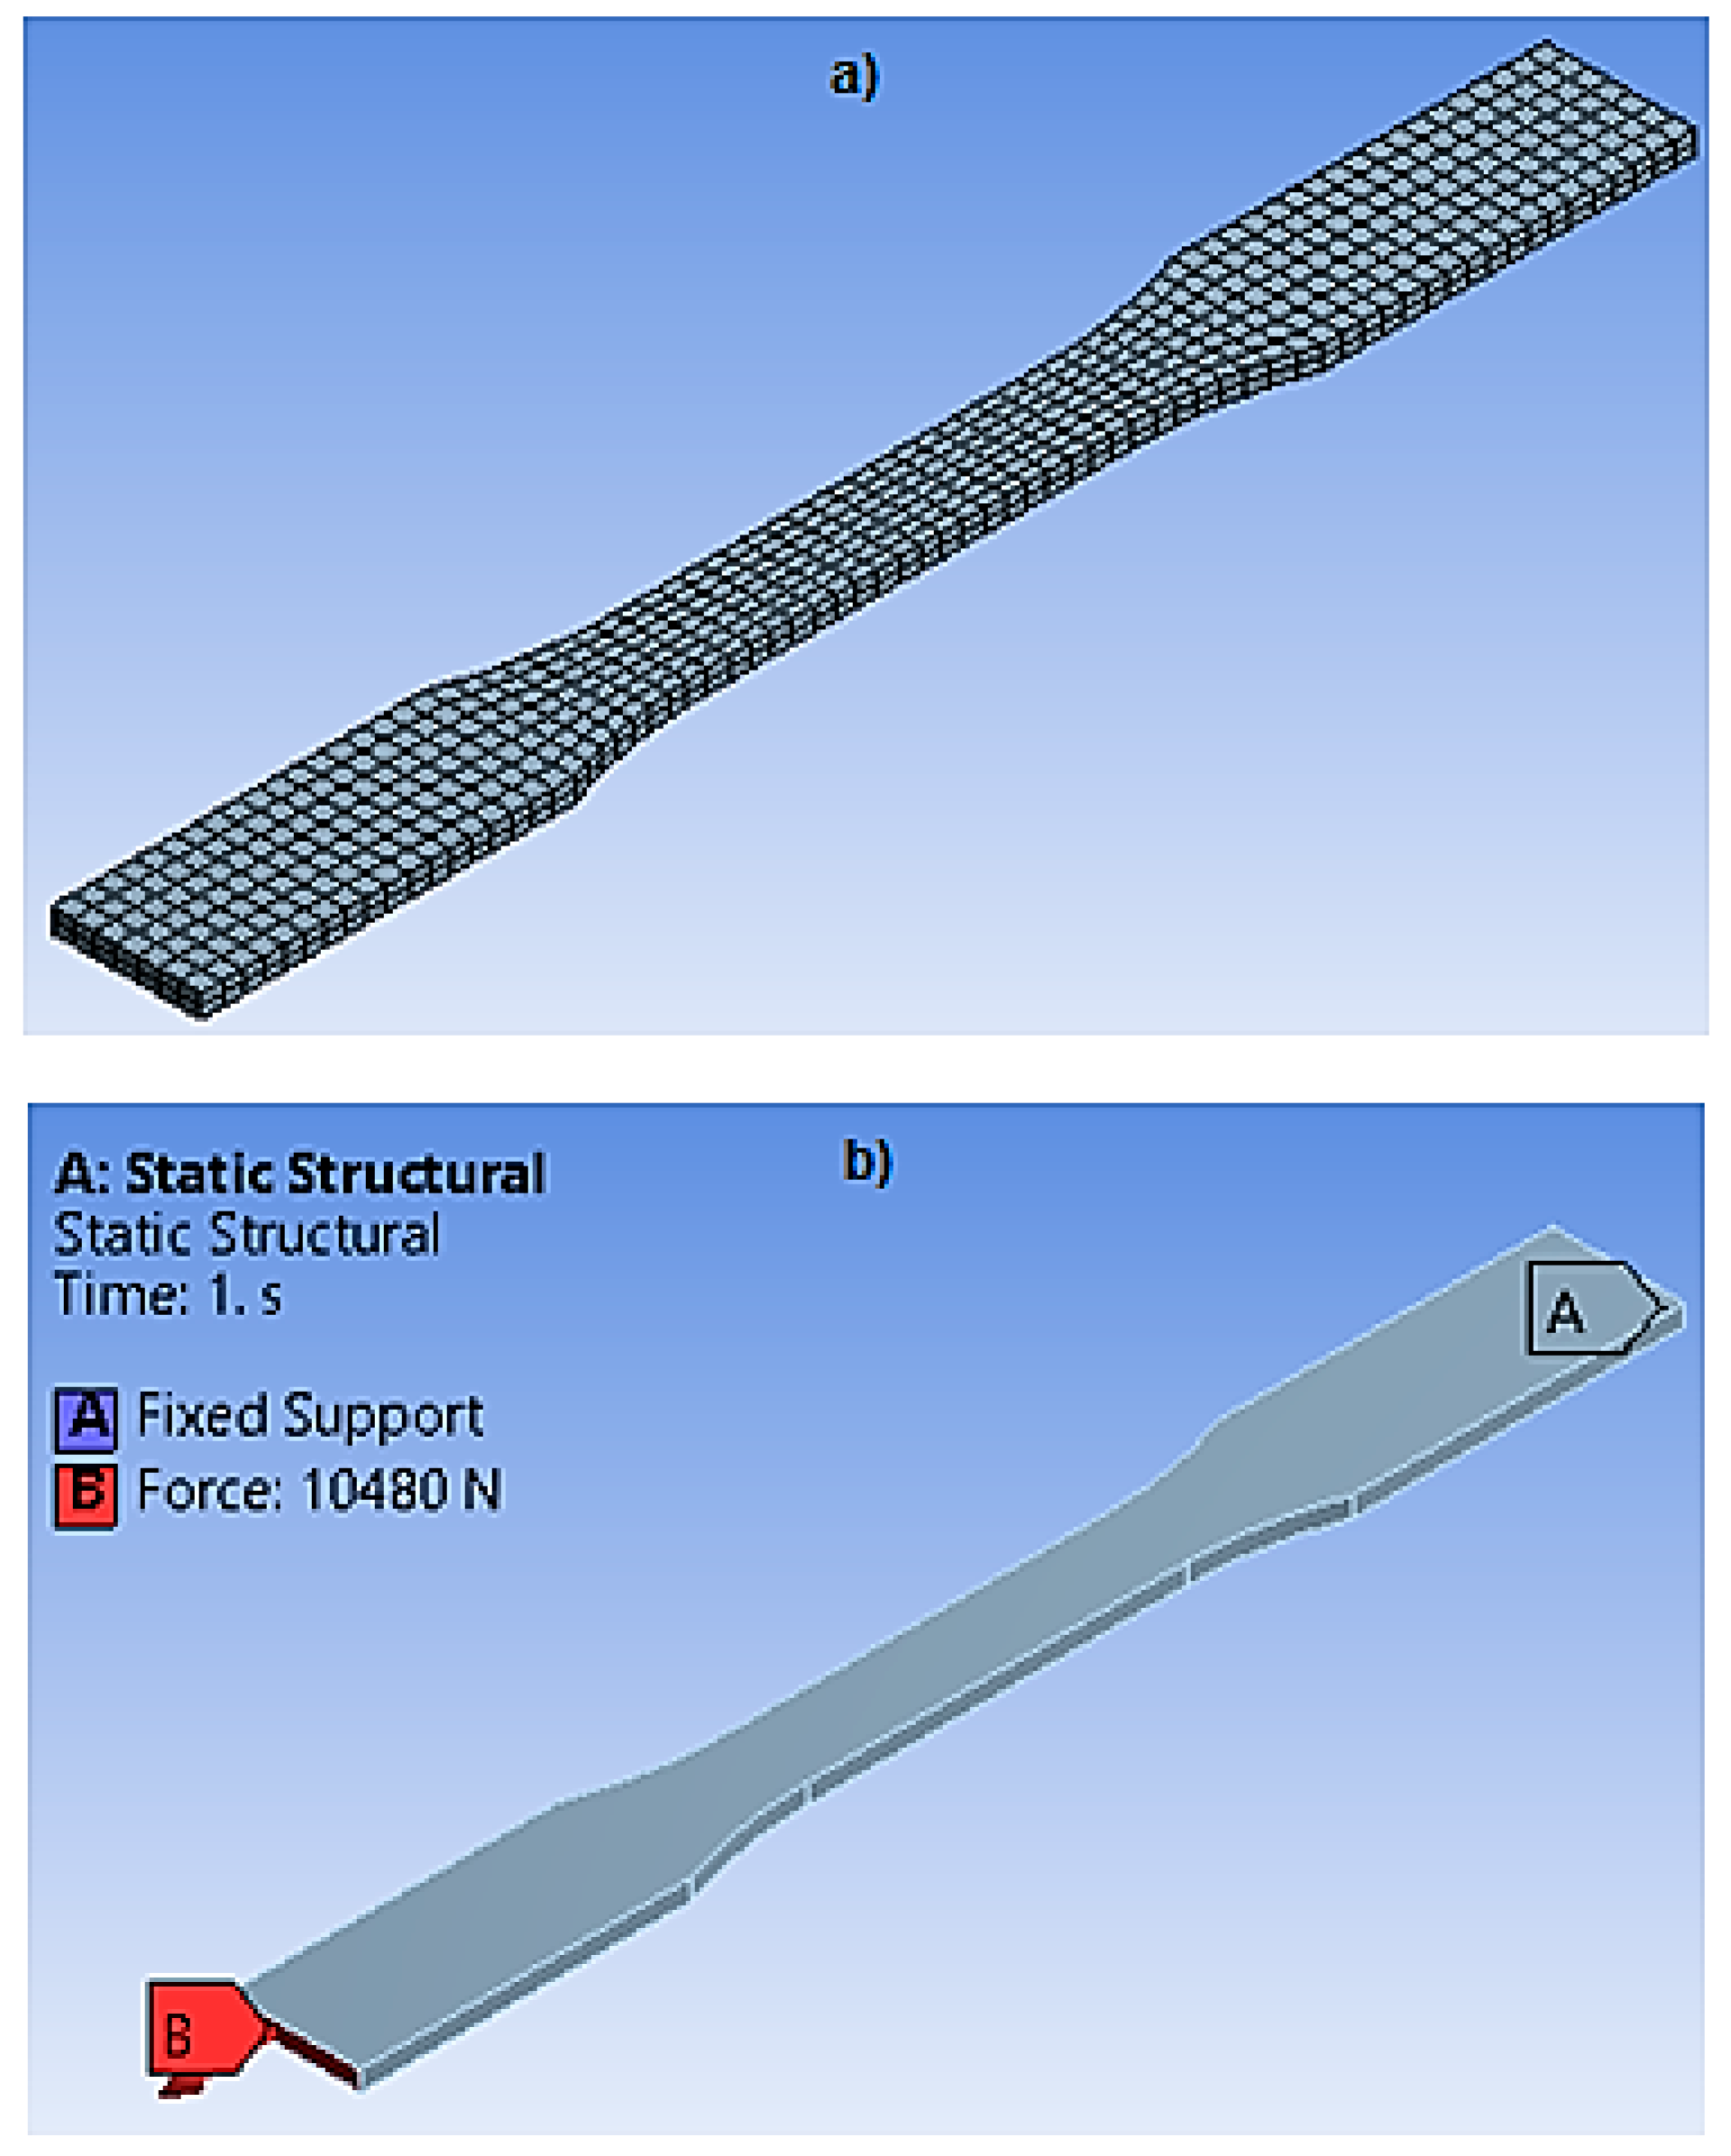
2.2. Numerical Procedures

The use of numerical software is to determine an approximate solution to the specific problem. When the experimental results are available, any numerical results can be verified. The selected computer aided design (CAD) software to design the 3D model of the specimen was SolidWorks 2012. The dimension was set to 200 mm in length, 20 mm width and 3 mm thickness as shown in Figure 4. A top plane was selected for the sketching of the model. The thickness was generated by using a boss-extrude feature from the sketch. The complete 3D model is as shown in Figure 5. The 3D model was saved as IGES format for the ease of importing from ANSYS Workbench 16.1 (ANSYS Inc., Canonsburg, PA, USA).
The mechanical properties such as yield strength, ultimate strength, mean stress, alternating stress and fatigue life acquired from experimental tests were assigned in the engineering data of the software. Moreover, a fine mesh with SOLID 187 10-noded element was selected due to its suitability in covering the uneven surface areas in order to predict results closer to the experiments. The mesh model can be observed in Figure 6a with the generated number of nodes of 6181 and the number of elements of 1008. The boundary conditions shown in Figure 6b were applied similar to the experimental setup. The fixed support A indicates the specimen end was clamped with all degrees of freedom fixed and at point B the load was applied. In addition, stress-life was selected in the fatigue tool option with the load ratio set to 0.1.

3. Results and Discussion

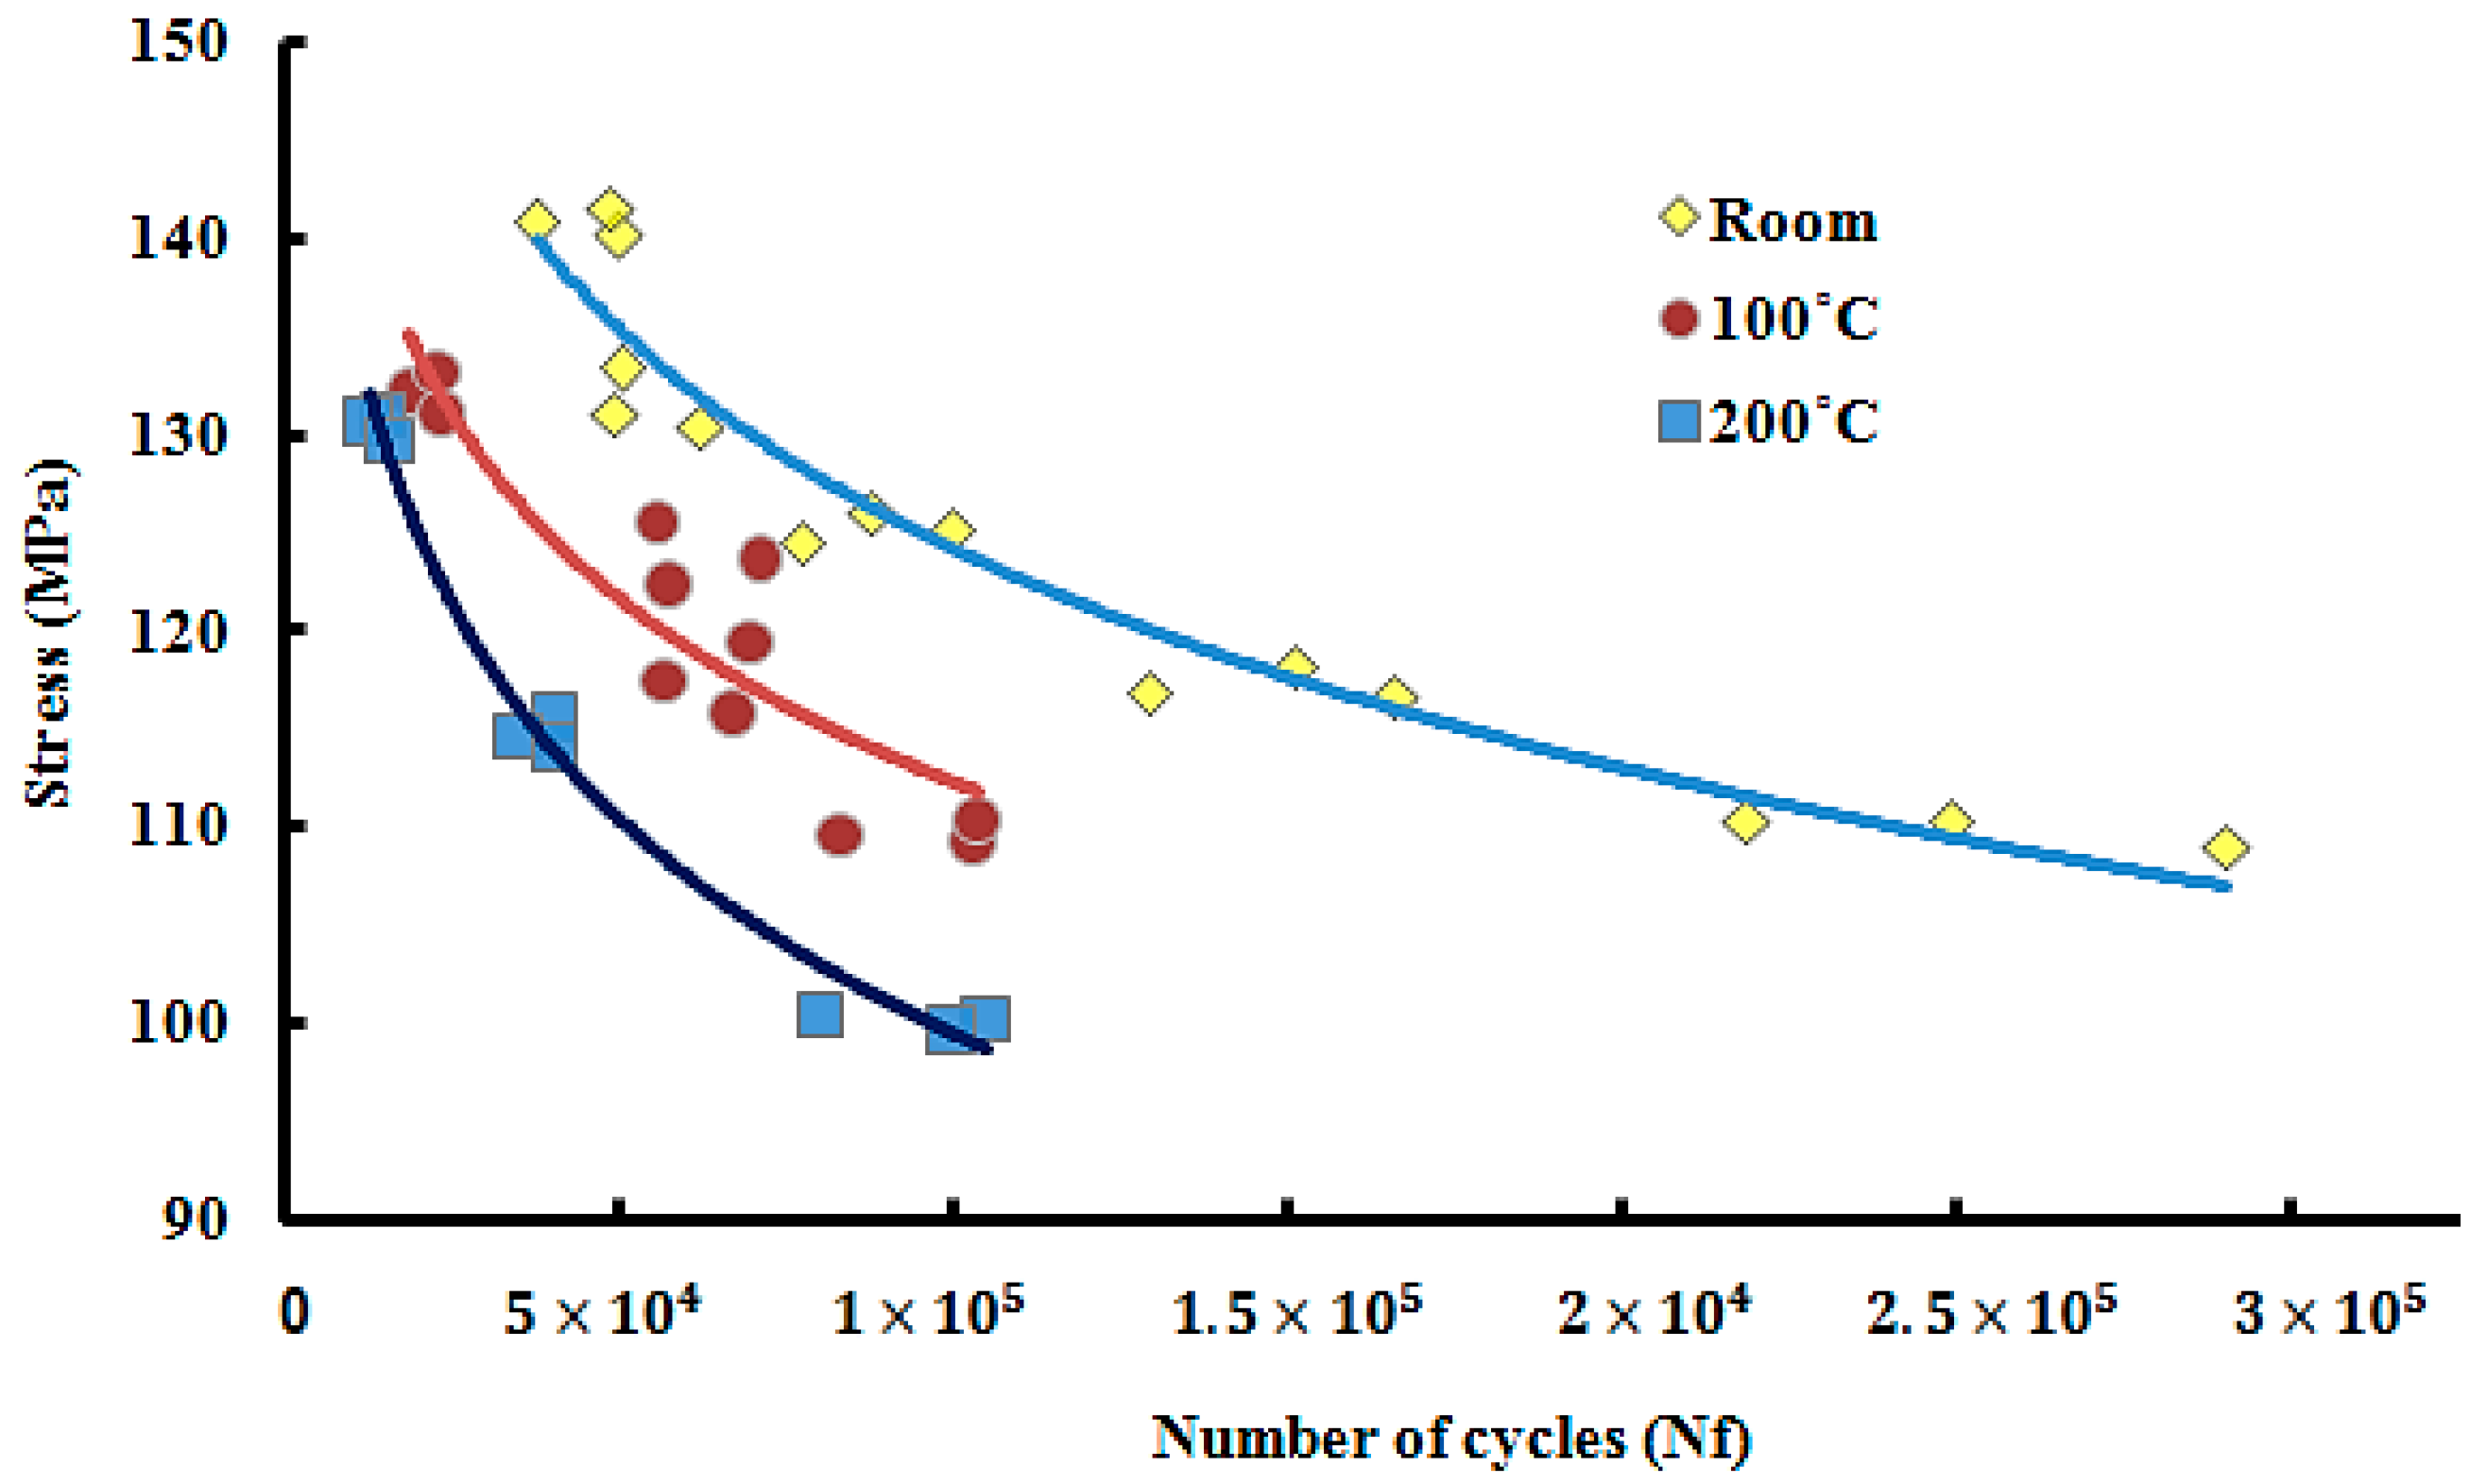
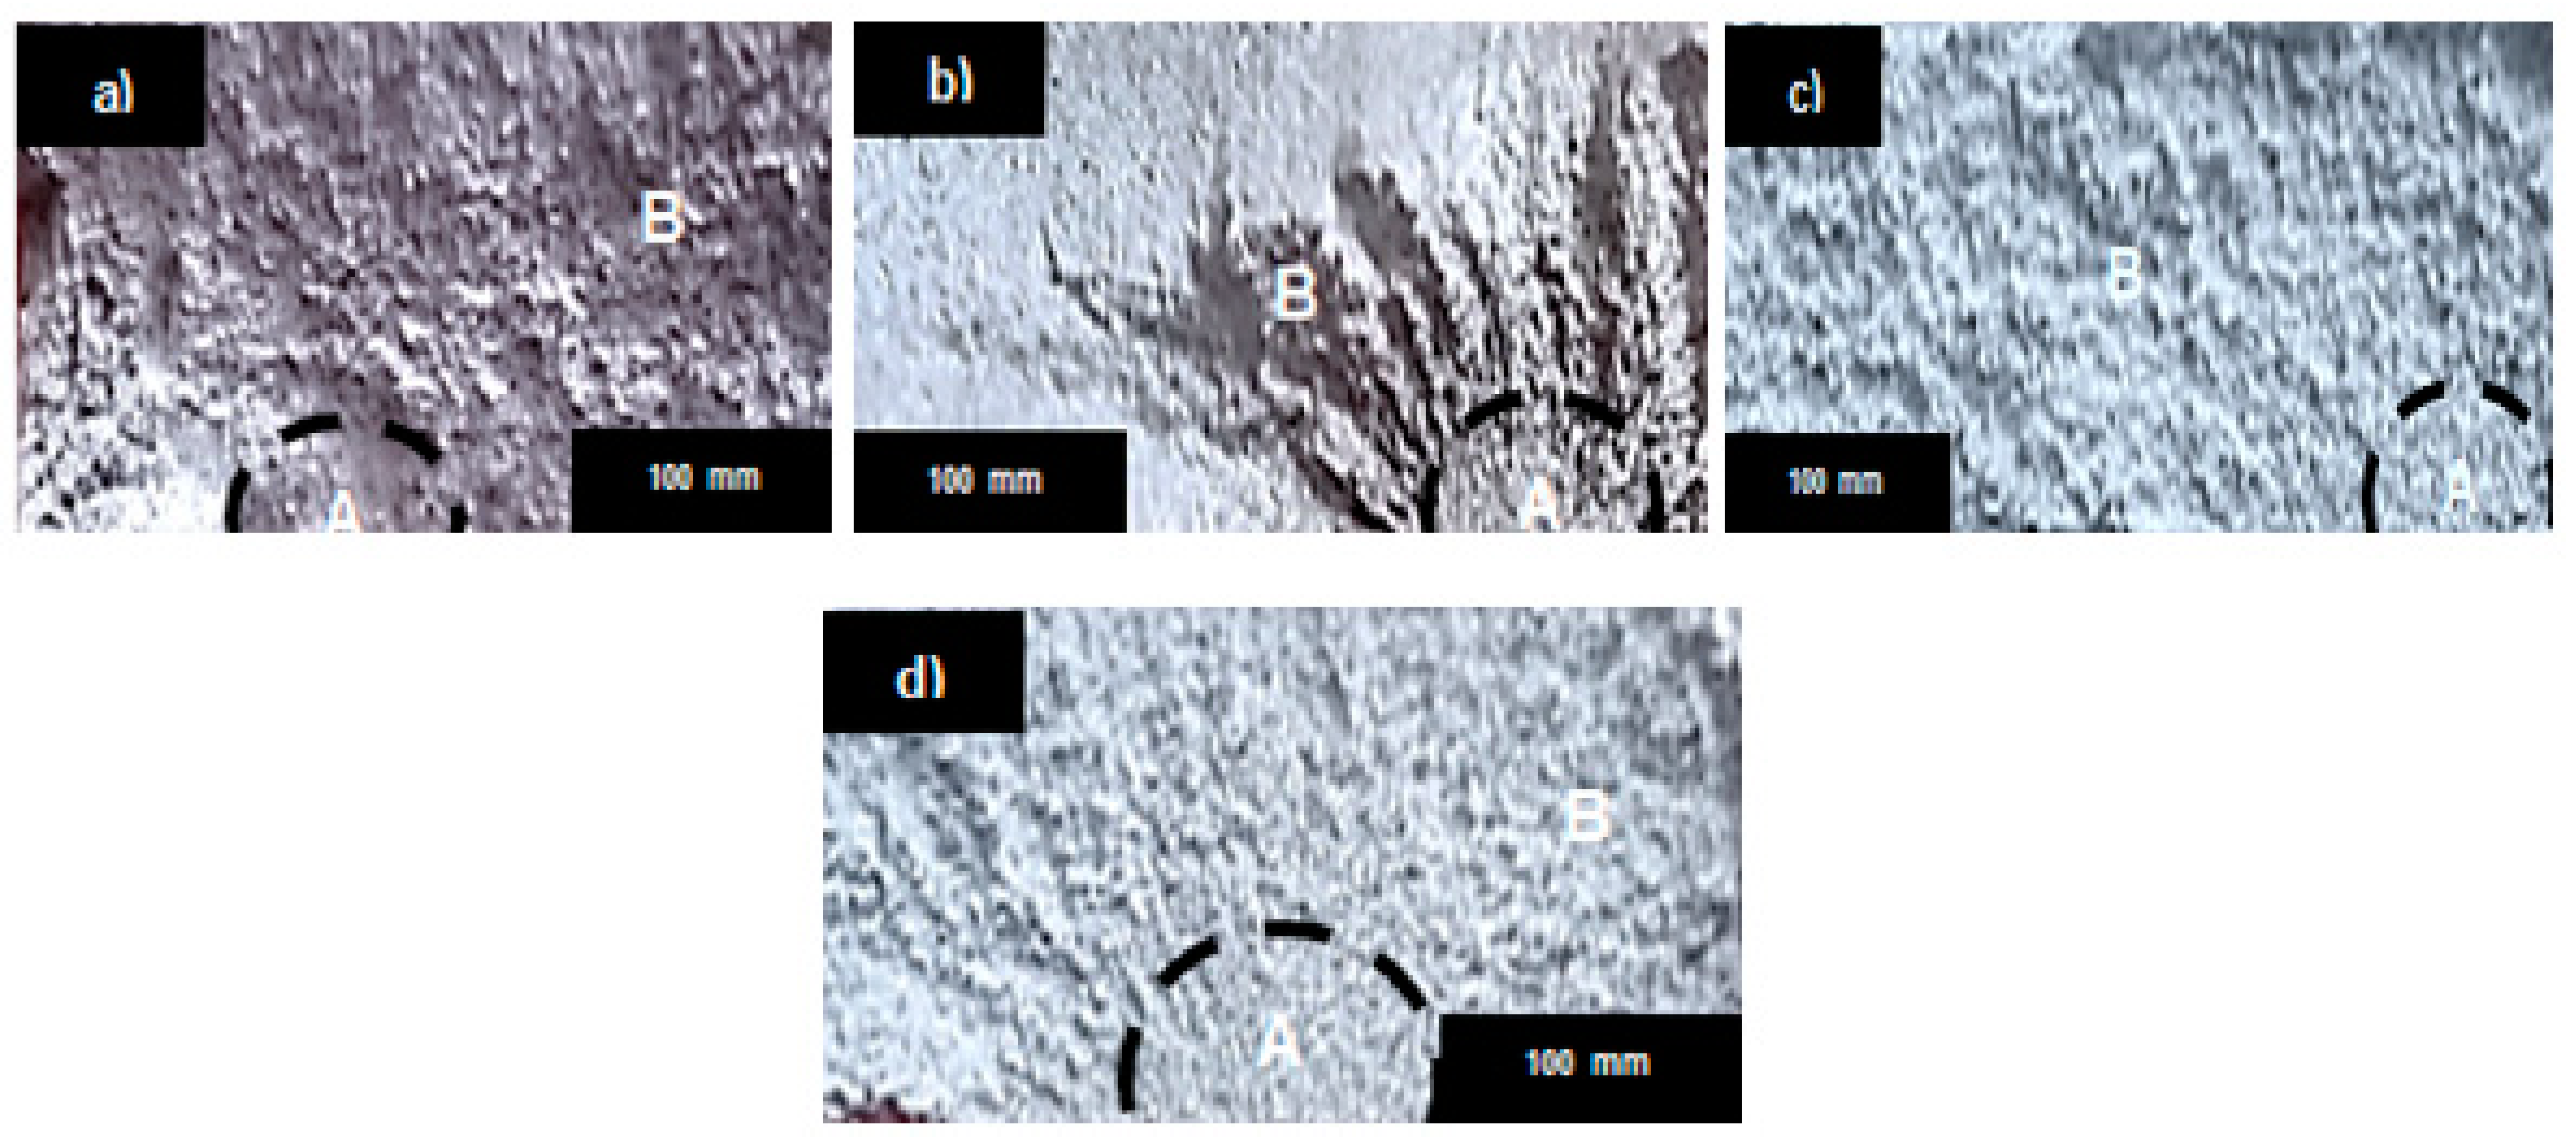
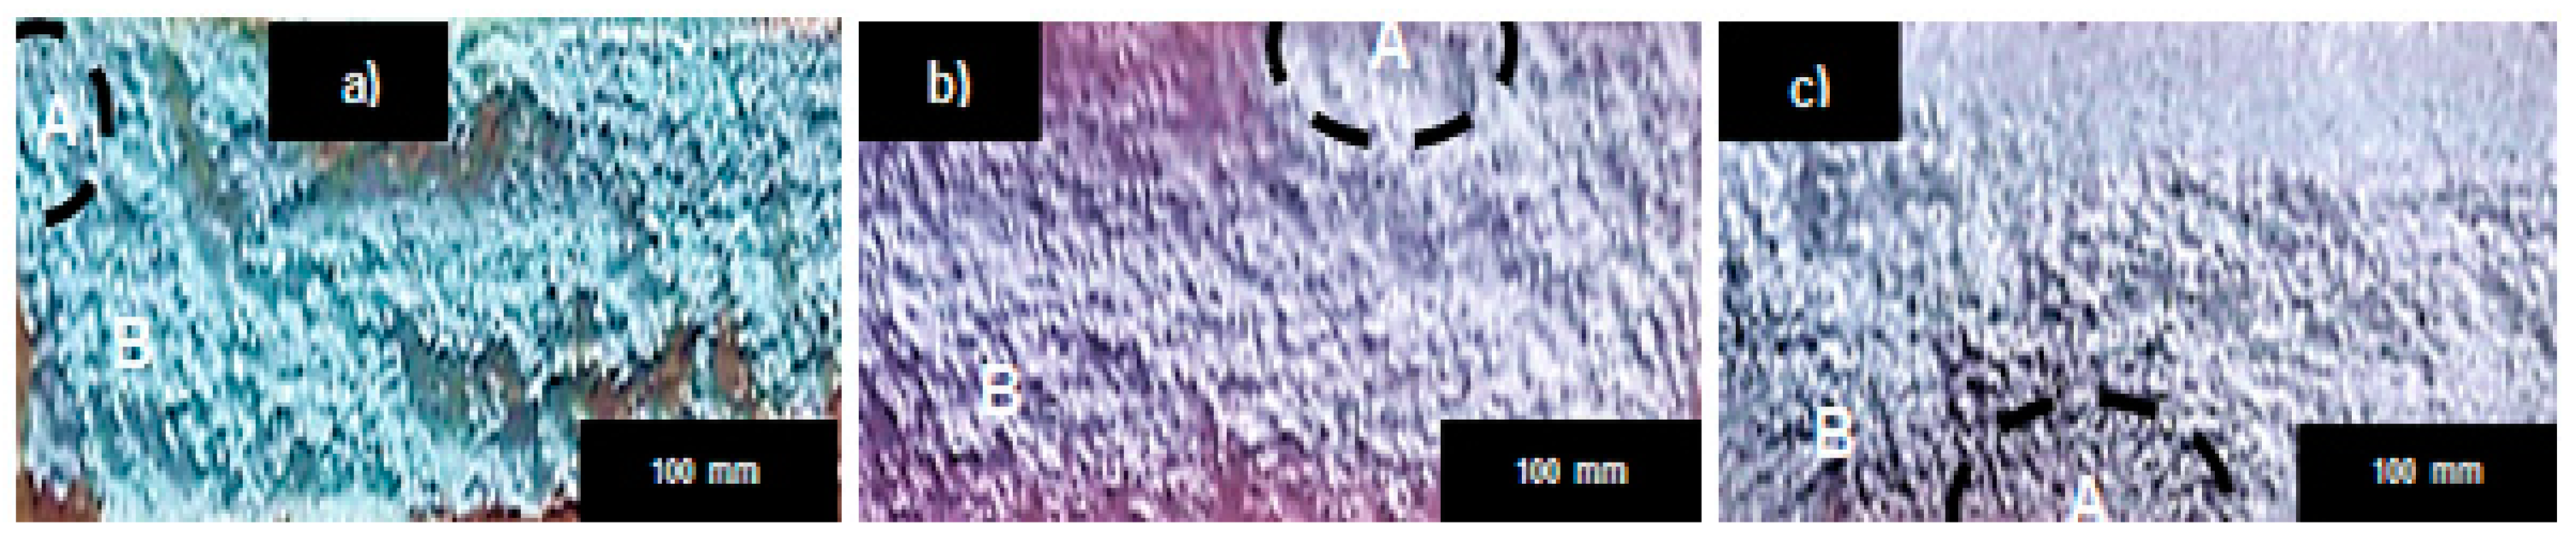
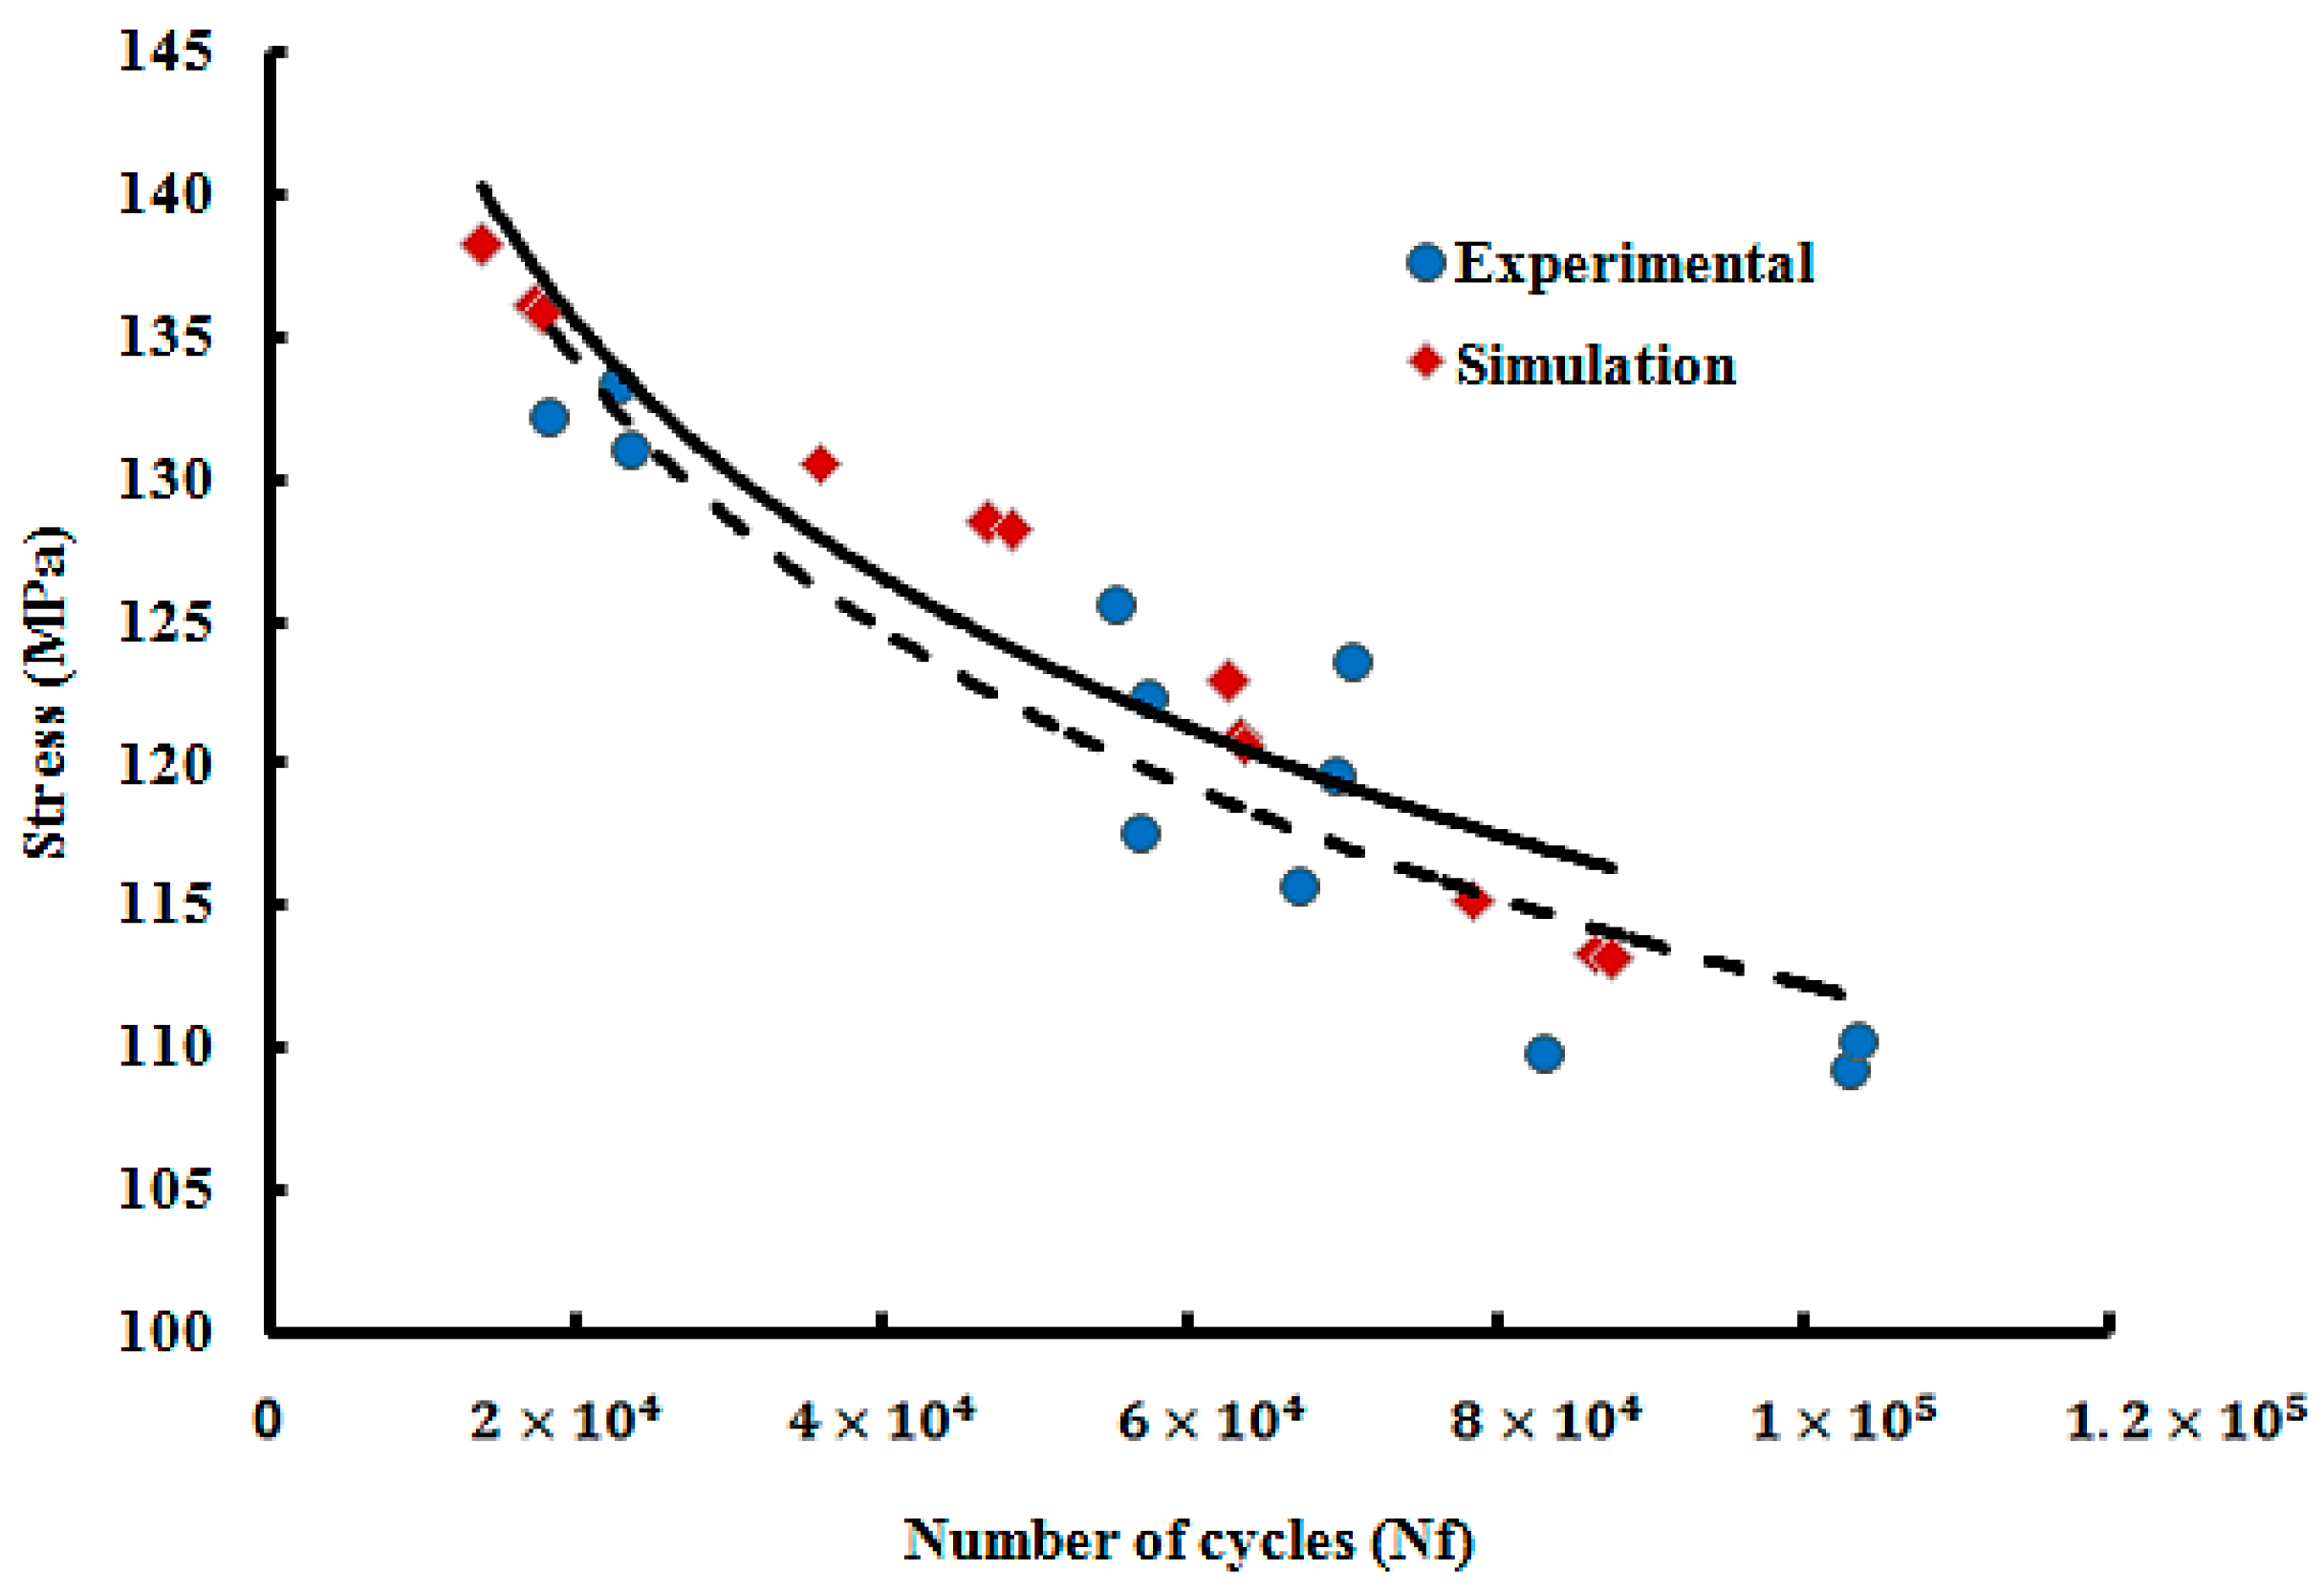
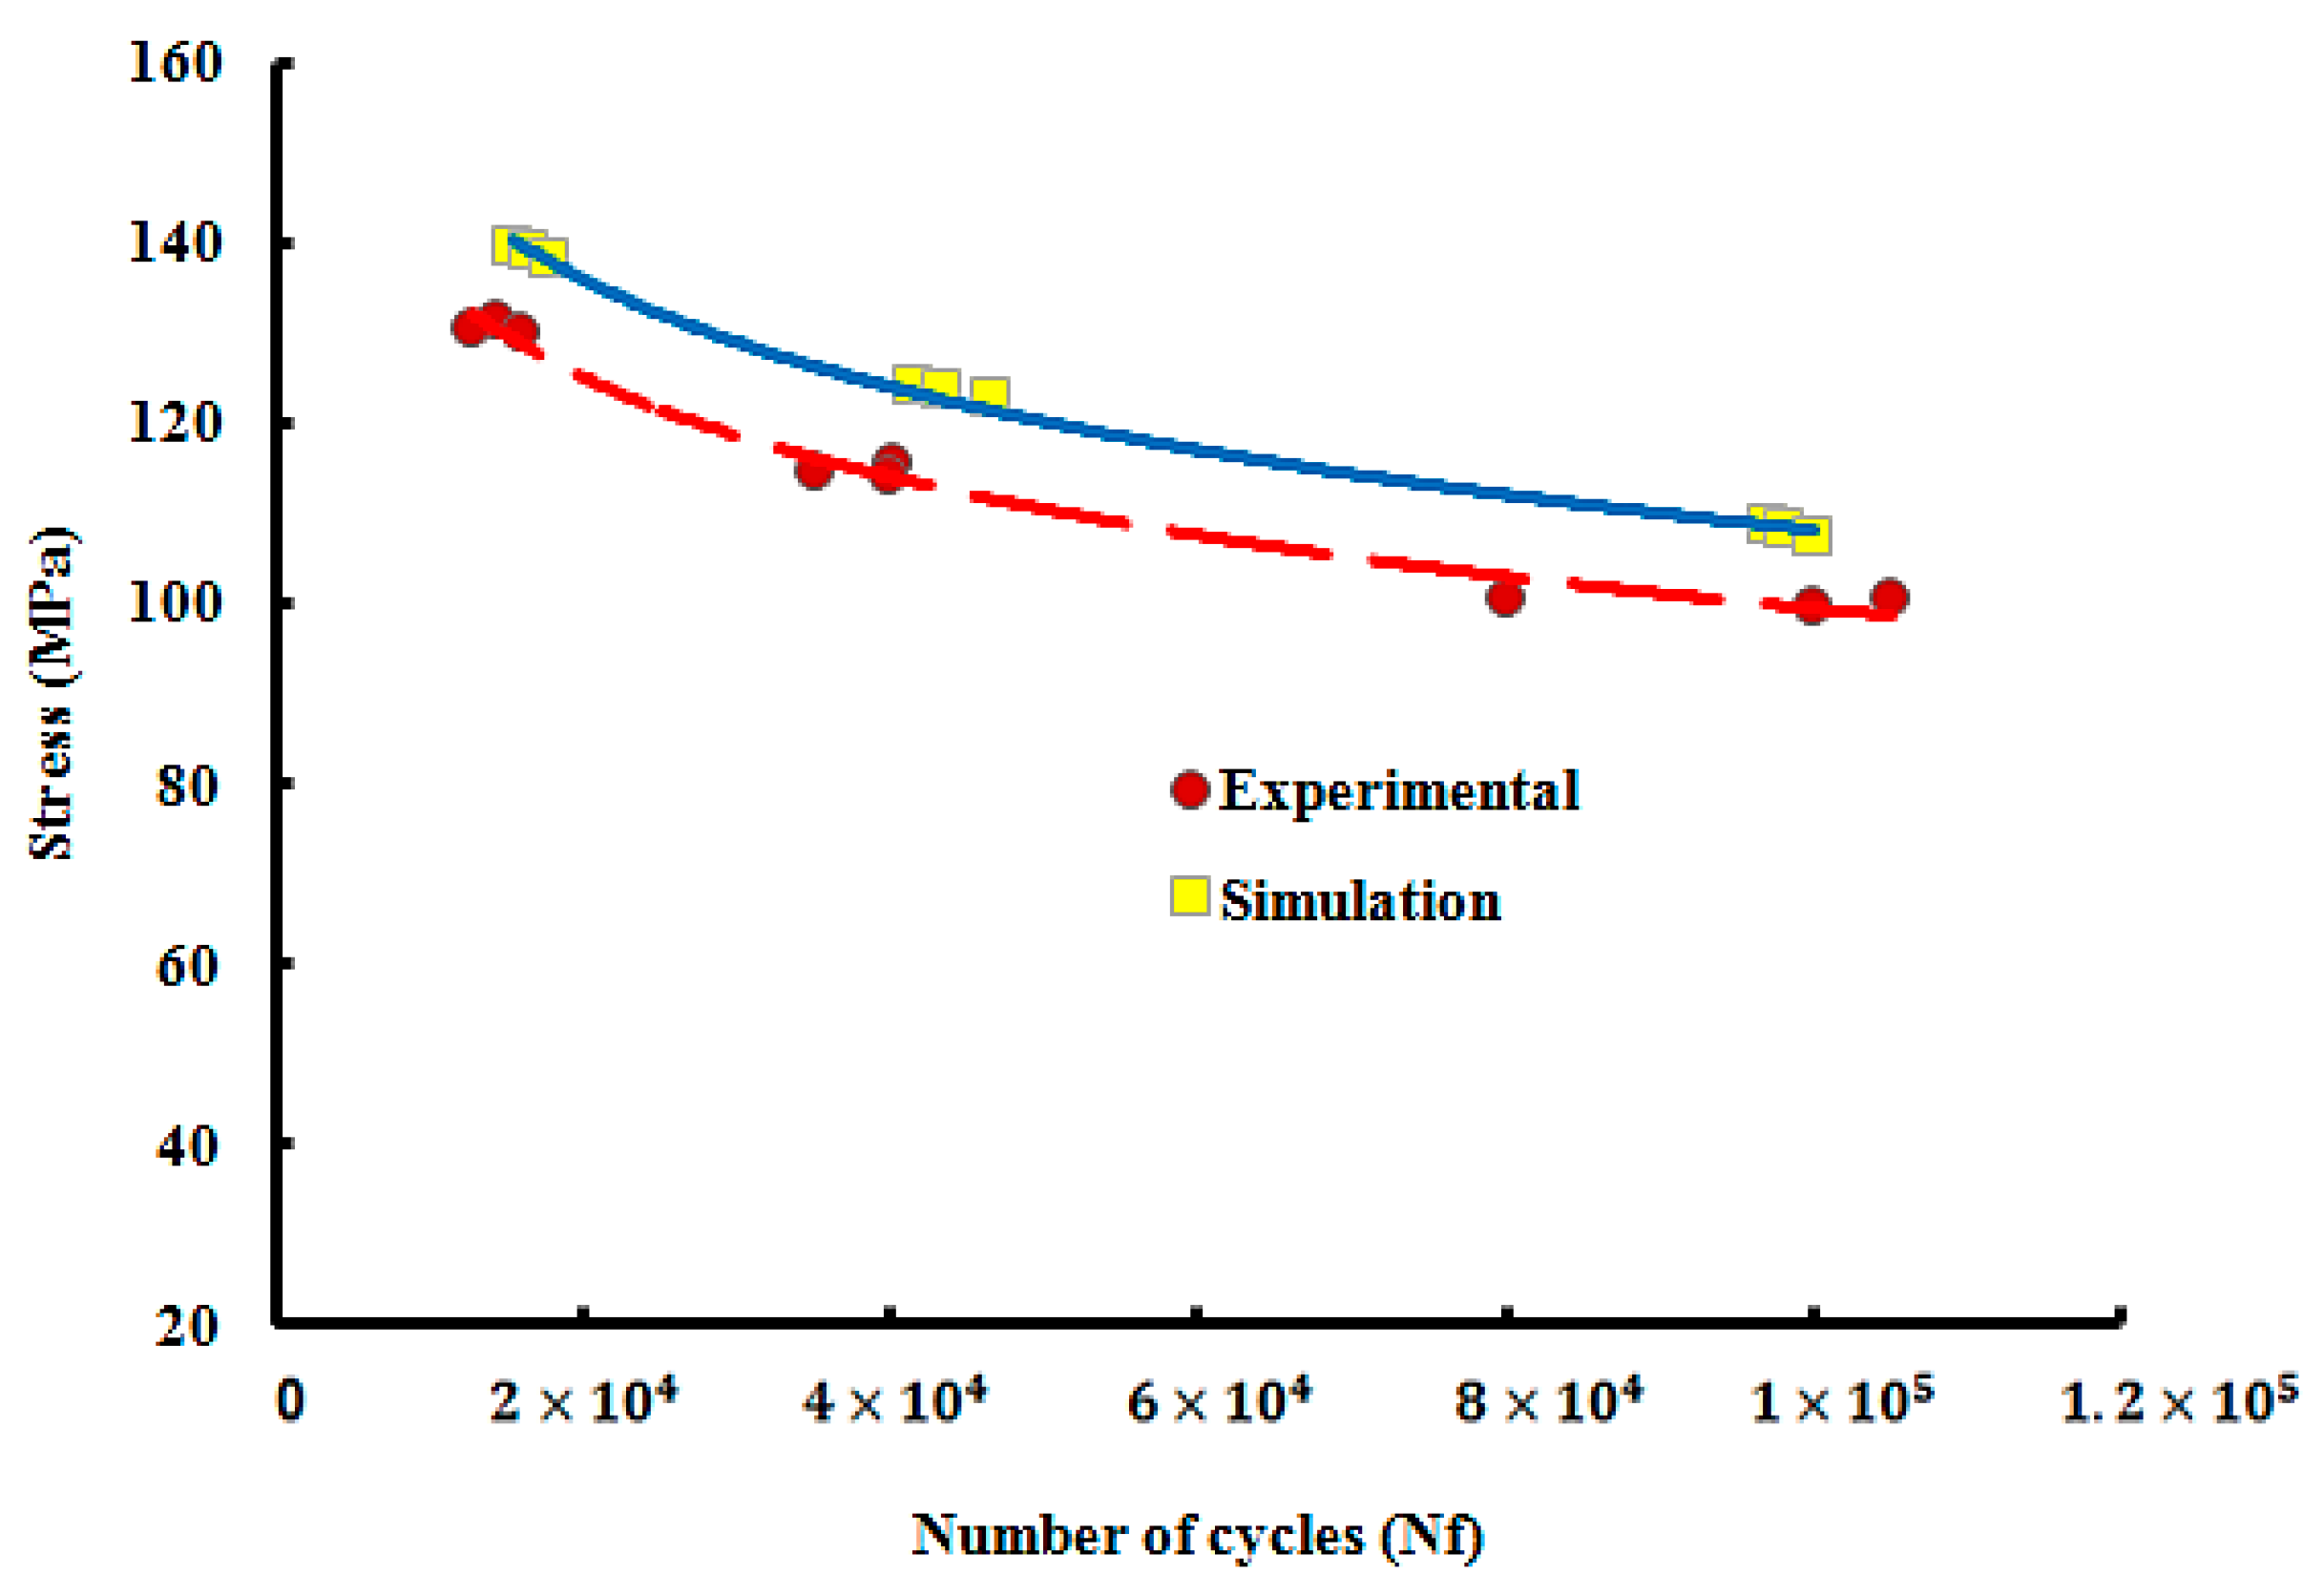
3.1. Fatigue Life of Aluminium Al 2024-T351

The working temperature changes the properties of the material, especially in terms of its strength [42]. The yield strength at 100 °C had a decrease of 6%, and 7% at 200 °C when compared to the controlled room temperature. On the other hand, the average ultimate strength had a small decrease of 3.75% at 100 °C and 25% at 200 °C when compared to the controlled room temperature. The data are shown in Table 2. The flat specimen under tensile loading experience shear rupture upon failure [43]. The grains are affected by the level of loading, type and temperature. At room temperature, the visibilities of the grains were not clear and there was an increase in the length as well. In addition, the grain growth at high temperature caused it to be compressed and elongated due to tensile load applied. The length increases, but the width decreases [44]. During tests at high temperature and loading, the precipitates from the coarse grain may not visibly or dissolve completely.
The stress-life curve for the aluminum at room and elevated temperatures is presented in Figure 7. As anticipated the number of cycles increases when the stress applied deceases. The average fatigue life at 90% was 45,343 cycles. As the load decreased, the fatigue life increased by 16% to 85%. Moreover, the fatigue life at 80% was 88,215 cycles. There was about a 49% increase in the fatigue life when the difference between the loading was only 10%. When the load was further decreased by 10%, the difference increased to 82% showing an average of 252,827 cycles at 70% of the yield strength. The fatigue life at 90% and at 100 °C was 21,679 cycles. There was an increase of 65% when the load decreased to 85% of the yield strength. However, there was only a 5% increase in the fatigue life as the load reduced to 80%. The fatigue life at 75% increased by 33% compared to 80% displaying an average of 96,688 cycles.
At 200 °C, the fatigue life was 14,272 cycles. When the load was reduced by 10% the fatigue life increased by 63% displaying 38,427 cycles. Further decrease in the percentage of loading by 10% increased the fatigue life by 60%. The fatigue life at 70% has an increase of 85% compared to 90% of the yield strength. It can be observed that at 90% of the yield strength, the fatigue life was reduced by half at 100 °C and 69% at 200 °C compared to the room temperature. Additionally, at 80%, the fatigue life difference was 27% and 56% at 100 °C and 200 °C, respectively. The difference at 70% for 200 °C was 62% and for 100 °C the percentage was expected to be lower compared to the room temperature.
When a material is subjected to a repeated loading and unloading, formation of micro-crack arises in the stress concentration area. The surface area is the most common place that the crack initiation starts [45,46]. Next, the crack propagates until reaching the critical length that causes failure of the material. The letter A represents the stable region and letter B the unstable region. The surface failure of aluminum at room temperature can be observed in Figure 8 with different percentages of loading. The visibility of the fracture areas with smooth and shiny plus uneven appearance [47] can be observed as well. In addition, the size of cavities in the unstable region is larger than the stable region. The bigger particle size in the cavities means shorter fatigue life. The formation of void is a sign that damage is experienced by the specimen and contributed by separation of grain boundaries or particle fracture [48]. Moreover, the crack growth pattern is not consistence due to different orientation of the grains. The fatigue life can also be estimated using the striation length [49].
The surface failure at 100 °C can be observed in Figure 9 ranging from 90% to 75% of the yield strength. The visibility of the stable crack growth region is very small due to catastrophic failure during loading. Meanwhile, in Figure 10, surface failures from 90% to 70% of the yield strength can be seen. The stable region surfaces are smaller compared to those at room temperature. Consequently, at elevated temperature, the elastic modulus and surface energy are lower, causing faster crack initiation and crack propagation [50]. The increased grain size causes the particle density to decrease. As a result, the fatigue life decreases as temperature increases [51]. Similarly, the fracture of particles leads to formation of voids [52]. In addition, the increase in rate of oxidation also contributes to the decrease in fatigue life and affects the mechanical properties as well [53]. Therefore, the total fatigue life at elevated temperature is affected by mechanical and micro-structural behavior that contributes to crack initiation and crack propagation [54]. The plastic cracking mechanism happened when exposed to elevated temperature. The plastic zone in the micro and macro cracks during loading leads to plastic deformation at the elevated temperature.

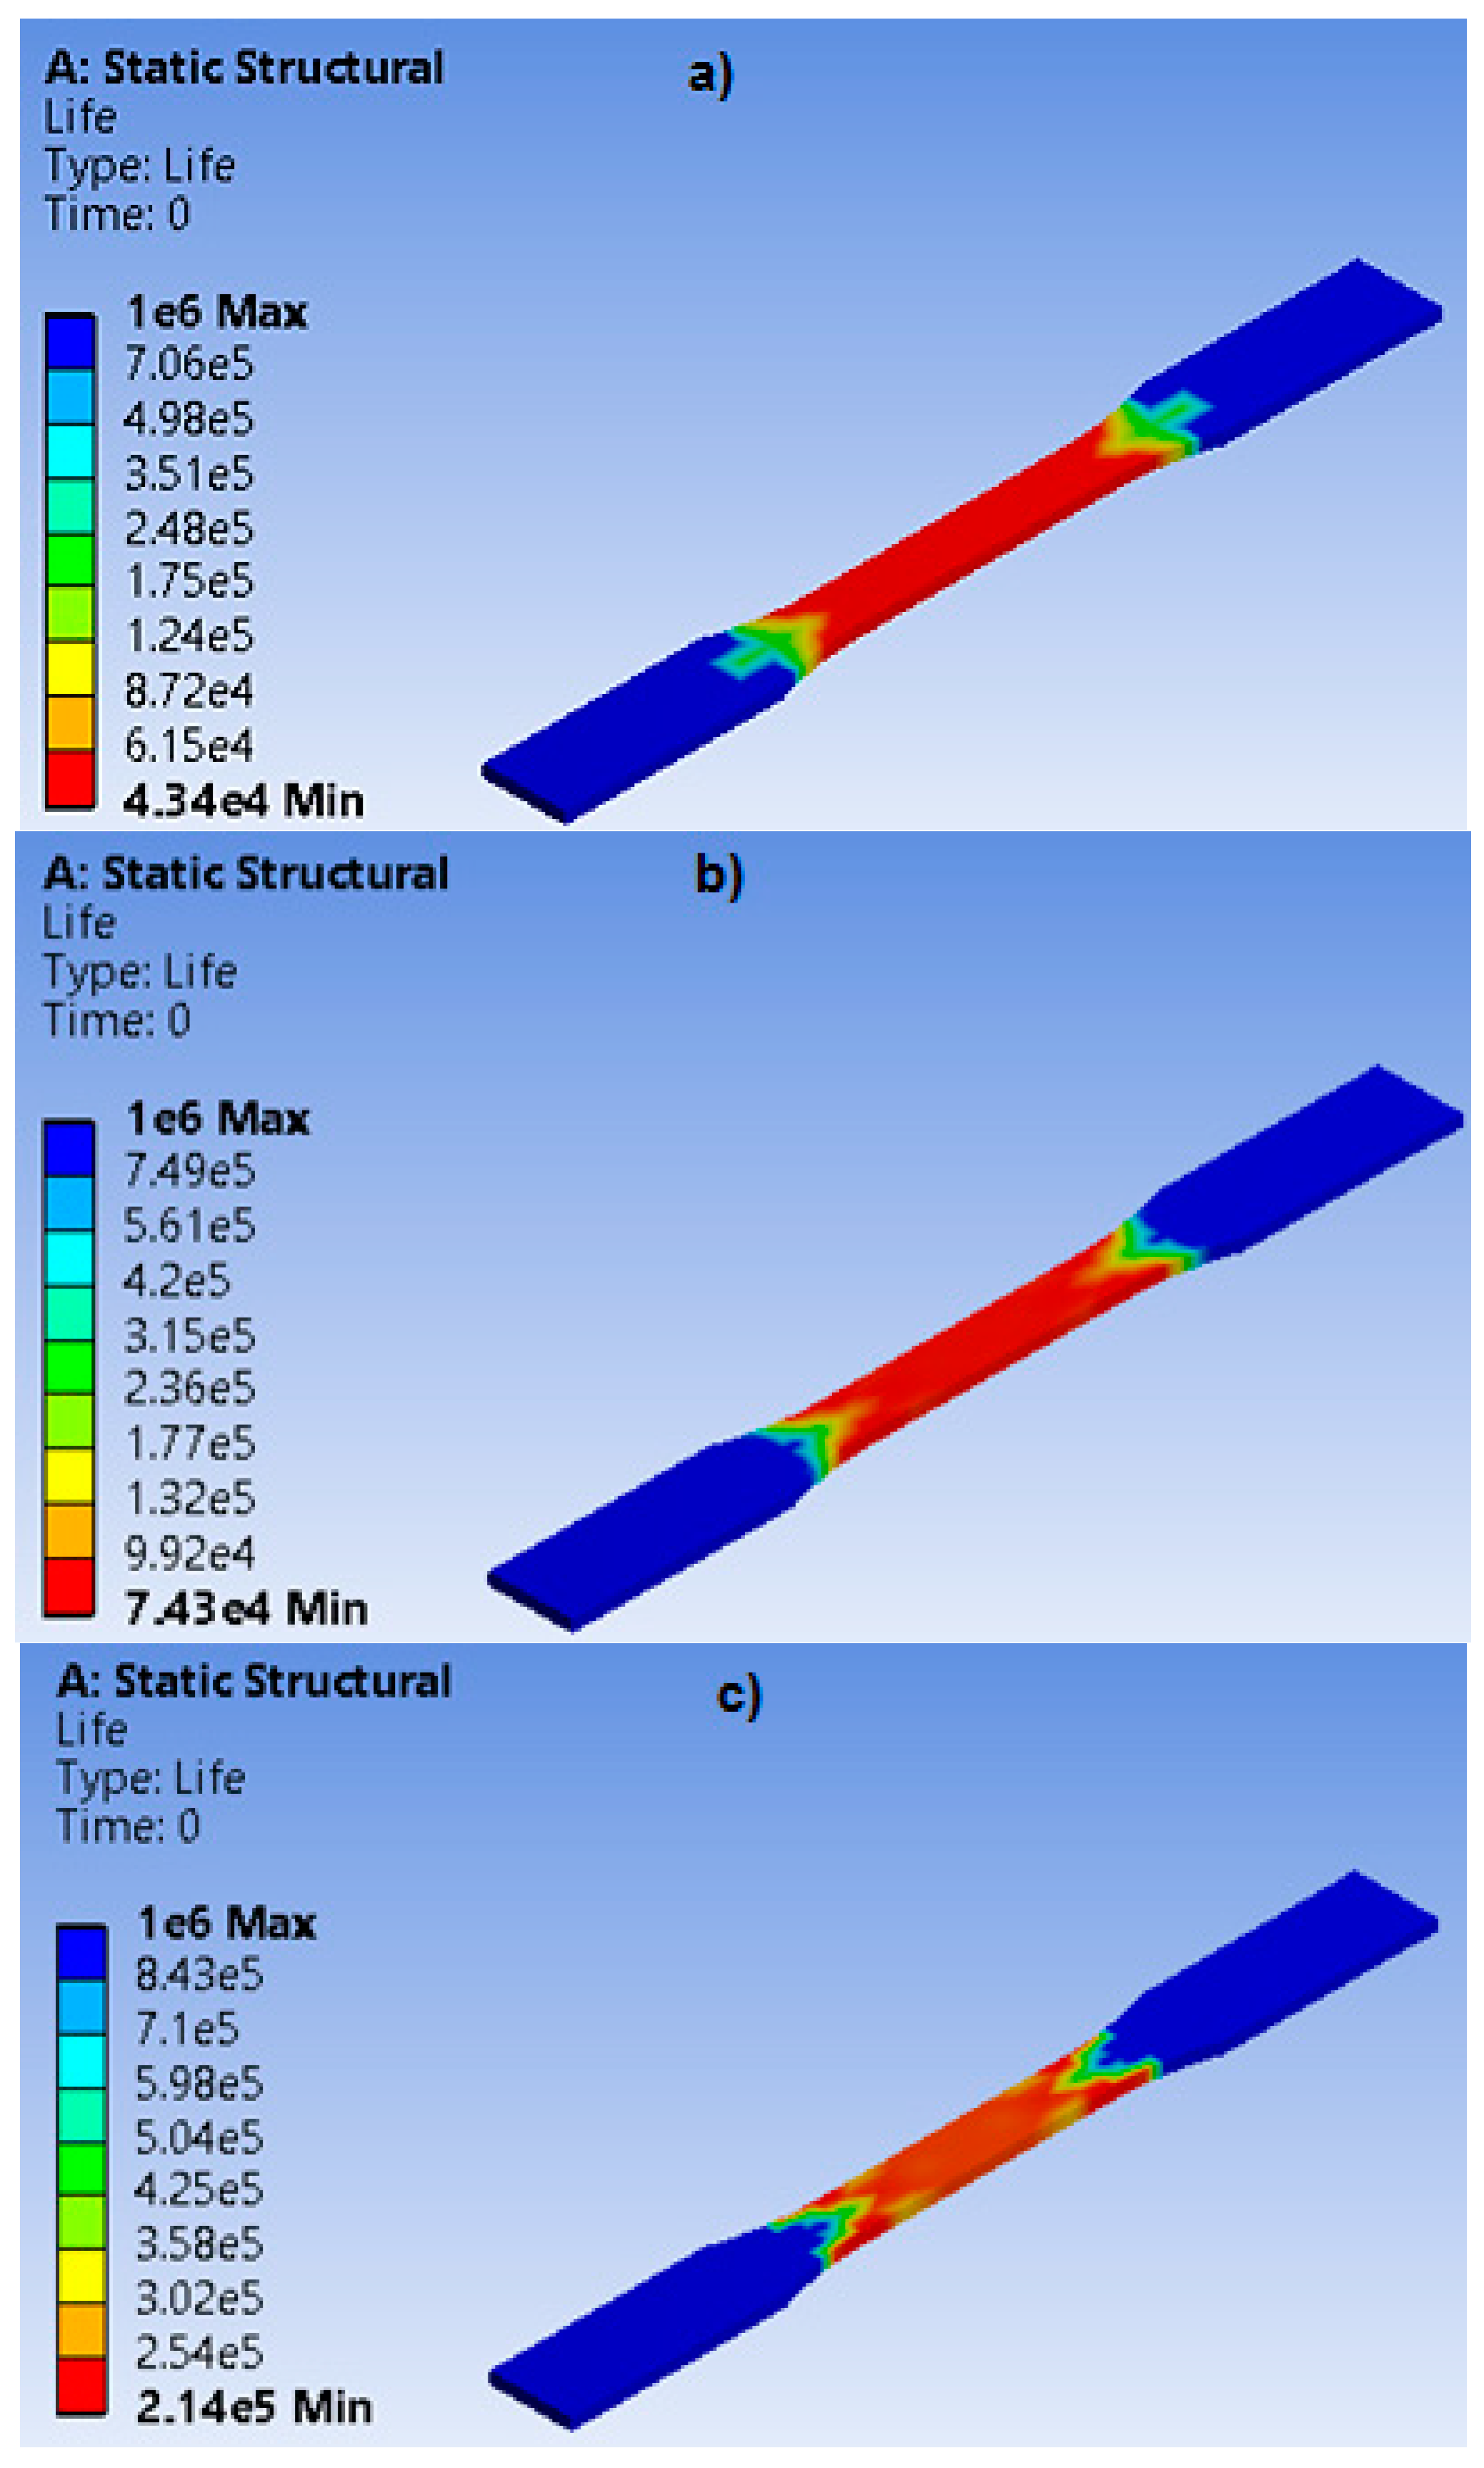
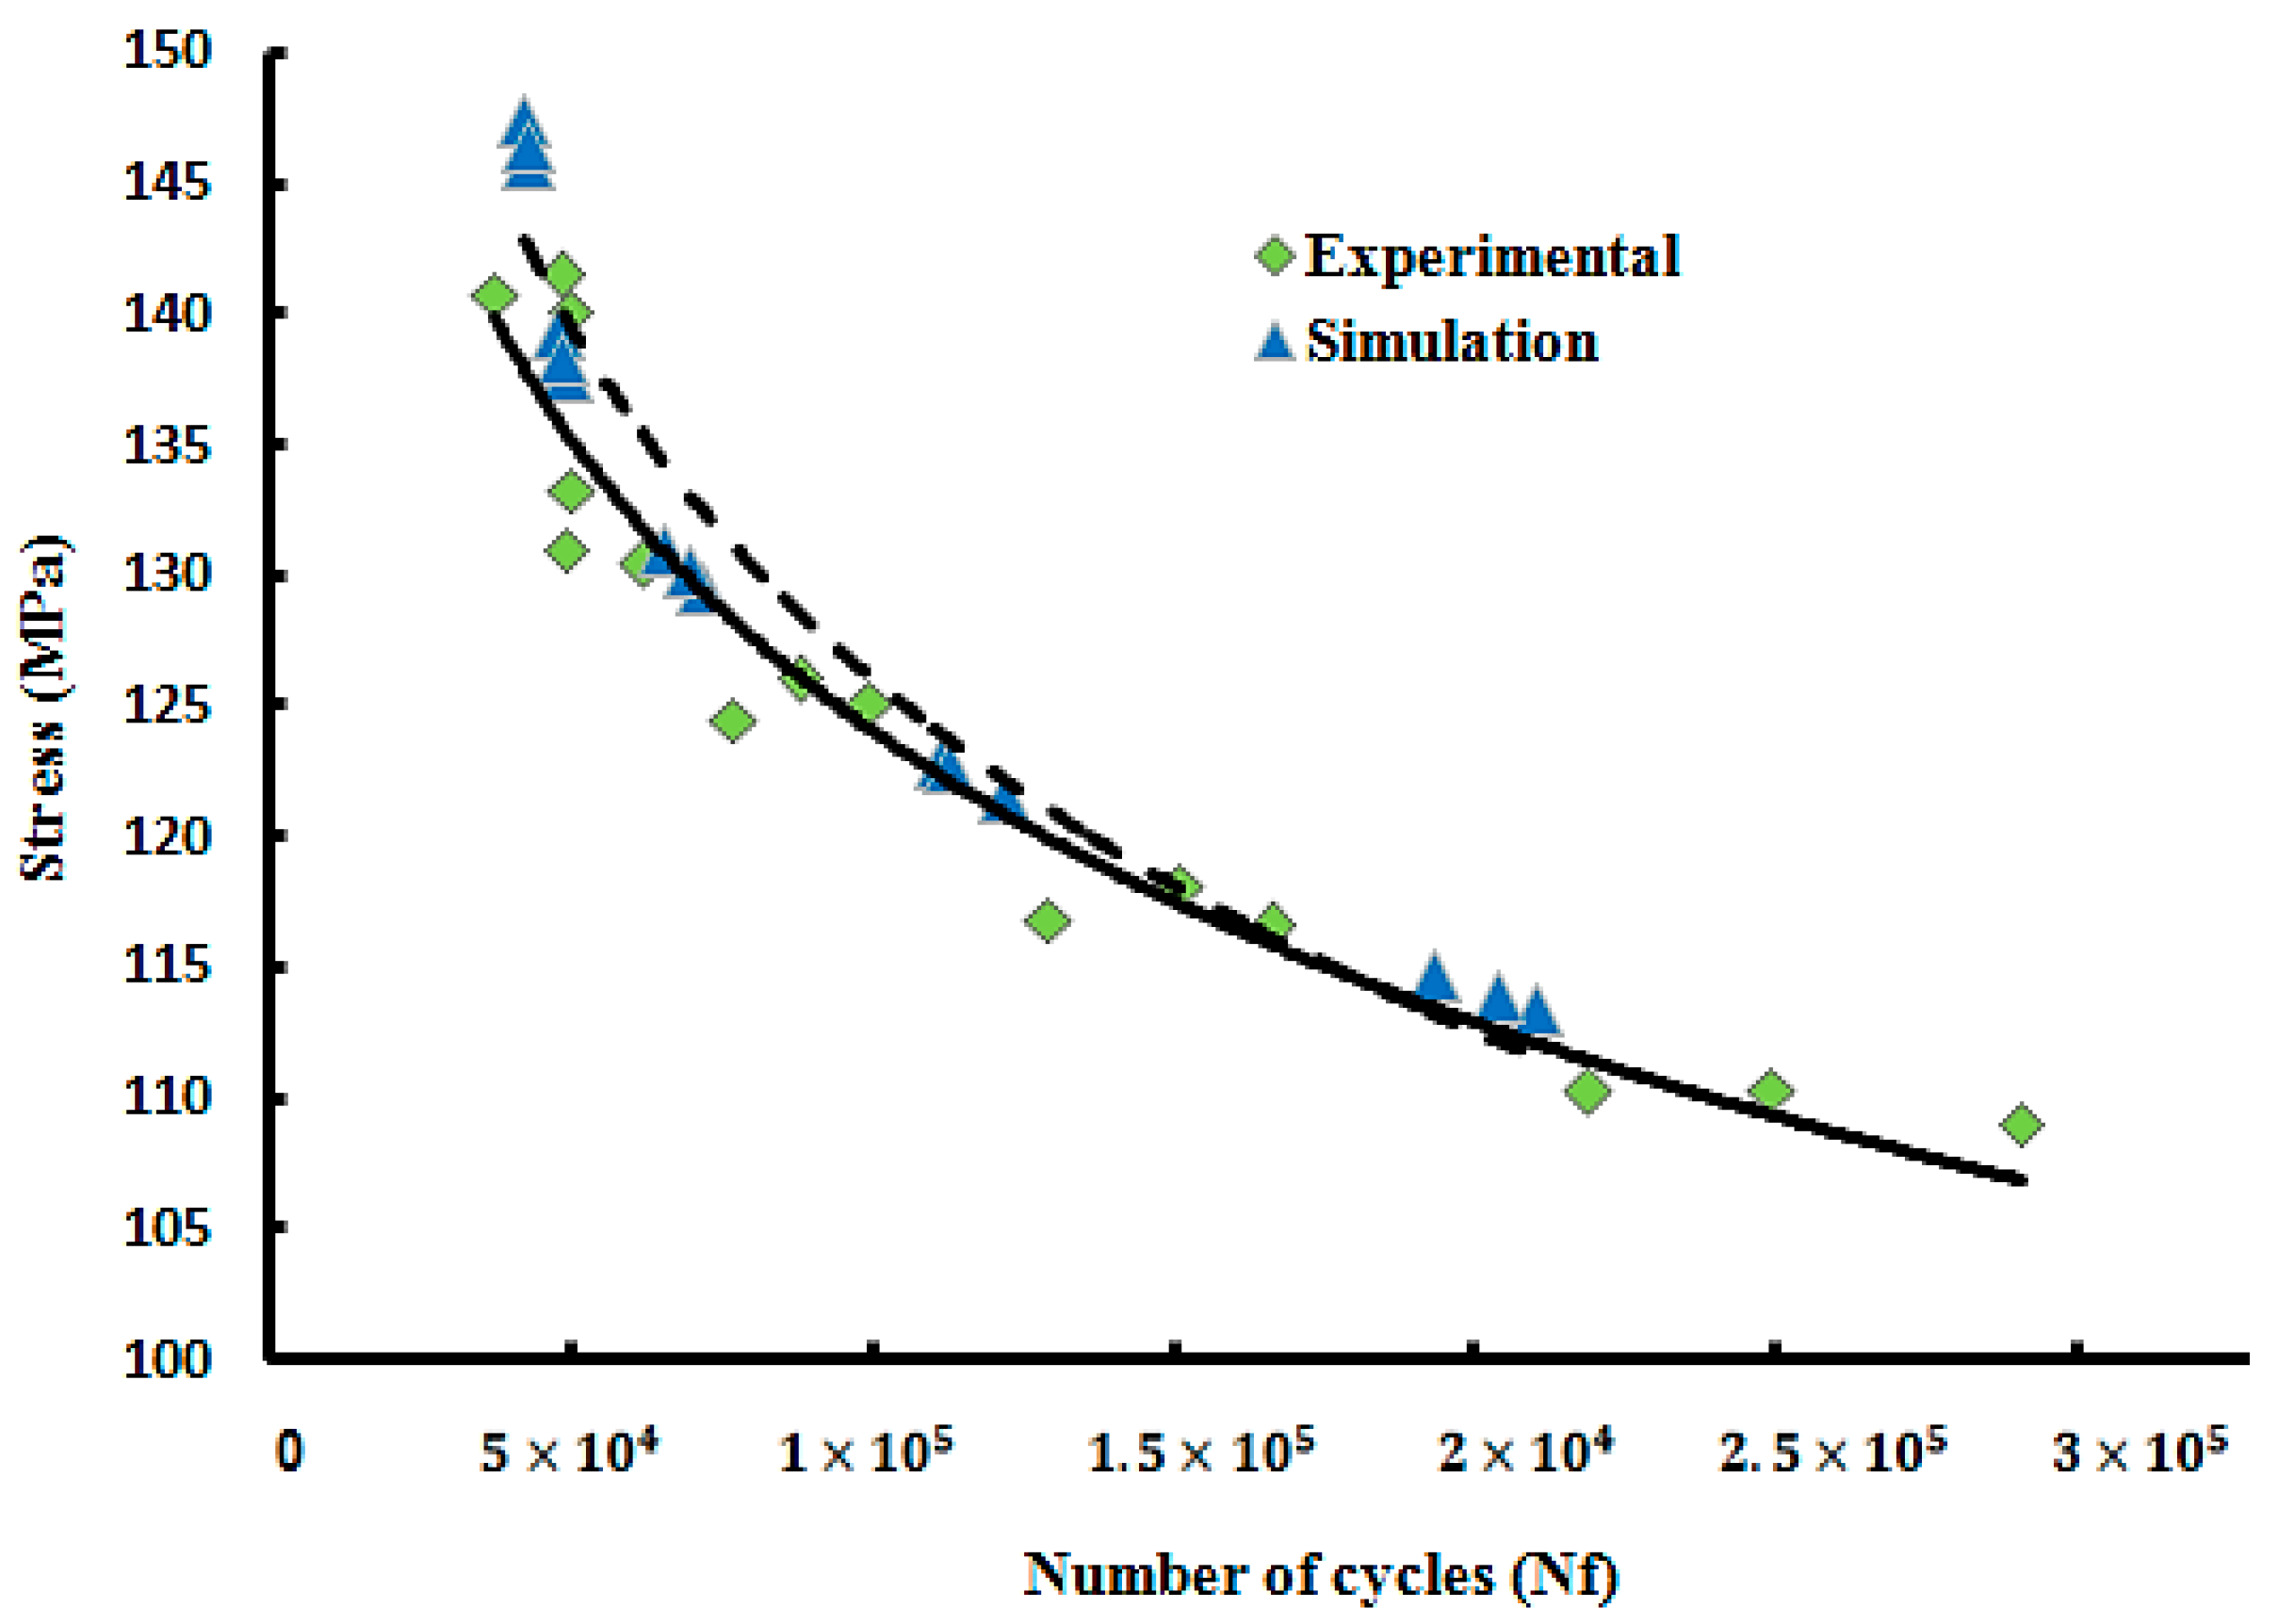
3.2. Numerical Results

Figure 11 shows the example of numerical results from the software ANSYS. The maximum stress is located at the center of the specimen. At this area, the failure occurs and the fatigue life is the minimum.
Figure 12 shows the comparison of the stress-life curve for the aluminum at room temperature. The increase in stress decreases fatigue life as expected. At 90% of the yield strength, the experimental fatigue life was 45,343 cycles and the numerical value was 47,213 cycles. There was only a small difference of about 4%. At 85%, the difference increased to 13.5%. The experimental life at 80% was 88,125 cycles and numerical life was 100,172 cycles. The difference was 14%. Moreover, the difference between experimental and numerical results decreased by 1% at 75% of the yield strength. At 70%, the difference was reduced to 9%. The highest difference between experimental and numerical results was at 80% and the lowest was at 90%.
The stress-life in Figure 13 shows the comparison of experimental and numerical results at 100 °C. The highest difference was 27% at 90% of the yield strength. In terms of numbers, the experiment displayed 21,679 cycles and numerical 29,548 cycles. The lowest difference was at 85% with only a 1% difference. The difference at 80% and 75% were at 10% and 4%, respectively.
The comparison of experimental and numerical results at 200 °C is presented by the stress-life curve in Figure 14. The results showed the fatigue life of 14,272 cycles and 16,620 cycles for the experimental and numerical work, respectively, at 90% of the yield strength. The difference between the two methods was 14%. At 80%, the difference decreased by 2%. The lowest difference was at 70% with only a difference of 3%. Nevertheless, the gap decreased between the trend lines at 100 °C and 200 °C using ANSYS as the stress decreased. The difference of experimental results is due to several factors such as scratches, unpolished surfaces and micro-structural behavior. Therefore, all the results show a good trend line comparison which proves a good agreement.

4. Conclusions

The fatigue testing of aluminum has been conducted at elevated temperatures with a frequency of 10 Hz and load ratio of 0.1. The influence of this temperature has caused a decrease in fatigue life, yield strength and ultimate strength. The yield and ultimate strength decrease as the temperature increases. The increase in the crack growth rate and grain size has caused the particle density to decrease. The surface failure was separated into a stable and unstable region. The stable region was smaller when the load applied was higher. Factors such as grain size, particle density, loading and temperature have influence in the fatigue life of the material. The fatigue life at 90% of the yield strength decreased by 50% when exposed to a temperature of 100 °C compared to the results at room temperature. A further decrease in fatigue life was observed when the temperature was increased to 200 °C. The comparison of experimental and numerical results at room temperature showed that the highest difference was 14% and the lowest was 4%. The comparison at 100 °C showed that the highest difference was 27% and the lowest was 1%. The lowest difference at 200 °C was 3% and the highest was 14%. A good agreement between experimental and numerical results was observed for all the stress-life curves. The numerical software, ANSYS Workbench successfully proved its effectiveness in predicting the fatigue life at room and elevated temperatures.

Author Contributions

Conceptualization, N.Y.; methodology, S.M.; software, N.Y.; validation, S.M.; formal analysis, S.M.; investigation, N.Y. and S.M.; resources, N.Y., S.S.R.K. and M.P.; data curation, S.M.; writing—original draft preparation, S.M.; writing—review and editing, N.Y. and S.S.R.K.; visualization, S.M., S.S.R.K. and M.P.; supervision, N.Y.; project administration, N.Y., S.S.R.K. and M.P.; funding acquisition, N.Y., S.S.R.K. and M.P. All authors have read and agreed to the published version of the manuscript.

Funding

The Ministry of Higher Education (MOHE) funded this work to Universiti Putra Malaysia (UPM) through FGRS/1/2015/TK09/UPM/02/1. This work was supported by the Ministry of Education, Youth, and Sports of the Czech Republic and the European Union (European Structural and Investment Funds Operational Program Research, Development, and Education) in the framework of the project “Modular platform for autonomous chassis of specialized electric vehicles for freight and equipment transportation”, Reg. No. CZ.02.1.01/0.0/0.0/16_025/0007293, as well as financial support from internal grants in the Institute for Nanomaterials, Advanced Technologies and Innovations (CXI), Technical University of Liberec (TUL).

Conflicts of Interest

The authors declare no conflict of interest.

References

  1. Heinz, A.; Haszler, A.; Keidel, C.; Moldenhauer, S.; Benedictus, R.; Miller, W. Recent development in aluminium alloys for aerospace applications. Mater. Sci. Eng. A 2000, 280, 102–107. [Google Scholar] [CrossRef]
  2. Dursun, T.; Soutis, C. Recent developments in advanced aircraft aluminium alloys. Mater. Des. 2014, 56, 862–871. [Google Scholar] [CrossRef]
  3. Wachowski, M.; Sniezek, L.; Szachogluchowicz, I.; Kosturek, R.; Płociński, T. Microstructure and Fatigue life of Cp-Ti/316L Bimetallic Joints Obtained by Means of Explosive Welding. Bull. Pol. Acad. Sci. Tech. Sci. 2018, 66, 925–933. [Google Scholar]
  4. Badaruddin, M.; Zulhanif; Supriadi, H. Low Cycle Fatigue Properties of Extruded 6061-T6 Aluminum Alloy. J. Phys. Conf. Ser. 2019, 1198, 032002. [Google Scholar] [CrossRef]
  5. Zhao, X.; Li, H.; Chen, T.; Cao, B.; Li, X. Mechanical Properties of Aluminum Alloys under Low-Cycle Fatigue Loading. Materials 2019, 12, 2064. [Google Scholar] [CrossRef] [PubMed] [Green Version]
  6. Kurek, A.; Kurek, M.; Łagoda, T. Stress-life curve for high and low cycle fatigue. J. Theor. Appl. Mech. 2019, 57, 677–684. [Google Scholar] [CrossRef]
  7. Pereira, A.B.; Fernandes, F.A.; De Morais, A.; Carvalhoso, P.; Morais, D. Development of a Delamination Fatigue Testing Machine for Composite Materials. Machines 2019, 7, 27. [Google Scholar] [CrossRef] [Green Version]
  8. Ai, Y.; Zhu, S.-P.; Liao, D.; Correia, J.A.; De Jesus, A.M.; Keshtegar, B. Probabilistic modelling of notch fatigue and size effect of components using highly stressed volume approach. Int. J. Fatigue 2019, 127, 110–119. [Google Scholar] [CrossRef]
  9. Ohnistova, P.; Piska, M.; Petrenec, M.; Dluhos, J.; Hornikova, J.; Šandera, P. Fatigue Life of 7475-T7351 Aluminum After Local Severe Plastic Deformation Caused by Machining. Materials 2019, 12, 3605. [Google Scholar] [CrossRef] [Green Version]
  10. Zhang, J.; Fu, X.; Lin, J.; Liu, Z.; Liu, N.; Wu, B. Study on Damage Accumulation and Life Prediction with Loads below Fatigue Limit Based on a Modified Nonlinear Model. Materials 2018, 11, 2298. [Google Scholar] [CrossRef] [Green Version]
  11. Yu, Z.-Y.; Zhu, S.-P.; Liu, Q.; Liu, Y. Multiaxial Fatigue Damage Parameter and Life Prediction without Any Additional Material Constants. Materials 2017, 10, 923. [Google Scholar] [CrossRef] [PubMed] [Green Version]
  12. Xue, L.; Shang, D.-G.; Li, L.J. Online fatigue damage evaluation method based on real-time cycle counting under multiaxial variable amplitude loading. IOP Conf. Ser. Mater. Sci. Eng. 2020, 784, 012014. [Google Scholar] [CrossRef]
  13. Zhu, S.-P.; Yue, P.; Yu, Z.-Y.; Wang, Q. A Combined High and Low Cycle Fatigue Model for Life Prediction of Turbine Blades. Materials 2017, 10, 698. [Google Scholar] [CrossRef] [PubMed] [Green Version]
  14. Rozumek, D.; Faszynka, S. Surface cracks growth in aluminum alloy AW-2017A-T4 under combined loadings. Eng. Fract. Mech. 2020, 226, 106896. [Google Scholar] [CrossRef]
  15. Pec, M.; Zapletal, J.; Šebek, F.; Petruska, J. Low-Cycle Fatigue, Fractography and Life Assessment of EN AW 2024-T351 under Various Loadings. Exp. Tech. 2018, 43, 41–56. [Google Scholar] [CrossRef]
  16. ASTM E739-80. Standard practice for statistical analysis of linearized stress-life (S-N) and strain-life (E-N) fatigue data. In Annual Book of ASTM Standards; ASTM International: Philadelphia, PA, USA, 1989; Volume 32, pp. 667–673. [Google Scholar]
  17. ASTM E8/E8M. ASTM E8/E8M Standard Test Methods for Tension Testing of Metallic Materials; ASTM International: West Conshohocken, PA, USA, 2010; Volume 1, pp. 1–27. [Google Scholar] [CrossRef]
  18. ASTM E466-15. American Society for Testing and Materials. In Practice for Conducting Force Controlled Constant Amplitude Axial Fatigue Tests of Metallic Materials; ASTM: West Conshohocken, PA, USA, 2015; pp. 1–6. [Google Scholar] [CrossRef]
  19. Hockauf, M.; Wagner, M.-X.; Halle, T.; Niendorf, T.; Lampke, T. Influence of precipitates on low-cycle fatigue and crack growth behavior in an ultrafine-grained aluminum alloy. Acta Mater. 2014, 80, 250–263. [Google Scholar] [CrossRef]
  20. DelBove, M.; Vogt, J.-B.; Bouquerel, J.; Soreau, T.; François, N.; Primaux, F. Microstructure Evolution of a Precipitation Hardened Cu-Ni-Si Alloy during Low Cycle Fatigue. Solid State Phenom. 2016, 258, 546–549. [Google Scholar] [CrossRef]
  21. Ziaja, W.; Motyka, M.; Dybiec, H.; Sieniawski, J. High cycle bending fatigue life of submicrocrystalline aluminum alloy. Mech. Mater. 2013, 67, 33–37. [Google Scholar] [CrossRef]
  22. Takahashi, Y.; Shikama, T.; Yoshihara, S.; Aiura, T.; Noguchi, H. Study on dominant mechanism of high-cycle fatigue life in 6061-T6 aluminum alloy through microanalyses of microstructurally small cracks. Acta Mater. 2012, 60, 2554–2567. [Google Scholar] [CrossRef]
  23. Rozumek, D.; Marciniak, Z. Fatigue crack growth in AlCu4Mg1 under nonproportional bending-with-torsion loading. Mater. Sci. 2011, 46, 685–694. [Google Scholar] [CrossRef] [Green Version]
  24. Chakherlou, T.; Aghdam, A.; Akbari, A.; Saeedi, K. Analysis of cold expanded fastener holes subjected to short time creep: Finite element modelling and fatigue tests. Mater. Des. 2010, 31, 2858–2866. [Google Scholar] [CrossRef]
  25. Mannan, S.; Valsan, M. High-temperature low cycle fatigue, creep–fatigue and thermomechanical fatigue of steels and their welds. Int. J. Mech. Sci. 2006, 48, 160–175. [Google Scholar] [CrossRef]
  26. Szusta, J.; Seweryn, A. Experimental study of the low-cycle fatigue life under multiaxial loading of aluminum alloy EN AW-2024-T3 at elevated temperatures. Int. J. Fatigue 2017, 96, 28–42. [Google Scholar] [CrossRef]
  27. Lee, Y.-L.; Taylor, D. Stress-Based Fatigue Analysis and Design. Fatigue Test. Anal. 2005, 103–180. [Google Scholar] [CrossRef]
  28. Karakaş, Ö.; Szusta, J. Monotonic and low cycle fatigue behaviour of 2024-T3 aluminium alloy between room temperature and 300 °C for designing VAWT components. Fatigue Fract. Eng. Mater. Struct. 2015, 39, 95–109. [Google Scholar] [CrossRef]
  29. Lee, K.-O.; Bae, K.-H.; Lee, S.-B. Comparison of prediction methods for low-cycle fatigue life of HIP superalloys at elevated temperatures for turbopump reliability. Mater. Sci. Eng. A 2009, 519, 112–120. [Google Scholar] [CrossRef]
  30. Li, H.; Nishimura, A.; Nagasaka, T.; Muroga, T. Stress–strain behavior on tensile and low cycle fatigue tests of JLF-1 steel at elevated temperature in vacuum. Fusion Eng. Des. 2006, 81, 2907–2912. [Google Scholar] [CrossRef]
  31. Nagode, M. An online algorithm for temperature influenced fatigue–life estimation: Strain–life approach. Int. J. Fatigue 2004, 26, 155–161. [Google Scholar] [CrossRef]
  32. Weiss, M.P.; Lavi, E. Fatigue of metals—What the designer needs? Int. J. Fatigue 2016, 84, 80–90. [Google Scholar] [CrossRef]
  33. Uematsu, Y.; Akita, M.; Nakajima, M.; Tokaji, K. Effect of temperature on high cycle fatigue behaviour in 18Cr–2Mo ferritic stainless steel. Int. J. Fatigue 2008, 30, 642–648. [Google Scholar] [CrossRef]
  34. Gurubaran, P.; Afendi, M.; Fareisha, M.A.N.; Majid, M.A.; Haftirman, I.; A Rahman, M.T. Fatigue life investigation of UIC 54 rail profile for high speed rail. J. Phys. Conf. Ser. 2017, 908, 12026. [Google Scholar] [CrossRef]
  35. Ergenc, A.F.; Ergenc, A.T.; Kale, S.; Sahin, I.G.; Dagdelen, K.; Pestelli, V.; Yontem, O.; Kuday, B. Reduced Weight Automotive Brake Pedal Test & Analysis. Int. J. Automot. Sci. Technol. 2017, 1, 8–13. [Google Scholar]
  36. Singh, P.K.; Gautam, M.G.; Lal, S.B. Stress Analysis Spur Gear Design by Using Ansys Workbench. Int. J. Mech. Eng. Robot. Res. 2014, 3, 64–68. [Google Scholar]
  37. Adigio, E.M.; Nangi, E.O. Computer Aided Design and Simulation of Radial Fatigue Test of Automobile Rim Using ANSYS. IOSR J. Mech. Civ. Eng. 2014, 11, 68–73. [Google Scholar] [CrossRef]
  38. Lesiuk, G.; Szata, M.; Rozumek, D.; Marciniak, Z.; Correia, J.; De Jesus, A. Energy response of S355 and 41Cr4 steel during fatigue crack growth process. J. Strain Anal. Eng. Des. 2018, 53, 663–675. [Google Scholar] [CrossRef]
  39. Jain, N. The reduction of stress concentration in a uni-axially loaded infinite width rectangular isotropic/orthotropic plate with central circular hole by coaxial auxiliary holes. IIUM Eng. J. 2012, 12. [Google Scholar] [CrossRef]
  40. Jain, N.; Banerjee, M.; Sanyal, S. Three Dimensional Parametric Analyses on Effect of Fibre Orientation for Stress Concentration Factor in Fibrous Composite Cantilever Plate with Central Circular Hole under Transverse Loading. IIUM Eng. J. 2012, 13. [Google Scholar] [CrossRef]
  41. Fuchs, H.O.; Stephens, R.I.; Saunders, H. Metal Fatigue in Engineering; Wiley: New York, NY, USA, 2001. [Google Scholar]
  42. Lipski, A.; Mroziński, S. The Effects of Temperature on the Strength Properties of Aluminium Alloy 2024-T3. Acta Mech. Autom. 2012, 6, 62–66. [Google Scholar]
  43. Khan, S.; Kintzel, O.; Mosler, J. Experimental and numerical lifetime assessment of Al 2024 sheet. Int. J. Fatigue 2012, 37, 112–122. [Google Scholar] [CrossRef]
  44. Tomczyk, A.; Seweryn, A. Fatigue life of EN AW-2024 alloy accounting for creep pre-deformation at elevated temperature. Int. J. Fatigue 2017, 103, 488–507. [Google Scholar] [CrossRef]
  45. Man, J.; Obrtlík, K.; Polak, J. Study of surface relief evolution in fatigued 316L austenitic stainless steel by AFM. Mater. Sci. Eng. A 2003, 351, 123–132. [Google Scholar] [CrossRef]
  46. Cao, X.; Xu, L.; Xu, X.-L.; Wang, Q. Fatigue Fracture Characteristics of Ti6Al4V Subjected to Ultrasonic Nanocrystal Surface Modification. Metals 2018, 8, 77. [Google Scholar] [CrossRef] [Green Version]
  47. Khan, S.; Vyshnevskyy, A.; Mosler, J. Low cycle lifetime assessment of Al2024 alloy. Int. J. Fatigue 2010, 32, 1270–1277. [Google Scholar] [CrossRef] [Green Version]
  48. Wisner, B.; Kontsos, A. Investigation of particle fracture during fatigue of aluminum 2024. Int. J. Fatigue 2018, 111, 33–43. [Google Scholar] [CrossRef]
  49. Caton, M.; John, R.; Porter, W.; Burba, M. Stress ratio effects on small fatigue crack growth in Ti–6Al–4V. Int. J. Fatigue 2012, 38, 36–45. [Google Scholar] [CrossRef]
  50. François, D. The Influence of the Microstructure on Fatigue. Adv. Fatigue Sci. Technol. 1989, 23–76. [Google Scholar] [CrossRef]
  51. Hussain, F.; Abdullah, S.; Nuawi, M. Effect of temperature on fatigue life behaviour of aluminium alloy AA6061 using analytical approach. J. Mech. Eng. Sci. 2016, 10, 2324–2335. [Google Scholar] [CrossRef]
  52. Marno, M.; Ismail, A.F.; Marini, B.A. Torsional Deformation and Fatigue Behaviour of 6061 Aluminium Alloy. IIUM Eng. J. 2012, 12. [Google Scholar] [CrossRef]
  53. Zakaria, K.; Abdullah, S.; Ghazali, M.J. Comparative study of fatigue life behaviour of AA6061 and AA7075 alloys under spectrum loadings. Mater. Des. 2013, 49, 48–57. [Google Scholar] [CrossRef]
  54. Liu, Y.; Yu, J.; Xu, Y.; Sun, Y.; Guan, H.; Hu, Z. High cycle fatigue behavior of a single crystal superalloy at elevated temperatures. Mater. Sci. Eng. A 2007, 454, 357–366. [Google Scholar] [CrossRef]
Figure 1. Monotonic tensile/cyclic test at room temperature using MTS 810 testing machine.
Metals 10 01581 g001
Figure 2. Monotonic/cyclic test at elevated temperature using MTS 810 equipped with MTS 653 high temperature furnace.
Metals 10 01581 g002
Figure 3. Thermocouples placed in the high temperature furnace at different locations.
Metals 10 01581 g003
Figure 4. Dimension of the flat specimen (mm).
Metals 10 01581 g004
Figure 5. The 3D model by boss-extrude feature generated in SolidWorks.
Metals 10 01581 g005
Figure 6. (a) Meshed model with SOLID 187 elements; (b) Boundary condition applied to the model.
Metals 10 01581 g006
Figure 7. The S-N curve of aluminum at room and elevated temperatures.
Metals 10 01581 g007
Figure 8. Surface failure of the specimens at room temperature; (a) 90%; (b) 85%; (c) 80%; (d) 75%; (e) 70%.
Metals 10 01581 g008
Figure 9. Surface failure at 100 °C; (a) 90%; (b) 85%; (c) 80%; (d) 75%.
Metals 10 01581 g009
Figure 10. Surface failure at 200 °C; (a) 90%; (b) 80%; (c) 70%.
Metals 10 01581 g010
Figure 11. Examples of numerical results for aluminum at room temperature, from the percentage of the stress of the yield strength; (a) 90%; (b) 80%; (c) 70%.
Metals 10 01581 g011
Figure 12. Comparison of results between experimental and simulation at room temperature.
Metals 10 01581 g012
Figure 13. Comparison of results between experimental and simulation at 100 °C.
Metals 10 01581 g013
Figure 14. Comparison of results between experimental and simulation at 200 °C.
Metals 10 01581 g014
Table 1. The loads applied at a different percentage of the yield strength.
ConditionYield Strength (%)Mean Load (kN)Amplitude (kN)
Room906.485.31
856.135.01
805.774.72
755.414.42
705.054.13
100 °C906.134.99
855.764.72
805.434.44
755.094.16
200 °C906.024.92
805.354.38
704.683.83
Table 2. The results obtained from the monotonic tensile tests.
ConditionYield Strength (MPa)Ultimate Strength (MPa)
Room347.58464.19
100 °C326.12446.78
200 °C322.66349.80
Publisher’s Note: MDPI stays neutral with regard to jurisdictional claims in published maps and institutional affiliations.

