Article

Energy Absorption of Different Cell Structures for Closed-Cell Foam-Filled Tubes Subject to Uniaxial Compression

School of Metallurgy, Northeastern University, Shenyang 110819, China
*
Author to whom correspondence should be addressed.
Metals 2020, 10(12), 1579; https://doi.org/10.3390/met10121579
Submission received: 10 November 2020 / Revised: 24 November 2020 / Accepted: 24 November 2020 / Published: 26 November 2020

Abstract

:
The energy absorption of different cell structures for closed-cell aluminum foam-filled Al tubes are investigated through quasi-static compression testing. Aluminum foams are fabricated under different pressures, obtaining aluminum foams with different cell sizes. It is found that the deformation of the foam core is close to the overall deformation, and the deformation band is seriously expanded when the cell size is fined, which leads to the increase of interaction. Results confirm that the foam-filled tubes absorb more energy due to the increase of interaction between the foam core and tube wall when the foaming pressure increases. The energy absorption efficiency of foam-filled tubes can reach a maximum value of 90% when the foam core is fabricated under 0.30 MPa, which demonstrates that aluminum foams fabricated under increased pressure give a new way for the applications of foam-filled tubes in the automotive industry.

1. Introduction

Thin-walled metallic tubes have been widely used as energy absorbing devices as a result of their progressive buckling during structural impact and the light weight of the structure [1,2,3]. On the other hand, metal foams, such as aluminum foams [4,5,6], closed-cell Mg alloy composite foams [7], and Ni-Al foams [8], show a long plateau of almost constant stress in the compressive stress-strain curve, which makes them have an excellent energy absorption capacity. In the past few decades, aluminum foam-filled tubes have been getting more and more attention for energy absorbing devices because of the interaction between the tube wall and the foam core.
Much work has been carried out on the interaction of foam-filled tubes. Santosa et al. presented the following equation for the average crushing load of foam-filled square tubes of length b by including the contribution of the interaction effect [9,10,11]:
P af = P ae + C σ pl b 2
where P af , P ae and σ pl   are the average crushing load of foam-filled tubes, the average crushing load of empty tubes, and the plateau stress of foams, respectively. The dimensionless constant C is the strengthening coefficient of the foams, which is directly associated with the interaction effect between the tube wall and the foam core. A.K. Toksoy et al. investigated the strengthening effect in polystyrene foam-filled Al tubes [12]. They found that foam compressed in between the folds leads to a higher strengthening effect. Yasuo Yamada et al. showed that the interaction effect of foam-filled tubes mainly depends on the ratio of the mean crushing force of foam to that of the Al alloy tube [13]. Xudong Yang et al. also observed that the deformation of foam-filled tubes is determined by the mean plateau load ratio of foams and tubes [14].
The strength of the foam core is found to affect the interaction effect. Niknejad et al. pointed out that the effect of low density polyurethane foam (0.05 g/cm3) on the crushing strength of tubes is negligible, suggesting that high density polyurethane foam has an effect on the compression behavior and enhances the energy absorption of tubes [15]. This result was in agreement with the result described by Mantena and Mann [16]. Furthermore, it was also found that the lower density foams (0.13 g/cm3) were ineffective on the deformation mode. A noticeable shift in deformation mode occurred for higher density foams (0.25 g/cm3 and 0.35 g/cm3) [10,11]. Nevertheless, because the strength of foam cores was low for most of the experimental investigations above, there are still insufficient data to understand the influence of foam core strength on the interaction effect in foam-filled tubes.
To further understand the effect of the foam core on the interaction and the energy absorption of foam-filled tubes, here, different cell sizes of aluminum foams (ranges from 3 to 0.8 mm) are fabricated under different pressures [17], the density range of which is from 0.40 g/cm3 to 0.90 g/cm3, which is much greater than the foam materials mentioned above. The compressive tests of tubes filled with different cell sizes of aluminum foams are performed. The interaction and energy absorption characteristics of foam-filled tubes are analyzed in detail. Finally, the energy absorption efficiency of foam-filled tubes can be predicted by the criterion related to the strength of the tubes and foams.

2. Materials and Testing Methods

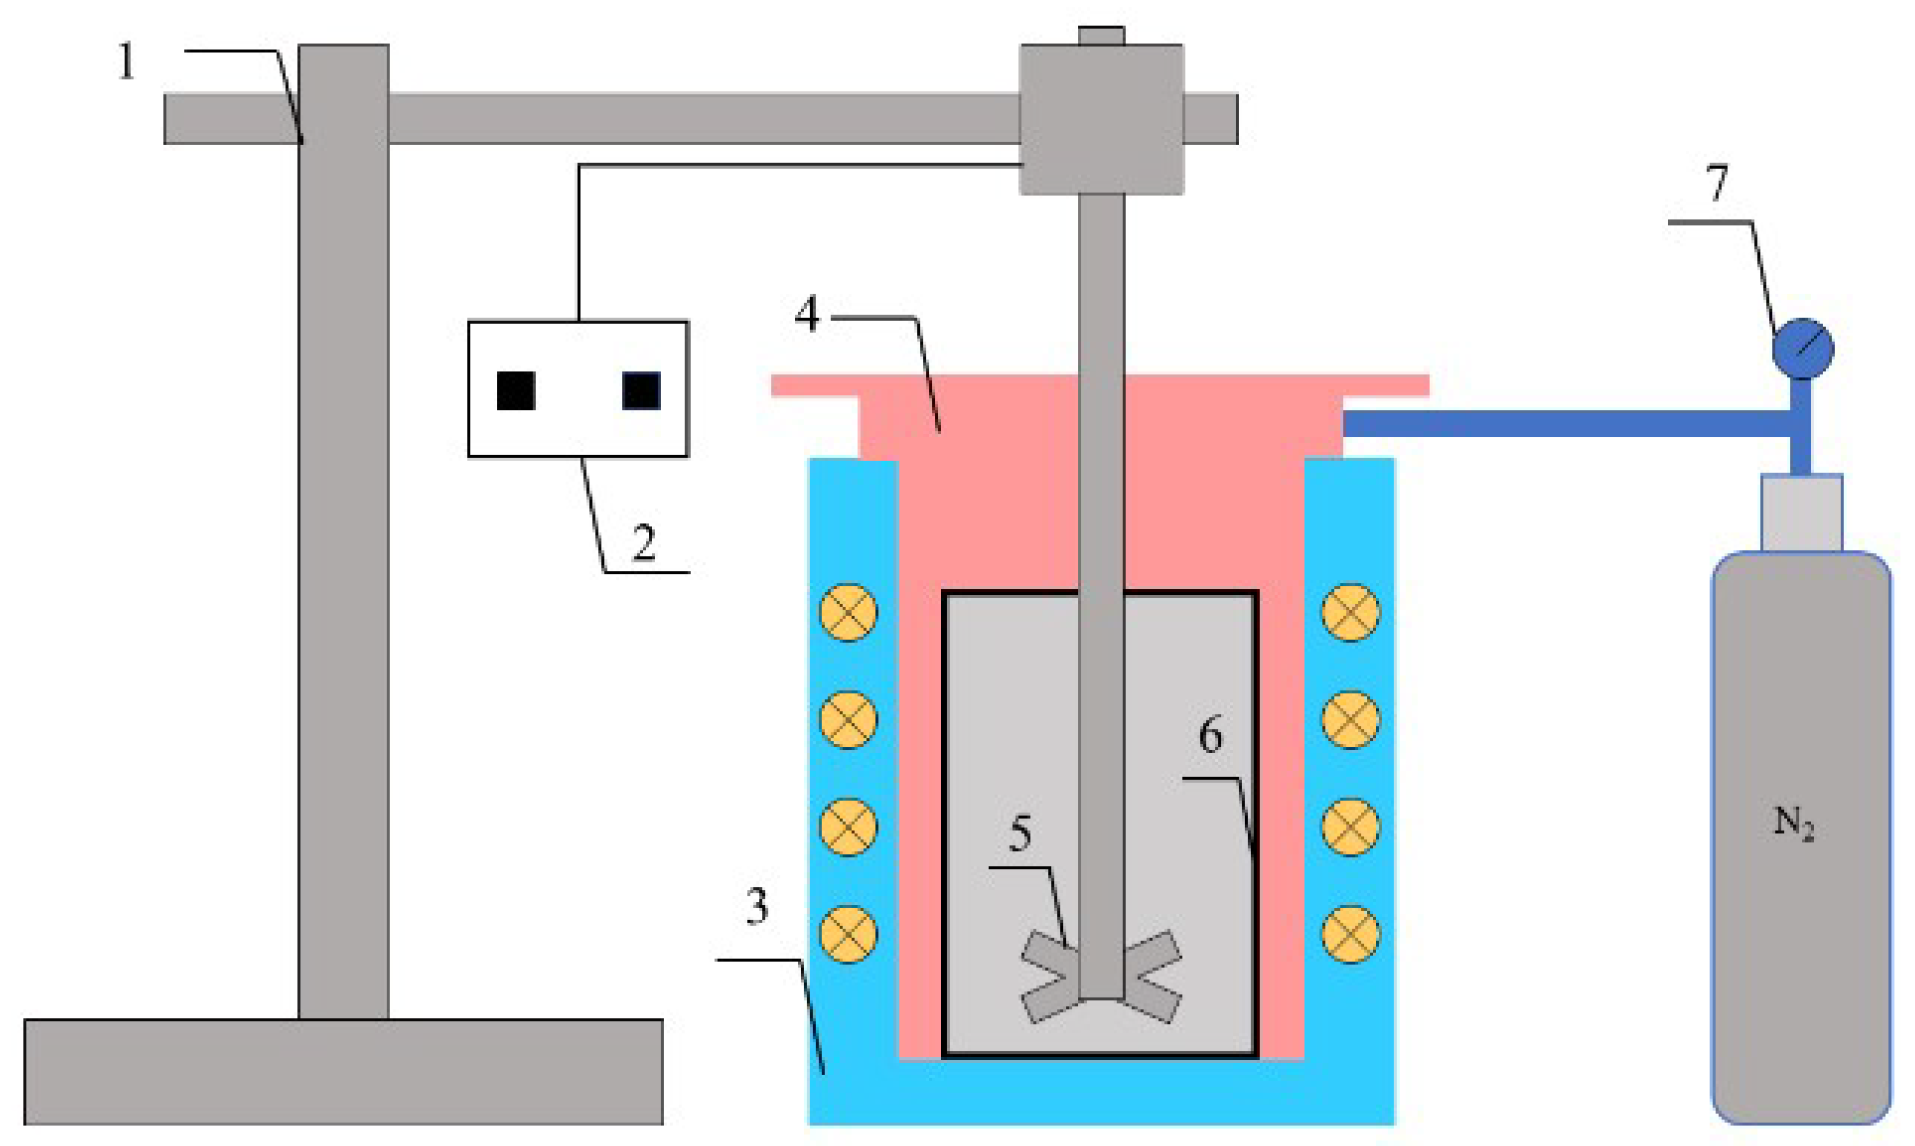
2.1. Specimen Preparation

Four raw materials were utilized for fabricating the aluminum foam: commercial aluminum (purity 99.6%), industrial calcium (purity 99.9%), titanium hydride powder (mean diameter: 22 μm, purity 99.4%, pre-treated at 400 °C for 30 min), and nitrogen (purity 99.99%).
The aluminum foams were fabricated by the increased pressure foaming route. The cell size distribution narrows with increasing pressure because high pressure reduces bubble coalescing and hinders gravity drainage [17]. The foaming process happened in a bottom-sealed stainless steel tube; see Figure 1. The pure aluminum was initially melted at 720 °C in a stainless steel crucible and admixed with 3 wt.% metallic calcium, then the melt was stirred by an impellor for 5 min to thicken. After the temperature decreased to 690 °C, one-point-two weight percent TiH2 powder was introduced into the melt with a revolution speed of 1800 rpm for 180 s to obtain a homogeneous distribution. After this, the impellor was quickly pulled out, and the stainless steel tube was immediately allowed to seal. Then, the stainless steel tube was filled with nitrogen (the pressure value was set in advance), and the temperature of the sealed system was maintained at 690 °C. The stainless steel tube was removed from the furnace when the foam sample stopped expanding. The foam was allowed to cool by air. Foam samples were machined by a wire-cutting machine with a diameter of 38 mm and a height of 60 mm. The density of aluminum foams was determined by measuring their weight and volume. The cell structure was scanned by using the X-ray CT facility (Dandong Aolong Ray Instrument Group Co. Ltd, China). The mean cell size Dm is determined by the following equation [17,18]:
D m = S i i = 1 n S i   × S i π
where n is the total cell number. For each foam sample, at least 200 cells were chosen to calculate the mean cell size. Si is the area of the ith pore, which was captured by image processing software. The parameters of aluminum foams are listed in Table 1.
The thin-walled circular tubes were made of aluminum alloy 6061 with an outer diameter of 40 mm, a wall thickness of 1 mm, and a height of 60 mm. All tubes were heat-treated at 550 °C for 8 h. The foam-filled tubes were made by inserting aluminum foams into the empty tubes. Because the diameters of the aluminum foam specimens were almost equal to the inner diameter of the thin-walled circular tubes, the foam specimens fit closely inside the tubes. Figure 2 shows representative macrostructure images of the aluminum foam-filled tubes.

2.2. X-ray Tomography

The compressed foams and foam-filled tubes were scanned using a microfocus X-ray CT system (from Dandong Aolong Ray Instrument Group Co. Ltd, Dandong, China). According to the features of the samples’ density, dimensions, and imaging quality required, the X-ray tube current and voltage were set to be 90 μA and 90 kV, respectively. The effective voxel size used in CT scanning was 5 μm. The aluminum foams and foam-filled tubes were located on a circular platform controlled by a motor. Tomographic images of the specimens were obtained by rotating the specimens 360° in steps of 1°. After each step, radioscopic projections were performed, and 2D slices were obtained based on a back-projection reconstruction algorithm. The gray threshold was regulated in order to obviously recognize the cell pore and cell wall in the CT images.

2.3. Compressive Test Procedures

The compression tests of empty tubes, foam-filled tubes, and aluminum foams were carried out on a standard universal testing machine (CMT5105) at room temperature. Compression was performed in the height direction of the samples. The load capacity of the testing machine was 100 kN. The cross-head speed was 2 mm/min throughout the whole test. All samples were compressed up to approximately 75% strain. Load and displacement were recorded automatically via the connected computer.

3. Results and Discussion
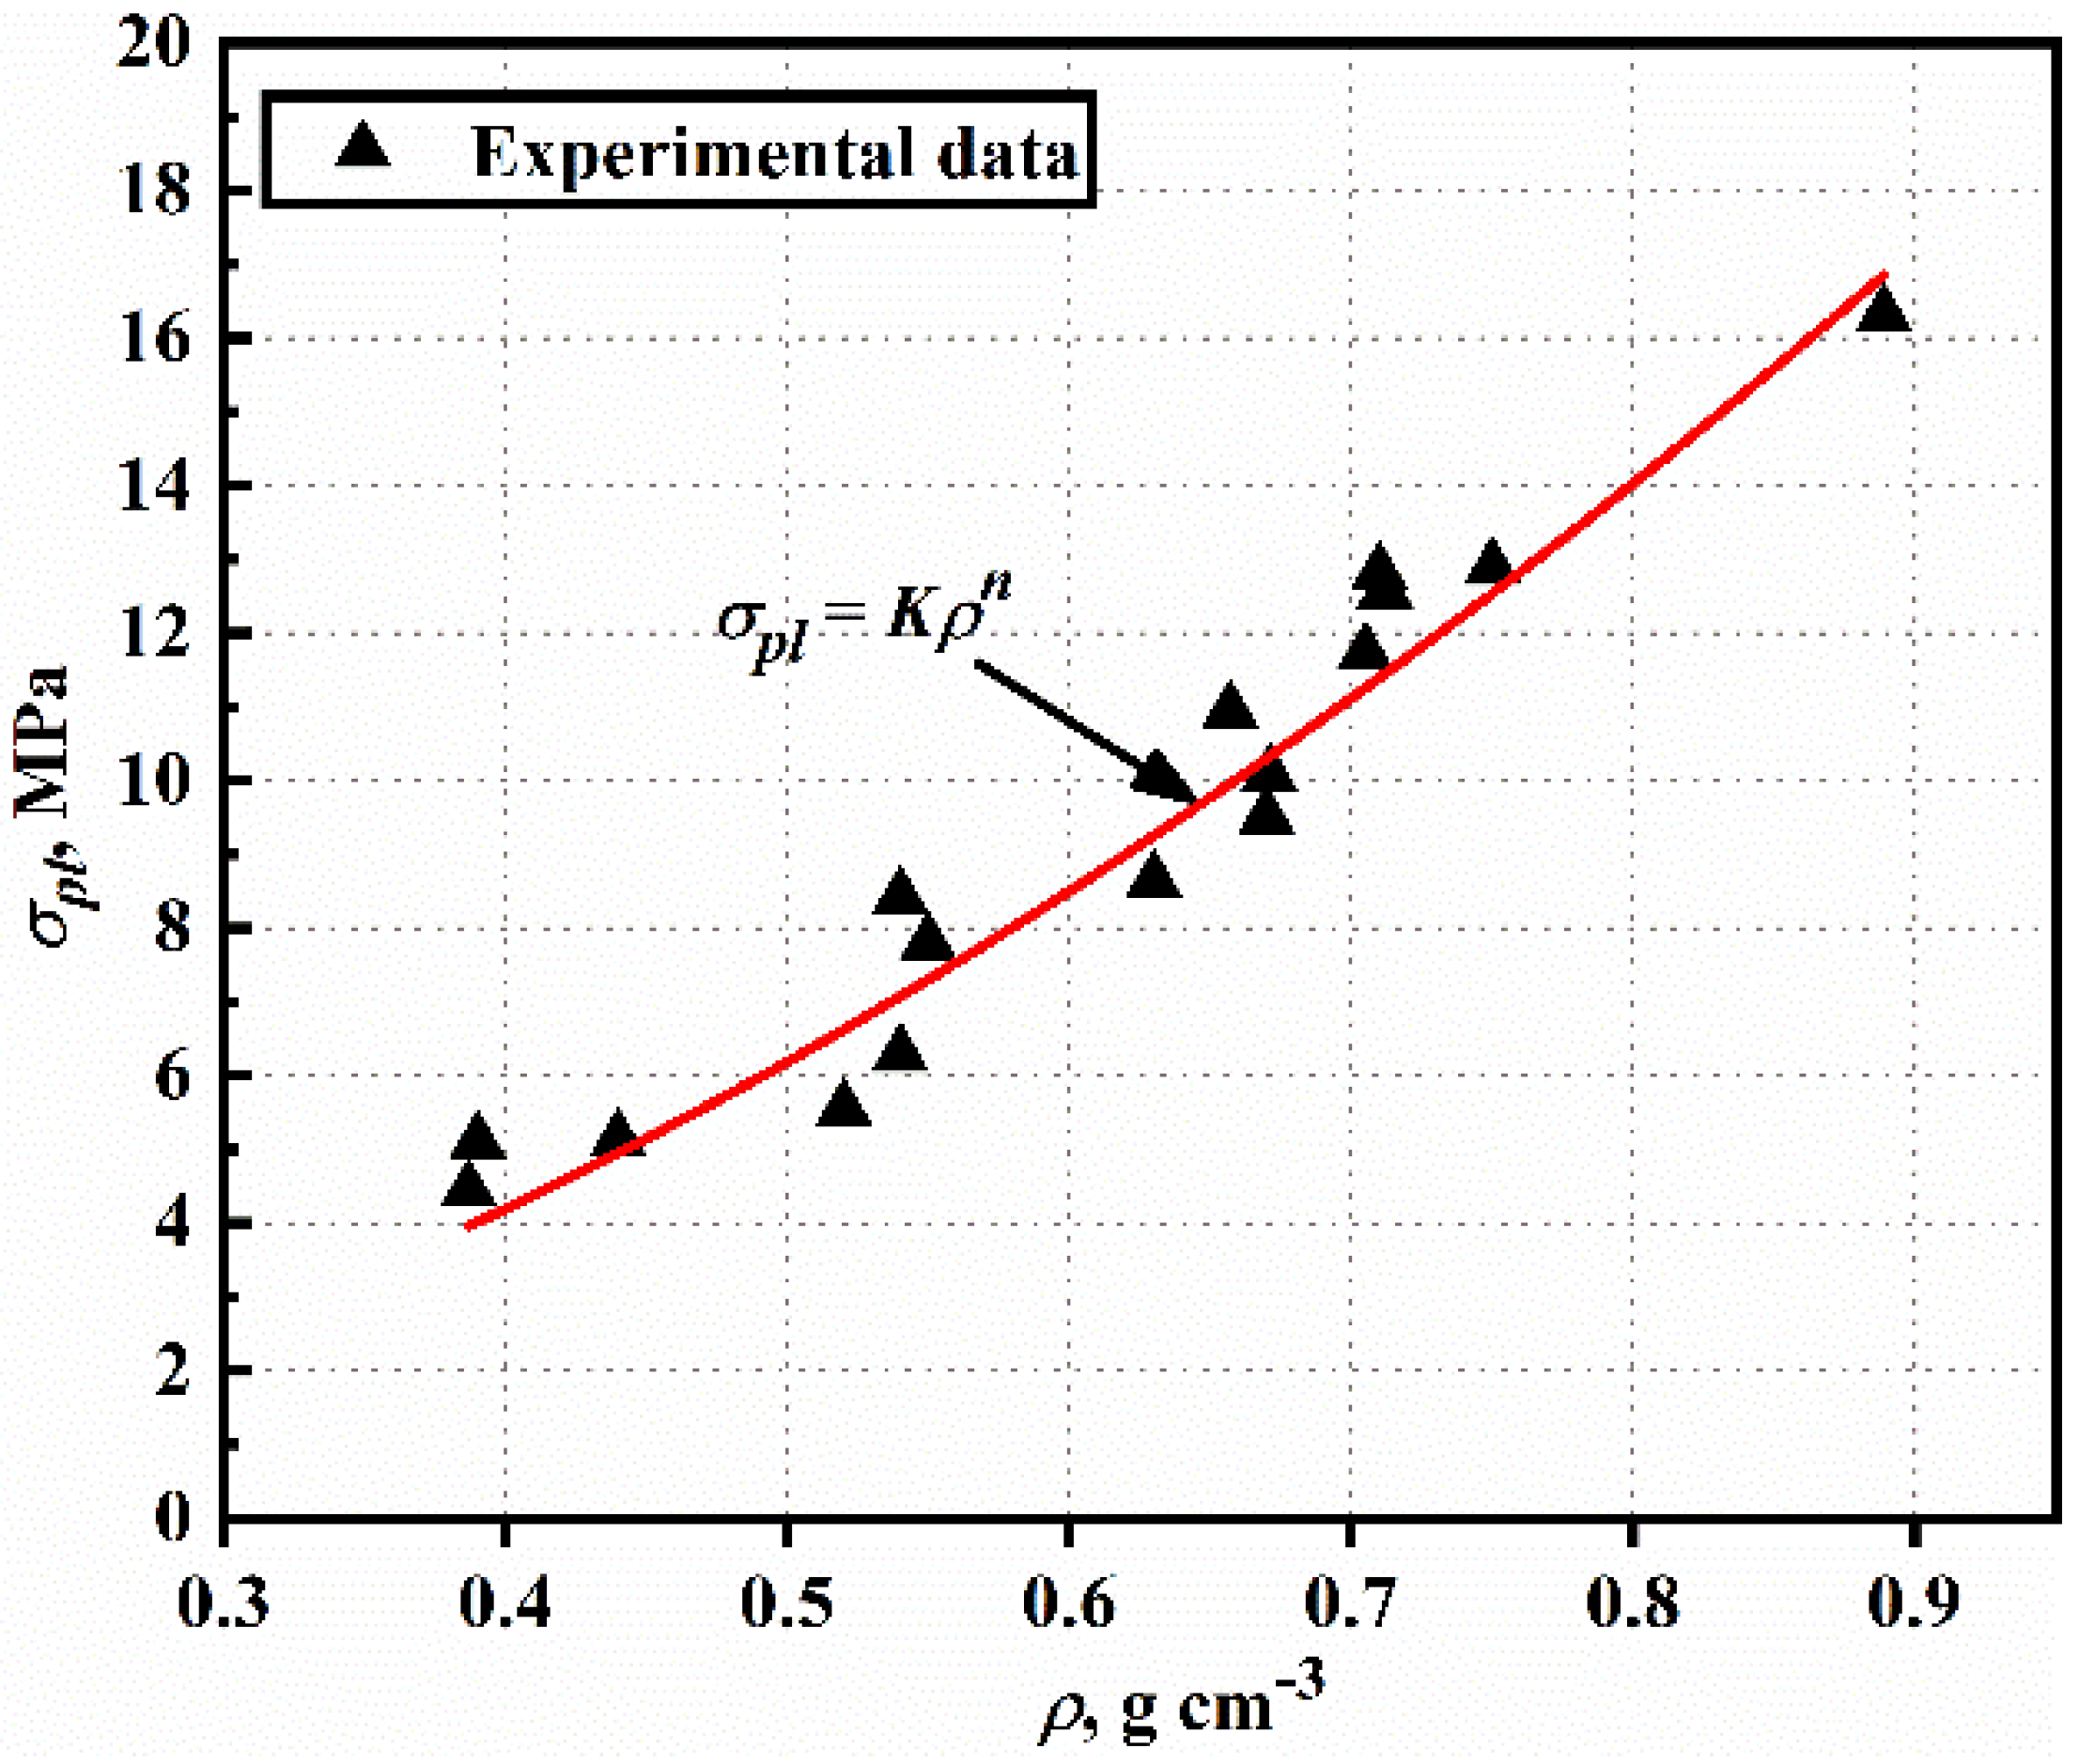
3.1. Aluminum Foams

Figure 3 shows the compression nominal stress-strain curves of aluminum foams fabricated under three different pressures. It can be observed that the stress-strain curve of aluminum foam follows the typical trend for metallic foams, exhibiting three stages: (I) linear elastic deformation stage; (II) plastic collapse stage; (III) densification stage. In addition, plateau stress increases and densification strain decreases as the foaming pressure increases, which can be seen in Figure 3.
Figure 4 shows the relationship between the density of aluminum foams and plateau stress (σpl) values. The σpl is determined in the plateau region of the stress-strain curve and listed in Table 1. The σpl is fit with the following equation as shown in Figure 4 [19]:
σpl = Kρn
where K and n are constants and the values are ~20.69 (MPa) and ~1.74, respectively. ρ is the density of the aluminum foam.

3.2. Foams-Filled Tubes

The compression load-displacement curves and corresponding photographs of the compressed empty tube and foam-filled tube are presented in Figure 5. It is obvious that the load value of the foamed-filled tube is higher than the empty tube and aluminum foam. The compression curve of the foam-filled tube divided into the elastic, plateau, and densification stages is similar to those of the foam alone. The linear elastic stage is followed by the initial peak load, which denotes the bearing capacity of the foam-filled tube. Thereafter, the plateau stage begins by the formation of folds, which leads to the fluctuating serrations of the load-displacement curve. Furthermore, friction stress is generated between the foam core and tube wall during the compressive progress, and the aluminum foam constrains the transverse displacement of the inward or outward folding of the tube. Therefore, the presence of the foam core results in an axisymmetric (concertina) mode (see the photographs of the crushed foam-filled tube in Figure 4) compared with the empty tube (diamond mode) [20].
The typical interaction effect is reflected in the load-displacement curve plotted in Figure 5. It can be clearly observed that the load value of the foam-filled tube shown in this figure is higher than the sum of the loads for the foam and empty tube. The emerging load gaps are representative of the interaction between the foam core and Al tube [21]. As a result, the load of the foam-filled tube includes three distinct parts: the load of the empty Al tube, the load of the aluminum foam, and the interaction. To estimate the influence of the foam core on the interaction, the interaction is quantified. In view of Equation (1), the following equation is used to quantity the average crushing load of foam-filled tubes,
P af = P ae + C P foam
where P af , P ae and P foam are the average crushing load of foam-filled tubes, average crushing load of empty tubes, and foam plateau load, respectively. The plateau load of the empty tube is 4.12 kN in this paper. The dimensionless constant C is considered to be the strengthening coefficient, which is directly concerned with the interaction.
Figure 6 shows the relationship between the strengthening load ( Δ P = P af P ae ) and P foam . It can be observed that Δ P increases when P foam increases, which is reflected by the linear relationship. The value of the strengthening coefficient appears to be 1.4, which is very close to the previously determined value for the metallic foam-filled Al tubes (1.8) [9,19]. Therefore, the average crushing load of aluminum foam-filled tubes can be predicted as:
P af = P ae + 1.4 P foam
From [12], it is known that the strengthening coefficient is related to the foam/empty tube load ratio. When the load of foams is relatively high as compared with the Al tubes, the foam core switches the deformation into axisymmetric (concertina) mode, and the strengthening coefficient is above one, but still lower than two. It is found that the present study is consistent with the results of [12]. The strengthening coefficient of the foam-filled tubes is 1.4, which is lower than two. Furthermore, from Table 1, it is known that all aluminum foams’ plateau load is much higher than the empty Al tube, changing the deformation mode from asymmetric (diamond) mode for an empty tube to axisymmetric (concertina) mode for a foam-filled tube (see Figure 5).
The effect of aluminum foams on the interaction is plotted in Figure 7. The result indicates that the interaction effect (shaded area) increases as the foaming pressure of aluminum foam increases. For Test No. 1, filled tube, there is no interaction within the elastic region because the crushing load of the foam-filled tube is simply the sum of the foam and empty tube. Additionally, there is no obvious interaction at the plateau region. For Test No. 5, filled tube, and Test No. 12, filled tube, the interaction occurs before the first peak load, which is earlier than Test No. 1.
The influence of the foam core on the interaction can be explained by the deformation mode, as shown in Figure 8. The deformation band of Test No. 1 is narrow and barely expands outward, which leads to no densification effect in the folds. In contrast, the deformation of the aluminum foam is close to the overall deformation, and the deformation band is seriously expanded when the cell structure is fined by the increased pressure foaming route (see Figure 8c for Test No. 12). Therefore, the outward folds are filled with the foam (shown in Figure 8 by the circle). This can result in the load transfer from the tube wall to the foam during compressive loading [22,23]. In addition, it can prevent the load drop triggered by the collapse of folds and improves the mechanical strength, which is in agreement with the shape of the compressive load-displacement curve showing a more progressive and stable buckling behavior (Figure 7c). Besides, the deformation band expansion of aluminum foam results in the increase of the interfacial area and friction between the foam core and tube wall, which significantly contributes to the increase of the suppression of inward intrusions.

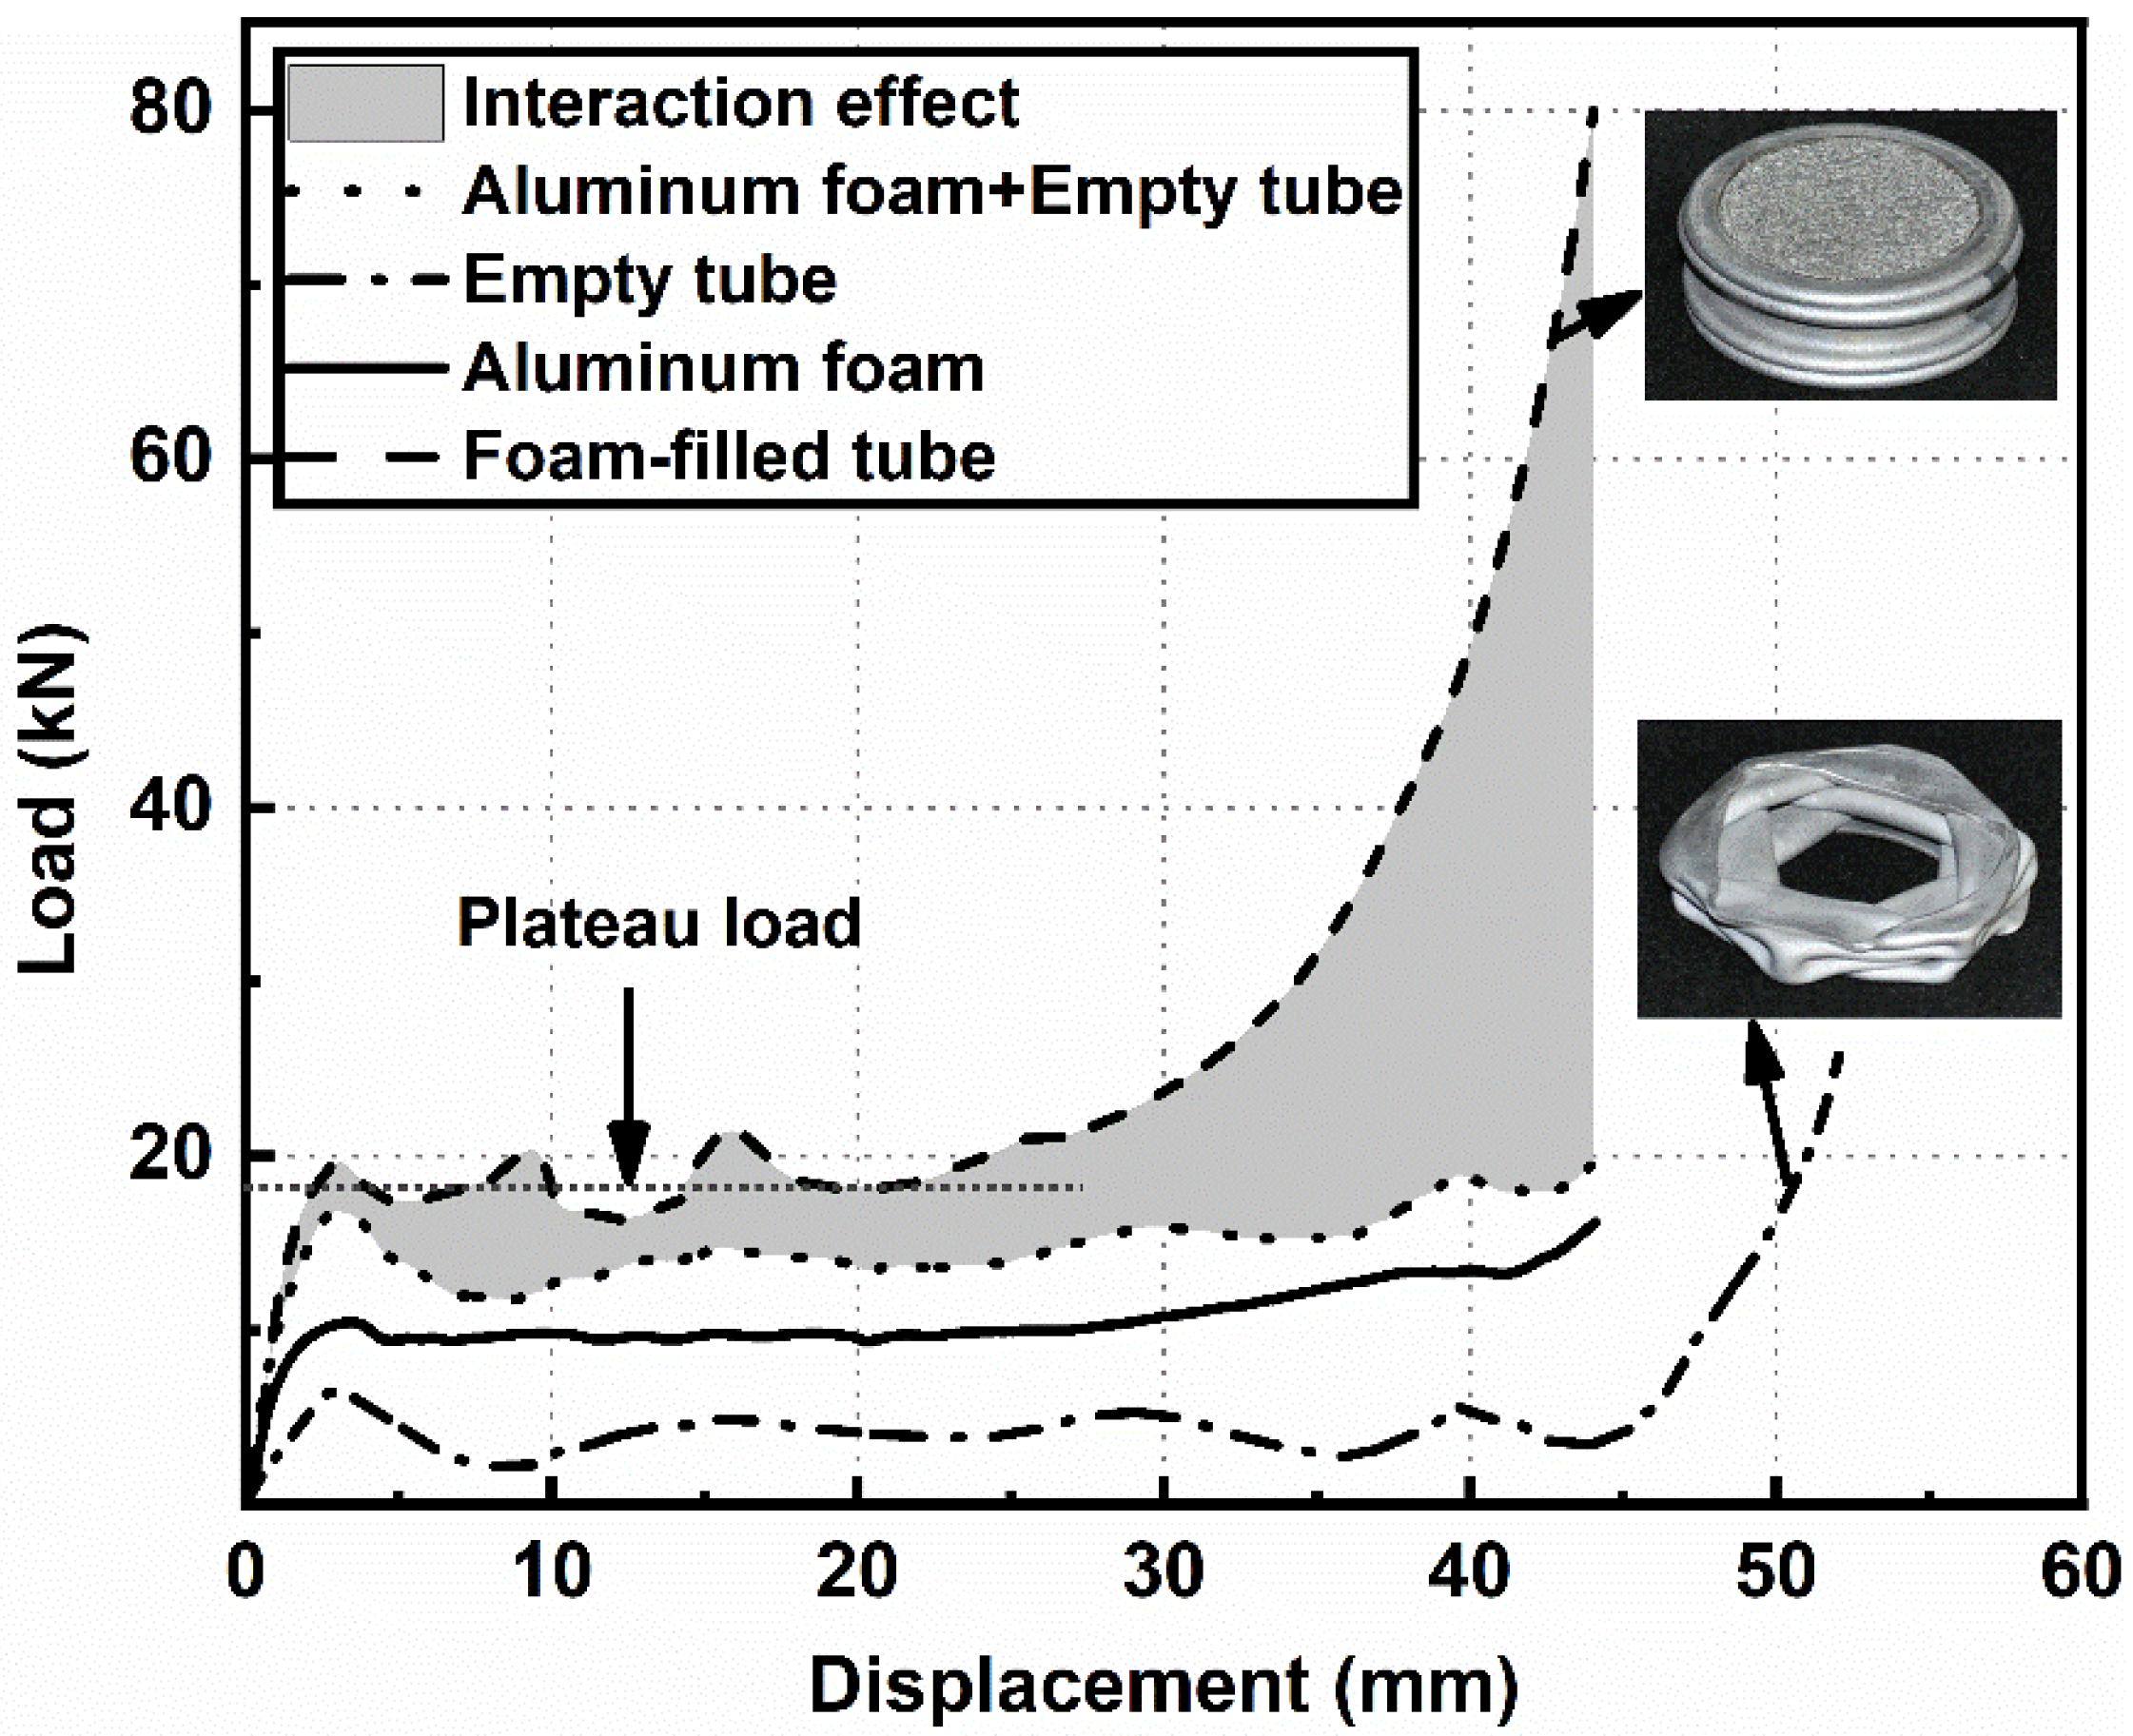
3.3. Energy Absorption of Foam-Filled Tubes

The graphs of energy absorption (E) and energy absorption efficiency (η) of foam-filled tubes is shown in Figure 9. E is identified as the area under the load-displacement curve up to that displacement. η is defined as [20]:
η ( d )   =   0 d P ( d ) d d P max ( d ) d
where P max ( d ) is the maximum load experienced up to the displacement d. It is noted that the E of the foam-filled tube increases with the foaming pressure increase. In addition, the η of the foam-filled tube can reach 81%, 83%, and 88% when the foaming pressure is 0.10 MPa, 0.21 MPa, and 0.30 MPa, respectively. The results confirm that the foam-filled tubes absorb more energy due to the increase of the interaction between the foam core and tube wall (see Figure 7) when the foaming pressure increases.
Figure 10 shows the correlation between the η of all foam-filled tubes and the ratio of the mean crushing loads. In the case of the foam-filled tube with a mean crushing load ratio of 3.0, the η reaches a maximum value of 90%. This value is higher than the commercial “Alporas” foams and foams prepared by powder compact route (both up to a maximum value of 80%) [18]. This can be explained based on the following equation:
P af = P ae + P foam + 0.4 P foam
Equation (7) is derived from Equation (5). The last term 0.4Pfoam indicates the interaction effect. It is known that the fluctuation of the displacement-load curve of the foam-filled tube is mainly caused by the fluctuation of the foam core and tube. When the mean crushing load ratio of 3.0 is obtained under 0.30 MPa, the fluctuation of the displacement-load curve (foam + empty tube) is equal to the value of the interaction (0.4Pfoam), which eliminates the fluctuation of displacement-load curve. This contributes to the displacement-load curve of the foam-filled tube being smoothed (as shown in Figure 7c) and η reaching the maximum value. Aluminum foams fabricated under different pressures give a new way for the energy absorption of foam-filled tubes in engineering fields.

4. Conclusions

The present study investigates the energy absorption of different cell structures for closed-cell aluminum foam-filled Al tubes through compression testing. Aluminum foams are fabricated under different pressures, which leads to the different cell sizes. X-ray tomography observations indicate that the deformation of the foam core is close to the overall deformation when the cell size is fined, as well as the deformation band of the foam core seriously expands. This deformation mode of the foam core contributes to the increase of the interaction effect with the decrease of the cell size, leading to the increase of the energy absorption of the foam-filled tubes with the increase of the foaming pressure. The energy absorption efficiency of foam-filled tubes reaches the maximum value of 90% when the fluctuation of the displacement-load curve (foam + empty tube) is eliminated because of the interaction. In short, the aluminum foams fabricated by the increased pressure foaming route are an appropriate core material to improve the engineering applications of foam-filled tubes for energy absorption.

Author Contributions

Conceptualization, Z.C.; writing, original draft preparation, writing, review and editing, validation, formal analysis, and investigation, Y.Y. and Z.C.; methodology and software, G.T. and Y.M. All authors read and agreed to the published version of the manuscript.

Funding

This work was financially supported by the State Administration of Science. Technology and Industry for National Defense Project JCKY2018110C051.

Acknowledgments

The authors gratefully acknowledge the State Administration of Science. Technology and Industry for National Defense for financial support.

Conflicts of Interest

The authors declare no conflict of interest.

References

  1. Wierzbicki, T.; Abramowicz, W. On the Crushing Mechanics of Thin-Walled Structures. J. Appl. Mech. Trans. ASME 1983, 50, 727. [Google Scholar] [CrossRef]
  2. Chen, W.G.; Wierzbicki, T. Relative merits of single-cell, multi-cell and foam-filled thin-walled structures in energy absorption. Thin-Walled Struct. 2001, 39, 287. [Google Scholar] [CrossRef]
  3. Yan, W.Y.; Durif, E.; Yamada, Y.; Wen, C. Crushing Simulation of Foam-Filled Aluminium Tubes. Mater. Trans. 2007, 48, 1901. [Google Scholar] [CrossRef] [Green Version]
  4. Banhart, J. Manufacture, characterisation and application of cellular metals and metal foams. Prog. Mater. Sci. 2001, 46, 559. [Google Scholar] [CrossRef]
  5. Marx, J.; Rabiei, A. Overview of Composite Metal Foams and Their Properties and Performance. Adv. Eng. Mater. 2017, 19, 1600776. [Google Scholar] [CrossRef]
  6. Miyoshi, T.; Itoh, M.; Akiyama, S.; Kitahara, A. ALPORAS Aluminum Foam: Production Process, Properties, and Applications. Adv. Eng. Mater. 2000, 2, 179. [Google Scholar] [CrossRef]
  7. Huang, W.Z.; Luo, H.J.; Mu, Y.L.; Xu, J.R.; Zhao, A.C. Dynamic Compressive Property of Closed-Cell Mg Alloy Composite Foams Reinforced with SiC Particles. Acta Metall. Sin. Engl. Lett. 2019, 32, 1320. [Google Scholar] [CrossRef] [Green Version]
  8. Zeng, W.W.; Hou, S.H.; Ding, X.J.; Duan, D.L.; Li, S.; Zhang, S.H. Synthesis and Compression Property of Oxidation-Resistant Ni–Al Foams. Acta Metall. Sin. Engl. Lett. 2017, 30, 965. [Google Scholar] [CrossRef] [Green Version]
  9. Santosa, S.P.; Wierzbicki, T.; Hanssen, A.G.; Langseth, M. Experimental and Numerical Studies of Foam-Filled Sections. Int. J. Impact Eng. 2000, 24, 509. [Google Scholar] [CrossRef]
  10. Hanssen, A.G.; Langseth, M.; Hopperstad, O.S. Static and dynamic crushing of circular aluminium extrusions with aluminium foam filler. Int. J. Impact Eng. 2000, 24, 475–507. [Google Scholar] [CrossRef]
  11. Hanssen, A.G.; Langseth, M.; Hopperstad, O.S. Static and dynamic crushing of square aluminium extrusions with aluminium foam filler. Int. J. Impact Eng. 2000, 24, 347–383. [Google Scholar] [CrossRef]
  12. Toksoy, A.K.; Güden, M. The strengthening effect of polystyrene foam filling in aluminum thin-walled cylindrical tubes. Thin-Walled Struct. 2005, 43, 333. [Google Scholar] [CrossRef] [Green Version]
  13. Yasuo, Y.; Takumi, B.; Zhenkai, X.; Cui’e, W. Energy Absorption and Crushing Behaviour of Foam-Filled Aluminum Tubes. Mater. Trans. 2005, 46, 2633. [Google Scholar]
  14. Yang, X.D.; An, T.; Wu, Z.Q.; Zou, T.C.; Song, H.P.; Sha, J.W.; He, C.N.; Zhao, N.Q. The effect of outer tube on quasi-static compression behavior of aluminum foam-filled tubes. Compos. Struct. 2020, 245, 112357. [Google Scholar] [CrossRef]
  15. Niknejad, A.; Abedi, M.M.; Liaghat, G.H.; Nejad, M.Z. Absorbed energy by foam-filled quadrangle tubes during the crushing process by considering the interaction effects. Arch. Civ. Mech. Eng. 2015, 15, 376. [Google Scholar] [CrossRef]
  16. Mantena, P.R.; Mann, R. Impact and dynamic response of high-density structural foams used as filler inside circular steel tube. Compos. Struct. 2003, 61, 291. [Google Scholar] [CrossRef]
  17. Cao, Z.K.; Li, M.; Yu, Y.; Luo, H.J. Fabrication of Aluminum Foams with Fine Cell Structure under Increased Pressure. Adv. Eng. Mater. 2016, 18, 1022. [Google Scholar] [CrossRef]
  18. Mukherjee, M.; Ramamurty, U.; Garcia-Moreno, F.; Banhart, J. The effect of cooling rate on the structure and properties of closed-cell aluminum foams. Acta Mater. 2010, 58, 5031. [Google Scholar] [CrossRef]
  19. Kavi, H.; Toksoy, A.K.; Guden, M. Predicting energy absorption in a foam-filled thin-walled aluminum tube based on experimentally determined strengthening coefficient. Mater. Des. 2006, 27, 263. [Google Scholar] [CrossRef] [Green Version]
  20. Duarte, I.; Vesenjak, M.; Krstulovic’-Opara, L.; Ren, Z. Static and dynamic axial crush performance of in-situ foam-filled tubes. Compos. Struct. 2015, 124, 128. [Google Scholar] [CrossRef]
  21. Taherishargh, M.; Vesenjak, M.; Belova, I.V.; Krstulović-Opara, L. In situ manufacturing and mechanical properties of syntactic foam filled tubes. Mater. Des. 2016, 99, 356. [Google Scholar] [CrossRef]
  22. Mingzhe, L.; Junfeng, L.; Saeed, B.; Ridha, B.; Weiyi, L. Enhanced filler-tube wall interaction in liquid nanofoam-filled thin-walled tubes. Compos. Struct. 2018, 200, 120. [Google Scholar]
  23. Duarte, I.; Vesenjak, M.; Krstulović-Opara, L.; Ren, Z. Compressive performance evaluation of APM (Advanced Pore Morphology) foam filled tubes. Compos. Struct. 2015, 134, 409. [Google Scholar] [CrossRef]
Figure 1. Equipment for the fabrication of aluminum foam under increased pressure: 1—stirring stand; 2—speed controller; 3—resistance furnace; 4—stainless steel tube; 5—graphite blade; 6—stainless steel crucible; 7—pressure control system.
Metals 10 01579 g001
Figure 2. Al tubes filled with different cell sizes of aluminum foams Test No. 1 (a), Test No. 5 (b), and Test No. 12 (c).
Metals 10 01579 g002
Figure 3. Typical compression stress-strain curves of aluminum foams.
Metals 10 01579 g003
Figure 4. The relationship between density and plateau stress.
Metals 10 01579 g004
Figure 5. Illustration of the interaction effect in the foam-filled (0.54 g/cm3) tube; the dotted line shows the average crushing loads.
Metals 10 01579 g005
Figure 6. The strengthening load versus foam plateau load of aluminum foams.
Metals 10 01579 g006
Figure 7. Foams fabricated under different pressures on the effect of interaction Test No. 1 (a), Test No. 5 (b), and Test No. 12 (c).
Metals 10 01579 g007
Figure 8. The deformation cross-sections of compressed foams and foam-filled tubes before the second fold is completed (20% displacement) Test No. 1 (a), Test No. 5 (b), Test No. 12 (c), Test No. 1, filled tube (d), Test No. 5, filled tube (e), Test No. 12, filled tube (f).
Metals 10 01579 g008
Figure 9. Graphs of the E-displacement and η-displacement curves of three kinds of foam-filled tubes.
Metals 10 01579 g009
Figure 10. The correlation between the η of all foam-filled tubes and the ratio of mean crushing loads.
Metals 10 01579 g010
Table 1. The parameters of aluminum foams.
Test NoDensity (g⋅cm−3)Mean Pore Size (mm)Pressure (MPa)Plateau Stress (MPa)
1#0.393.030.105.10
2#0.393.040.104.44
3#0.442.890.165.13
4#0.521.940.205.54
5#0.541.910.188.42
6#0.541.930.216.28
7#0.551.900.227.80
8#0.631.650.308.64
19#0.661.670.3410.94
10#0.671.620.329.50
11#0.671.660.3010.07
12#0.710.990.3212.82
13#0.710.950.3011.72
14#0.710.940.3012.56
15#0.750.910.3612.88
16#0.890.820.4016.31
Publisher’s Note: MDPI stays neutral with regard to jurisdictional claims in published maps and institutional affiliations.

