Article

Corrosion Study of Selective Laser Melted IN718 Alloy upon Post Heat Treatment and Shot Peening

by
Opadhrishta Venkataramana Mythreyi
1,
Allavikutty Raja
1,
Bommanahalli Kenchappa Nagesha
2 and
Rengaswamy Jayaganthan
1,*
1
Department of Engineering Design, Indian Institute of Technology Madras, Chennai 600036, India
2
Gas Turbine Research Establishment Research and Development Organization, Bengaluru 560093, India
*
Author to whom correspondence should be addressed.
Metals 2020, 10(12), 1562; https://doi.org/10.3390/met10121562
Submission received: 21 October 2020 / Revised: 18 November 2020 / Accepted: 18 November 2020 / Published: 24 November 2020

Abstract

:
Selective laser melted (SLM) IN 718 alloy specimens are subjected to heat treatment and shot peening to assess the effect of post processing on the corrosion performance of the alloy in a 3.5 wt % NaCl solution. The four conditions used in this analysis are as-built material (AB), heat-treated as-built material (HT), shot-peened as-built material (SP), and heat-treated and shot-peened as-built material (HTSP). Microstructural studies revealed the presence of a 500 nm sized cellular structure with a γ matrix surrounded by the Laves phase in the AB material. Shot-peening reduced the surface roughness of the AB and HT samples to almost 80%. The potentiodynamic experiments revealed a highest Icorr value of 0.21 µA/cm2 for the AB material and the lowest Icorr value of 0.04 µA/cm2 for the HTSP material. In the Electrochemical Impedance Spectroscopy (EIS) analysis, the Nyquist plot substantiated the increasing corrosion resistance in the same order of decreasing corrosion rate. The Bode plot exhibited two resistance–capacitance (RC) time constants for all four conditions. The solution resistance measured around 30 Ω, with the HTSP specimen exhibiting the highest passive film resistance of 676 kΩ cm2 and the AB specimen exhibiting the lowest passive film resistance of 234 kΩ cm2. This study has shown that elimination of the network of the Laves phase in SLM material through heat treatment and smooth surface morphology achieved through shot peening improves the corrosion resistance of Inconel 718 alloy.

1. Introduction

Amongst the super alloys, Ni-based super alloy accounts for 50% of the weight of an aero-engine turbine, and it is also known as the workhorse of super alloys [1]. According to a study by Lv et al. [2], super alloys constitute 22% of failed materials, next to steel (42%), and corrosion accounts for 17% of failure mode next to fatigue (52%) in the aviation industry. In general, corrosion is defined as the electrochemical reaction constituting of two half-cell reactions: an anodic reaction releasing electrons and a cathodic reaction consuming electrons. The sum of the electrode potentials of these two reactions is called the Cell Potential (E), and the electrochemical reaction occurs spontaneously if E is positive [3]. This corroding nature of the electrochemical reaction usually occurs between the metal surface and ion-conducting environment. Most aircraft fly above oceans, and many airports are located close to the shore where the environment contains relatively high humidity. These atmospheric factors coupled with local material environment, chemicals used for cleaning, and non-destructive testing increases the chances of the material such as IN718 to degrade by corrosion [4,5]. Failure of the engine control system due to corrosion, which caused the crash of MiG 23 aircraft and wheel separation from the landing gear in the incident of Zenair CH-601HD, has emphasized the importance of corrosion in the aviation industry [6]. The corrosion of aircrafts is an important issue considering the safety, reliability, and structural integrity of the materials [7]. With the advent of additive manufacturing (AM), many of the aerospace components are manufactured through different AM methods such as SLM and electron beam melting (EBM). Hence, it is important to test the corrosion properties of any new material, new design, or products developed through new processes in addition to static and dynamic mechanical properties. Therefore, it is essential to study the corrosion properties of the IN718 alloys fabricated by Selective laser melted (SLM).
Ni-based super alloys are used in different parts of gas turbine engines, namely, discs, high-pressure compressor blades, and combustion chambers due to their ability to operate at high temperature (close to 80% of the melting point) as well as resist creep, corrosion, and oxidation [8]. The additive manufacturing of these parts offers advantages such as weight reduction, adaptability to complex design Blade integrated disk (BLISK), improved build-to-fly ratio, and the elimination of unwanted joints, which helps in reducing corrosion [9,10]. SLM is a powder bed fusion type of additive manufacturing method used to fabricate components for aerospace, racing, and bio-medical applications. The process parameters of the SLM process significantly influence the microstructure of the built material and subsequently affect the property of the material. The influence of SLM process parameters for the fabrication of IN 718 alloys has been extensively studied [11,12,13]. Trosch et al. [14] reported that the mechanical properties of the SLMed IN718 alloys, with a higher proportion of δ-particles, are better than the wrought and cast alloys. However, Kaynak and Tascioglu [15] observed a poorer surface finish on the surfaces of the as-built IN718 alloy due to partially melted powders, pores, and cavities. Kong et al. [16] elucidated that these defects can influence the corrosion resistance of the as-built materials and suggested that heat-treatment and surface treatment methods can improve the corrosion resistance of metallic materials fabricated by SLM. Turker et al. [17] observed a more uniform microstructure after heat treatment, which alleviated the microstructural variations in the as-built IN718 alloy and also resulted in better mechanical properties. Wang et al. [18] observed that the regular dendritic structure in the as-built material disappeared, and needle-like δ particles appeared with the dissolution of γ′ and γ′′ in the γ matrix after heat treatment. The room temperature tensile strength and ductility after heat treatment were found to be comparable to the wrought IN718 alloy. The BLISK manufactured by SLM was also reported to exhibit comparable mechanical properties with forged parts after appropriate heat treatment [19]. Apart from heat treatments, surface treatments such as laser peening and mechanical hammering are reported to improve the mechanical properties of the SLM materials [20,21,22,23,24]. Electrochemical polishing was found to be beneficial for improving the corrosion resistance due to the formation of a strong passivation layer over the surface of alloy. Many researchers have analyzed the effect of shot peening on the additively manufactured metallic alloys. Mostafa et al. [25] have performed surface roughness studies on additively manufactured AlSi10Mg alloy and observed peak removal and surface crack elimination due to shot-peening treatment. Sugavaneswaran et al. [26] studied the changes introduced by shot peening on AM fabricated stainless steel alloy (316L). A significant improvement in the surface quality and hardness of the alloy was observed in their work. Among different surface finishing treatments, shot peening is independent of geometry, symmetry, or size and hence adapted for the finishing of additively manufactured products [27,28]. Although the effect of post-heat treatments and surface treatment on the mechanical properties on the as-built SLM IN718 alloy have been studied extensively, corrosion properties have not been explored yet. There are extensive reviews on the corrosion of additively manufactured metals and alloys, namely stainless steel, Ti6Al4V, and Al-Si alloys after SLM [16,29]. However, study of the combined effect of surface modification and heat treatment on IN718 alloy after SLM has been scarcely reported [30].
IN 718 alloy is generally known for its passive film formation, but it is prone to pitting corrosion [31]. Chen et al. [32] studied the influence of corrosive environment for this alloy, and it exhibited passive behavior at room temperature, 50 °C and 80 °C in 3.5 wt % NaCl solution. However, the material exhibited active corrosion at 21 wt % NaCl solution. Dempster et al. [33] reported that there is no change in the corrosion resistance of the IN718 alloy in 3.5 wt % NaCl solution with respect to different heat treatments. Osaba et al. [34] compared the passive film behavior of two Ni-based superalloys, namely, Haynes 282 and IN718 alloy, in which the former exhibited more stable and less defective passive film in a Cl-containing environment. Caliari et al. [35] observed that after the heat treatment of forged IN718 alloy, the pitting corrosion currents reduced six times from ≈0.15 mA to ≈0.025 mA. Thus, contradictions exist in the literature pertaining to the nature of corrosion resistance after the heat treatment of conventionally manufactured IN718 alloy. Although the corrosion resistance of SLM material was reported to be inferior to the conventionally manufactured material [36,37], inconsistencies in corrosion behavior before and after heat treatment have been observed in the recent literature. Landeta [38] reported that the heat treatment of SLM IN 718 alloy decreased the corrosion rate of the material in an electrolyte containing a mixture of 0.1M HCl and 1M NaCl. On the other hand, Luo et al. [36] reported that heat treatment improved the corrosion resistance of SLMed IN718 alloy. In addition, Li et al. [39] have reported that increasing the solution treatment temperature of the heat treatment from 950 to 1050 °C decreases the corrosion resistance. At higher temperature, dissolution leads to the availability of only a few δ-particles (small anodes) to the precipitate less grain boundaries (large anodes), whereas at 950 °C, precipitates were uniformly distributed at grain boundaries, leading to electrochemical homogeneity. The influence of surface finishing methods on the corrosion behavior of SLMed IN718 alloy has been seldom reported. In order to understand the effect of heat treatment and surface treatment on the corrosion behavior, the present work is focused on studying the influence of heat treatment and/or shot peening on the microstructure, surface roughness, and corrosion behavior of SLMed IN718 alloy.

2. Materials and Methods

The gas atomized IN718 powder was used for the SLM process. Rectangular blocks with 15 mm (X) × 5 mm (Y) × 15 mm (Z) were fabricated using an EOS M280 DMLS machine. The composition of the SLM IN718 alloy obtained is presented in the Table 1.
The INCONEL 718 specimens were printed vertically in small rectangular blocks of size 15 mm × 5 mm × 15 mm in an EOS M280 DMLS machine. The DMLS printer was equipped with a 200 W YB optical fiber laser with a beam diameter of 100 µm. Using a layer thickness of 20 µm and a scanning speed of 7 m/s, the blocks were printed with the 5 mm side as the base side. The printing chamber was enclosed in an Argon atmosphere in order to prevent reactions between IN718 powder and the atmosphere. An illustration of the beam interaction with the powder can be found in Figure 1. As it can be seen from the illustration, the powder supply to the printing region is enabled by the upward movement of the powder delivery system. When the requisite amount of powder is available, the re-coater blade spreads the metallic powder on the build platform. In the equipment utilized for the current experiments, the re-coater blade moved at a speed of 50 mm/s. The laser beam moves along the programmed path in order to melt the powder in the designed contour. After the current layer is completed, the next layer is spread again, and this procedure repeats until the object is printed completely [40]. After the printing procedure was completed, the build plate was removed, and the blocks were cut from the plate using a wire cut electro-discharging machine. Thus, the separated specimens were divided into four categories. The first category of specimens (as-built material, AB) was left intact without any form of post processing. The next category of specimens (heat treated on as-built material, HT) was heat treated at a temperature of 980 °C in a furnace for a duration of 15 min. It was air quenched to 100 °C and then further allowed to cool to ambient temperature. The third category of specimens (shot-peened on as-built material, SP) was subjected to shot peening using the mixture of alumina and silica spherical balls (300 µm) for 5 min on each side using a velocity of 70 m/s. The specimens were mounted in a rotating table exposed to the beads on all sides consecutively, with an angle of impingement between 45° and 60°, using a pressure range between 0.55 and 0.68 MPa. The Almen strip of “N” Type, with an intensity factor of 6N and coverage of 200%, has been utilized for the shot peening process. It produced a deflection of 0.15 mm in the stainless Almen strip positioned in one of the dummy samples. The fourth category of specimens were post processed using both heat treatment and shot peening (in that order) and designated as HTSP. These are the four conditions considered for corrosion testing in the present work.
Then, the SLM samples in four different conditions were subjected to electrochemical tests using Gamry reference 600+ Potentiostat/Galvanostat/ZRA equipment according to the standard ASTM G-59 (Standard Test Method for Conducting Potentiodynamic polarization Resistance Measurements). The experimental setup contained the three electrode setups—namely, the reference electrode, counter electrode, and working electrode. The reference electrode was a calomel electrode saturated in KCl (SCE), and the counter electrode was the platinum wire. The reference electrode was used to disturb the equilibrium between the working electrode and platinum electrode in order to vary the potential during the experiment [41]. The working electrodes were the SLM specimens with an exposure area of 0.785 cm2, and the electrolyte used for the experiments was 350 mL of 3.5 wt % NaCl solution. The experiments were performed on the XZ plane of the samples. Initially, the sample’s testing surface was in contact with the electrolyte for an hour to estimate the sample’s open circuit potential (OCP). Then, potentiodynamic polarization experiments were performed from the potential of −300 mV to 900 mV at a scanning rate of 0.1667 mV/s. The electrochemical impedance spectroscopy experiments were conducted at OCP in a range of testing frequencies from 100 kHz to 10 mHz with an AC amplitude of 10 mV. The impedance values obtained from the EIS experiments were fitted using GAMRY ECHEM ANALYST V 7.06. In order to obtain reliable data, the experiments were repeated on three different samples with similar surface and initial microstructural conditions.
The surface roughness measurement was performed using a BRUKER Non-contact Surface Profilometer. The measurements were made in three different locations on the XZ plane, and the average of the three were considered as the representative value. The mesostructures and microstructure of the samples were characterized optically using a Carl Zeiss optical microscope (Zeiss, Jena, Germany) and APREO Scanning Electron Microscope (Thermofischer, Waltham, MA, USA) fitted with Energy-Dispersive Spectroscopy (EDS). For characterization using OM and SEM/EDS, the sample surfaces were ground using SiC sheets in the order of grit sizes: 320, 800, 1200, and 2000. Subsequently, the samples were polished using 3 µm and 1 µm size diamond particles. After diamond polishing, the samples were etched using Kallings reagent (5 mL of CuCl2 + 100 mL of hydrochloric acid and 100 mL of ethanol) to observe the microstructural features. A Bruker D8 Discover AXS Powder X-ray diffractometer (Bruker, Billerica, MA, USA) was used for phase identification in the SLM alloy in the four conditions, namely, AB, SP, HT, and HTSP. Analysis of diffraction peaks was accomplished using X’pert Highscore Plus 3.0 software licensed for usage from Malvern Pananalytical, Netherlands.

3. Results and Discussion

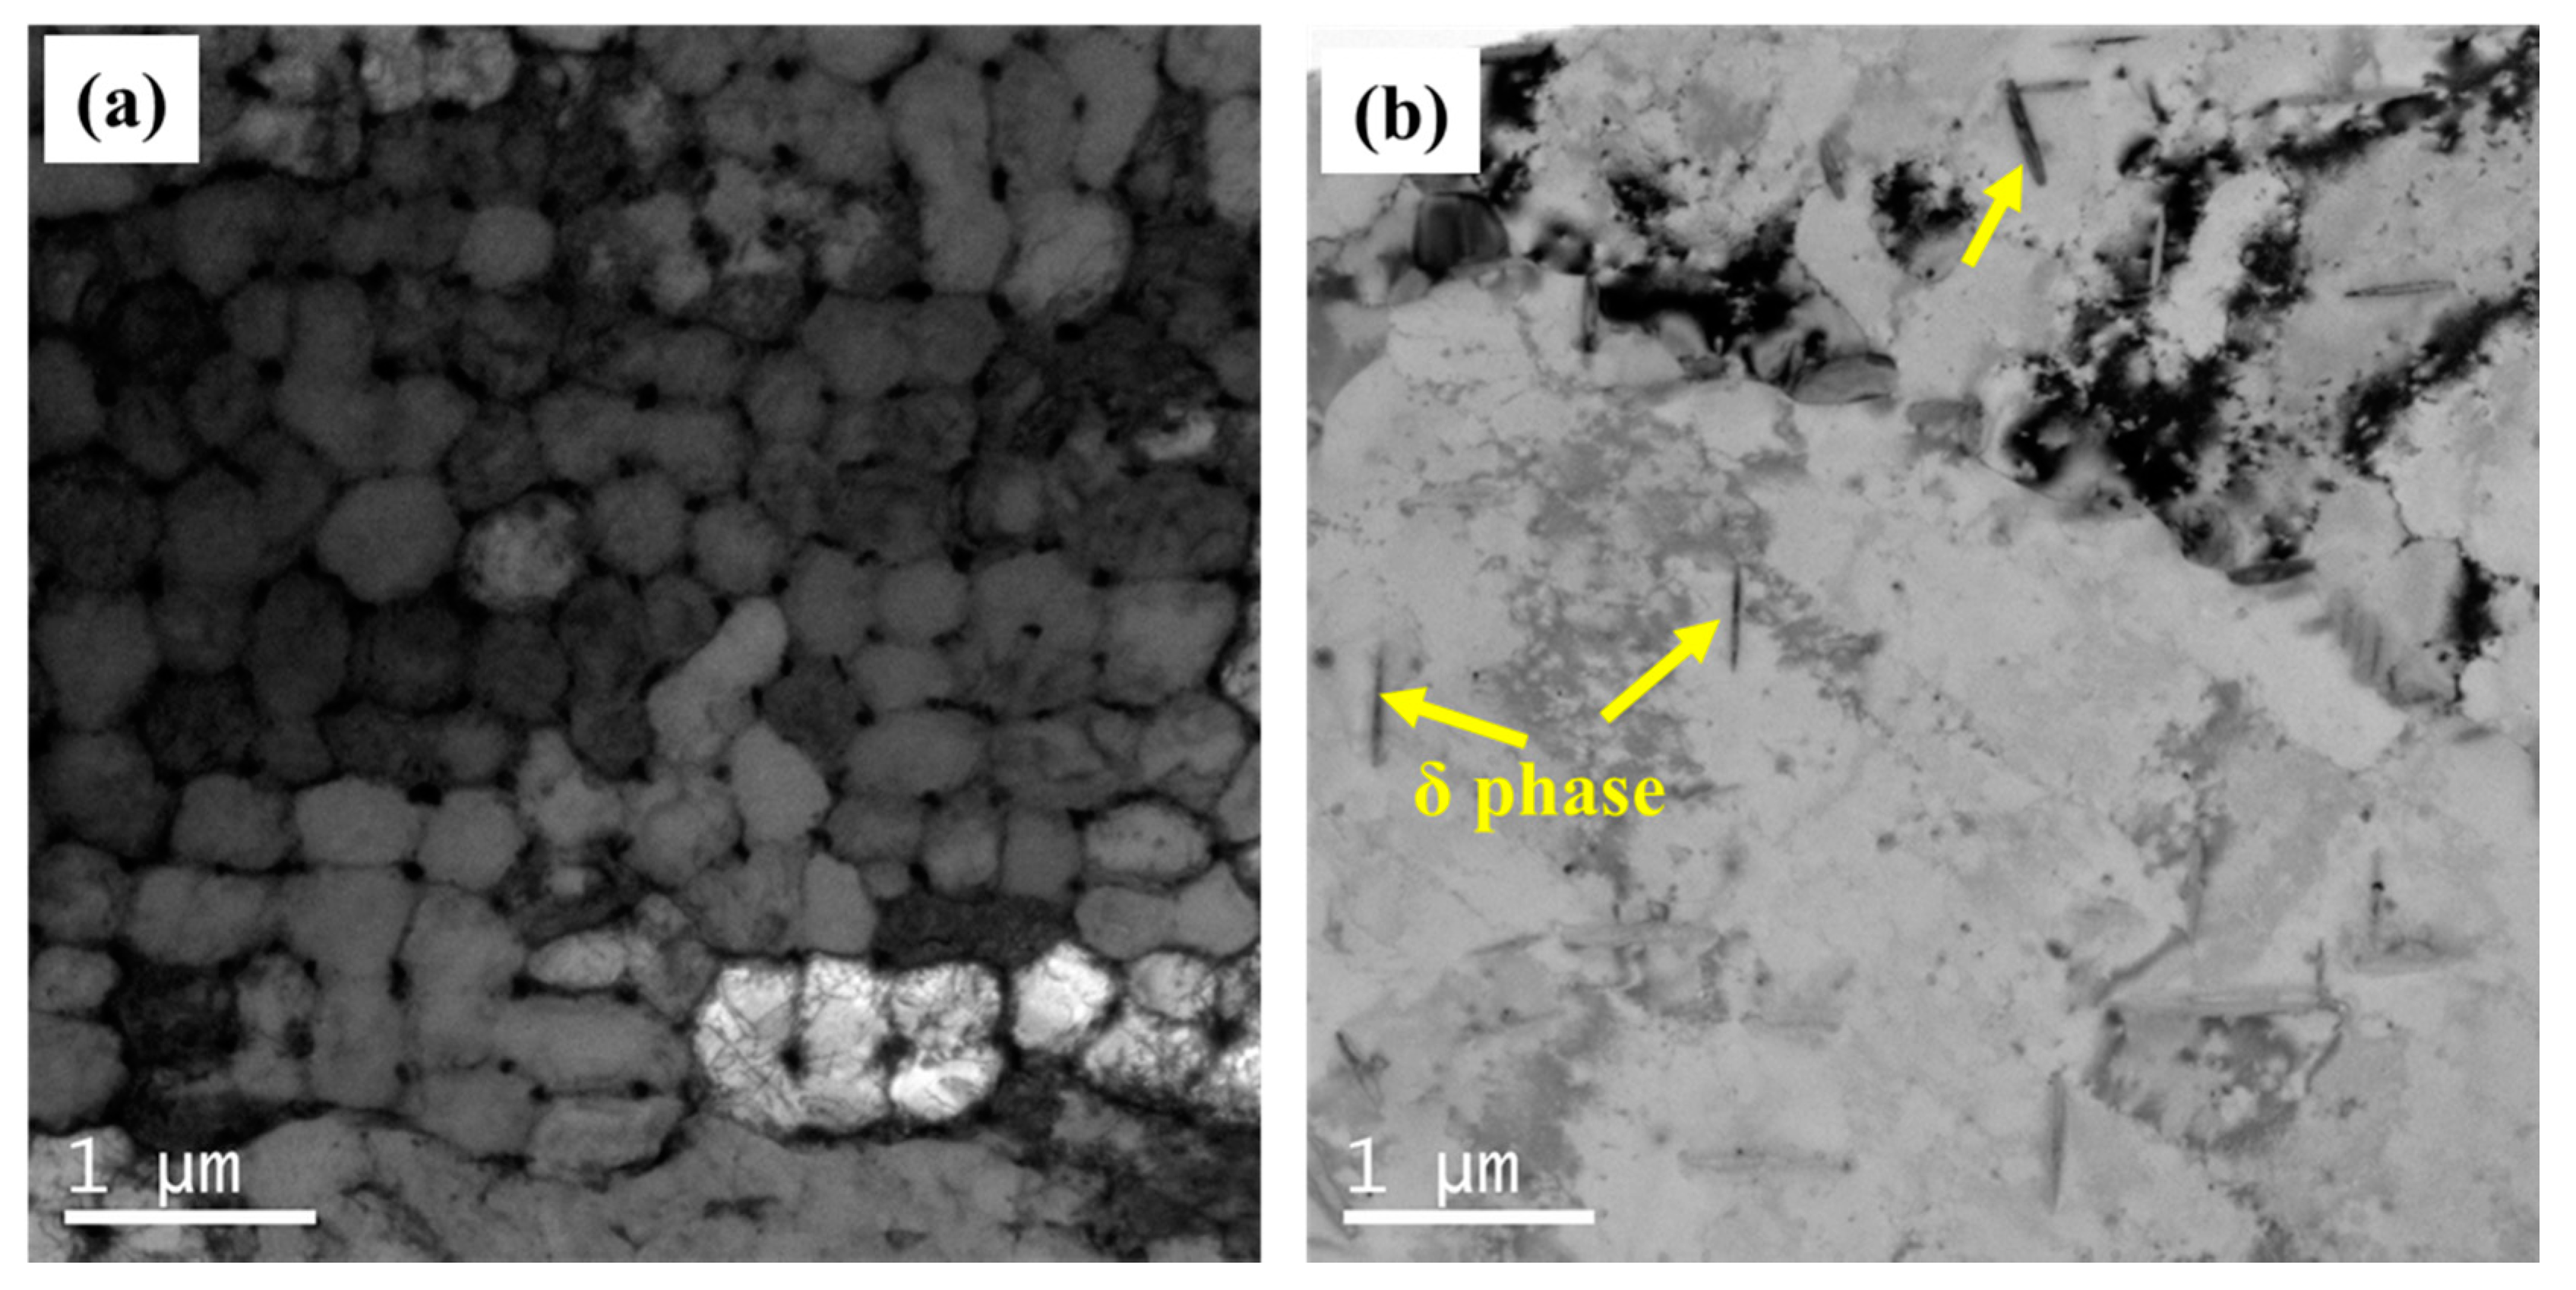
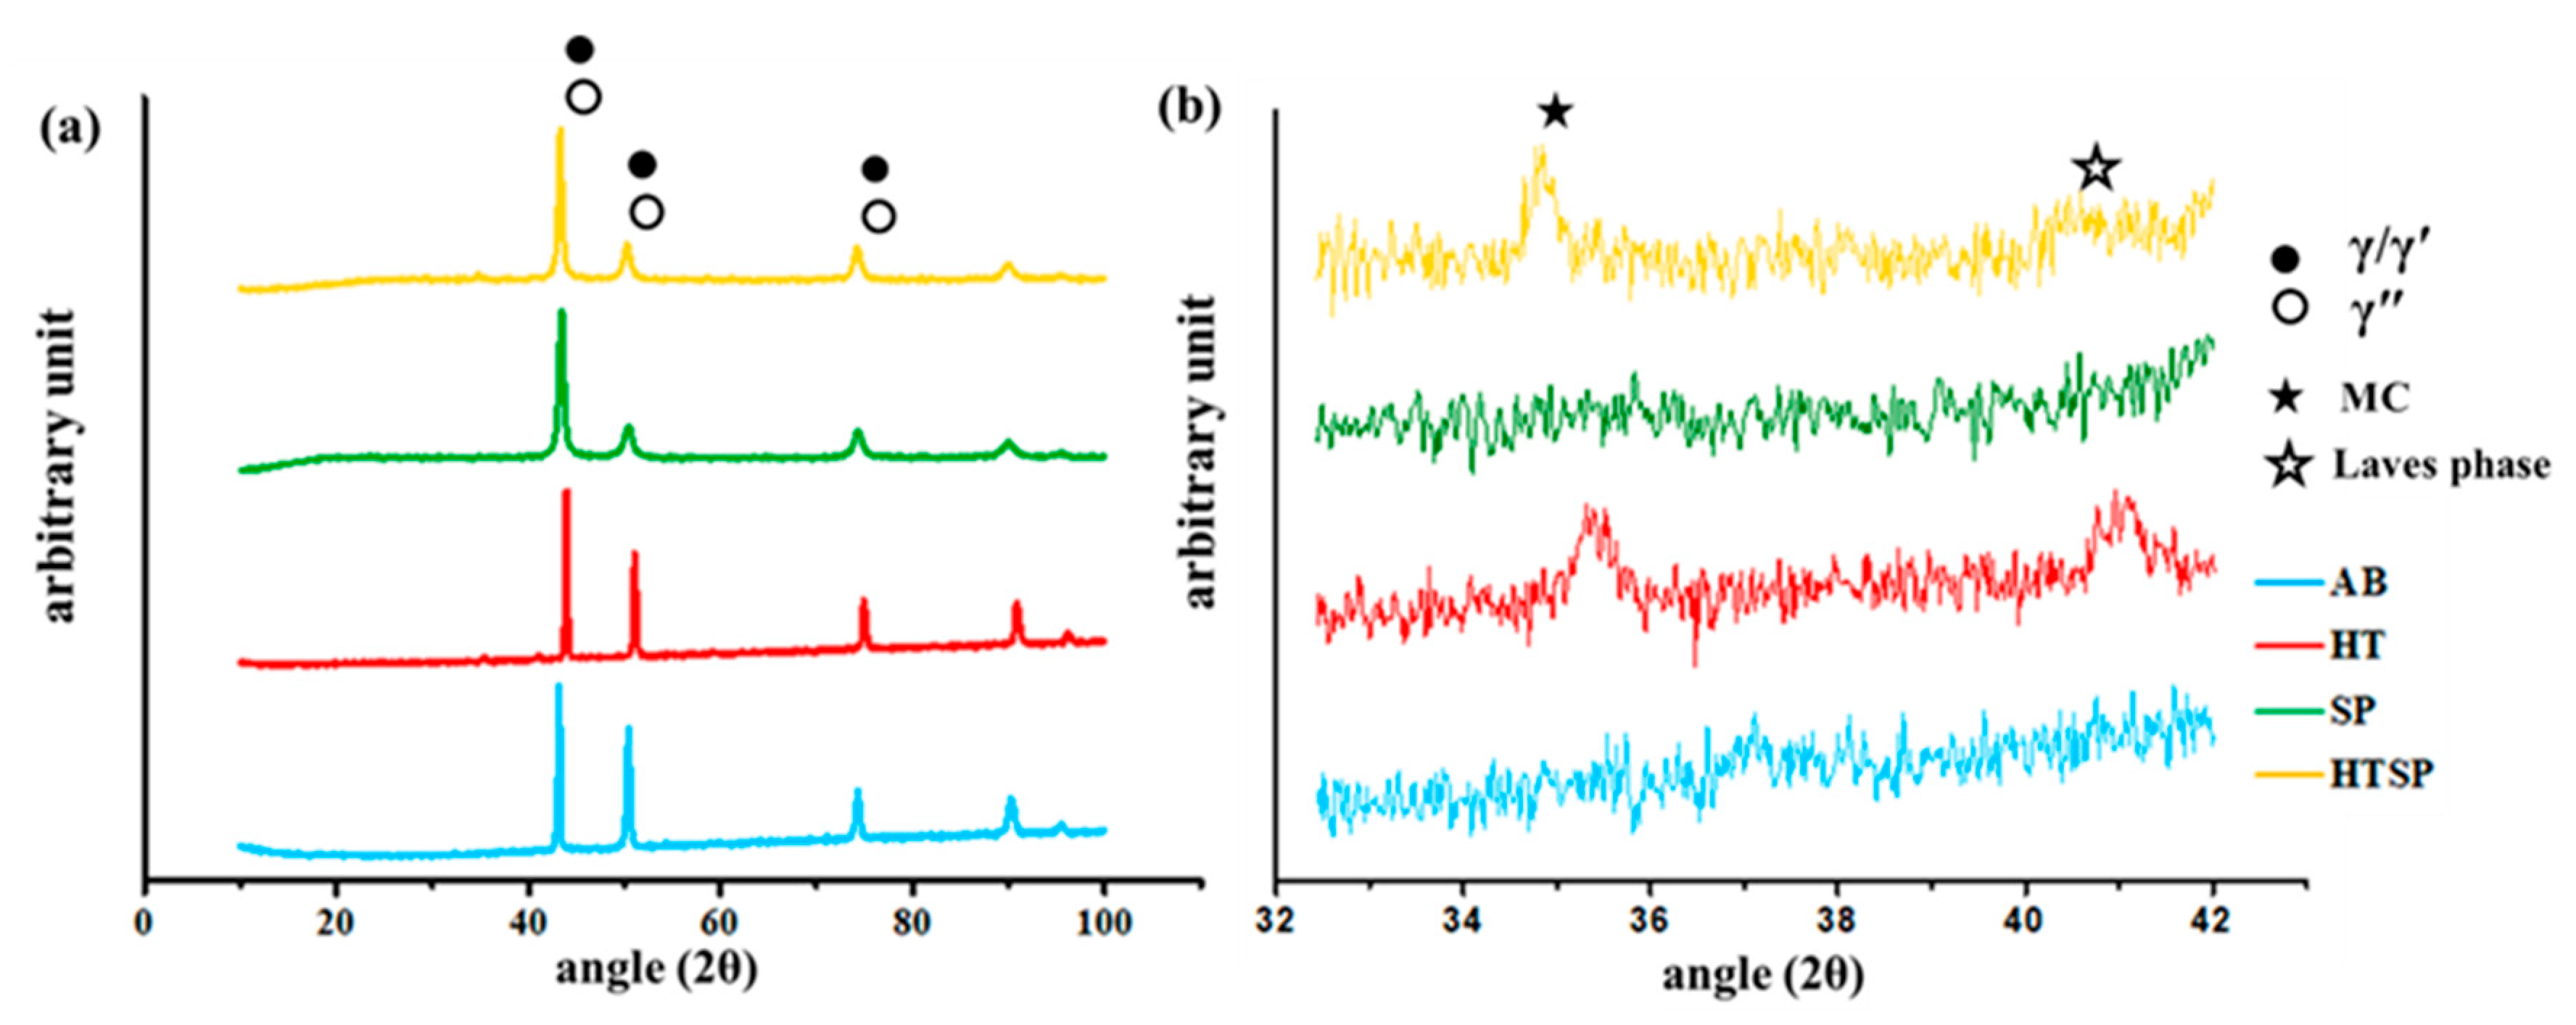
3.1. Microstructural Analysis

The selective laser melted IN718 alloy was characterized using optical microscopy to reveal the structure that formed through the layer-by-layer process. The microstructure of the processed and post-processed materials in the XY plane are presented in Figure 2. The scan patterns on the XY plane are visible in the as-built material (Figure 2a). After heat treatment, the scan pattern vanished and equi-axed grains with an average grain size of 25 µm are visible in the microstructure (Figure 2b). The microstructure of shot peening on the as-built material (Figure 2c) and shot peening on the heat-treated material (Figure 2d) was not observed to change, as scan patterns and equi-axed grains appeared similar to their corresponding counterparts. The microstructure in the XY plane of the AB material shows a 100 µm width scan patterns. The microstructure in the XY plane of the SP sample in Figure 2c is almost similar to that of the AB sample; however, the solidified melt pool tracks and boundaries are not as apparent as in the AB sample. The microstructure of the HTSP material in Figure 2d contains equi-axed grains in the XY plane.
The microstructure on the plane (XZ) in the built direction is different from that of the microstructure in the XY plane. The microstructure of the as-built material in Figure 3a contains the solidified melt pool and melt pool boundaries with a thickness approximately equal to the layer thickness (30 µm), which can be observed from the XZ plane. After heat treatment, the melt pool tracks and boundaries are completely replaced by the elongated grains (20 µm length and 2 µm width), with an aspect ratio of 10 along the built direction as shown in the microstructure in Figure 3b. The microstructure of the SP material (Figure 3c) appeared similar to that of the as-built material (though not apparent), while the microstructure of the shot-peened material after heat-treatment (Figure 3d) contained a mixture of equi-axed (≈40 µm) and elongated grains. The microstructures in Figure 2 and Figure 3 of the materials in the XY and XZ planes, respectively, indicate that there is a microstructural anisotropy in the material that continues to exist even after heat-treatment. Furthermore, as equi-axed surfaces are known to exhibit better corrosion properties than the elongated microstructure, in this work, the XZ surface is preferred for corrosion analysis.
Although the optical microstructure reveals scan patterns, melt pools, a melt-pool track, and elongated and equi-axed grains, details of the nature of the secondary phase particles and their distribution in the microstructure are not revealed. In order to obtain clearer features of the secondary phase particles, SEM and TEM micrographs are obtained. The SEM microstructure of the samples on the XZ planes after etching is presented in Figure 4. The AB samples in Figure 4a exhibit regions with two types: one filled with secondary phase particles (γ/γ′) and another without any visible secondary phase particles (only γ). The two different regions in the AB material could be due to the layer by layer melting, remelting, and directional solidification, which caused the formation of a complete solid solution in some regions and the precipitation of γ′ in some other regions. In Figure 4b, the HT samples revealed aligned secondary phase particles along the boundary and needle-like precipitates distributed inside the matrix. The SP sample microstructure contains some grain-like structure (Figure 4c), while the HTSP samples contain a microstructure (Figure 4d) similar to that of the HT samples.
As the microstructure of the AB and SP as well as HT and HTSP samples contain similar microstructural constituents, the elemental analysis is presented only for the AB and HTSP samples. The different particles in the AB samples are marked as A, B, C, D, and, E in Figure 4a, and the particles in the HTSP samples are marked as F (Figure 4d), G, and H (inset of Figure 4d). The corresponding weight percentage of the constituent element in a specific particle is presented in Table 2. Point A contains 52.5 wt % Ni, 21.4 wt % Cr, 19.5 wt % Fe, and 2.5 wt % Nb as major constituent elements that represent that A is a γ matrix. Particle B is present along the grain boundary, particle C is discretely distributed in the γ matrix, and particle E is continuously distributed in the γ matrix. All these particles, namely, B, C, and E, contain similar wt % of constituent elements with approximately 51.0 wt % Ni, 21.5 wt % Cr, 19.4 wt % Fe, and 4.0 wt % Nb. The elemental distribution of these particles in the AB microstructure reveals that these particles contain higher in Nb when compared to the γ matrix. The particle D contains elements Nb (3.2 wt %) as well as Al, Si, and O with the corresponding wt % of 4.0, 5.5, and 9.8. In the HT sample, the particles are very fine. Particle F along the boundary contains similar elemental distribution as that of particles B, C, and E of the as-built sample. Particle G in the inset of Figure 4d contains Nb (3.8 wt %) with Al (2.2 wt %) and O (2.9 wt %), and the needle particle H is also containing Nb (3.5 wt %). Thus, other than the γ matrix, γ′, oxides and carbides are visible in the micro level magnification.
The TEM image of the AB material in Figure 5a shows the cellular structure of the γ matrix with Laves phase boundaries. The interdendritic regions were reported as γ′′ in a few studies in the literature [42,43], while the Laves phase appears in many studies [12,21,44,45,46,47,48,49,50] and as δ phase appears in a few studies [51]. However, a detailed experimental study by quenching the IN718 alloy from 1140 °C [52] and simulation study on the solidification microstructure of IN625 alloy during SLM confirmed that the interdendritic phases are rich in Nb and Mo but depleted in Cr [53]. Meanwhile, in the TEM image of HT samples in Figure 5b, a random distribution of needle-like precipitates (δ particles) can be observed. The kinetics of δ-phase formation is very quick during post-heat treatment of SLM Inconel alloys, which precipitates within 5 min during stress-relief treatment [50,53].
In order to clearly distinguish the phases present in the material in the as-built material and after different processing conditions, the XRD analysis was carried out. The 2θ peaks of all the four samples are presented in Figure 6. The AB and SP material revealed the peaks of primary γ phases (Figure 6a), while the HT and HTSP materials revealed the peaks of primary γ phases as well as the metal carbides (MC) phases (Figure 6b). The Laves phase in the AB and SP conditions and the δ phase in the HT and HTSP samples are not distinguished by XRD peaks. The overlapping of γ, γ′, and γ′′ in the as-built condition as well as the overlapping of γ′′ and δ peaks in the heat-treated conditions makes it difficult to separately identifying the different phases occurring in the material [54,55,56]. However, the secondary phases are clearly distinguished using SEM and TEM images. The microstructure and phase analysis of the samples implied that the AB and SP samples were almost similar in microstructure and composition. On the other hand, HT samples have an elongated microstructure in the XZ plane and equi-axed grains in the XY plane, while HTSP samples contain an equi-axed grain structure in all the planes, yet the phases were similar in both HT and HTSP samples.

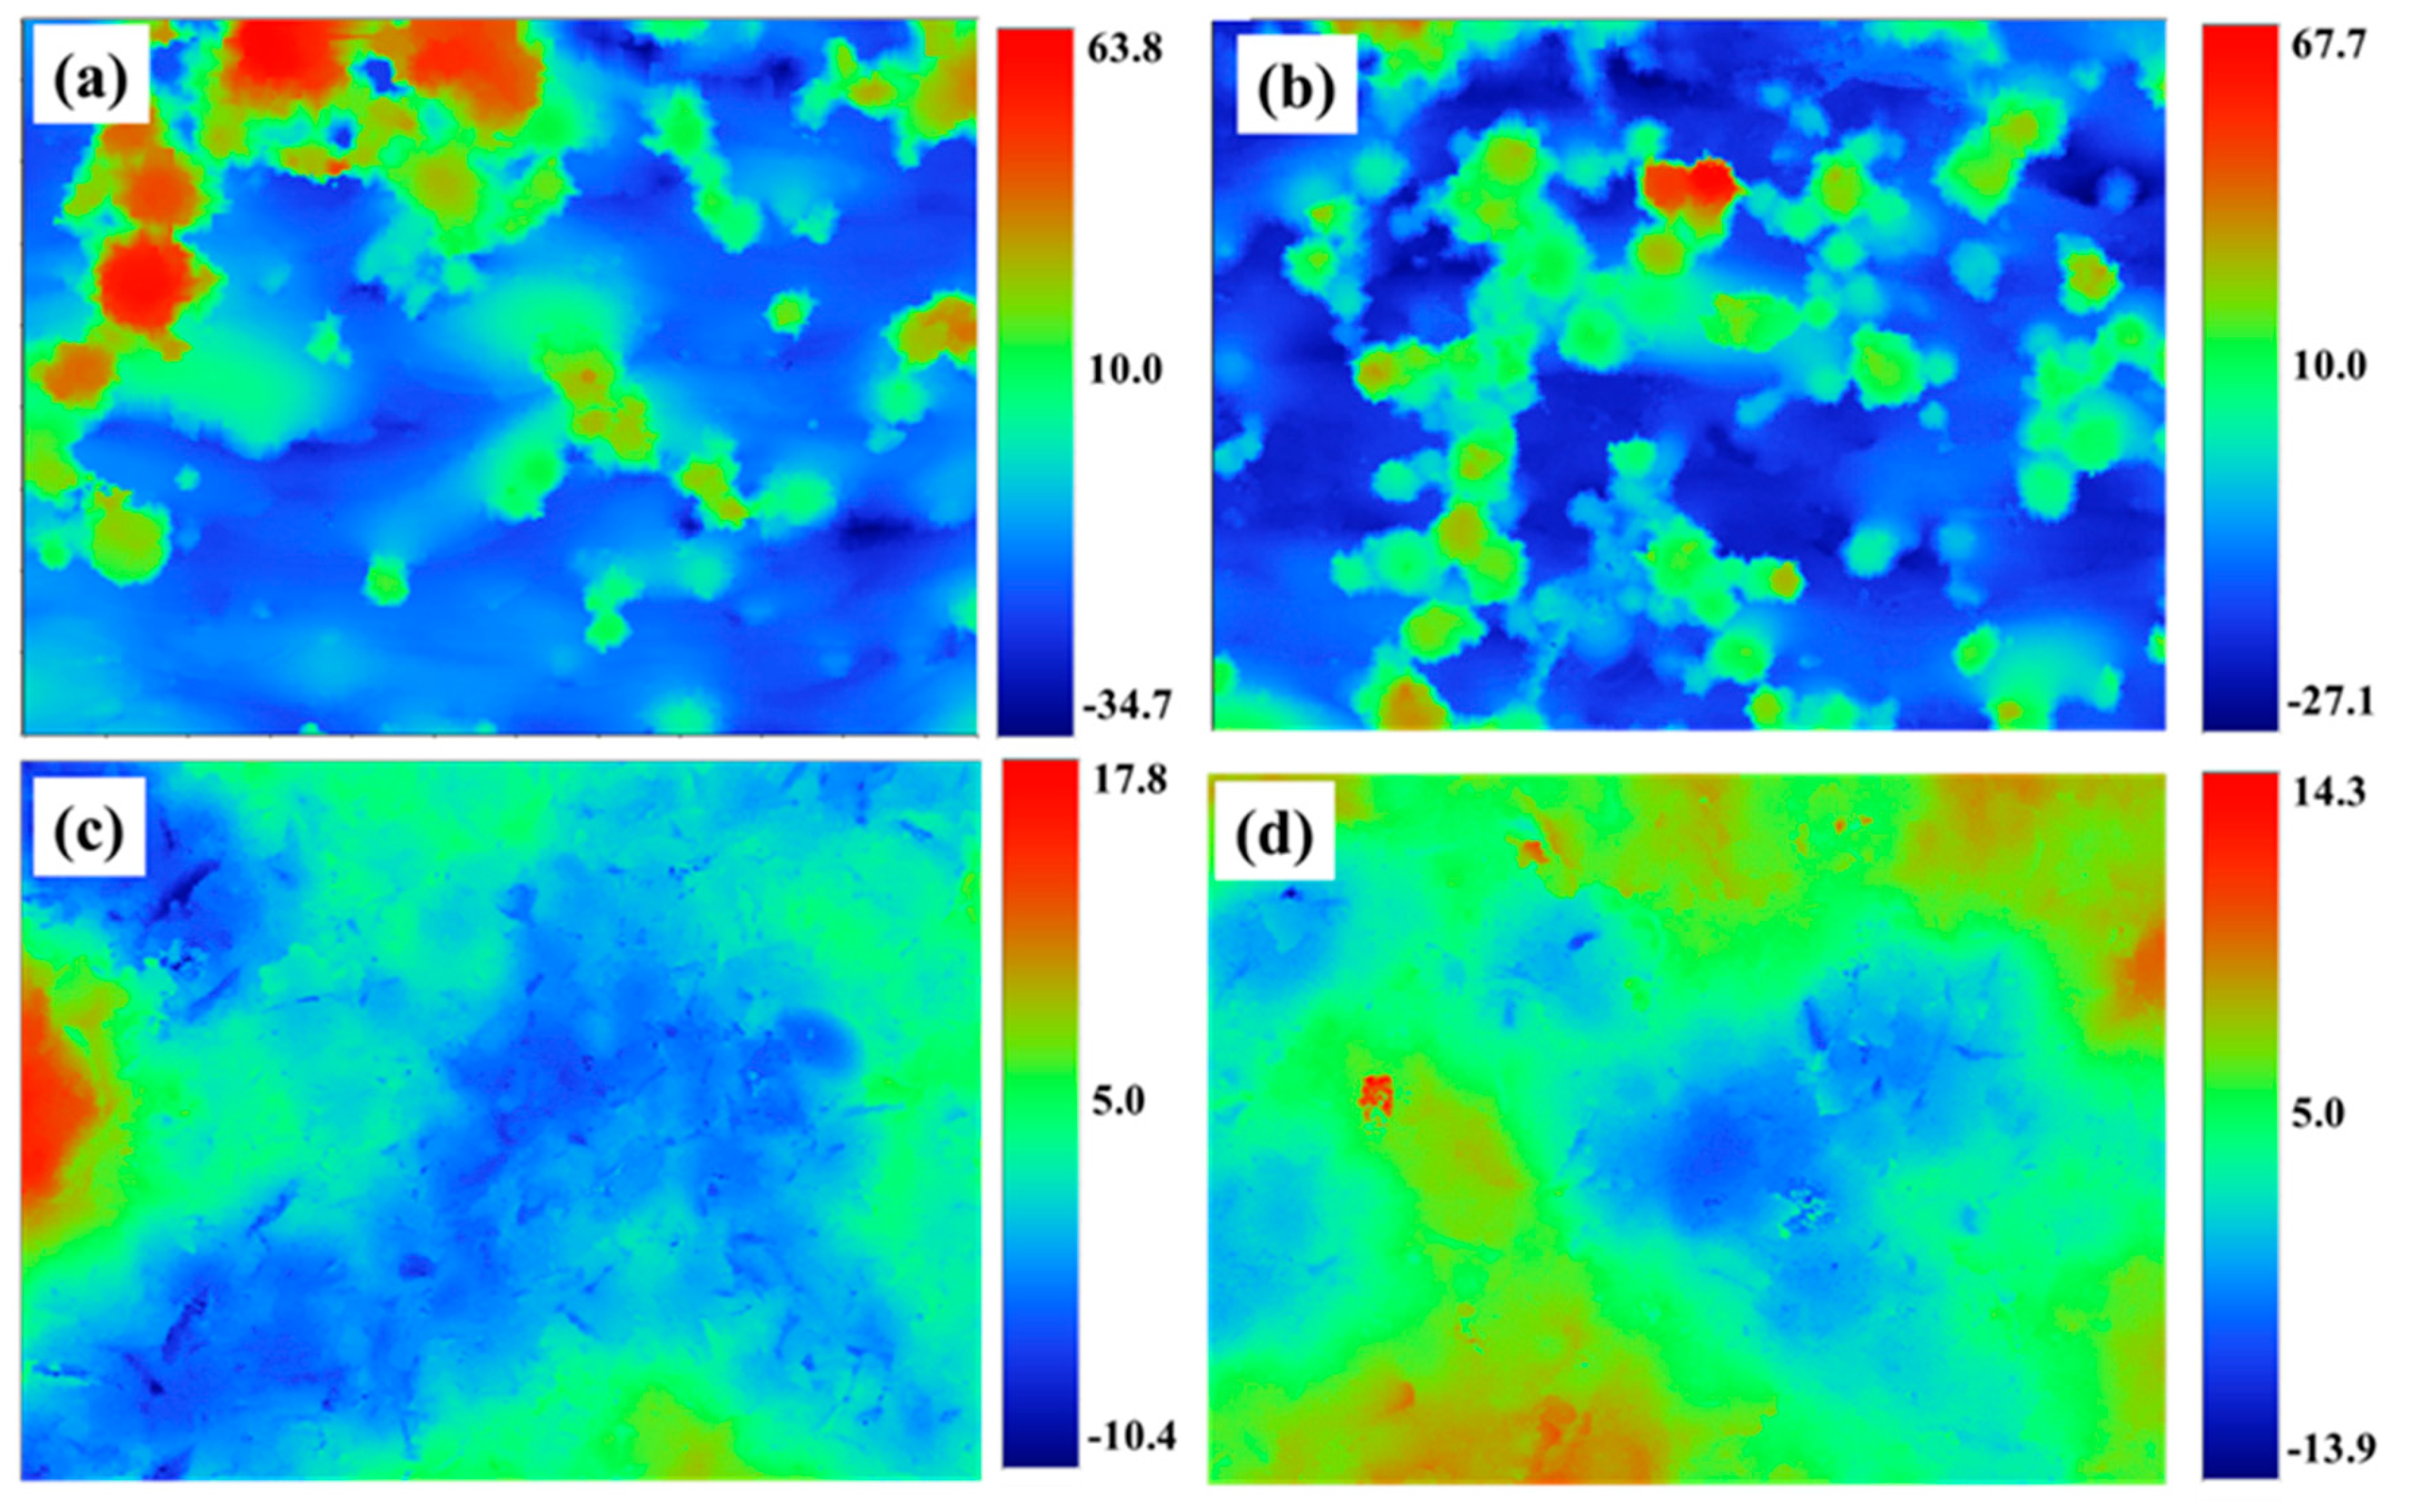
3.2. Surface Roughness

Apart from the microstructural differences in the SLM samples, the difference in surface roughness was also measured on the surface of the XZ plane, as this is plane in which the corrosion tests are carried out. The three-dimensional interactive surface profile of peaks and valleys on the surface of all four samples are presented in the Figure 7. The maximum range from crust to trough values for the AB material is −43.7 to 63.8 µm (Figure 7a), and for the HT material, it is −27.1 to 67.7 µm (Figure 7b). After shot-peening, the values in surface roughness have reduced drastically, which can be seen from the roughness distribution depicted in the color spectrum. In Figure 7c, the maximum range for the crust to trough of the SP materials is −10.4 to 17.8 µm, and that of the HTSP material (Figure 7d) is −13.9 to 14.3 µm. The maximum range from crust to trough of the AB, HT, SP, and HTSP samples is 107.5, 94.8, 28.2, and 28.2 µm, respectively.
Although the microstructure and phases in the AB and SP samples showed similarity, there was a significant difference in their surface roughness values. The average surface roughness value (Ra) of the AB sample was found to be 11.88 µm, while that of the SP material was found to be around 2.70 µm. Similarly, there was a significant difference in the surface roughness value of the HT and HTSP materials, which were observed to be around 12.96 and 2.12 µm. Thus, HT material showed a marginally higher surface roughness than the AB material after shot-peening, while the surface roughness of the SP and HTSP samples reduced drastically.

3.3. Electrochemical Measurements

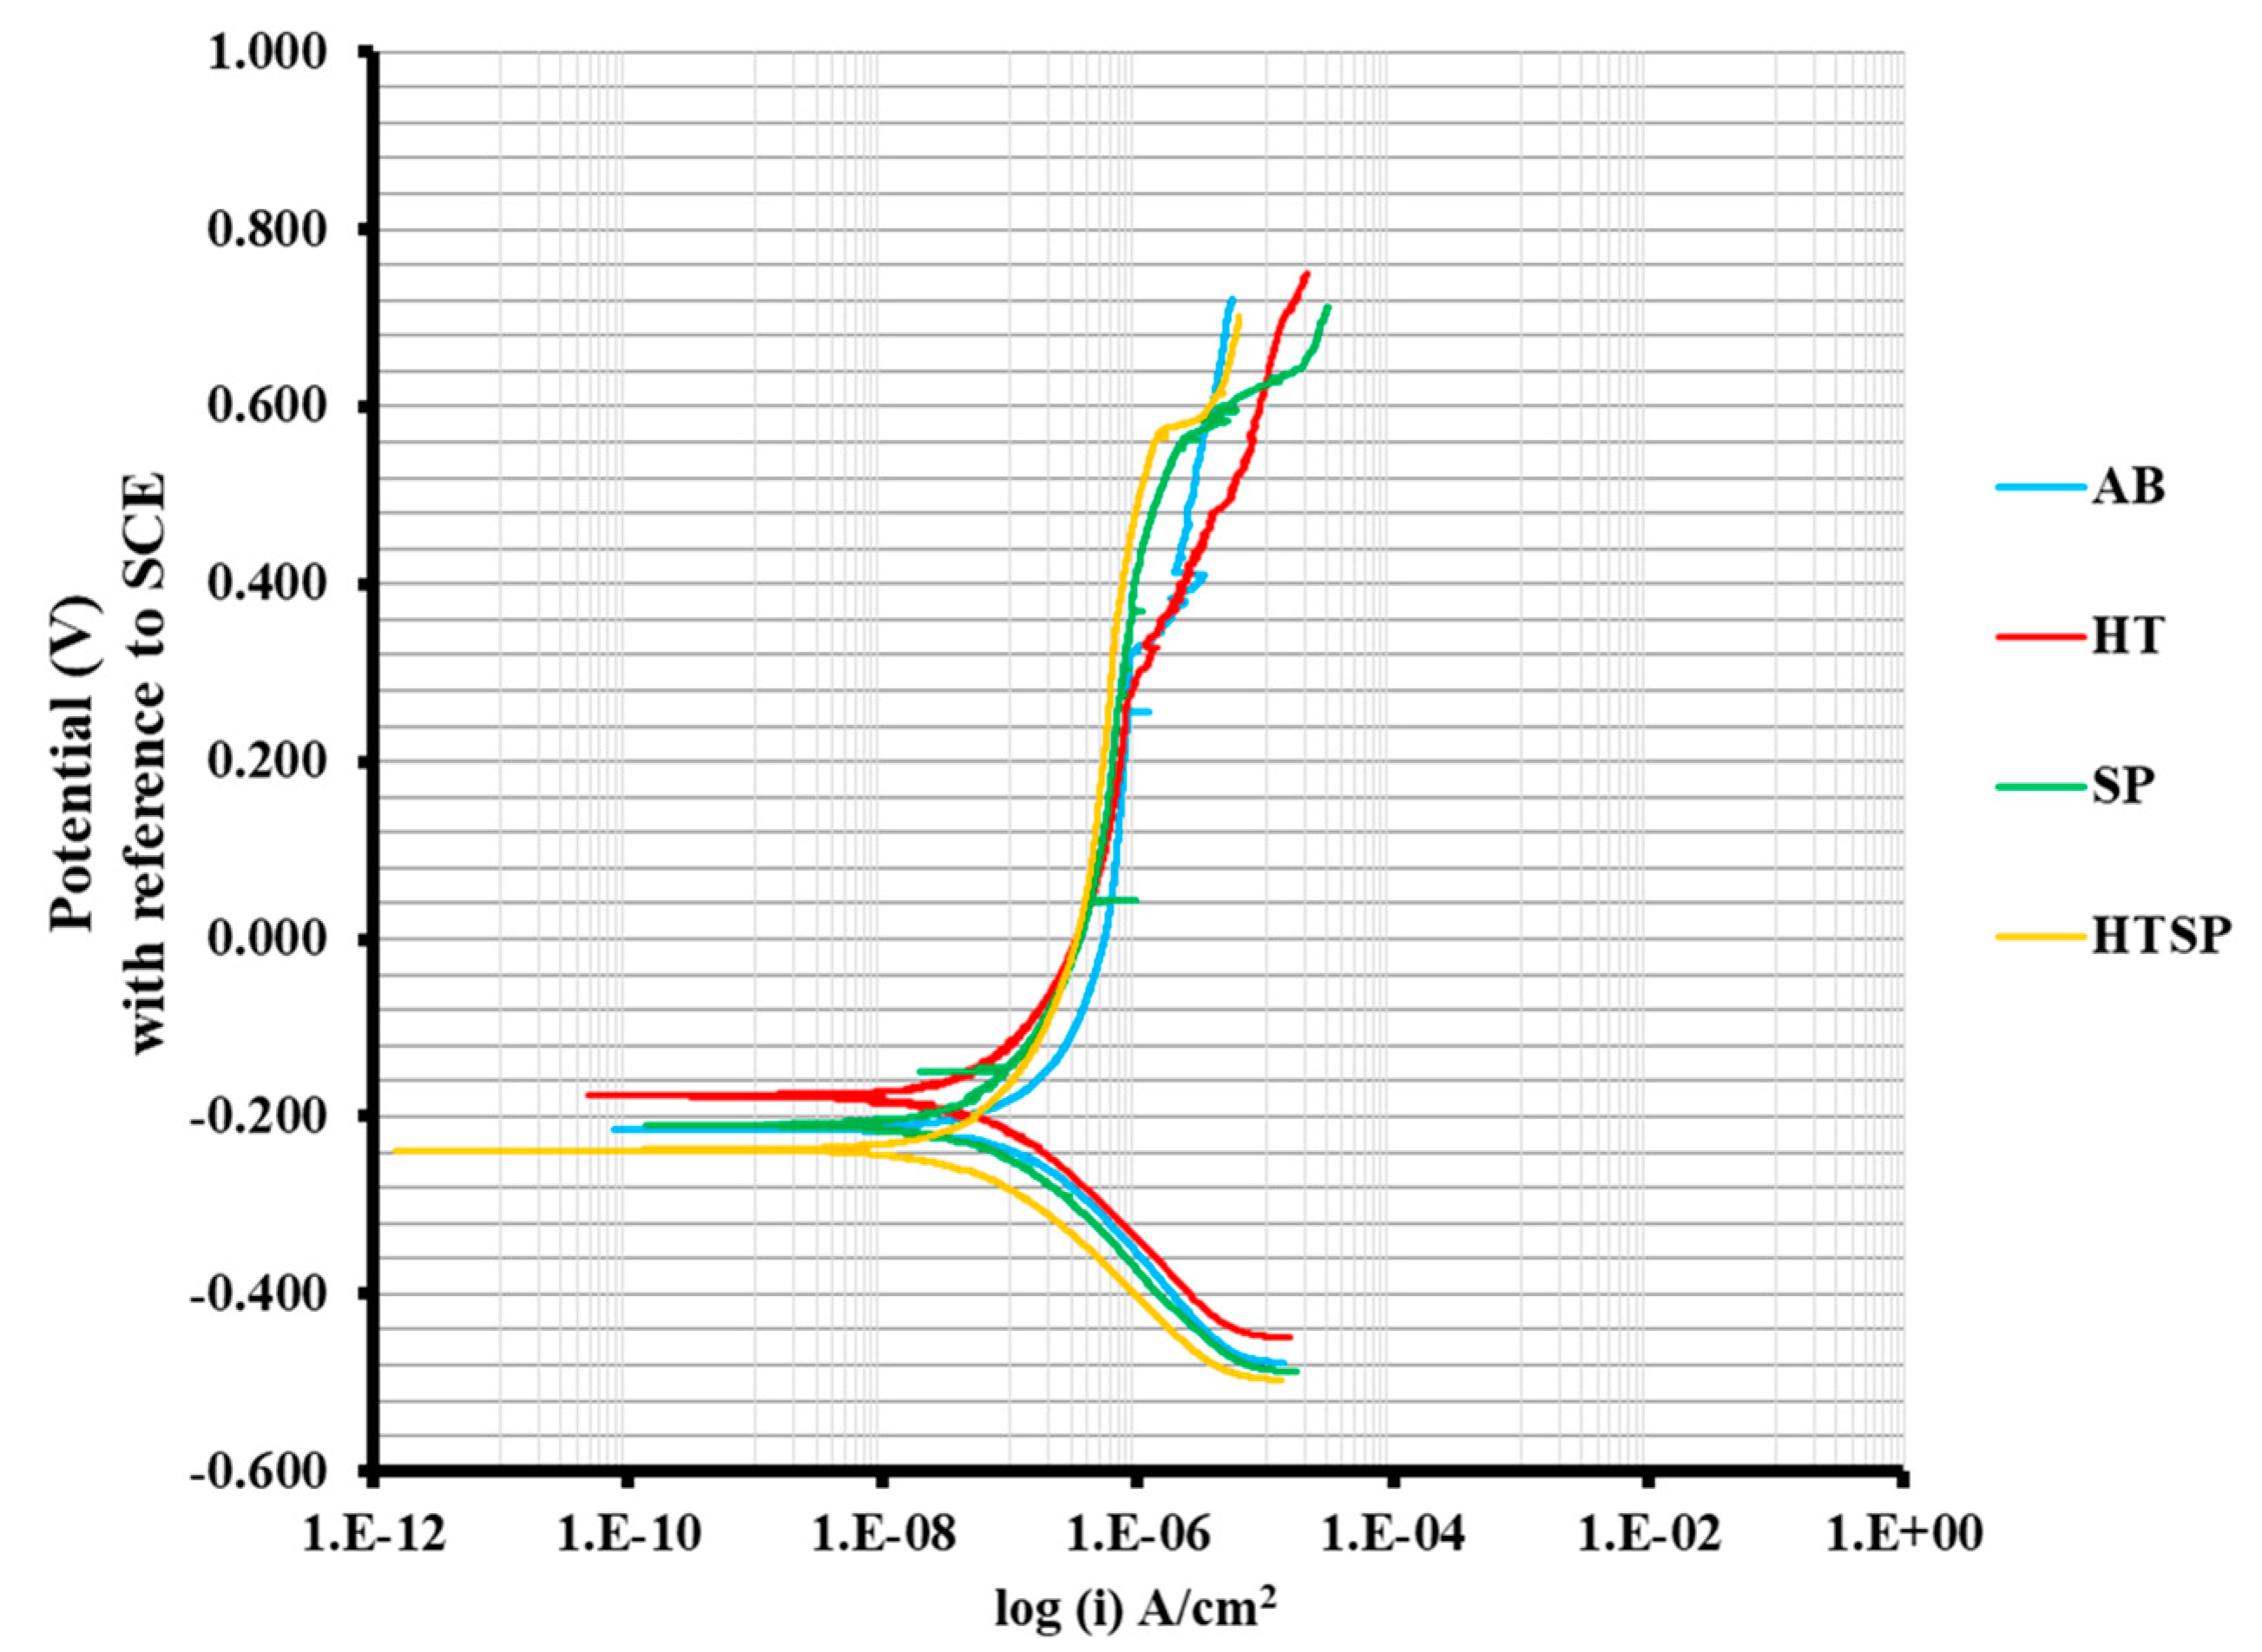
3.3.1. Potentiodynamic Polarization

The Tafel curve obtained due to the potentiodynamic polarization of SLM samples of different conditions in the 3.5 wt % NaCl solution is shown in Figure 8. The cathodic branches of all the conditions were observed to be similar. However, there was a significant difference in the anodic portion of the polarization curves among the different samples. The passive layer formation is apparent from the Tafel curve of all the samples subjected to potentiodynamic polarization. In the AB and HT samples, the anodic dissolution begins shortly after passivation, implying that the passive film ruptures without forming a steady-state passive layer. The SP and HTSP samples exhibited steady-state passivation regions. The active dissolution of the AB sample is due to galvanic corrosion, which cause an anodic dissolution γ-matrix with respect to the Nb-rich Laves phase, in the boundary of the cellular structure, as the cathode. The disappearance of the cellular boundaries after heat treatment prevents galvanic corrosion and early anodic dissolution in the HT samples. A similar observation of galvanic cell formation due to δ particles was reported by Li et al. [39]. The evidence for this hypothesis is presented later in the article using the microstructural characterization of post corrosion samples.
The corrosion rate in mils/year (mpy) of the samples was obtained by using the Faraday law [57] in Equation (1). One mil is generally one-thousandth of an inch, which is equal to 0.0254 mm [58].
C o r r o s i o n   r a t e =   k *   i c o r r * E q . w t . ρ * a r e a
In the equation representing the Faradays law, k represents a constant (3.27 × 10⁻³), icorr stands for current density (A/cm2) at the corrosion potential (Ecorr), Eq. wt. is the equivalent weight of the alloy (25.41 g/equivalent), ρ is the density of the alloy (8.17 g/cm3), and the exposure area is of area 0.785 cm2. The Ecorr, Icorr, and corrosion rates are presented in Table 3. It is apparent from Equation (1) that the corrosion rate is directly proportional to the Icorr value. The AB material has shown a higher corrosion rate of 0.135 mpy, which exhibited an Icorr value of 0.21 µA/cm2, and the HTSP material revealed the least corrosion rate of 0.025 mpy with an Icorr value of 0.04 µA/cm2. The HT and SP material also exhibited significant decreases in the corrosion rate, which are 0.045 and 0.031 mpy, respectively, and their corresponding Icorr values are 0.08 and 0.06 µA/cm2. The potential at which the transpassive region commences is referred as the pitting potential (Epit) or breakdown potential at which there is a sudden increase in the current [59]. The Epit values are also presented in Table 3. In the AB specimen, the Epit has a value of 220 mV, indicating a weak protective layer. The post processed specimens have exhibited a stronger passive layer with higher values of pitting potential. The heat-treated specimen has a slightly higher pitting potential of 330 mV. The shot-peened specimen has an Epit value of 560 mV, and the heat-treated shot-peened condition has the highest pitting potential of 570 mV. Thus, the corrosion resistance as well as the pitting potential both are the highest for the HTSP specimen followed by the SP, HT, and the AB specimen.

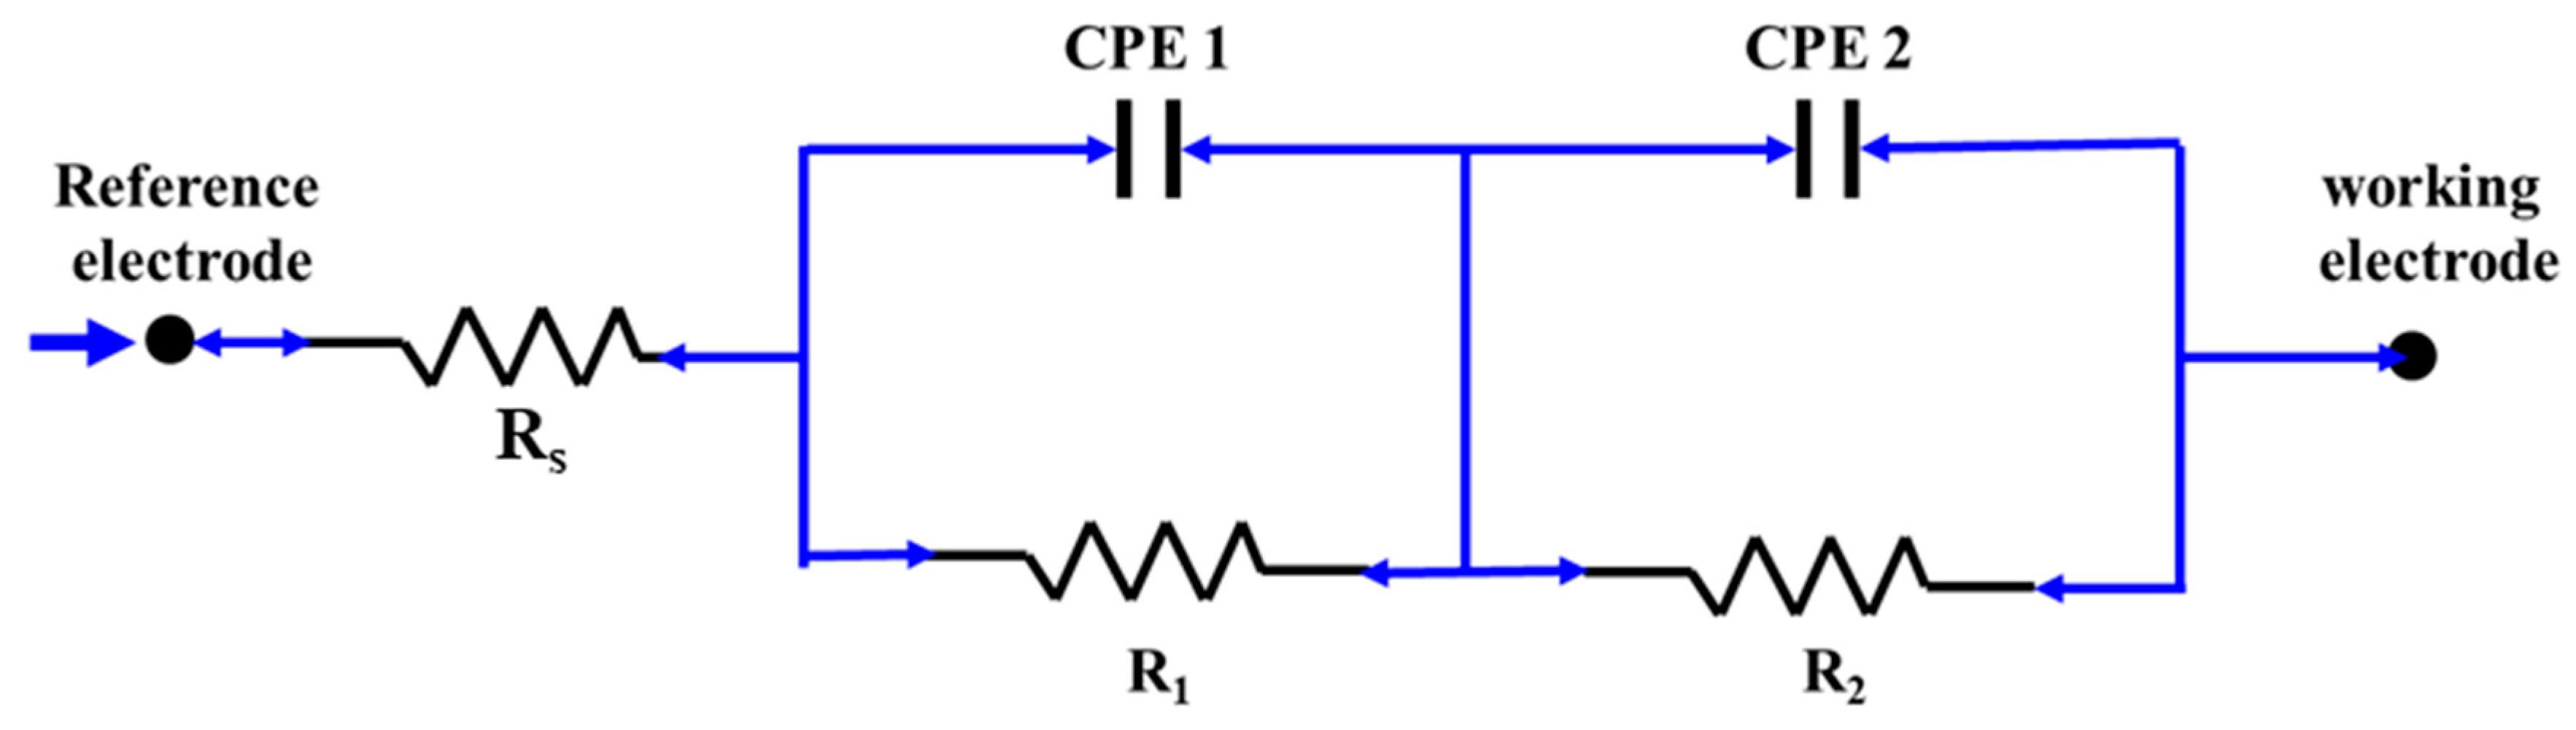
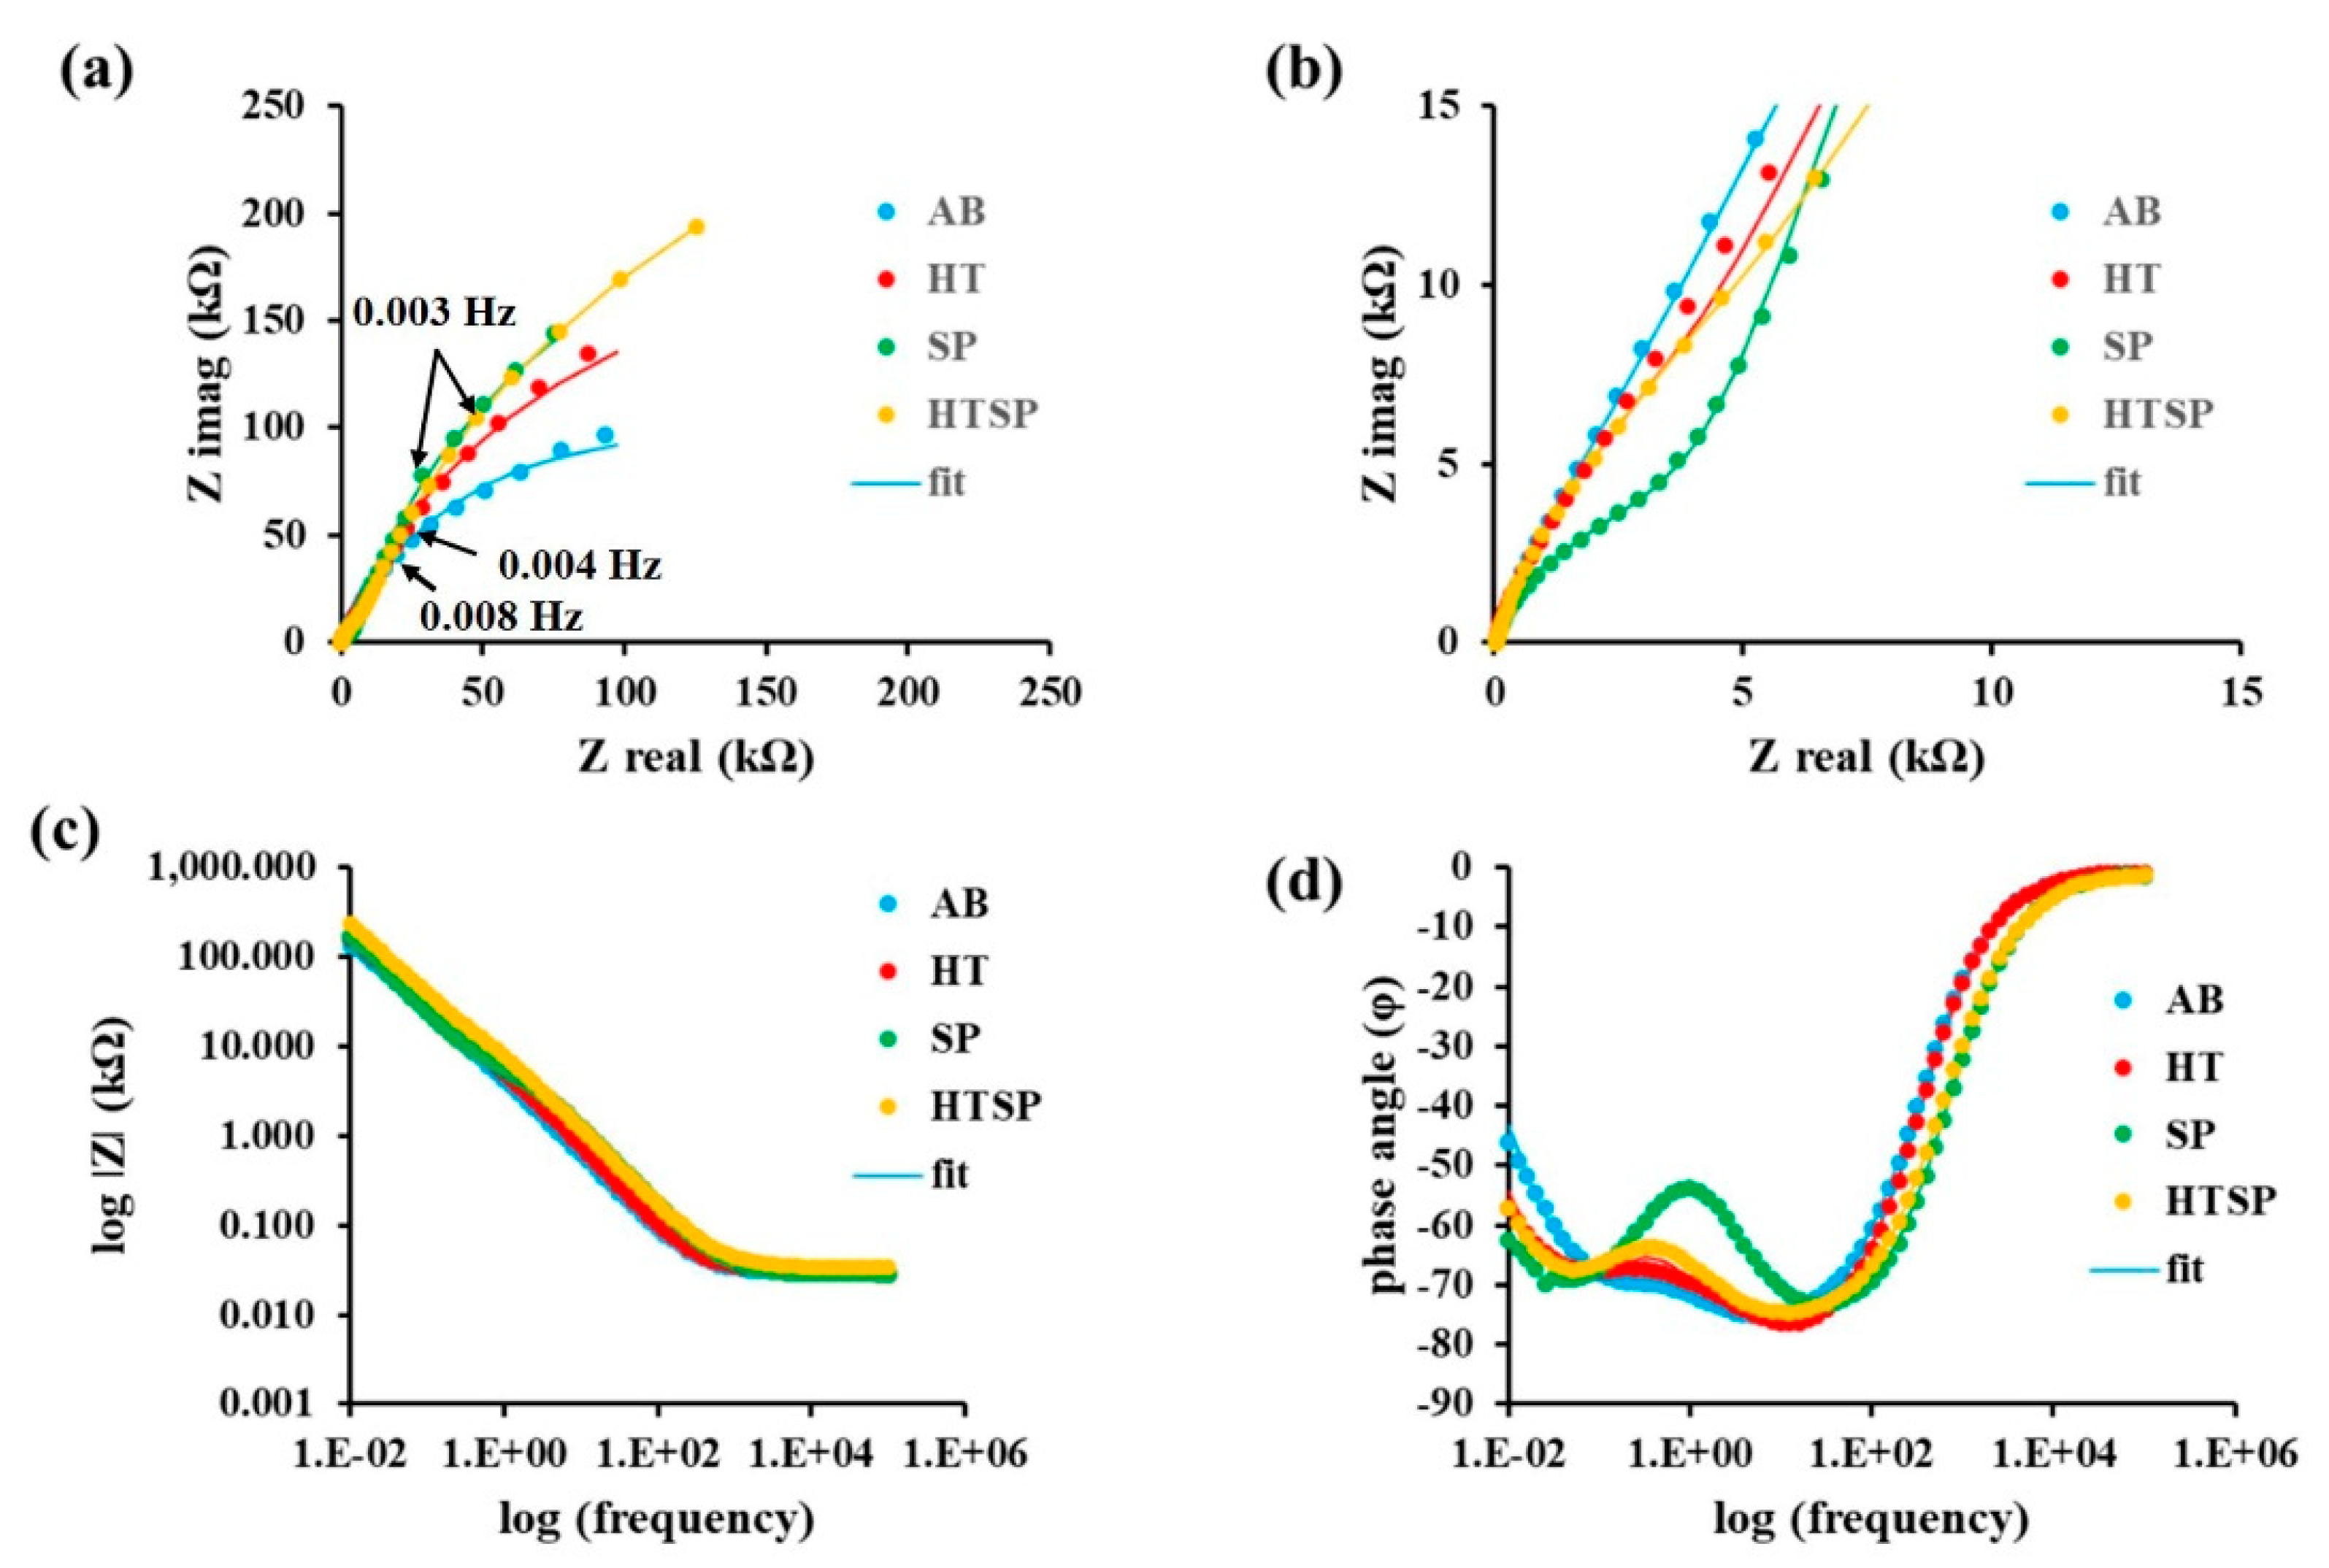
3.3.2. Electrochemical Impedance Spectroscopy Analysis

The impedance data of an electrochemical reaction can be analyzed using an exact mathematical model or comparatively using an empirical electrical circuit [60]. In order to analyze the impedance of the passive layer and its nature, EIS analysis was performed. The Electrochemical Equivalent Circuit (EEC) model of the materials was constituted by the data obtained out of the EIS measurement and presented in the form of a Nyquist and Bode plot. The EEC model is constructed using equivalent circuit elements in the place of common electrical elements such as a resistor, inductor, and capacitor, in either serial or parallel combinations. The Nyquist plot represents the imaginary part of impedance in the ordinate, and real part of impedance is in the abscissa. This plot is complex to read, consisting of information pertaining to many parameters with variation in frequency for the electrochemical measurements depending on the circuit element considered. The drawback of this plot is that it would be difficult to identify the exact frequency at which a particular data point was plotted [61]. Hence, the Nyquist plot has to be used in conjunction with the Bode plot. In the Bode plot, abscissa contains the frequency and magnitude of impedance and phase angle in the ordinate.
The EEC model with two resistance–capacitance (RC) time constants as shown in Figure 9 was used to fit the EIS experimental data. The experimental and fitted values of the EIS data in the form of a Nyquist plot and Bode plots are presented in Figure 10. In the EEC model circuit, Rs, represents the resistance of the electrolytic solution (NaCl). Rs is in series with the two RC time constants. The first RC time constant contains Constant Phase Element, CPE1 and R1 in parallel, while the second time constant contain CPE2 and R2 in parallel. The impedance of a CPE (ZCPE) element is given by Equation (2) [61].
Z C P E =   1 ( j ω ) α Y 0
In Equation (2), ω represents angular frequency, α is a constant, and Y0 represents the CPE coefficient of the element in Ω−1 cm−2 sα. The CPE is used in the place of a capacitor, as a capacitor would not perform ideally in EIS experiments due to frequency dispersions. In order to measure the CPE effectively, the assessments were made at frequencies higher than the characteristics frequency (fc) [62,63], which is given by Equation (3) [64].
f c =   1 2 π ( R l l Y 0 ) 1 α
In Equation (3), Rll is the resistance of the particular RC time constant. The characteristic frequency and the parameters measured using the EEC model circuit are presented in Table 4. The AB material exhibited the least impedance of all the materials, followed by HT, SP, and HTSP in increasing order. A similar observation can be observed in the linear part of a large semi-circle in the Nyquist plot in Figure 10a. The plot close to high frequencies has been magnified and presented in Figure 10b in order to distinguish the RC time constants (two semi-circle regions). The SP sample alone clearly exhibits both the time constants, while the HTSP sample curve close to the origin also contains an apparent semi-circle, although not a complete semi-circle as in Figure 10b.This could be due to the increased activity of capacitance at high frequency [65]. The Bode plot for the magnitude of the impedance in Figure 10c clearly expresses that impedance is inversely proportional to frequency. The Bode plot of phase angle in Figure 10d represents two time constants for all the tested samples. One at low frequency of approximately 100 mHz and another at approximately 100 Hz.
The solution resistance corresponds to the film/electrolyte interface. The passive film that formed during the corrosion of IN718 alloy is reported to contain a double layer: a compact inner layer and a porous outer layer [66]. The parameters measured using EIS data are presented in Table 4. The α values of CPE1 and CPE2 are from 0.85 to 0.95, which confirm the frequency dispersion normal to the capacitor. The first time constant is dominated by the capacitance activity, while the second time constant is dominated by the resistor activity. It can be observed from Figure 9 and inferred from Equation (2) that the impedance of the capacitance is inversely related to the frequency. Hence, the impedance of a CPE element must be low at high frequency, which favors capacitance activity. In other words, the current flows through the capacitor or CPE at low frequency. Therefore, the time constant that corresponds to 100 Hz frequency is the first one, CPE1ǀǀR1, which was a porous outer layer. At lower frequencies, the capacitance must have some definite impedance so that the current chooses the path through the resistor whose resistance must be smaller than the impedance of the corresponding CPE. Hence, the second time constant CPE2ǀǀR2 corresponds to the 100 mHz frequency that occurs at the inner layer of the passive film. This is actually the barrier layer. In addition, the maximum impedance at the inner layer is exhibited by the HTSP material, which is 676 kΩ followed by SP (558 kΩ), HT (407 kΩ), and AB (234 kΩ) material.
In this work, the AB material has shown the least corrosion resistance when compared to the post processed materials. The important factor attributed to the least corrosion resistance in AB material is due to anodic dissolution of the Laves phase. However, Du et al. [67] reported that an increasing volume fraction of Laves phase was not the influencing factor for the corrosion behaviour in the AB condition; rather, the Icorr value decreases with the increasing inclination angle from the vertical orientation up to 45° due to the change in the crystal orientation and grain boundary density. Hence, a detailed study is required to analyze the influence of the Laves phase on the corrosion of IN718 alloy after SLM. The improvement in corrosion resistance at the metal/film interface from 234 kΩ in the AB material to 558 kΩ in the SP material demonstrated that rough surfaces and any defects are removed by the shot-peening. Luo et al. [36] compared the SLM IN718 in an as-built condition and after heat treatment with a rolled IN718 material. The heat treatment after SLM decreased the corrosion rate significantly, as represented by the decrease in Icorr value to 0.003 µA/cm2 from 3 µA/cm2 in the as-built sample. However, in the work by Zhang et al. [30], it was reported that the Icorr value increased after heat-treatment to 0.58 µA/cm2 from 0.33 µA/cm2. Even after electrochemical polishing, the Icorr value was close to 0.57 µA/cm2. However, the observed Epit value increases from 550 mV in the as-built condition to 840 mV after surface treatment due to the formation of an oxide layer during electrochemical polishing. In the present work, the HTSP samples heat treated at 980 °C for 15 min and shot-peened exhibited a decrease in the Icorr value to 0.04 µA/cm2 from 0.21 µA/cm2 in the as-built condition. Meanwhile, the Epit value increased to 570 mV in HTSP from 220 mV in the AB condition.

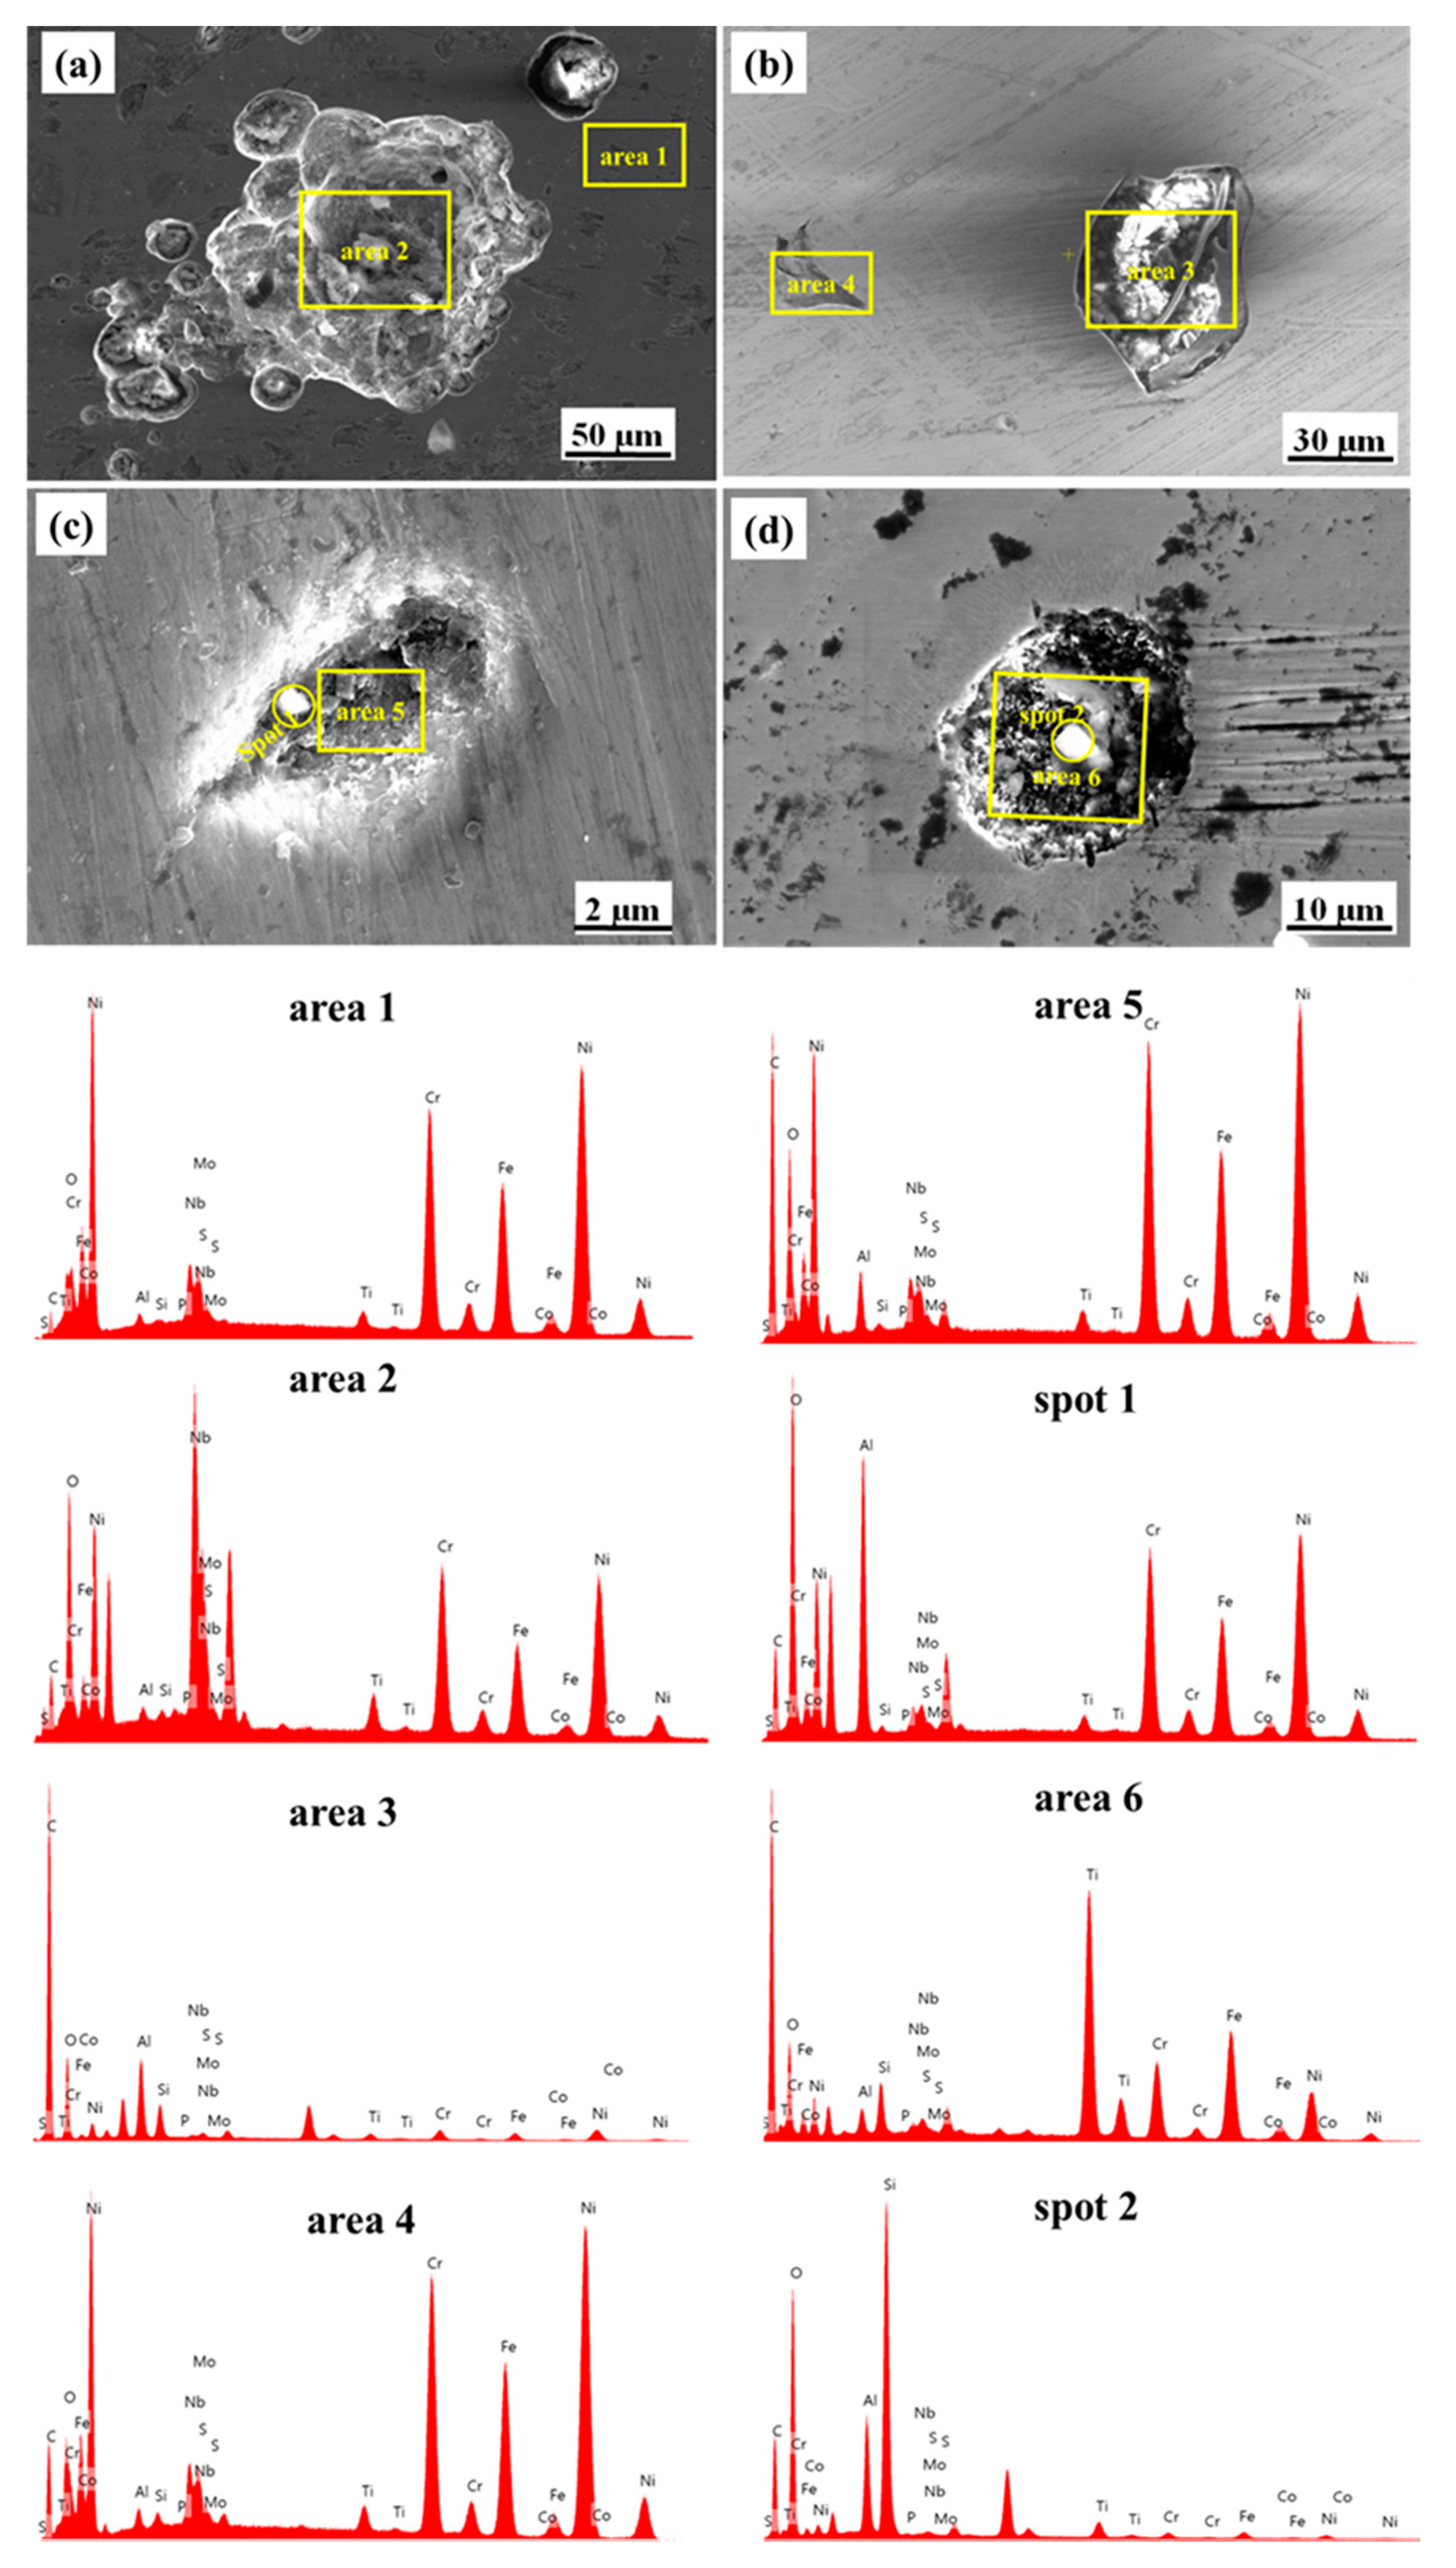
3.4. Post Corrosion Elemental Analysis of IN718

The elemental analysis of pits observed in the corroded samples are presented in Figure 11. The elemental analysis peaks observed on pits and certain particles inside the pits are presented below the SEM images. The pits in the AB sample cover a maximum length of approximately 50 µm, as shown in Figure 11a. Area 1 and area 2 in Figure 11a correspond to the uncorroded area and the pit inside the material. The peaks of area 1 contain a composition similar to the initial material, whereas the pit contains oxides and carbides of Nb and Mo. It ensures the anodic dissolution of the Laves phase, which has a chemical composition of (Ni, Cr, Fe)2(Nb, Mo, Ti).
The pit in the HT materials in Figure 11b is approximately 30 µm in length. Area 3 of the HT material is influenced by the metal carbide, whereas in area 4 of the HT material, a smaller pit of 15 µm in length is influenced by both the oxides and carbides of Al and Ti. In the shot-peened material, the pit is of length 5 µm (Figure 11c). The peaks corresponding to area 5 of the SP material also contain oxides and carbides. The particle inside the pit represented by spot 1 contains major elements such as Al and O, and it signifies the presence of Al2O3. In the pits of the HTSP material, which is approximately 12 µm in length in Figure 11d, area 6 contains TiC. The particle inside the pit mentioned as spot 2 has Si and O as the significant elements, indicating the possible presence of SiO2. There are three significant observations from the characterization of post-corroded samples. The first one is the pit size. The decrease in pit size with reduction in surface roughness indicates an improvement in the corrosion-resisting ability of the shot-peened materials. The second observation pertains to the elemental analysis. The pits in the AB material contain oxides of Nb and Mo, whereas the post-processed materials contain oxides and carbides of Al and Ti. It implies that the dissolution of a continuous network of Laves phase fairly improved the corrosion resistance after heat treatment. The third observation is that the elemental analysis of pits in the shot-peened materials indicated the presence of Al2O3 and SiO2, which could be the impurities added into the material while shot-peening. The correlation of elemental analysis with the corrosion rate and corrosion resistance values has shown that heat treatment leads to an improvement in the corrosion resistance of SLM IN718 alloy due to elimination of the Laves phase network, while shot peening improved it by producing smooth surface morphology. Hence, HTSP samples have shown superior corrosion resistance when compared to the other tested samples.

4. Conclusions

Inconel 718 has been fabricated using SLM with optimized process parameters in the present work. The fabricated samples are subjected to heat treatment and shot-peening. The potentiodynamic polarization and EIS experiments were carried out to study the electrochemical characteristics to elucidate its corrosion behavior. The following conclusions are made from this work:
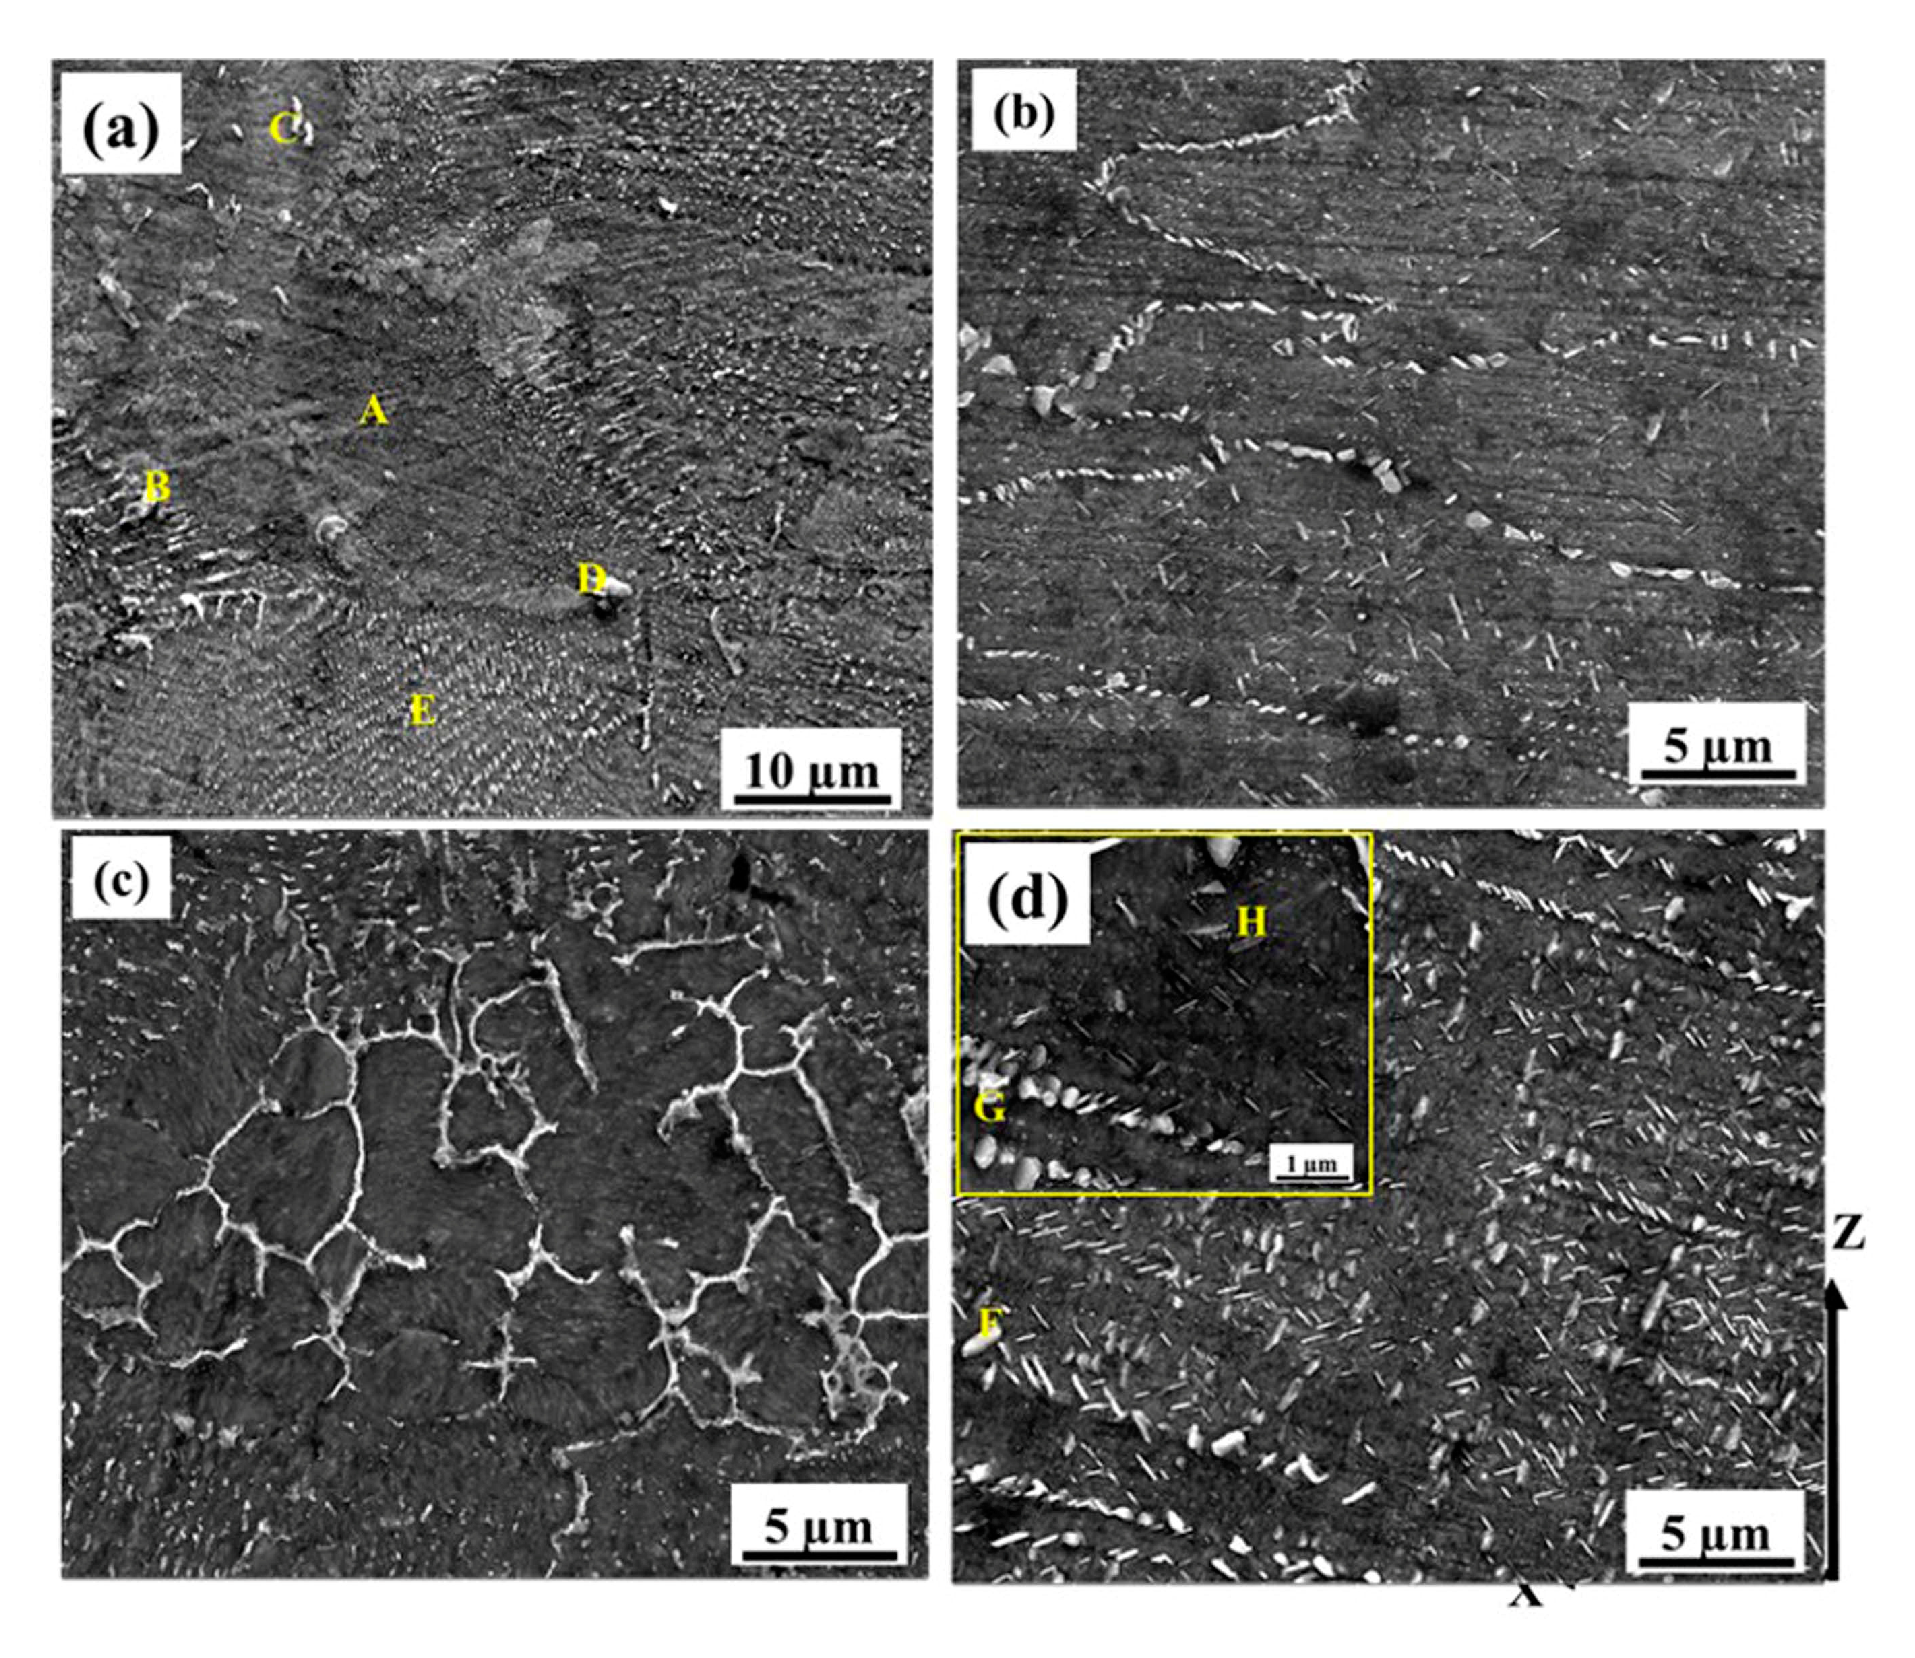
  • As-built (AB) and shot-peened (SP) material were characterized by the presence of a Laves phase network surrounding the 500 nm-sized γ-matrix. The Laves network in HT and HTSP materials becomes dissolved, but needle-like δ particles were distributed along the γ matrix.
  • The surface roughness values of the AB and HT samples reduced from approximately 12 to 2.5 µm after shot peening.
  • Potentiodynamic polarization experiments confirmed that anodic dissolution in the AB material leads to lesser corrosion resistance and exhibited the least pitting potential of 220 mV. However, after post-processing, the specimens have shown passive behavior, with the HTSP material possessing the highest pitting potential of 570 mV.
  • Nyquist plot confirmed the increasing corrosion resistance in accordance with the decreasing order of measured corrosion resistance, and the Bode plot has shown the presence of two RC time constants in all the tested materials. A high-frequency (100 Hz) time constant corresponds to the film/electrolyte interface and the low-frequency (100 mHz) interface corresponds to the metal/film interface.
  • The improvement in surface morphology and alteration of phase constituents in the alloy achieved through shot peening and heat treatment, respectively, have improved the corrosion resistance of the SLMed IN718 alloy.
  • The dissolution of the Laves phase network after heat treatment improved the corrosion resistance, while the shot-peening has a considerable effect on the corrosion behavior of both as-built and heat-treated material, as it reduced the surface roughness to almost 80% and produced a uniformly smoothened surface.

Author Contributions

Conceptualization, Methodology, Software Validation and Formal Analysis—O.V.M. Investigation, Data Curation—O.V.M., A.R. and R.J., Writing—Original Draft Preparation—A.R. and O.V.M., Visualization—B.K.N. and R.J., Writing—Review and Editing, Supervision, Project Administration—R.J. All authors have read and agreed to the published version of the manuscript.

Funding

This research received funding from sponsored research projects.

Acknowledgments

The authors would like to thank Amit, GTRE, for his assistance in heat treatment and shot-peening the SLMed materials and Kevin, Project Associate, Department of Engineering Design, IIT Madras for assisting in conducting the EIS experiments.

Conflicts of Interest

The authors declare no conflict of interest.

References

  1. Why Choosing Inconel 718 for Aerospace Additive Manufacturing? | Farinia Group, (n.d.). Available online: https://www.farinia.com/additive-manufacturing/3d-materials/inconel-718-aerospace-additive-manufacturing (accessed on 8 April 2020).
  2. Lv, J.H.; Wang, W.Z.; Liu, S.W. Statistical Analysis of Failure Cases in Aerospace. Int. Sch. Sci. Res. Innov. 2018, 12, 497–501. [Google Scholar]
  3. El-Meligi, A.; Palatino, L.I. Effect of nanostructure on corrosion and corrosion resistance of materials. Curr. Chem. Res. 2012, 2, 47–56. [Google Scholar]
  4. Simon, H.; Thoma, I.M. Attack on Superalloys by Chemical and Electrolytic Processes. Aircr. Eng. Aerosp. Technol. 1981, 53, 22–25. [Google Scholar] [CrossRef]
  5. Groh, J.R.; Duvelius, R.W. Influence of Corrosion Pitting On Alloy 718 Fatigue Capability. In Superalloy 718, 625, 706, and Derivatives; Loria, E.A., Ed.; The Mining, Metallurgy, and Materials Society: Warrendale, PA, USA, 2001; pp. 583–592. [Google Scholar]
  6. Boodhun, K.; Surnam, B.Y.R. Corrosion of Aircrafts—A Case Study in Mauritius. Int. Conf. Comput. Sci. Data Min. Mech. Eng. 2015, 77–82. [Google Scholar] [CrossRef]
  7. Czaban, M. Aircraft corrosion—Review of corrosion processes and its effects in selected cases. Fatigue Aircr. Struct. 2018, 2018, 5–20. [Google Scholar] [CrossRef] [Green Version]
  8. Akca, E.; Gursel, A. A Review on Superalloys and IN718 Nickel-Based Inconel Superalloy. Period. Eng. Nat. Sci. 2015, 3, 15–27. [Google Scholar] [CrossRef]
  9. Thompson, M.K.; Moroni, G.; Vaneker, T.; Fadel, G.; Campbell, R.I.; Gibson, I.; Bernard, A.; Schulz, J.; Graf, P.; Ahuja, B.; et al. Design for Additive Manufacturing: Trends, opportunities, considerations, and constraints. CIRP Ann. 2016, 65, 737–760. [Google Scholar] [CrossRef]
  10. Gibson, I.; Rosen, D.; Stucker, B. Directed Energy Deposition Processes BT—Additive Manufacturing Technologies: 3D Printing, Rapid Prototyping, and Direct Digital Manufacturing. Johns. Matthey Technol. Rev. 2015, 59, 245–268. [Google Scholar] [CrossRef]
  11. Andreotta, R.; Ladani, L.; Brindley, W. Finite element simulation of laser additive melting and solidification of Inconel 718 with experimentally tested thermal properties. Finite Elem. Anal. Des. 2017, 135, 36–43. [Google Scholar] [CrossRef]
  12. Promoppatum, P.; Yao, S.C.; Pistorius, P.C.; Rollett, A.D. A Comprehensive Comparison of the Analytical and Numerical Prediction of the Thermal History and Solidification Microstructure of Inconel 718 Products Made by Laser Powder-Bed Fusion. Engineering 2017, 3, 685–694. [Google Scholar] [CrossRef]
  13. Kantzos, C.; Pauza, J.; Cunningham, R.; Narra, S.P.; Beuth, J.; Rollett, A. An Investigation of Process Parameter Modifications on Additively Manufactured Inconel 718 Parts. J. Mater. Eng. Perform. 2019, 28, 620–626. [Google Scholar] [CrossRef]
  14. Trosch, T.; Strößner, J.; Völkl, R.; Glatzel, U. Microstructure and mechanical properties of selective laser melted Inconel 718 compared to forging and casting. Mater. Lett. 2016, 164, 428–431. [Google Scholar] [CrossRef]
  15. Kaynak, Y.; Tascioglu, E. Post-processing effects on the surface characteristics of Inconel 718 alloy fabricated by selective laser melting additive manufacturing. Prog. Addit. Manuf. 2019, 5, 221–234. [Google Scholar] [CrossRef]
  16. Kong, D.; Dong, C.; Ni, X.; Li, X. Corrosion of metallic materials fabricated by selective laser melting. Mater. Degrad. 2019, 3, 1–14. [Google Scholar] [CrossRef]
  17. Turker, M.; Godlinski, D.; Petzoldt, F. Effect of production parameters on the properties of IN 718 superalloy by three-dimensional printing. Mater. Charact. 2008, 59, 1728–1735. [Google Scholar] [CrossRef]
  18. Wang, Z.; Guan, K.; Gao, M.; Li, X.; Chen, X.; Zeng, X. The microstructure and mechanical properties of deposited-IN718 by selective laser melting. J. Alloys Compd. 2012, 513, 518–523. [Google Scholar] [CrossRef]
  19. Witzel, J.; Schrage, J.; Gasser, A.; Kelbassa, I. Additive manufacturing of a blade-integrated disk by laser metal deposition. In Proceedings of the International Congress on Applications of Lasers & Electro-Optics, Laser Institute of America, Orlando, FL, USA, 23–27 October 2011; pp. 250–256. [Google Scholar] [CrossRef]
  20. Tillmann, W.; Schaak, C.; Nellesen, J.; Schaper, M.; Aydinöz, M.E.; Hoyer, K.P. Hot isostatic pressing of IN718 components manufactured by selective laser melting. Addit. Manuf. 2017, 13, 93–102. [Google Scholar] [CrossRef]
  21. Jiang, R.; Mostafaei, A.; Pauza, J.; Kantzos, C.; Rollett, A.D. Varied heat treatments and properties of laser powder bed printed Inconel 718. Mater. Sci. Eng. A 2019, 755, 170–180. [Google Scholar] [CrossRef]
  22. Jain, S.; Corliss, M.; Tai, B.; Hung, W.N. Electrochemical polishing of selective laser melted Inconel 718. Procedia Manuf. 2019, 34, 239–246. [Google Scholar] [CrossRef]
  23. Caliari, F.R.; Candioto, K.C.G.; Couto, A.A.; Nunes, C.Â.; Reis, D.A.P. Effect of Double Aging Heat Treatment on the Short-Term Creep Behavior of the Inconel 718. J. Mater. Eng. Perform. 2016, 25, 2307–2317. [Google Scholar] [CrossRef]
  24. Bagehorn, S.; Wehr, J.; Maier, H.J. Application of mechanical surface finishing processes for roughness reduction and fatigue improvement of additively manufactured Ti-6Al-4V parts. Int. J. Fatigue 2017, 102, 135–142. [Google Scholar] [CrossRef]
  25. Mostafa, A.; Rubio, I.P.; Brailovski, V.; Jahazi, M.; Medraj, M. Structure, texture and phases in 3D printed IN718 alloy subjected to homogenization and HIP treatments. Metals 2017, 7, 196. [Google Scholar] [CrossRef] [Green Version]
  26. Sugavaneswaran, M.; Jebaraj, A.V.; Kumar, M.D.B.; Lokesh, K.; Rajan, A.J. Enhancement of surface characteristics of direct metal laser sintered stainless steel 316L by shot peening. Surf. Interfaces 2018, 12, 31–40. [Google Scholar] [CrossRef]
  27. Zhuo, L.; Wang, Z.; Zhang, H.; Yin, E.; Wang, Y.; Xu, T.; Li, C. Effect of post-process heat treatment on microstructure and properties of selective laser melted AlSi10Mg alloy. Mater. Lett. 2019, 234, 196–200. [Google Scholar] [CrossRef]
  28. Damon, J.; Dietrich, S.; Vollert, F.; Gibmeier, J.; Schulze, V. Process dependent porosity and the influence of shot peening on porosity morphology regarding selective laser melted AlSi10Mg parts. Addit. Manuf. 2018, 20, 77–89. [Google Scholar] [CrossRef]
  29. Sander, G.; Tan, J.; Balan, P.; Gharbi, O.; Feenstra, D.R.; Singer, L.; Thomas, S.; Kelly, R.G.; Scully, J.R.; Birbilis, N. Corrosion of additively manufactured alloys: A review. Corrosion 2018, 74, 1318–1350. [Google Scholar] [CrossRef] [Green Version]
  30. Zhang, B.; Xiu, M.; Tan, Y.T.; Wei, J.; Wang, P. Pitting corrosion of SLM Inconel 718 sample under surface and heat treatments. Appl. Surf. Sci. 2019, 490, 556–567. [Google Scholar] [CrossRef]
  31. Amin, M.A.; El-Bagoury, N.; Saracoglu, M.; Ramadan, M. Electrochemical and corrosion behavior of cast re-containing inconel 718 alloys in sulphuric acid solutions and the effect of Cl. Int. J. Electrochem. Sci. 2014, 9, 5352–5374. [Google Scholar]
  32. Chen, T.; Nutter, J.; Hawk, J.; Liu, X. Corrosion fatigue crack growth behavior of oil-grade nickel-base alloy 718. Part 1: Effect of corrosive environment. Corros. Sci. 2014, 89, 146–153. [Google Scholar] [CrossRef]
  33. Nutter, J.S.; Chen, T.; Hawk, J.; Liu, X. Effect of aging treatment on pitting corrosion and corrosion fatigue crack propagation behavior of oil-grade alloy 718. In Proceedings of the 8th International Symposium on Superalloy 718 and Derivatives, Hoboken, NJ, USA, 11 November 2014; pp. 643–658. [Google Scholar]
  34. Osoba, L.O.; Oladoye, A.M.; Ogbonna, V.E. Corrosion evaluation of superalloys Haynes 282 and Inconel 718 in Hydrochloric acid. J. Alloys Compd. 2019, 804, 376–384. [Google Scholar] [CrossRef]
  35. Caliari, F.R.; Rosa, E.F.D.; Silva, M.A.D.; Reis, D.A.P. Analysis of pitting corrosion on an Inconel 718 alloy submitted to aging heat treatment. Tecnologia em Metalurgia, Materiais e Mineração 2014, 11, 189–194. [Google Scholar] [CrossRef] [Green Version]
  36. Luo, S.; Huang, W.; Yang, H.; Yang, J.; Wang, Z.; Zeng, X. Microstructural evolution and corrosion behaviors of Inconel 718 alloy produced by selective laser melting following different heat treatments. Addit. Manuf. 2019, 30, 100875. [Google Scholar] [CrossRef]
  37. Klapper, H.S.; Molodtsov, N.; Burns, M.; Wangenheim, C. Critical Factors Affecting the Pitting Corrosion Resistance of Additively Manufactured Nickel Alloy in Chloride Containing Environments. Corrosion 2017, 2017, 1–8. [Google Scholar]
  38. Landeta, D. Performance Analysis of 3d Printed 718 Alloy for Corrosive Environments. Master’s Thesis, University of Manchester, Manchester, UK, 2015. [Google Scholar]
  39. Li, H.; Feng, S.; Li, J.; Gong, J. Effect of heat treatment on the δ phase distribution and corrosion resistance of selective laser melting manufactured Inconel 718 superalloy. Mater. Corros. 2018, 69, 1350–1354. [Google Scholar] [CrossRef]
  40. Jiao, L.; Chua, Z.; Moon, S.; Song, J.; Bi, G.; Zheng, H. Femtosecond Laser Produced Hydrophobic Hierarchical Structures on Additive Manufacturing Parts. Nanomaterials 2018, 8, 601. [Google Scholar] [CrossRef] [PubMed] [Green Version]
  41. Basic Overview of the Working Principle of a Potentiostat/Galvanostat (PGSTAT)-Electrochemical Cell Setup. Metrohm Autolab. BV. 2011. Available online: https://www.metrohm.com/en-gb/applications/AN-EC-008# (accessed on 19 November 2020).
  42. Ni, M.; Chen, C.; Wang, X.; Wang, P.; Li, R.; Zhang, X.; Zhou, K. Anisotropic tensile behavior of in situ precipitation strengthened Inconel 718 fabricated by additive manufacturing. Mater. Sci. Eng. A 2017, 701, 344–351. [Google Scholar] [CrossRef]
  43. Amato, K.N.; Gaytan, S.M.; Murr, L.E.; Martinez, E.; Shindo, P.W. Microstructures and mechanical behavior of Inconel 718 fabricated by selective laser melting. Acta Mater. 2012, 60, 2229–2239. [Google Scholar] [CrossRef]
  44. Xiao, H.; Xie, P.; Cheng, M.; Song, L. Enhancing mechanical properties of quasi-continuous-wave laser additive manufactured Inconel 718 through controlling the niobium-rich precipitates. Addit. Manuf. 2020, 34, 101278. [Google Scholar] [CrossRef]
  45. Tian, Y.; McAllister, D.; Colijn, H.; Mills, M.; Farson, D.; Nordin, M.; Babu, S. Rationalization of microstructure heterogeneity in INCONEL 718 builds made by the direct laser additive manufacturing process. Metall. Mater. Trans. A Phys. Metall. Mater. Sci. 2014, 45, 4470–4483. [Google Scholar] [CrossRef]
  46. Parimi, L.L.; Ravi, G.; Clark, D.; Attallah, M.M. Microstructural and texture development in direct laser fabricated IN718. Mater. Charact. 2014, 89, 102–111. [Google Scholar] [CrossRef]
  47. Stevens, E.L.; Toman, J.; To, A.C.; Chmielus, M. Variation of hardness, microstructure, and Laves phase distribution in direct laser deposited alloy 718 cuboids. Mater. Des. 2017, 119, 188–198. [Google Scholar] [CrossRef] [Green Version]
  48. Hu, Y.L.; Lin, X.; Yu, X.B.; Xu, J.J.; Lei, M.; Huang, W.D. Effect of Ti addition on cracking and microhardness of Inconel 625 during the laser solid forming processing. J. Alloys Compd. 2017, 711, 267–277. [Google Scholar] [CrossRef]
  49. Zhang, D.; Niu, W.; Cao, X.; Liu, Z. Effect of standard heat treatment on the microstructure and mechanical properties of selective laser melting manufactured Inconel 718 superalloy. Mater. Sci. Eng. A 2015, 644, 32–40. [Google Scholar] [CrossRef]
  50. Keller, T.; Lindwall, G.; Ghosh, S.; Ma, L.; Lane, B.M.; Zhang, F.; Kattner, U.R.; Lass, E.A.; Heigel, J.C.; Idell, Y.; et al. Application of finite element, phase-field, and CALPHAD-based methods to additive manufacturing of Ni-based superalloys. Acta Mater. 2017, 139, 244–253. [Google Scholar] [CrossRef] [PubMed]
  51. Kuo, Y.L.; Horikawa, S.; Kakehi, K. The effect of interdendritic δ phase on the mechanical properties of Alloy 718 built up by additive manufacturing. Mater. Des. 2017, 116, 411–418. [Google Scholar] [CrossRef]
  52. Wang, L.; Li, C.; Dong, J.; Zhang, M. An investigation of microsegregation and liquid density redistribution during solidification of inconel 718. Chem. Eng. Commun. 2009, 196, 754–765. [Google Scholar] [CrossRef]
  53. Lindwall, G.; Campbell, C.E.; Lass, E.A.; Zhang, F.; Stoudt, M.R.; Allen, A.J.; Levine, L.E. Simulation of TTT Curves for Additively Manufactured Inconel 625. Metall. Mater. Trans. A Phys. Metall. Mater. Sci. 2019, 50, 457–467. [Google Scholar] [CrossRef] [Green Version]
  54. Gribbin, S.; Ghorbanpour, S.; Ferreri, N.C.; Bicknell, J.; Tsukrov, I.; Knezevic, M. Role of grain structure, grain boundaries, crystallographic texture, precipitates, and porosity on fatigue behavior of Inconel 718 at room and elevated temperatures. Mater. Charact. 2019, 149, 184–197. [Google Scholar] [CrossRef]
  55. Lawitzki, R.; Hassan, S.; Karge, L.; Wagner, J.; Wang, D.; von Kobylinski, J.; Krempaszky, C.; Hofmann, M.; Gilles, R.; Schmitz, G. Differentiation of γ′- and γ″- precipitates in Inconel 718 by a complementary study with small-angle neutron scattering and analytical microscopy. Acta Mater. 2019, 163, 28–39. [Google Scholar] [CrossRef]
  56. Nunes, R.M.; Pereira, D.; Clarke, T.; Hirsch, T.K. Delta phase characterization in inconel 718 alloys through X-ray diffraction. ISIJ Int. 2015, 55, 2450–2454. [Google Scholar] [CrossRef] [Green Version]
  57. Rapp, R.A.; Zhang, Y.S. Hot corrosion of materials: Fundamental studies. JOM 1994, 46, 47–55. [Google Scholar] [CrossRef]
  58. Fontana, M.G. Nomograph of corrosion rates. Ind. Eng. Chem. 1955, 47, 81A–82A. [Google Scholar] [CrossRef]
  59. Abdallah, M.; Jahdaly, A.L.; Salem, M.M.; Fawzy, A.; Abdel Fattah, A.A. Pitting corrosion of nickel alloys and stainless steel in chloride solutions and its inhibition using some inorganic compounds. J. Mater. Environ. Sci. 2017, 8, 2599–2607. [Google Scholar]
  60. Orazem, M.E.; Tribollet, B. An integrated approach to electrochemical impedance spectroscopy. Electrochim. Acta 2008, 53, 7360–7366. [Google Scholar] [CrossRef]
  61. Gramy Instruments Inc. Basics of Electrochemical Impedance Spectroscopy Impedance Values; Gramy Instruments Inc.: Warminster, PA, USA, 2014. [Google Scholar]
  62. Hirschorn, B.; Orazem, M.E.; Tribollet, B.; Vivier, V.; Frateur, I.; Musiani, M. Determination of effective capacitance and film thickness from constant-phase-element parameters. Electrochim. Acta 2010, 55, 6218–6227. [Google Scholar] [CrossRef]
  63. Orazem, M.E.; Pebere, N.; Tribollet, B. Enhanced Graphical Representation of Electrochemical Impedance Data. J. Electrochem. Soc. 2006, 153, B129–B1336. [Google Scholar] [CrossRef]
  64. Orazem, M.E.; Frateur, I.; Tribollet, B.; Vivier, V.; Marcelin, S.; Pébère, N.; Bunge, A.L.; White, E.A.; Riemer, D.P.; Musiani, M. Dielectric Properties of Materials Showing Constant-Phase-Element (CPE) Impedance Response. J. Electrochem. Soc. 2013, 160, C215–C225. [Google Scholar] [CrossRef] [Green Version]
  65. Cheng, Q.; Chen, Z. The Cause Analysis of the Incomplete Semi-Circle Observed in High Frequency Region of EIS Obtained from TEL-Covered Pure Copper. Int. J. Electrochem. Sci. 2013, 8, 8282–8290. [Google Scholar]
  66. Chen, T.; John, H.; Xu, J.; Lu, Q.; Hawk, J.; Liu, X. Influence of surface modifications on pitting corrosion behavior of nickel-base alloy 718. Part 1: Effect of machine hammer peening. Corros. Sci. 2013, 77, 230–245. [Google Scholar] [CrossRef]
  67. Du, D.; Dong, A.; Shu, D.; Zhu, G.; Sun, B.; Li, X.; Lavernia, E. Influence of build orientation on microstructure, mechanical and corrosion behavior of Inconel 718 processed by selective laser melting. Mater. Sci. Eng. A 2019, 760, 469–480. [Google Scholar] [CrossRef]
Figure 1. Schematic of SLM.
Metals 10 01562 g001
Figure 2. Optical microstructure on XY plane in the (a) as-built material (AB), (b) heat-treated as-built material (HT), (c) shot-peened as-built material (SP), and (d) heat-treated and shot-peened as-built material (HTSP).
Metals 10 01562 g002
Figure 3. Optical microstructure on XZ plane in (a) AB, (b) HT, (c) SP, and (d) HTSP.
Metals 10 01562 g003
Figure 4. SEM microstructure of the XZ plane of (a) AB, (b) HT, (c) SP, and (d) HTSP samples.
Metals 10 01562 g004
Figure 5. TEM image of (a) as-cast material and (b) heat-treated material.
Metals 10 01562 g005
Figure 6. (a) XRD peaks of different phases in AB, HT, SP, and HTSP samples, and (b) Peaks of metal carbides (MC) and Laves phases with lesser intensities.
Metals 10 01562 g006
Figure 7. Surface roughness of; (a) AB, (b) HT, (c) SP, and (d) HTSP samples on the surface in the XZ plane.
Metals 10 01562 g007
Figure 8. Tafel curve of SLM IN718 alloys.
Metals 10 01562 g008
Figure 9. Electrochemical Equivalent Circuit (EEC) model circuit for IN718 alloy obtained out of EIS data.
Metals 10 01562 g009
Figure 10. (a) Nyquist plot, (b) Magnified Nyquist plot close to the origin, (c) Bode plot for impedance, (d) Bode plot for phase angle.
Metals 10 01562 g010
Figure 11. Energy-Dispersive Spectroscopy (EDS) analysis of pits in corroded samples: (a) AB, (b) HT, (c) SP, and (d) HTSP. The peak of the elements in corresponding areas and spots marked in yellow colors are presented, mentioning the specific areas and spots.
Metals 10 01562 g011
Table 1. Chemical composition of selective laser melted (SLM) IN718 alloy.
Element NiFeCrNbMoTiAlCSCu
Wt %53.118.6317.654.793.070.860.600.040.030.02
Table 2. Elemental analysis of regions/particles present in the sample.
Weight Percentage of Elements
ElementsNiCrFeAlTiNbMoCOSi
A52.521.419.50.11.32.51.6
B51.721.519.21.53.92.2
C51.221.419.41.54.12.6
D40.017.315.64.01.33.29.85.5
E50.821.519.51.73.82.7
F52.620.618.61.83.71.2
G47.820.218.52.21.73.82.30.82.9
H50.821.519.31.53.52.20.60.7
Table 3. Corrosion rate and pitting potential of SLM IN718 alloy in as-built, heat-treated, and/or shot-peened conditions.
Specimen ConditionEcorr (mV)
(vs. SCE)
Icorr (µA/cm2)Corrosion Rate (mpy)Epit (mV)
(vs. SCE)
AB–200 ± 30.21 ± 0.0020.135 ± 0.06220 ± 18
HT–190 ± 40.08 ± 0.0030.045 ± 0.05330 ± 21
SP–210 ± 30.06 ± 0.0020.031 ± 0.04560 ± 7
HTSP–238 ± 50.04 ± 0.0020.025 ± 0.05570 ± 6
Table 4. Fitted parameters obtained from EIS data.
Sample ConditionsCharacteristic Frequency (fc) HzRs
(Ω cm2)
R1
(kΩ cm2)
Yo of CPE1
−1 cm−2 sα)
α of CPE1R2
(kΩ cm2)
Yo of CPE2
−1 cm−2 sα)
α of CPE2Impedance of the Film (R1+R2)
kΩ cm2
AB0.00829.5 ± 0.21.6 ± 0.7175 × 10−60.92234 ± 1157 × 10−60.86235.6
HT0.00431.3 ± 0.33.7 ± 0.978 × 10−60.92407 ± 3357 × 10−60.87410.7
SP0.00328.9 ± 0.33.9 ± 0.329 × 10−60.89558 ± 6063 × 10−60.88561.9
HTSP0.00333.5 ± 0.26.2 ± 1.051 × 10−60.87676 ± 8141 × 10−60.86682.2
Publisher’s Note: MDPI stays neutral with regard to jurisdictional claims in published maps and institutional affiliations.

