Article

Constitutive Equation and Hot Processing Map of a Nitrogen-Bearing Martensitic Stainless Steel

1
College of Materials Science and Engineering, Taiyuan University of Technology, Taiyuan 030024, China
2
State Key Laboratory of Advanced Stainless Steel Materials, Taiyuan 030003, China
3
College of Materials Science and Engineering, Taiyuan University of Science and Technology, Taiyuan 030024, China
*
Authors to whom correspondence should be addressed.
Metals 2020, 10(11), 1502; https://doi.org/10.3390/met10111502
Submission received: 29 September 2020 / Revised: 1 November 2020 / Accepted: 6 November 2020 / Published: 11 November 2020
(This article belongs to the Section Metal Casting, Forming and Heat Treatment)

Abstract

:
The hot deformation behavior of a nitrogen-bearing martensitic stainless steel was researched by the isothermal compression test in the temperature range of 950–1150 °C and strain rate range of 0.01–10 s−1 with a Gleeble-3800 thermal-mechanical simulating tester. A strain compensated sine-hyperbolic Arrhenius-type constitutive equation was developed to describe the relationship between true stress and deformation parameters such as temperature, strain rate and true strain. The hot deformation activation energy is calculated to be from 407 to 487 KJ mol−1. It is validated by the standard statistical parameters that the established constitutive equation can accurately predict the true stress. The processing maps at different true strains were constructed based on the dynamic material model (DMM) and the true stress data obtained from the hot compression tests. Two unstable regions which should be avoided during hot working were observed from the processing map. In addition, the optimum hot working parameters are located in the domain of 1000–1150 °C/0.1–1 s−1 with the peak power dissipation efficiency of 39.9%, in which complete dynamic recrystallization (DRX) occurs.

1. Introduction

Martensitic stainless steels (MSSs) generally possess high hardness and appropriate corrosion resistance, so they are widely applied to machine parts in contact with seawater, bearings used in aerospace, knives and scissors for food contact, medical equipment, etc. [1]. The two most important alloying elements of the conventional MSSs are chromium and carbon, where chromium makes steel stainless while carbon imparts solid solution strengthening. However, as chromium has a strong affinity for carbon, coarse carbides such as M7C3 or M23C6 can easily form during the manufacturing process of MSSs. These large chromium carbides not only reduce toughness and fatigue life, but also deteriorate localized corrosion resistance and thus pose a potential risk for people’s health [2,3,4]. In order to resolve these problems, nitrogen as an important alloying element has been applied to MSSs. Nitrogen is conventionally used in austenitic and duplex stainless steels for its relatively high solubility in these steels. The addition of nitrogen can significantly improve the corrosion resistance and mechanical properties of these steels [5,6]. However, due to the limited solubility of nitrogen in MSSs, it is very difficult to manufacture nitrogen-bearing MSSs under ambient pressure. There are several approaches to solve this problem, such as alloying with elements (e.g., Cr, Mo and Mn, etc.) which can increase the solubility of nitrogen, employing pressurized metallurgy, powder metallurgy and surface nitriding etc. [7]. With the development of these techniques, many nitrogen-bearing MSSs and high nitrogen MSSs have been developed [8,9,10]. The addition of nitrogen into MSSs can inhibit the austenite grain growth, refine chromium carbides, fend off δ-ferrite, avoid eutectic carbides and impart solid solution, thus can increase toughness, fatigue life and corrosion resistance of MSSs [11,12,13]. In recent years, a new nitrogen-bearing martensitic stainless steel modified from SUS420J1 was developed. Compared with the conventional SUS420J1 MSS, the modified steel has a lower carbon content and a higher nitrogen content which makes it possess lower metal release rate and comparable quenching hardness with SUS420J1. Therefore, the new developed steel is widely used to replace SUS420J1 to make knives and scissors for food contact.
In the past few years, research into this nitrogen-bearing martensitic stainless steel were mainly focused on its cold rolling and heat treatment processes [14,15]. However, little work has been done on the investigation of the hot working process of this steel. Hot working such as forging and hot rolling is a very important process during the manufacturing of nitrogen-bearing martensitic stainless steels. Through the study of the hot deformation behavior, the appropriate hot working window can be achieved, thus the optimum microstructure and properties can be attained and the forming defects can be avoided. Therefore, it is of great importance to research the hot deformation behavior of the modified steel. For its accuracy and practicability, the Arrhenius-type constitutive equation, which is a phenomenological constitutive model, has been widely used to describe the correlation between true stress and hot working parameters such as strain rate, temperature and true strain for many different alloys and metals [16,17]. This equation can also be inputted into computer code to model the material’s response to specific hot working conditions. Moreover, a processing map (PM), proposed by Prasad et al. and based on DMM, is a convenient and powerful tool to optimize the process parameters and evaluate the deformation mechanisms during the hot deformation process [18]. This technique has been successfully adopted in many metals, such as alloys of magnesium, titanium, nickel-based alloys and steels [19,20,21]. In recent years, many researchers have studied the hot deformation behavior of stainless steels including AISI 304, AISI 410, AISI 420, etc., [22,23,24] by using PM technology based on a hot compression test. Through this research, the optimized hot working parameters, hot deformation mechanisms and the unstable flow regions of these alloys were determined.
The aim of the present paper is to investigate the hot deformation behavior of the nitrogen-bearing martensitic stainless steel. The strain-compensated Arrhenius-type constitutive equations which are used to model the true stress under different hot deformation conditions were established and examined. In addition, the processing maps at different true strains were also constructed, and the optimum hot working parameters and the unstable flow regions were determined according to the processing maps and microstructure observation.

2. Materials and Methods

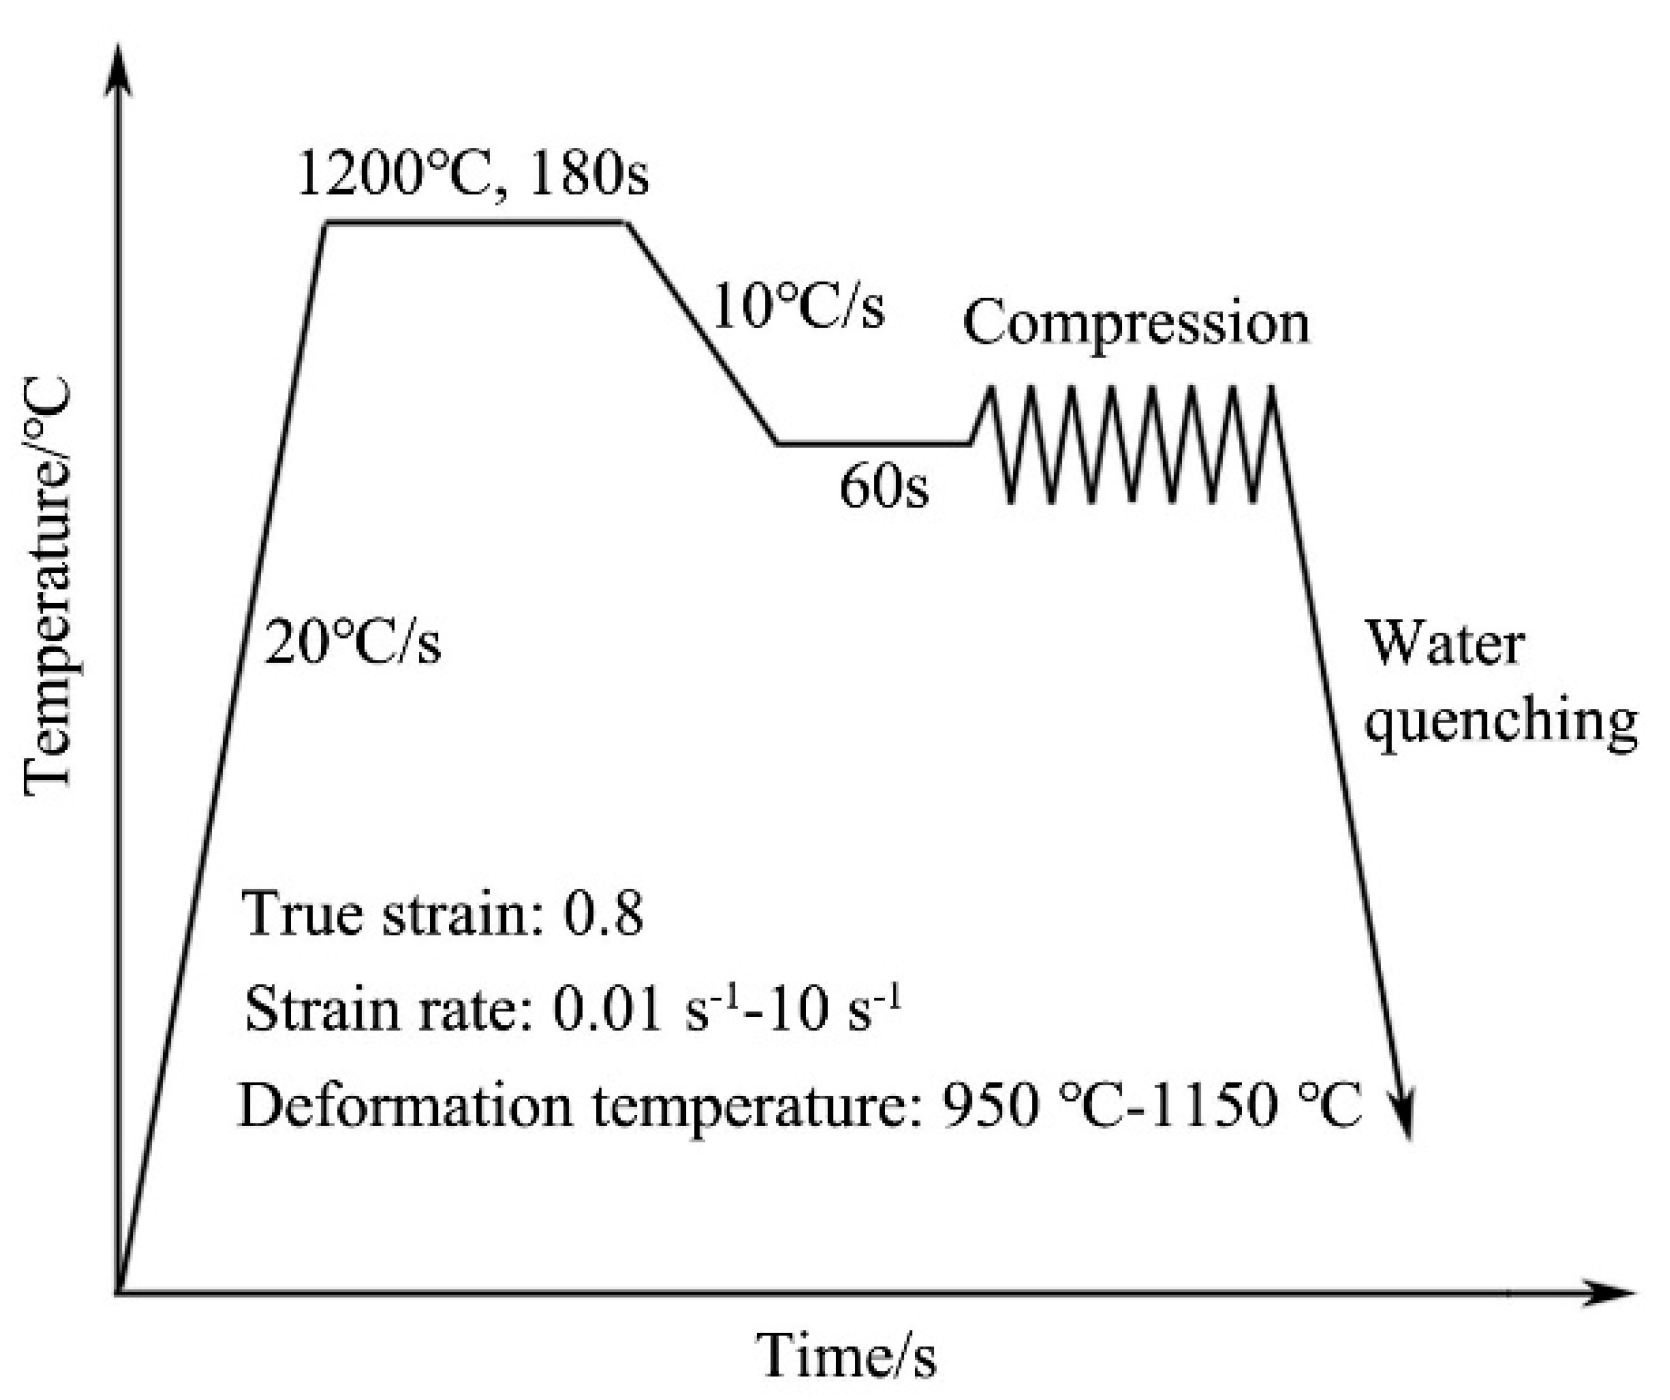
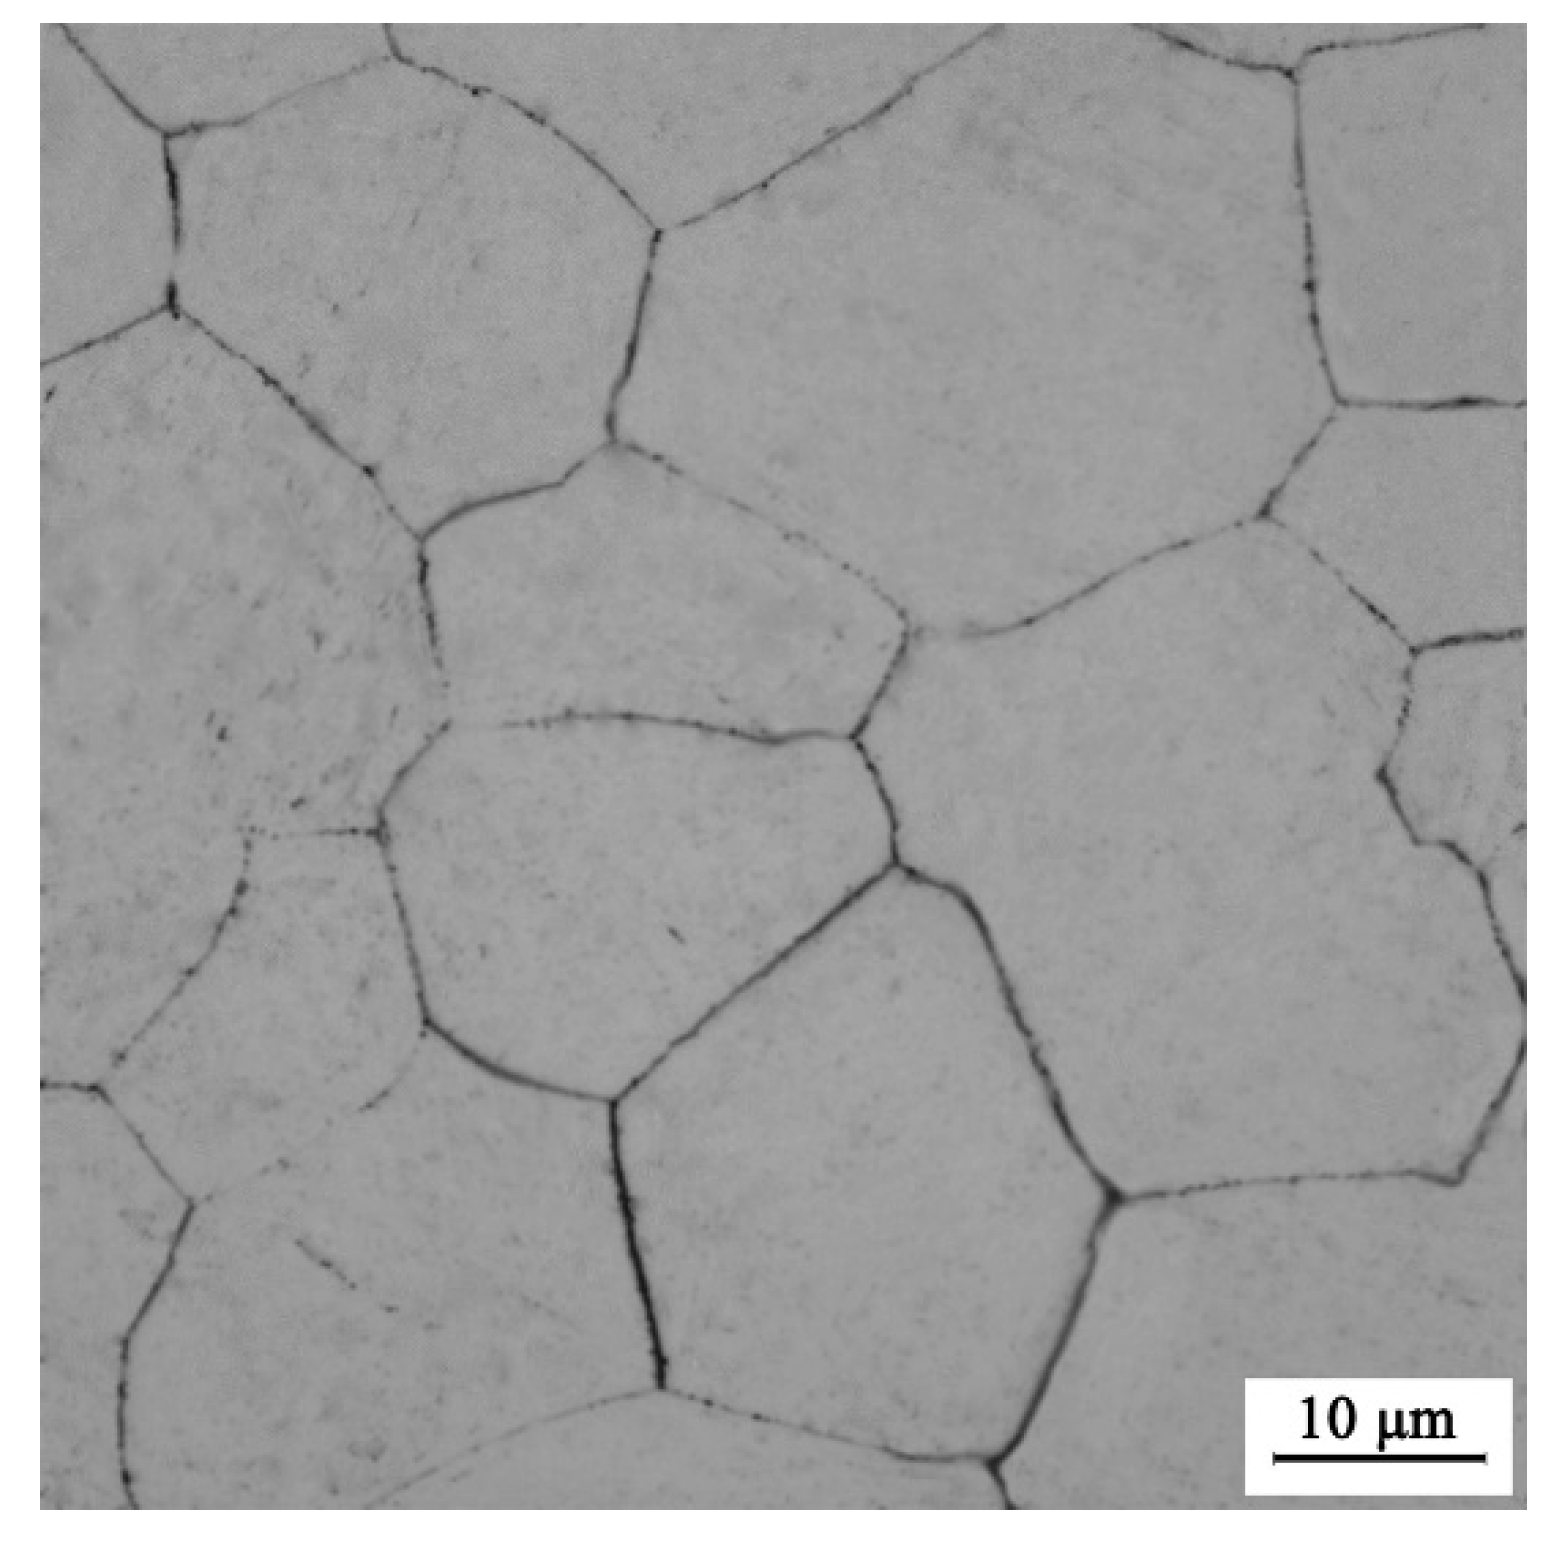
The material used in this study was the nitrogen-bearing martensitic stainless steel with the chemical composition (wt%) of 0.14C, 0.42Si, 0.57Mn, 0.017P, 0.001S, 13.64Cr, 0.078N and the balance Fe. The phase diagram of the experimental steel calculated by Thermo-Calc software (5.0.1.58, Thermo-Calc Software, Solna, Sweden) is shown in Figure 1. It can be seen that the A3 point of the experimental steel was about 925 °C, and the single austenite phase region was in the temperature range of 925–1216 °C. The experimental steel was melted by argon oxygen decarburization (AOD) furnace and ladle furnace (LF), after which the slab was hot rolled in the temperature range of 1100–1200 °C into a plate with the thickness of 33 mm. The plate was machined into the cylindrical hot compression specimens with the diameter of 10 mm and the height of 15 mm. A Gleeble-3800 thermal-mechanical simulating tester (Dynamic Systems Inc., El Segundo, CA, USA) was used for the hot compression test. To minimize the friction during compression, graphite foils with the thickness of 0.25 mm were positioned between the specimens and anvils. As can be seen in Figure 2, specimens were first reheated to 1200 °C at the heating rate of 20 °C/s and held for 180 s to obtain a homogeneous initial microstructure. As indicated in Figure 3, the microstructure, after soaking at 1200 °C for 180 s, was composed of uniform equiaxed grains with a mean grain size of 28 μm. After that the specimens were cooled to deformation temperature at a cooling rate of 10 °C/s and held for 60 s to eliminate the temperature gradient. The compression tests were performed at deformation temperatures between 950–1150 °C with intervals of 50 °C and strain rates ranging from 0.01 to 10 s−1 with intervals of an order of magnitude. A total true strain of 0.8 was applied for the isothermal compression tests. After hot compression, the specimens were immediately quenched into water to preserve the hot deformed microstructures.
The deformed specimens were cut open from the compression axis and the metallographic observation surfaces were prepared by standard mechanical grinding and polishing procedures. The polished surfaces were etched by the solution composed of supersaturated picric acid together with a few drops of hydrochloric acid and observed with an optical microscope (Leica DM4000 M LED, Leica Microsystems Inc., Wetzlar, Germany) at the center of the section. The grain sizes were measured by the linear intercept method regulated in the standard of ASTM: E 112–12. The fine structures of the deformed specimens were further observed by a JEM-2100 transmission electron microscope (JEOL, Tokyo, Japan) operated at 200 kV. Thin foils used for transmission electron microscopy (TEM) examination were prepared firstly by grinding to a thickness of 0.05 mm, then thinned using a twin-jet technique in an electrolyte solution consisted of 6% perchloric acid and 94% ethanol, during which the electrolyte solution was maintained at the temperature of −30 °C.

3. Results and Discussion

3.1. Flow Curves

The typical true stress−true strain curves of the experimental steel under different hot deformation conditions are shown in Figure 4. It can be seen that deformation temperature and strain rate had a significant effect on true stress and hot deformation behavior. True stress increased with increasing strain rate (Figure 4a) under a given deformation temperature, while it decreased with increasing deformation temperature at a given strain rate (Figure 4b). This is because the higher temperature increases the vacancy diffusion rate, the mobility of dislocation and grain boundary which are beneficial for the nucleation and growth of DRX grains, and the lower strain rate can provide a longer time for energy accumulation thus reducing the true stress [25]. According to Figure 4, the shape of the true stress curves can be roughly divided into two groups: (1) at the lower strain rates (less than 1 s−1), true stress increased to a peak at small strain, after which it continuously decreased, which indicated the occurrence of DRX [26]; (2) at the strain rates no less than 1 s−1, true stress increased rapidly at the initial deformation stage and then gradually reached a steady state without any notable peak stress, which was a result of the dynamic recovery (DRV) mechanism. The reason for this is that under the higher strain rates, not enough time is provided for the movement of grain boundaries and dislocations, therefore inhibiting the completion of nucleation and the growth of DRX grains.

3.2. Constitutive Equation

3.2.1. Calculation of the Material Constants

Constitutive equations are generally used to describe the relationship between true stress and hot deformation conditions such as deformation temperature and strain rate. The Arrhenius-type constitutive equation is one of them which has been widely used for high temperature deformation because of its high accuracy [27,28]. In addition, the Zener−Hollomon parameter, which refers to the temperature-compensated strain rate, can also be applied to express the effect of deformation temperature and strain rate on the hot deformation behavior [29]. The following Equations are applied to calculate the material constants and hot deformation activation energy of the experimental steel in this paper:
ε ˙ = A 1 σ n 1 exp ( Q R T ) ( α σ < 0.8 )
ε ˙ = A 2 exp ( β σ ) exp ( Q R T ) ( α σ > 1.2 )
ε ˙ = A [ sin h ( α σ ) ] n exp ( Q R T ) ( for all σ )
Z = ε ˙ exp ( Q R T )
where T is the deformation temperature (K), ε ˙ is the strain rate (s−1), σ is the true stress (MPa), R is the universal gas constant (8.314 J·mol−1·K−1), Q is the hot deformation activation energy (KJ·mol−1), A1, n1, A2, β, A, α and n are the material constants, and α = β/n1, Z is the Zener−Hollomon parameter. According to previous research [30,31], the power law expression of true stress in Equation (1) is generally used for the low stress level, conversely the exponential law in Equation (2) is preferred for the high stress level, while the hyperbolic sine law in Equation (3) is suitable for all the stress levels. In the present study, the hyperbolic sine law in Equation (3) is applied for the description of the hot deformation behavior of the experimental material.
To calculate the material constants and hot deformation activation energy, the characteristic stresses such as peak stress, steady stress or the stress at a certain strain can be used [32]. As can be seen in Equations (1)–(4), the effect of deformation strain on true stress is not taken into account. However, the material constants in the constitutive equations and the true stress are also influenced by true strain [27,33], so the stress corresponding to a given true strain is adopted in this paper to determine the material constants. As an example, the stresses at the true strain of 0.2 under different strain rates and deformation temperatures are substituted into Equations (1)–(4) to establish the constitutive equation.
For the low stress level and high stress level, taking natural logarithm on both sides of Equations (1) and (2), the following equations can be yielded:
ln ε ˙ = ln A 1 + n 1 ln σ ( Q R T )
ln ε ˙ = ln A 2 + β σ ( Q R T )
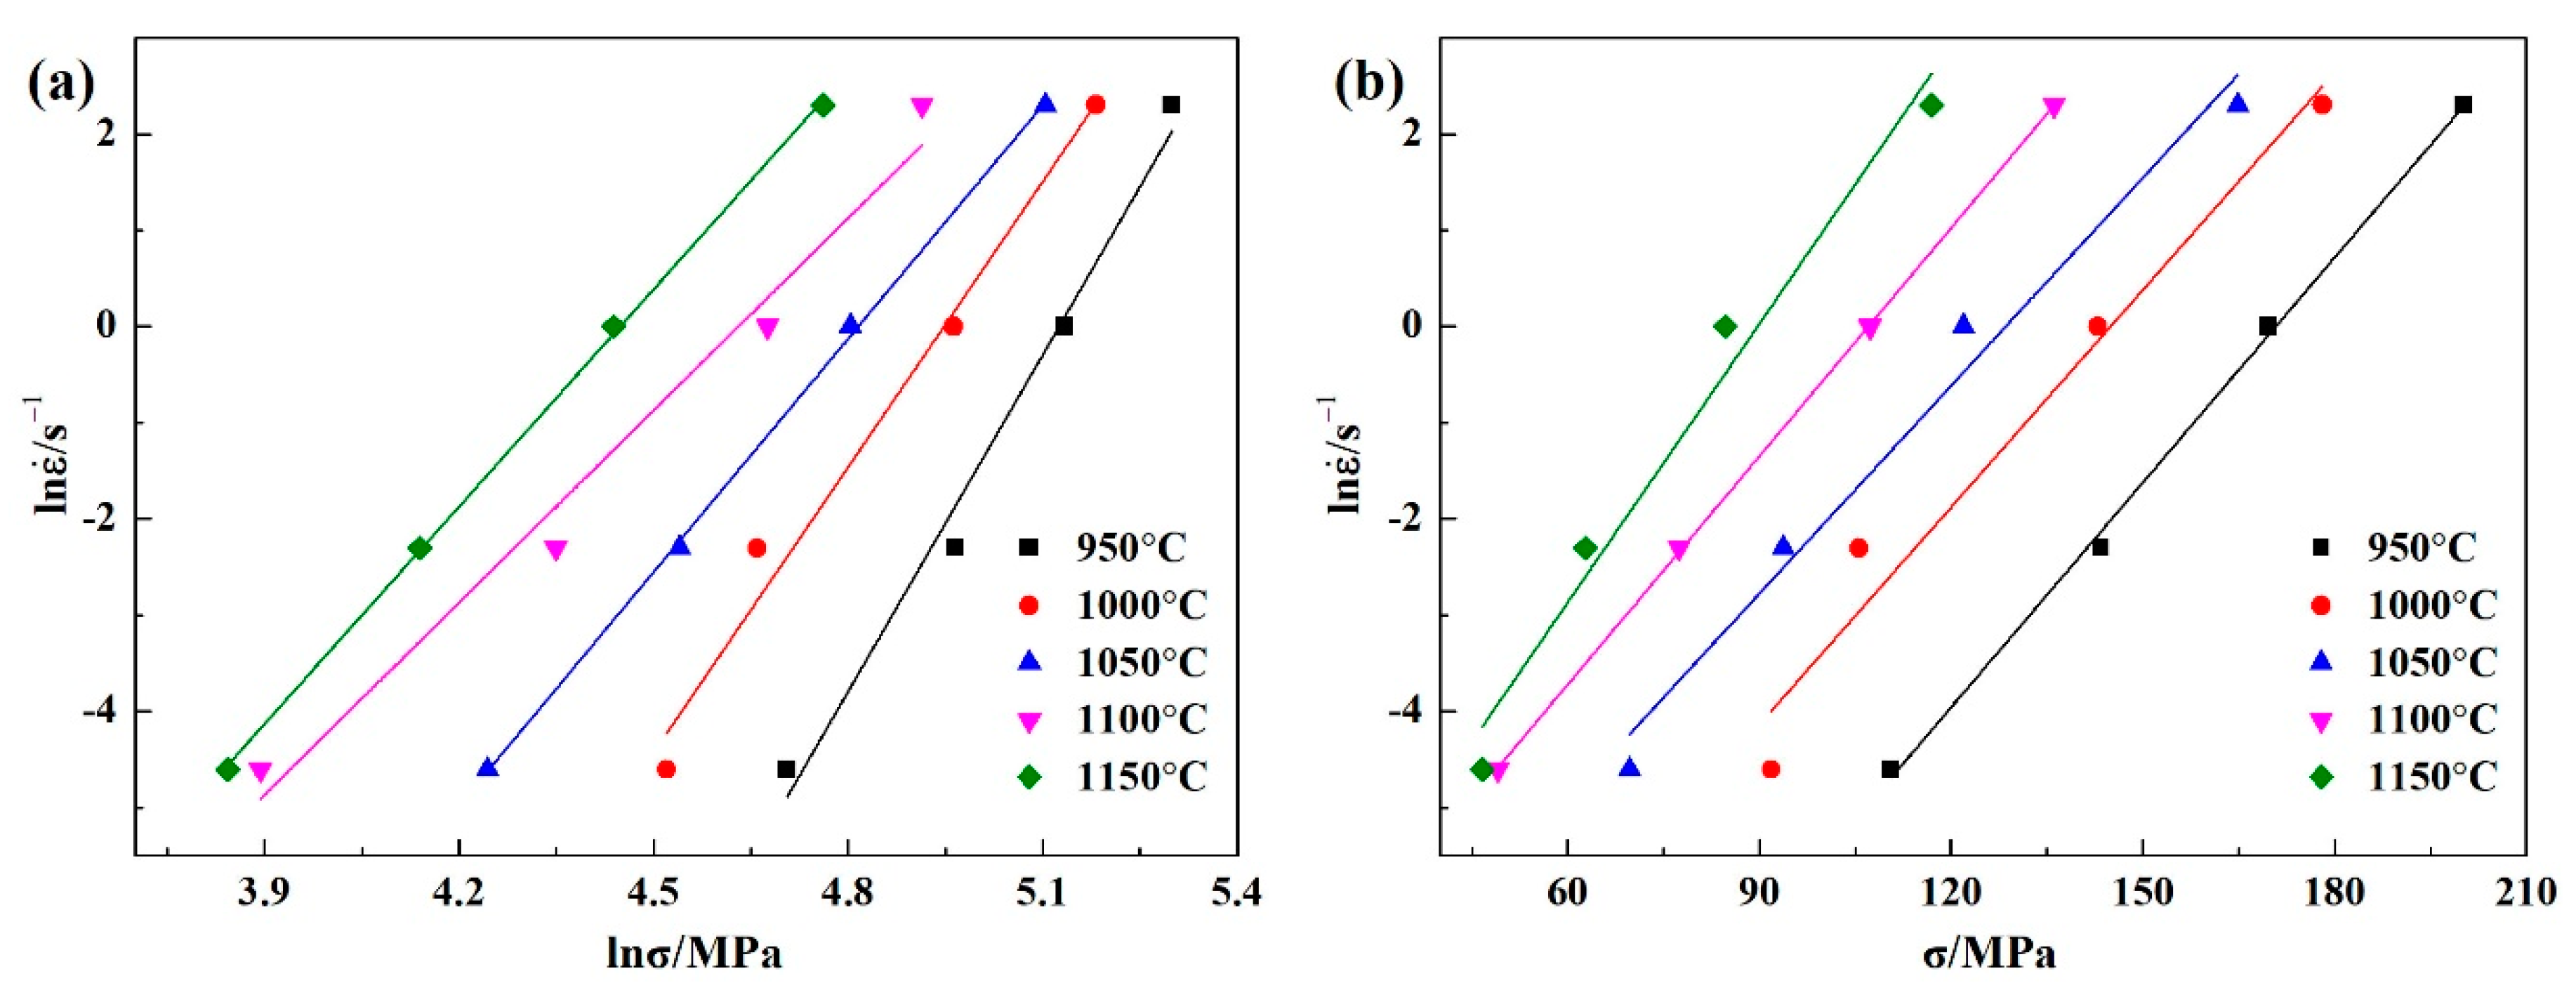
According to Equations (5) and (6), it can be seen that n1 = ln ε ˙ / lnσ and β = ln ε ˙ / σ. Substituting the true stresses and strain rates at the true strain of 0.2 under different deformation temperatures into Equations (5) and (6), the plots of lnσ-ln ε ˙ and σ-ln ε ˙ can be drawn respectively (Figure 5a,b). The lines which linear fitted in these plots are almost parallel with each other, which suggests that the temperature has a little effect on the correlation between strain rate and true stress. Therefore, the mean values of the slopes of these lines can be taken as the values of n1 and β, which are calculated to be 8.765 and 0.080 MPa−1, respectively, and the value of the material constant α = β/n1 = 0.009147 MPa−1.
For all the stress levels (including low stress level and high stress level), taking natural logarithm on both sides of Equation (3), gives:
ln ε ˙ = ln A + n ln [ sinh ( α σ ) ] ( Q R T )
at a given deformation temperature, n can be obtained by differentiating Equation (7) as follows:
n = { ln ε ˙ ln [ sin h ( α σ ) ] } | T
and for a given strain rate, the hot deformation activation energy Q can be calculated by differentiating Equation (7) as follows:
Q = { n R ln [ sin h ( α σ ) ] ( 1 T ) } | ε ˙
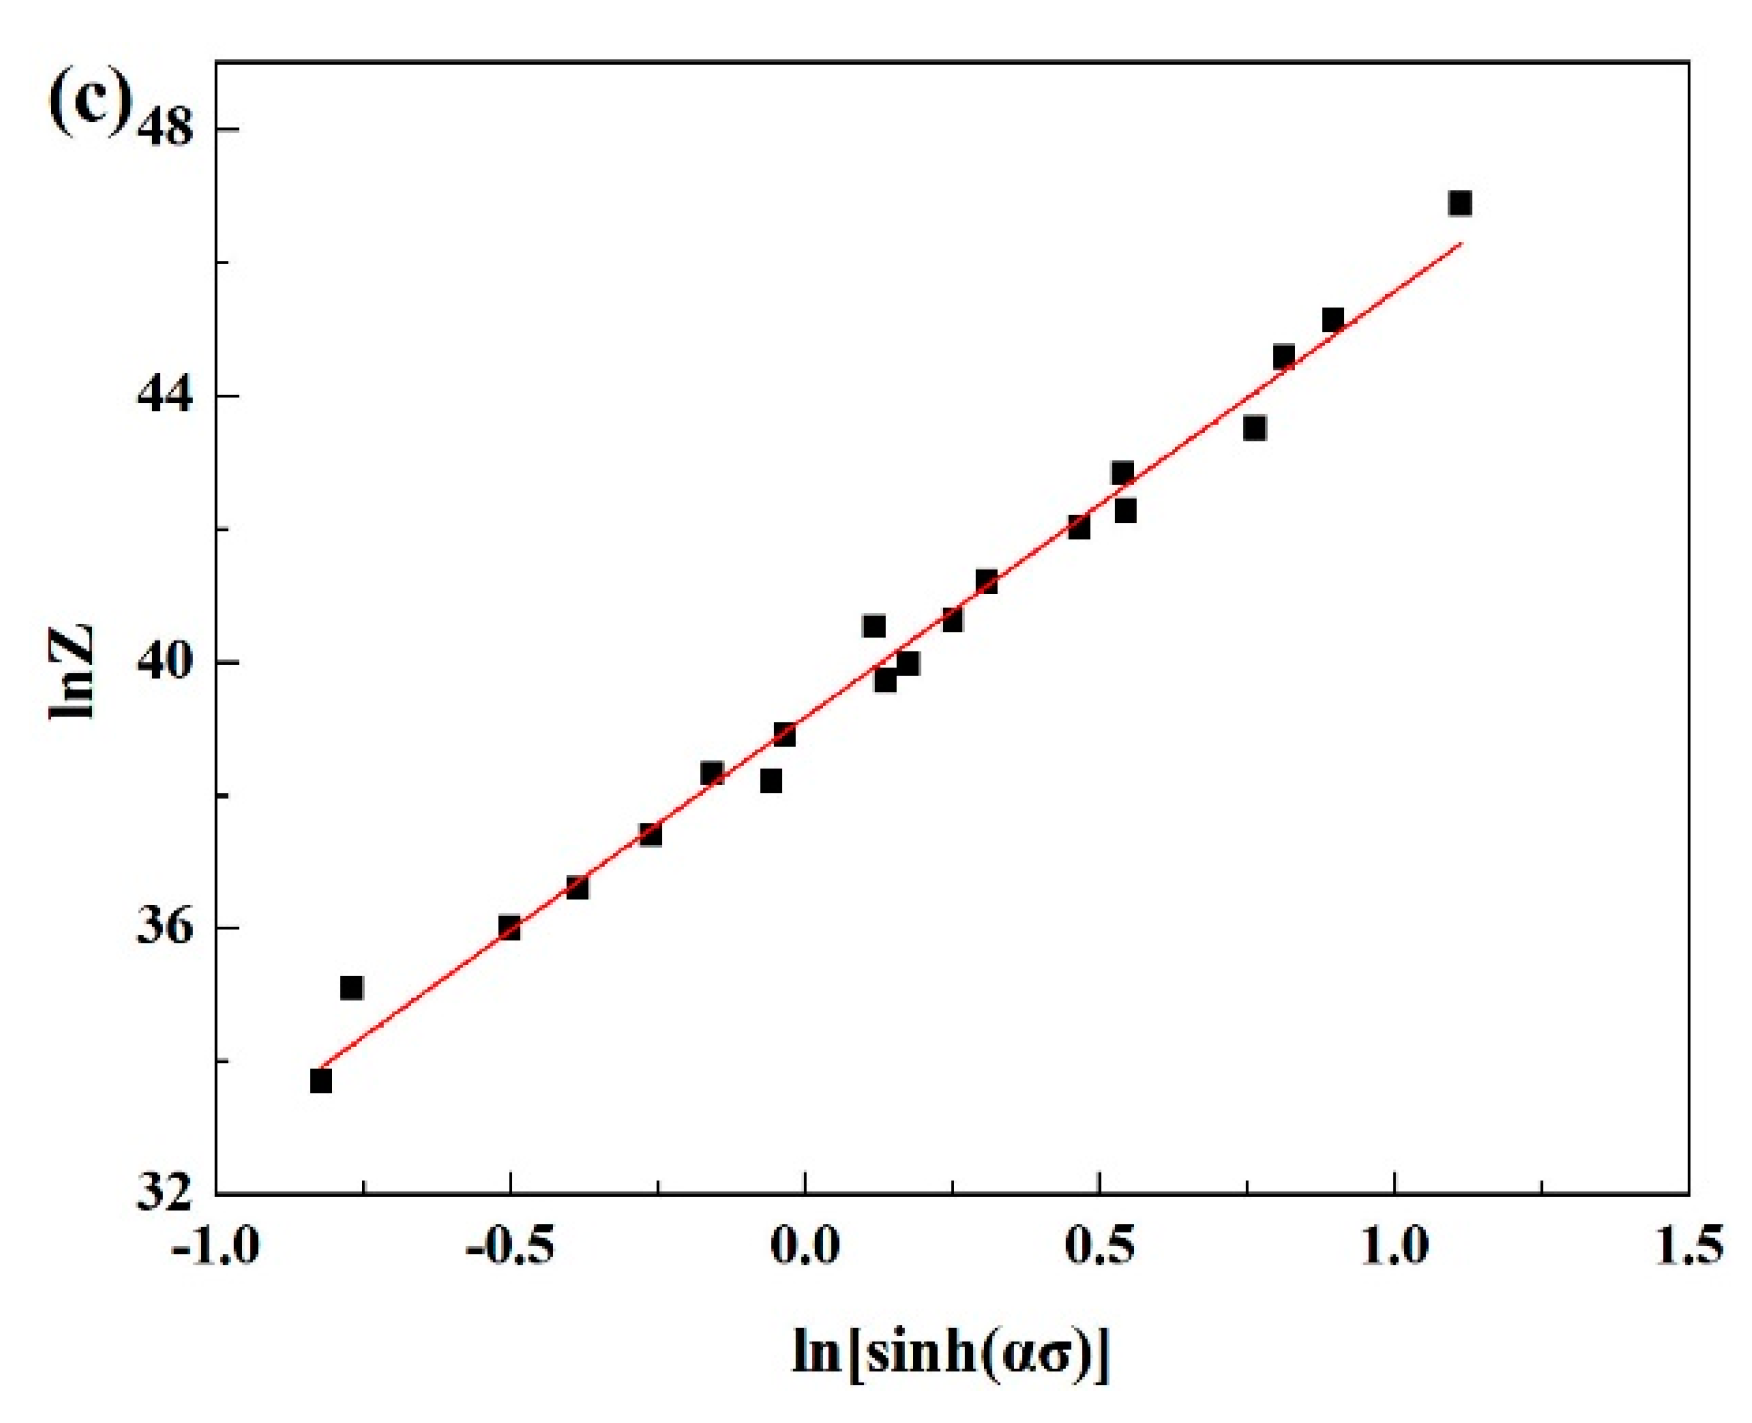
According to Equations (8) and (9), the correlations of ln[sinh(ασ)]–ln ε ˙ and 1/T–ln[sinh(ασ)] can be plotted, as shown in Figure 6a,b, respectively. The value of material constant n which is calculated from the mean slopes of the regression straight lines of ln[sinh(ασ)]–ln ε ˙ is 6.471. Similarly, according to the value of material constant n and the mean slopes of regression straight lines of 1/T-ln[sinh(ασ)], the value of Q can be computed as 453 kJ mol−1. Based on Equations (3) and (4), lnA can be determined by the interception of the linear regression straight line of ln[sinh(ασ)]–lnZ (Figure 6c) which is 39.16, then the material constant A is 1.016 × 10¹⁷.

3.2.2. Strain Compensation and Constitutive Equation

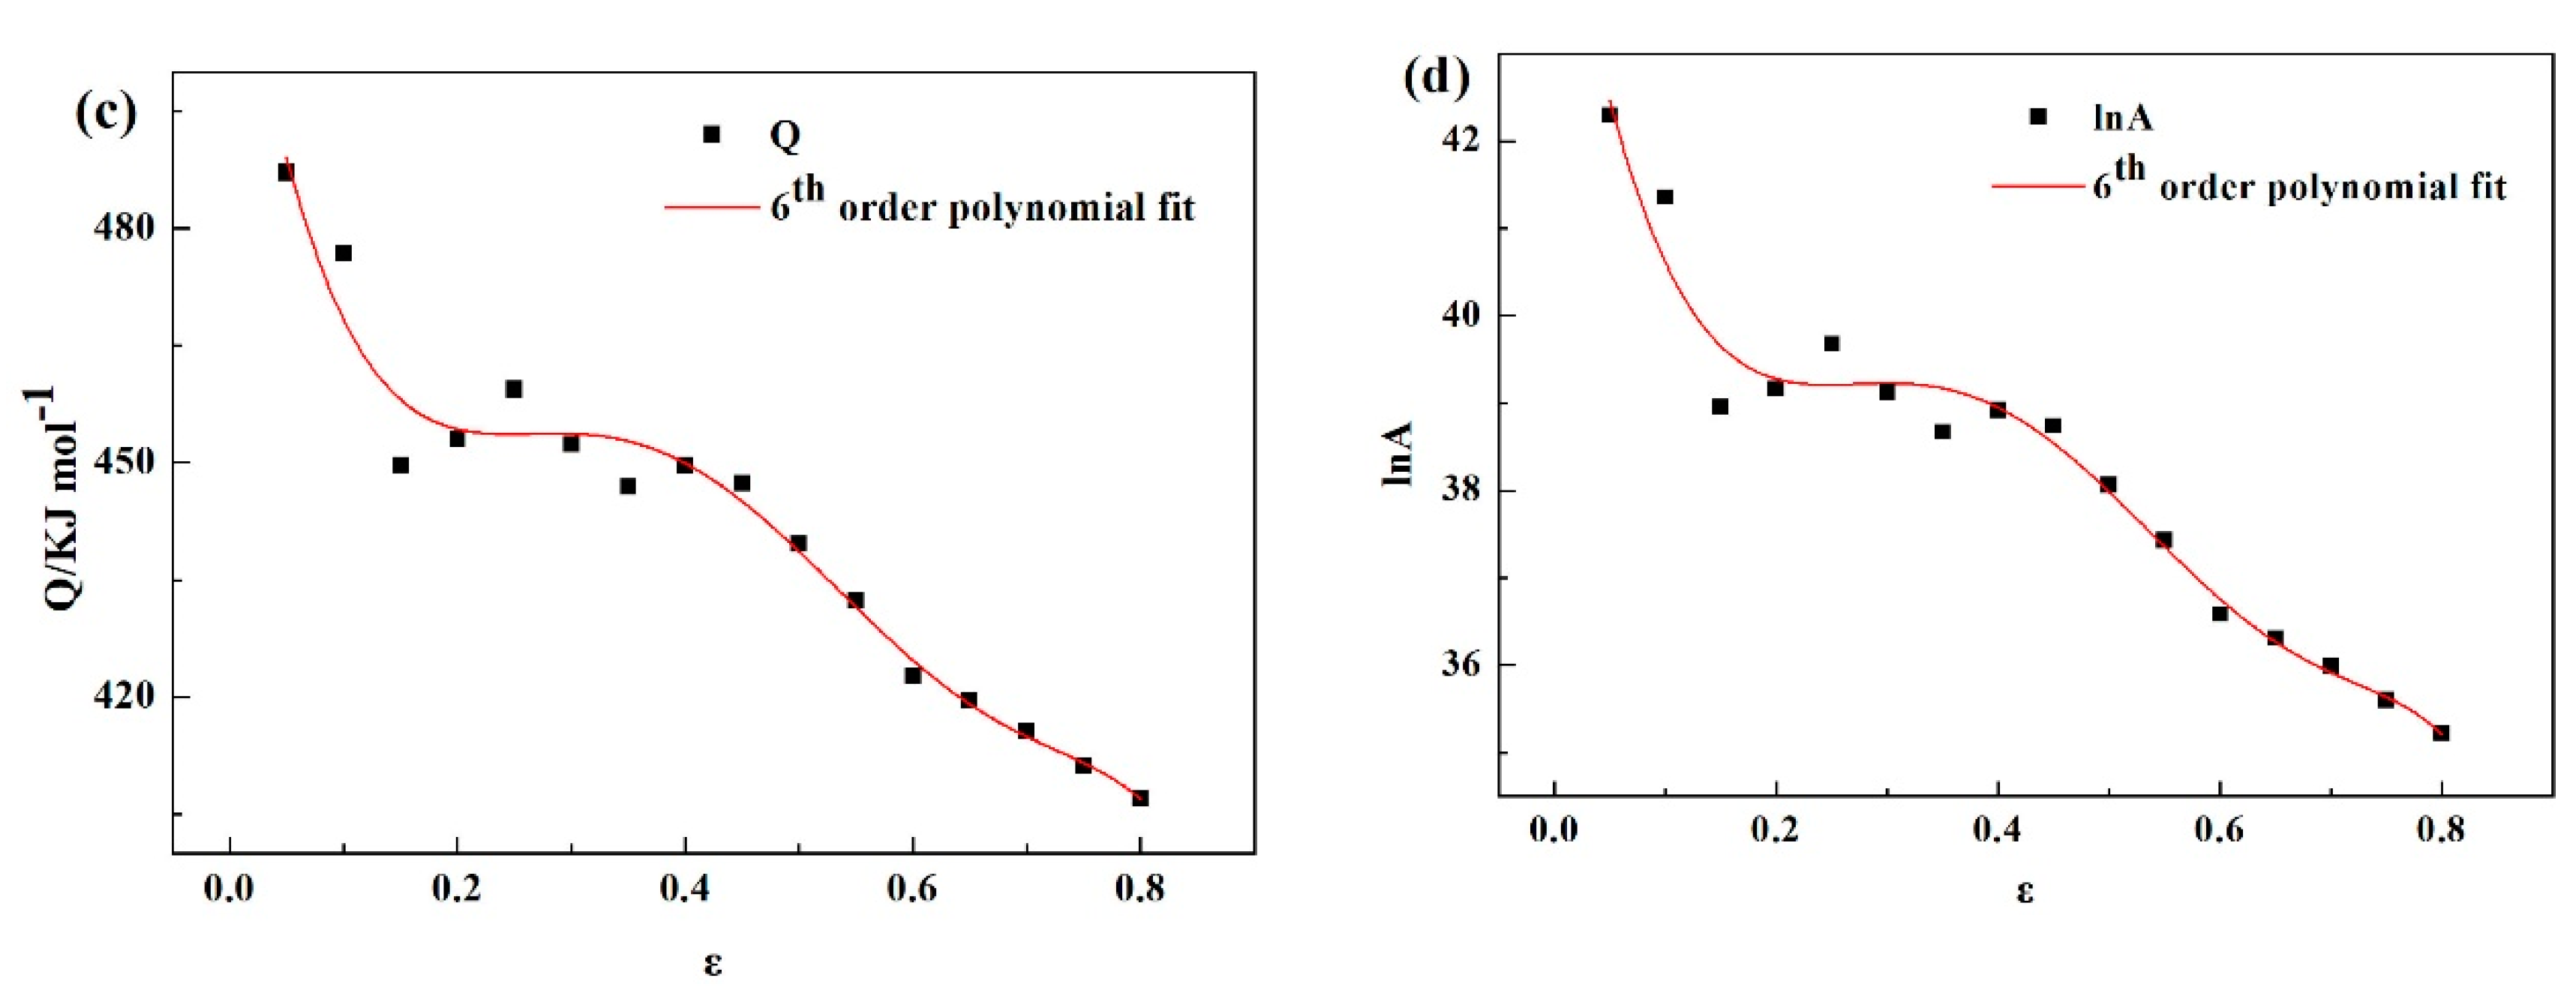
As aforementioned, the hot deformation activation energy, material constants and true stress are significantly affected by true strain. Therefore, in order to predict the true stress more accurately, it is necessary to compensate the constitutive equations with true strain. In this study, the hot deformation activation energy and material constants under different true strains between 0.05 to 0.8 with an interval of 0.05 were calculated by the method mentioned above. The relationships between these constitutive equation parameters and true strain are plotted in Figure 7. As Figure 7 shows, the values of n and Q decrease with the increase of true strain. The decreasing trend of the value of n indicates that the hot workability of the tested steel becomes better when true strain increases [34]. The decreasing trend of the value of Q suggests that it is difficult for the material to deform at the lower true strains, however, with the increase of true strain, the softening mechanisms (such as DRV or DRX) begin to occur [35]. The calculated values of Q for different true strains are between 407 to 487 KJ mol−1, the average value of which is 442 KJ mol−1. This value is similar to that of other 13% Cr MSSs, such as AISI 420 (362–435 KJ mol−1) and AISI 410S (413 KJ mol−1), and austenitic stainless steels such as AISI 304 (380 KJ mol−1) [36,37,38], etc.
The sixth order polynomials were employed to fit the relationships of these material constants and true strain and the fitting results are shown in Equations (10)–(13), the parameters in these equations are listed in Table 1. According to Equations (3) and (4), the true stress can be expressed by a function of the Zener−Hollomon parameter at a given true strain (ε), this function is shown in Equation (14). Then the material constants at a certain true strain determined by Equations (10)–(13) can be substituted into Equation (14) and the true stress under a given true strain can be determined.
α = B0 + B1ε + B2ε2 + B3ε3 + B4ε4 + B5ε5 + B6ε6
n = C0 + C1ε + C2ε2 + C3ε3 + C4ε4 + C5ε5 + C6ε6
Q = D0 + D1ε + D2ε2 + D3ε3 + D4ε4 + D5ε5 + D6ε6
lnA = E0 + E1ε + E2ε2 + E3ε3 + E4ε4 + E5ε5 + E6ε6
σ = ( 1 / α ( ε ) ) ln { ( Z ( ε ) A ( ε ) ) 1 n ε + [ ( Z ( ε ) A ( ε ) ) 2 n ε + 1 ] 1 / 2 }

3.2.3. Examination of the Constitutive Equation

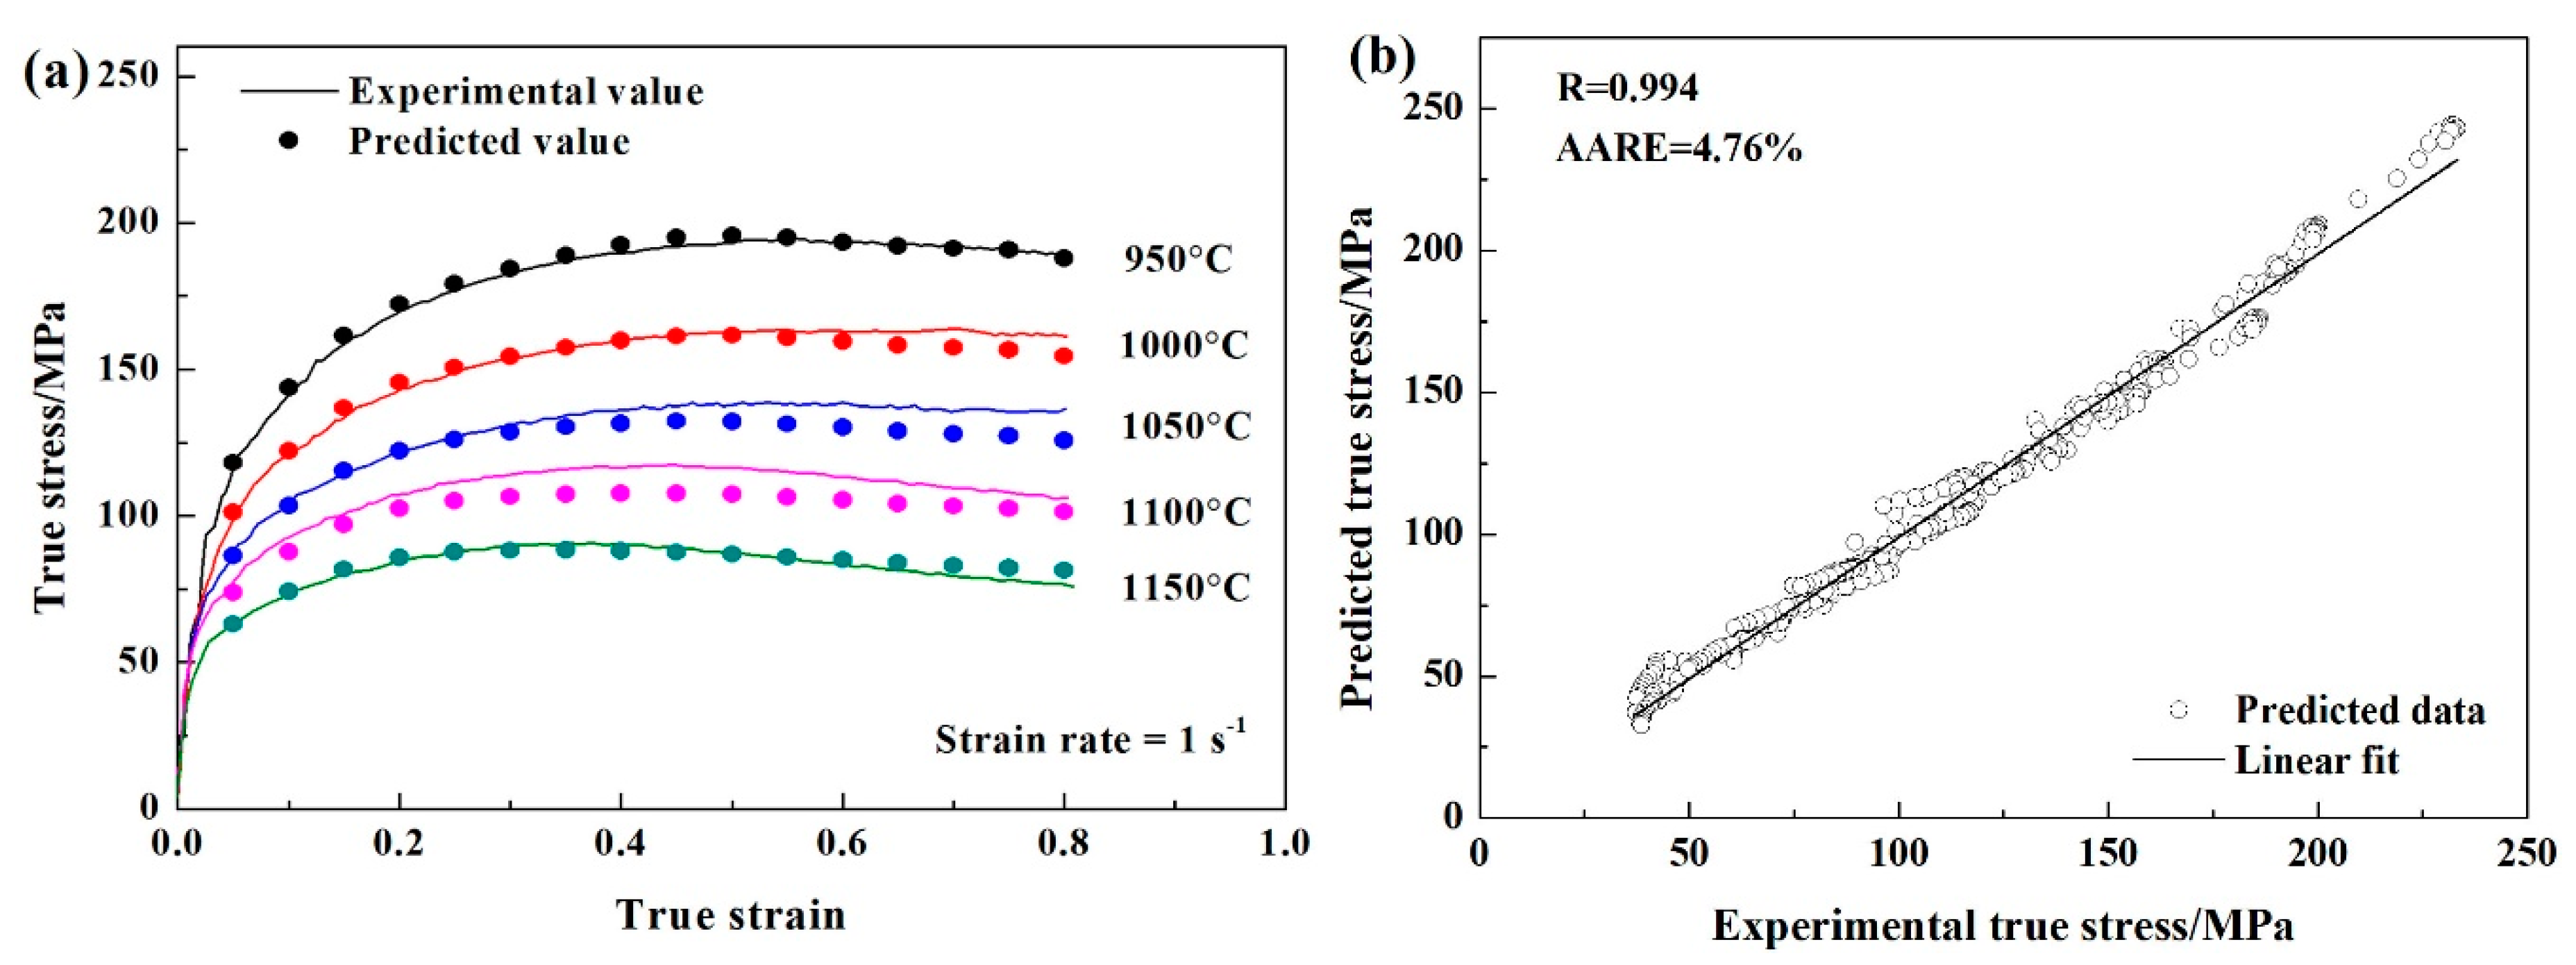
The true stress values obtained from the hot compression experiment at the strain rate of 1 s−1 and the predicted data calculated by the developed constitutive equation were compared to examine the accuracy of the constitutive equation, the comparison result is shown in Figure 8a. The figure indicates that the predicted true stresses fitted well with the experimental data. Two standard statistical parameters (i.e., correlation coefficient (R) and average absolute relative error (AARE)) were adopted to further evaluate the accuracy of the proposed constitutive equation. These parameters are expressed by the following equations:
R = i = 1 N ( σ e i σ ¯ e ) ( σ p i σ ¯ p ) i = 1 N ( σ e i σ ¯ e ) 2 ( σ p i σ ¯ p ) 2
AARE = 1 N i = 1 N | σ e i σ p i σ e i |
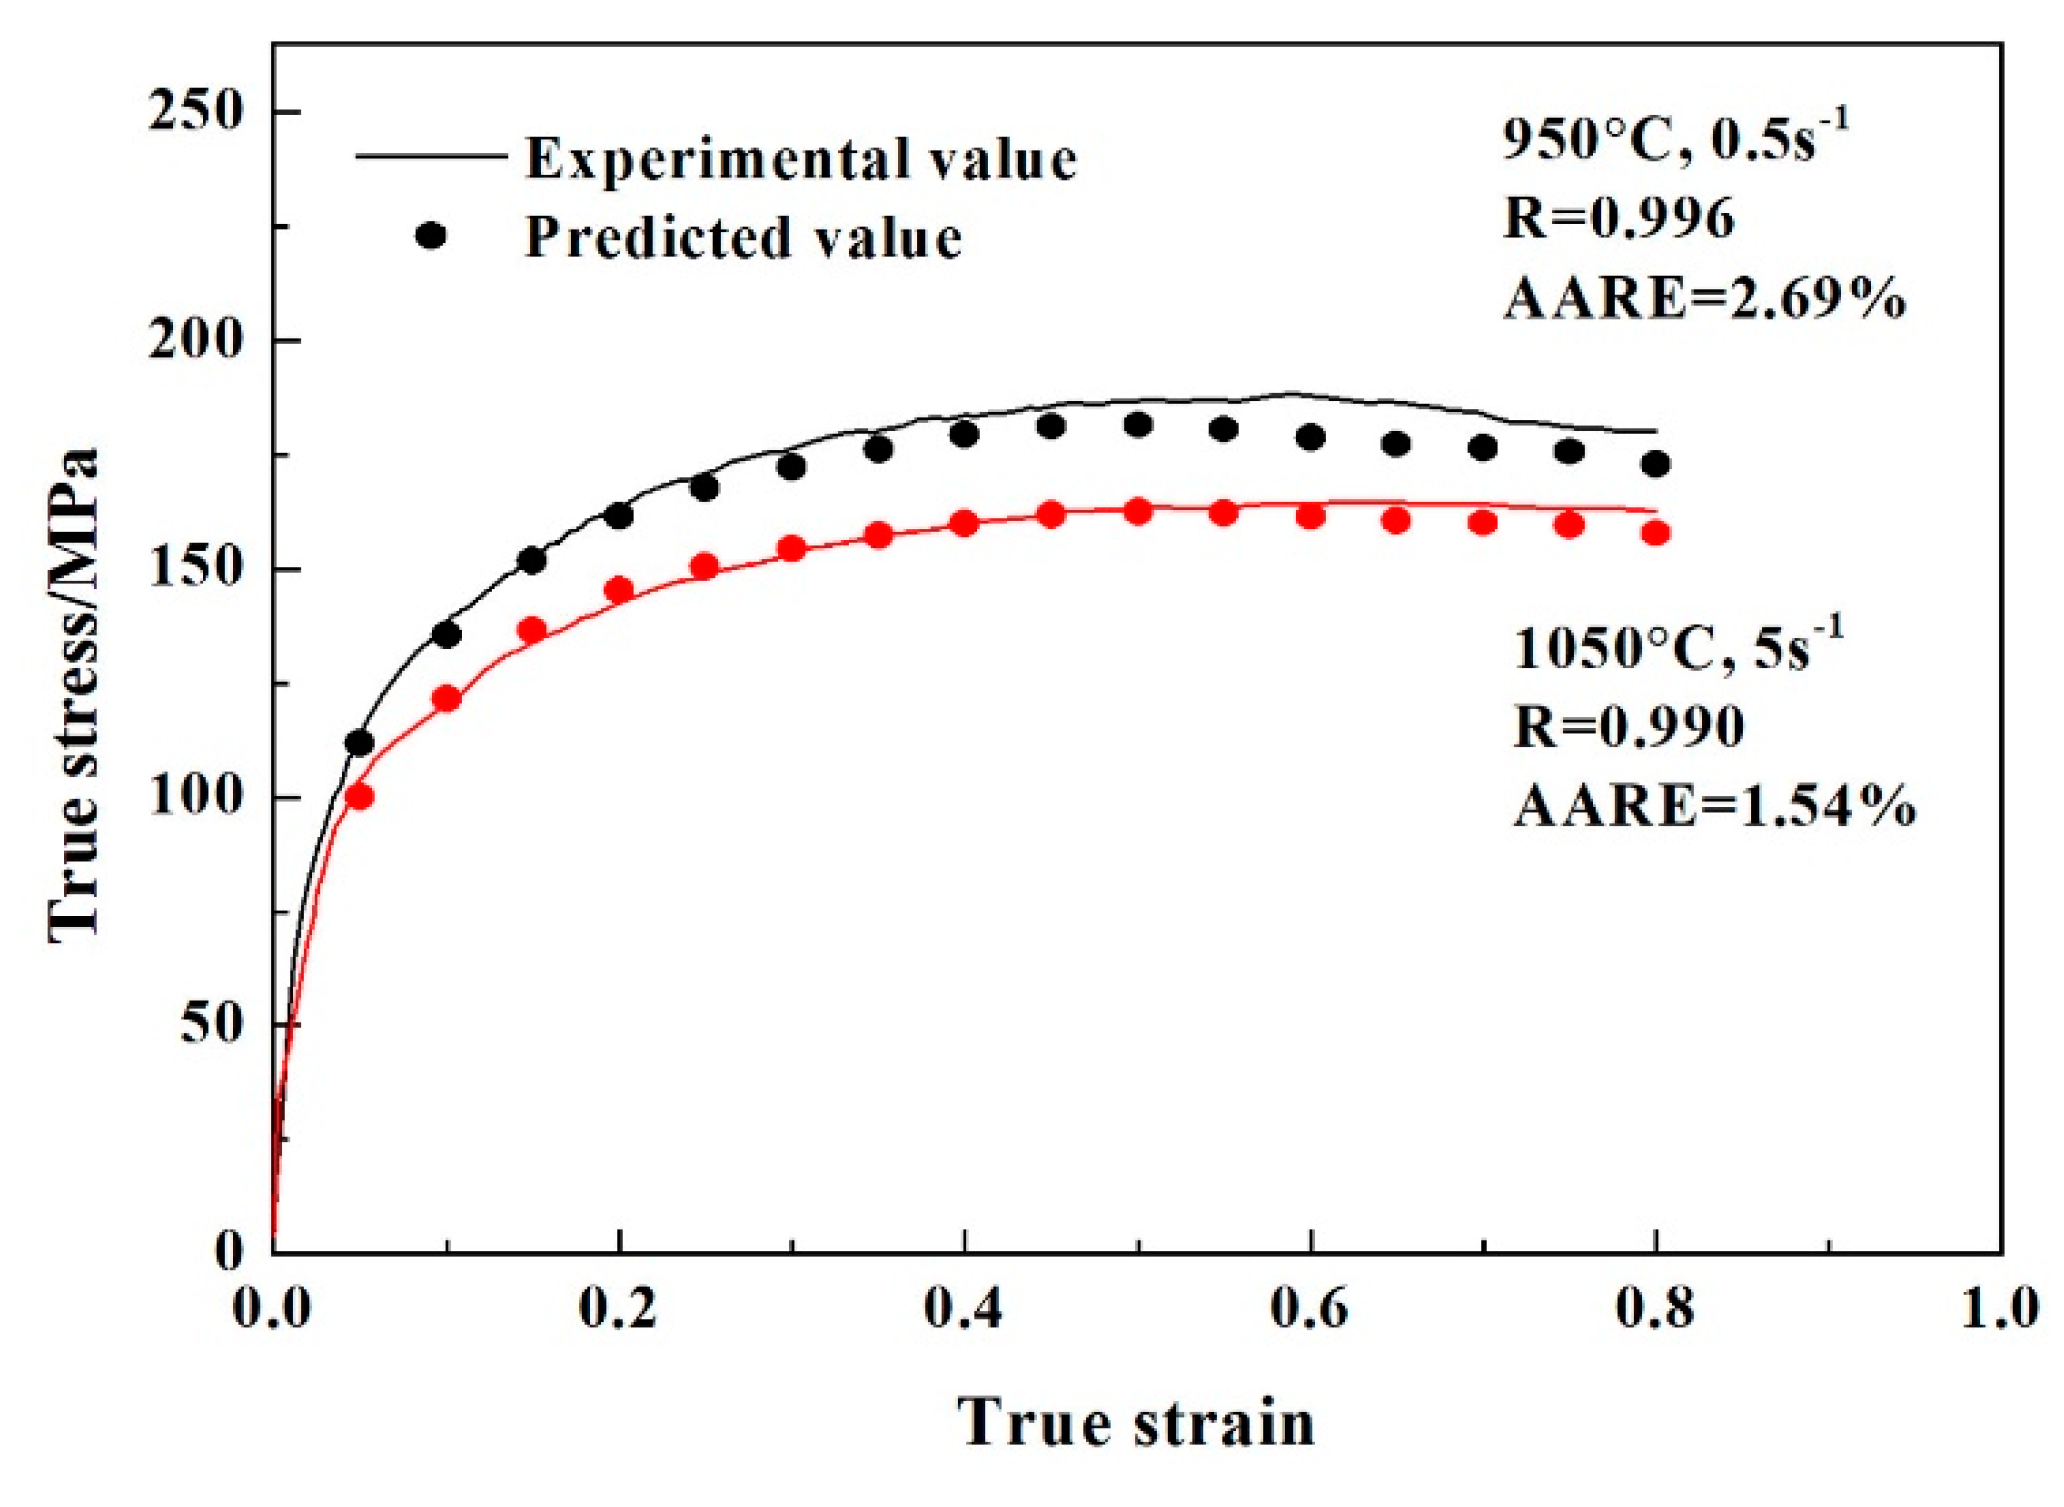
where N is the number of the data used in the calculation; σ e i is the true stress obtained from the experiment; σ p i is the true stress predicted by the improved constitutive equation; σ ¯ e and σ ¯ p are the mean values of σ e i and σ p i , respectively. As shown in Figure 8b, the values of R and AARE calculated by Equations (15) and (16) are 0.994 and 4.76%, respectively, which demonstrated a good agreement between the experimental and predicted values. Additionally, the developed constitutive equation was used to predict the true stress for the experimental conditions which had not been used to determine the material constants. The experimental and predicted values of true stress under these hot deformation conditions (950 °C with the strain rate of 0.5 s −1 and 1050 °C with the strain rate of 5 s−1) and the corresponding values of R and AARE are shown in Figure 9. The corresponding results declared that the proposed constitutive equation could provide good reliability and predictability.

3.3. Processing Map

3.3.1. Theory of the Processing Map

A processing map is widely used to predict the microstructure evolution mechanism during hot compression, optimize the hot working parameters and indicate the “unsafe” regions in hot deformation process. A processing map is established by superimposing the instability map on the power dissipation map, which is based on DMM. The DMM considers the workpiece in hot working as a power dissipator, and the total energy (P) absorbed by the workpiece during hot working is composed of two complementary parts: the dissipative content G and the dissipative co-content J. G represents the energy for the increase in temperature during hot deformation, while J denotes the energy for metallurgical process, such as DRV, DRX, flow localization, etc. [18]. Therefore, the relationship between these energies can be described by the following equation:
P = σ · ε ˙ = G + J = 0 ε ˙ σ d ε ˙ + 0 σ ε ˙ d σ
During the hot working process, when strain and deformation temperature are constant, true stress and strain rate obey the power law [39]:
σ = K ε ˙ m
where K is a material constant and m is the strain rate sensitivity parameter, which illustrates the ratio of dissipative co-content J and the dissipative content G:
m = J G = d l g σ d l g ε ˙
Under a given strain and deformation temperature, a cubic spline can be used to fit the relationship between true stress and strain rate [40]:
l g σ = a + b l g ε ˙ + c ( l g ε ˙ ) 2 + d ( l g ε ˙ ) 3
According to Equations (19) and (20), the value of strain rate sensitivity parameter (m) can be described as:
m = b + 2 c l g ε ˙ + 3 d ( l g ε ˙ ) 2
Based on the Equations (17) and (18), the dissipative co-content J can be rewritten as:
J = 0 σ ( σ K ) 1 m d σ = m m + 1 ε ˙ σ
The value of the strain rate sensitivity parameter (m) is between 0 to 1. When m = 1, the material is at the ideal linear dissipation state, which makes the dissipative co-content J reach its maximum value:
J m a x = ε ˙ σ 2 = P 2
The dimensionless parameter of the efficiency of power dissipation (η) can be achieved by normalizing J with Jmax as follows:
η = J J m a x = 2 m m + 1
From Equation (24), it can be seen that the physical meaning of η is the proportion of the energy consumed by microstructure evolution to the ideal linear dissipation energy. Therefore, the value of η reflects the efficiency of the power dissipated by microstructure change during hot deformation, and can be used to predict the microstructure evolution mechanism and hot workability of the material under certain hot working conditions. The variation of η with hot deformation temperature (T) and strain rate ( ε ˙ ) at a given strain composes the power dissipation map. Different regions of the map correspond to different hot processing properties; hence it can provide the basis for selecting the optimum hot working windows during hot deformation. Generally, the domains with the maximum value of η correspond to the optimal hot processing parameters.
During hot working, plastic unstable behaviors such as adiabatic shear band, flow localization, cracking, etc., may occur. These defects will deteriorate the thermal processing properties of the material. Therefore, it is necessary for us to identify these forming defects. According to the extremum principle of irreversible thermodynamics, the continuum instability criterion can be achieved as follows [41]:
ξ ( ε ˙ ) = ln ( m / m + 1 ) l n ε ˙ + m < 0
where ξ ( ε ˙ ) s a dimensionless instability parameter which indicates the instability of the system. The variation of ξ ( ε ˙ ) with hot deformation temperature and strain rate for a fixed strain constitutes the instability map. In this map, ξ ( ε ˙ ) with the negative value represents the flow instability domain which should be avoided during hot working.

3.3.2. Establishment of a Processing Map

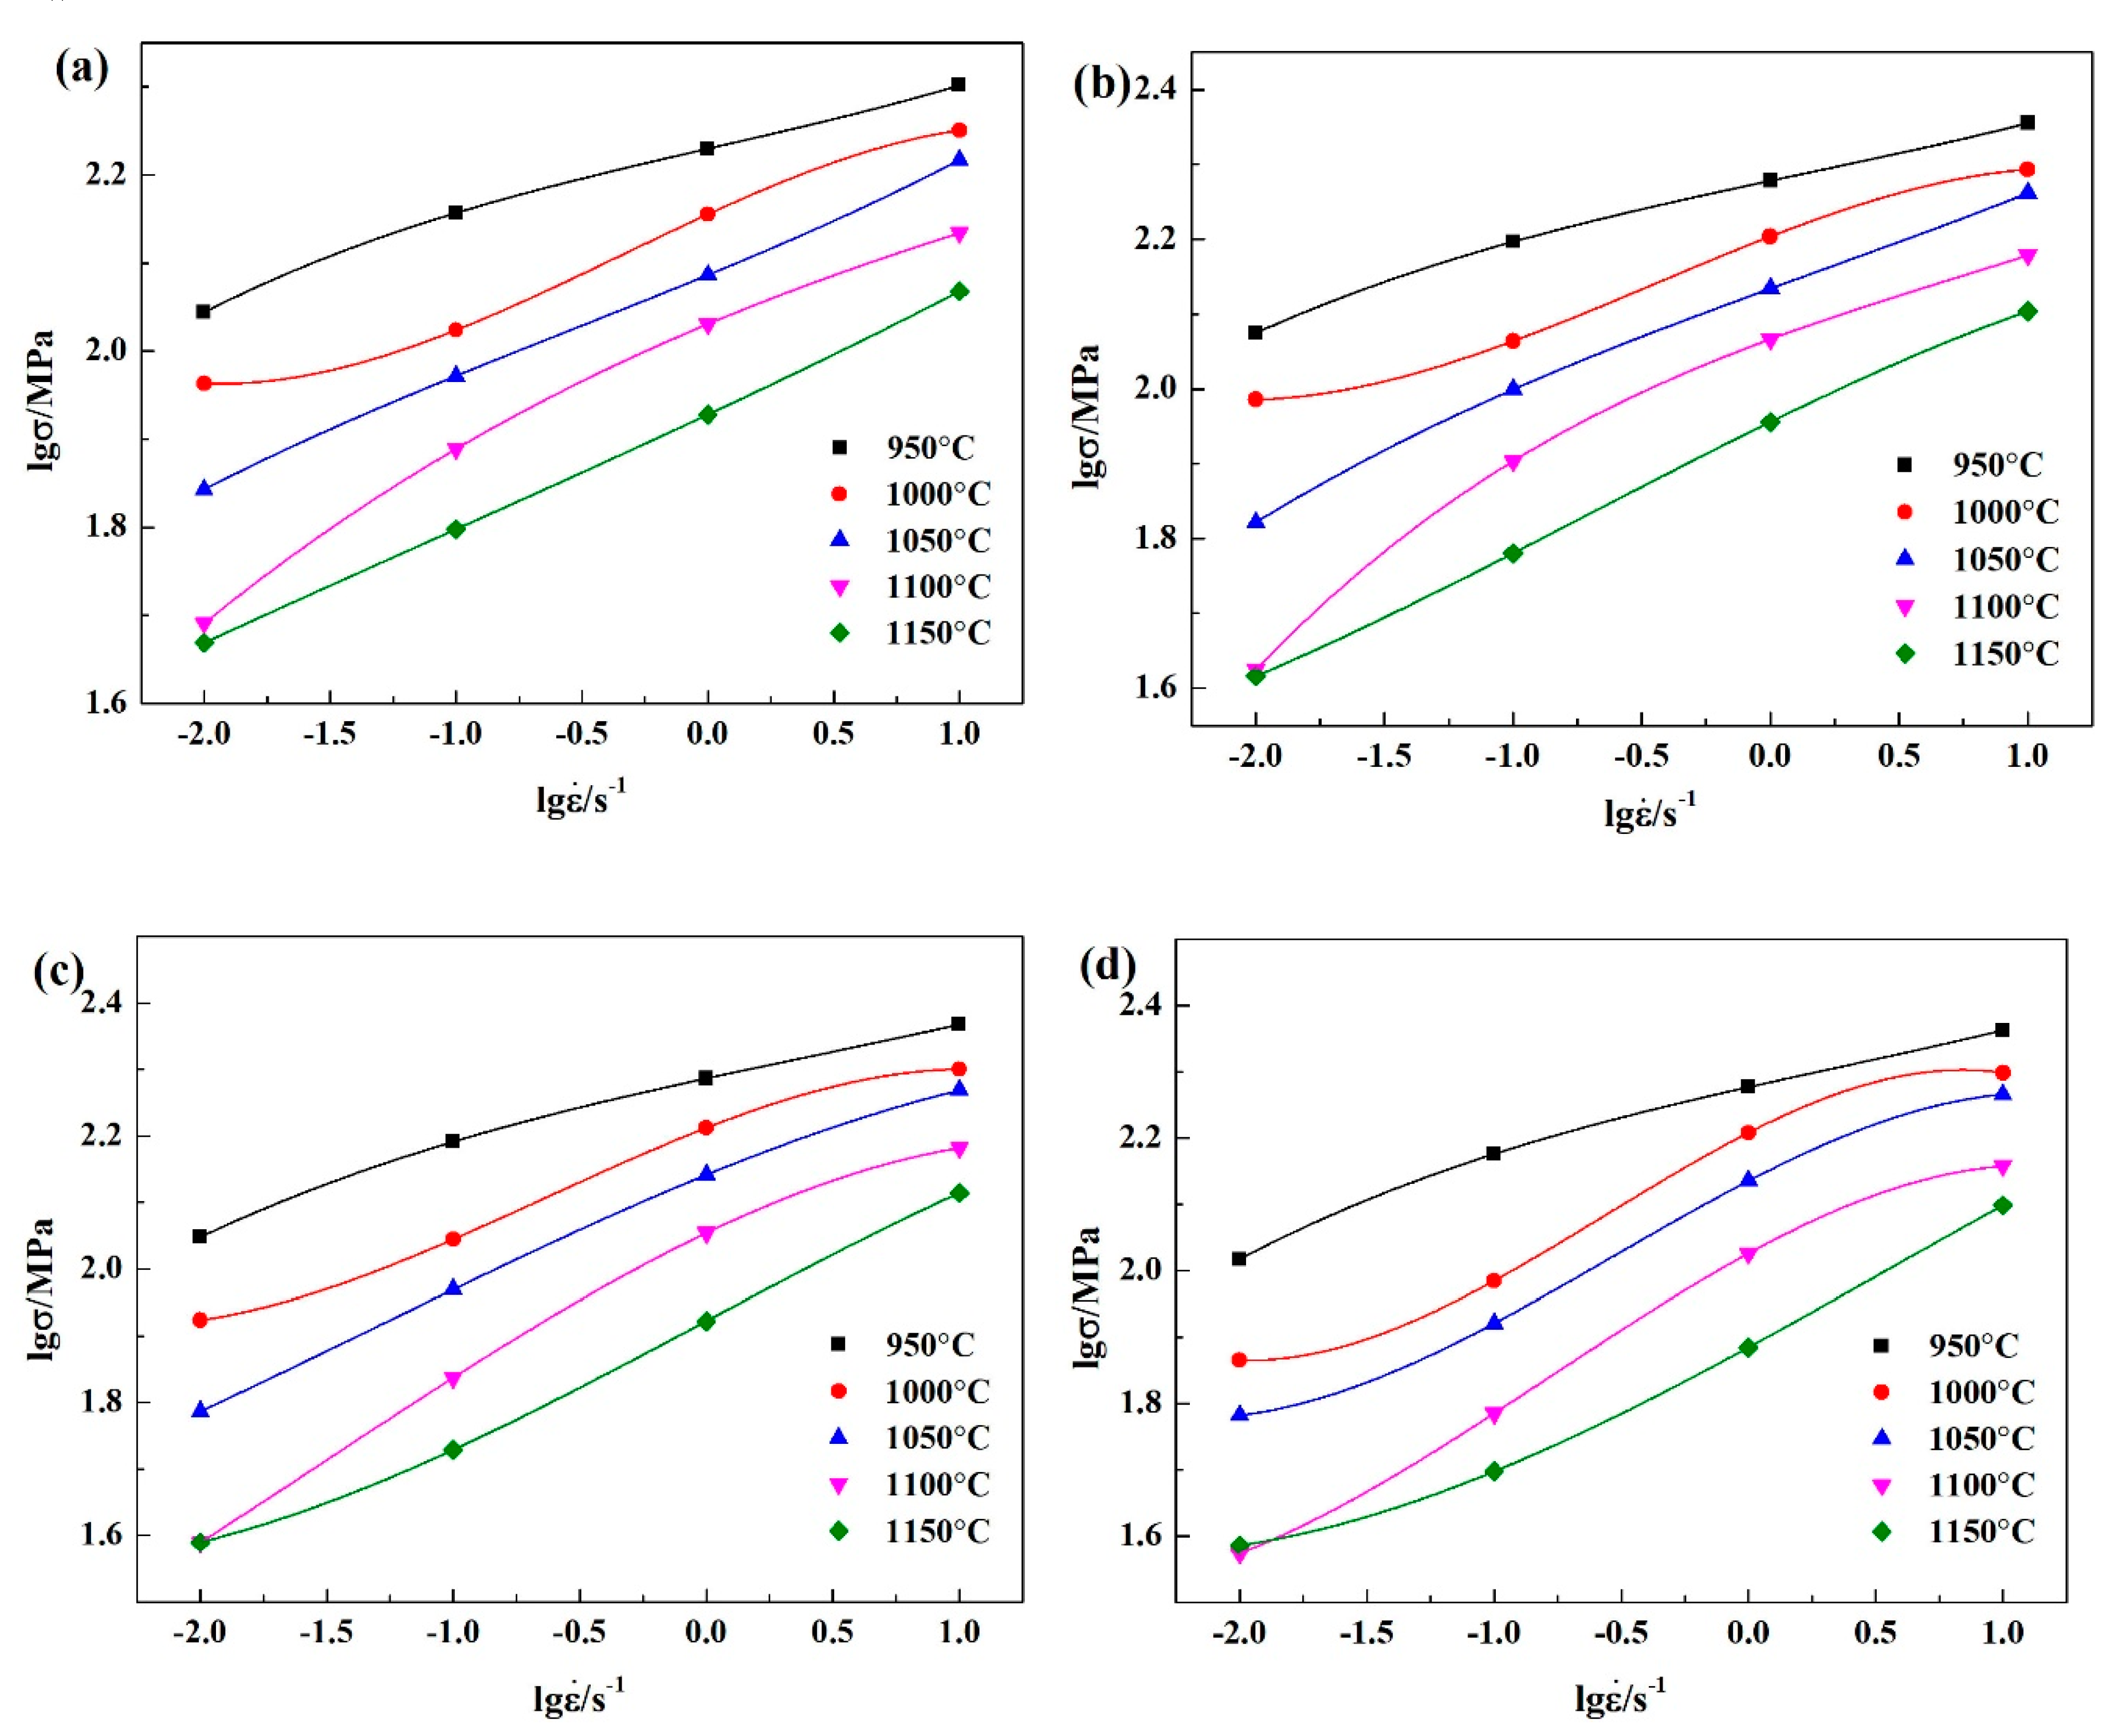
The data obtained from the true stress−true strain curves can be used to draw the plot which reflects the relationship between lgσ and lg ε ˙ at the true strains of 0.2, 0.4, 0.6 and 0.8, respectively (Figure 10). The values of m can be calculated based on Equation (21) and the fitted cubic spline curves shown in Figure 10. The values of η and ξ under different hot deformation conditions can be determined by substituting the values of m into Equations (24) and (25), and then the processing maps can be established.
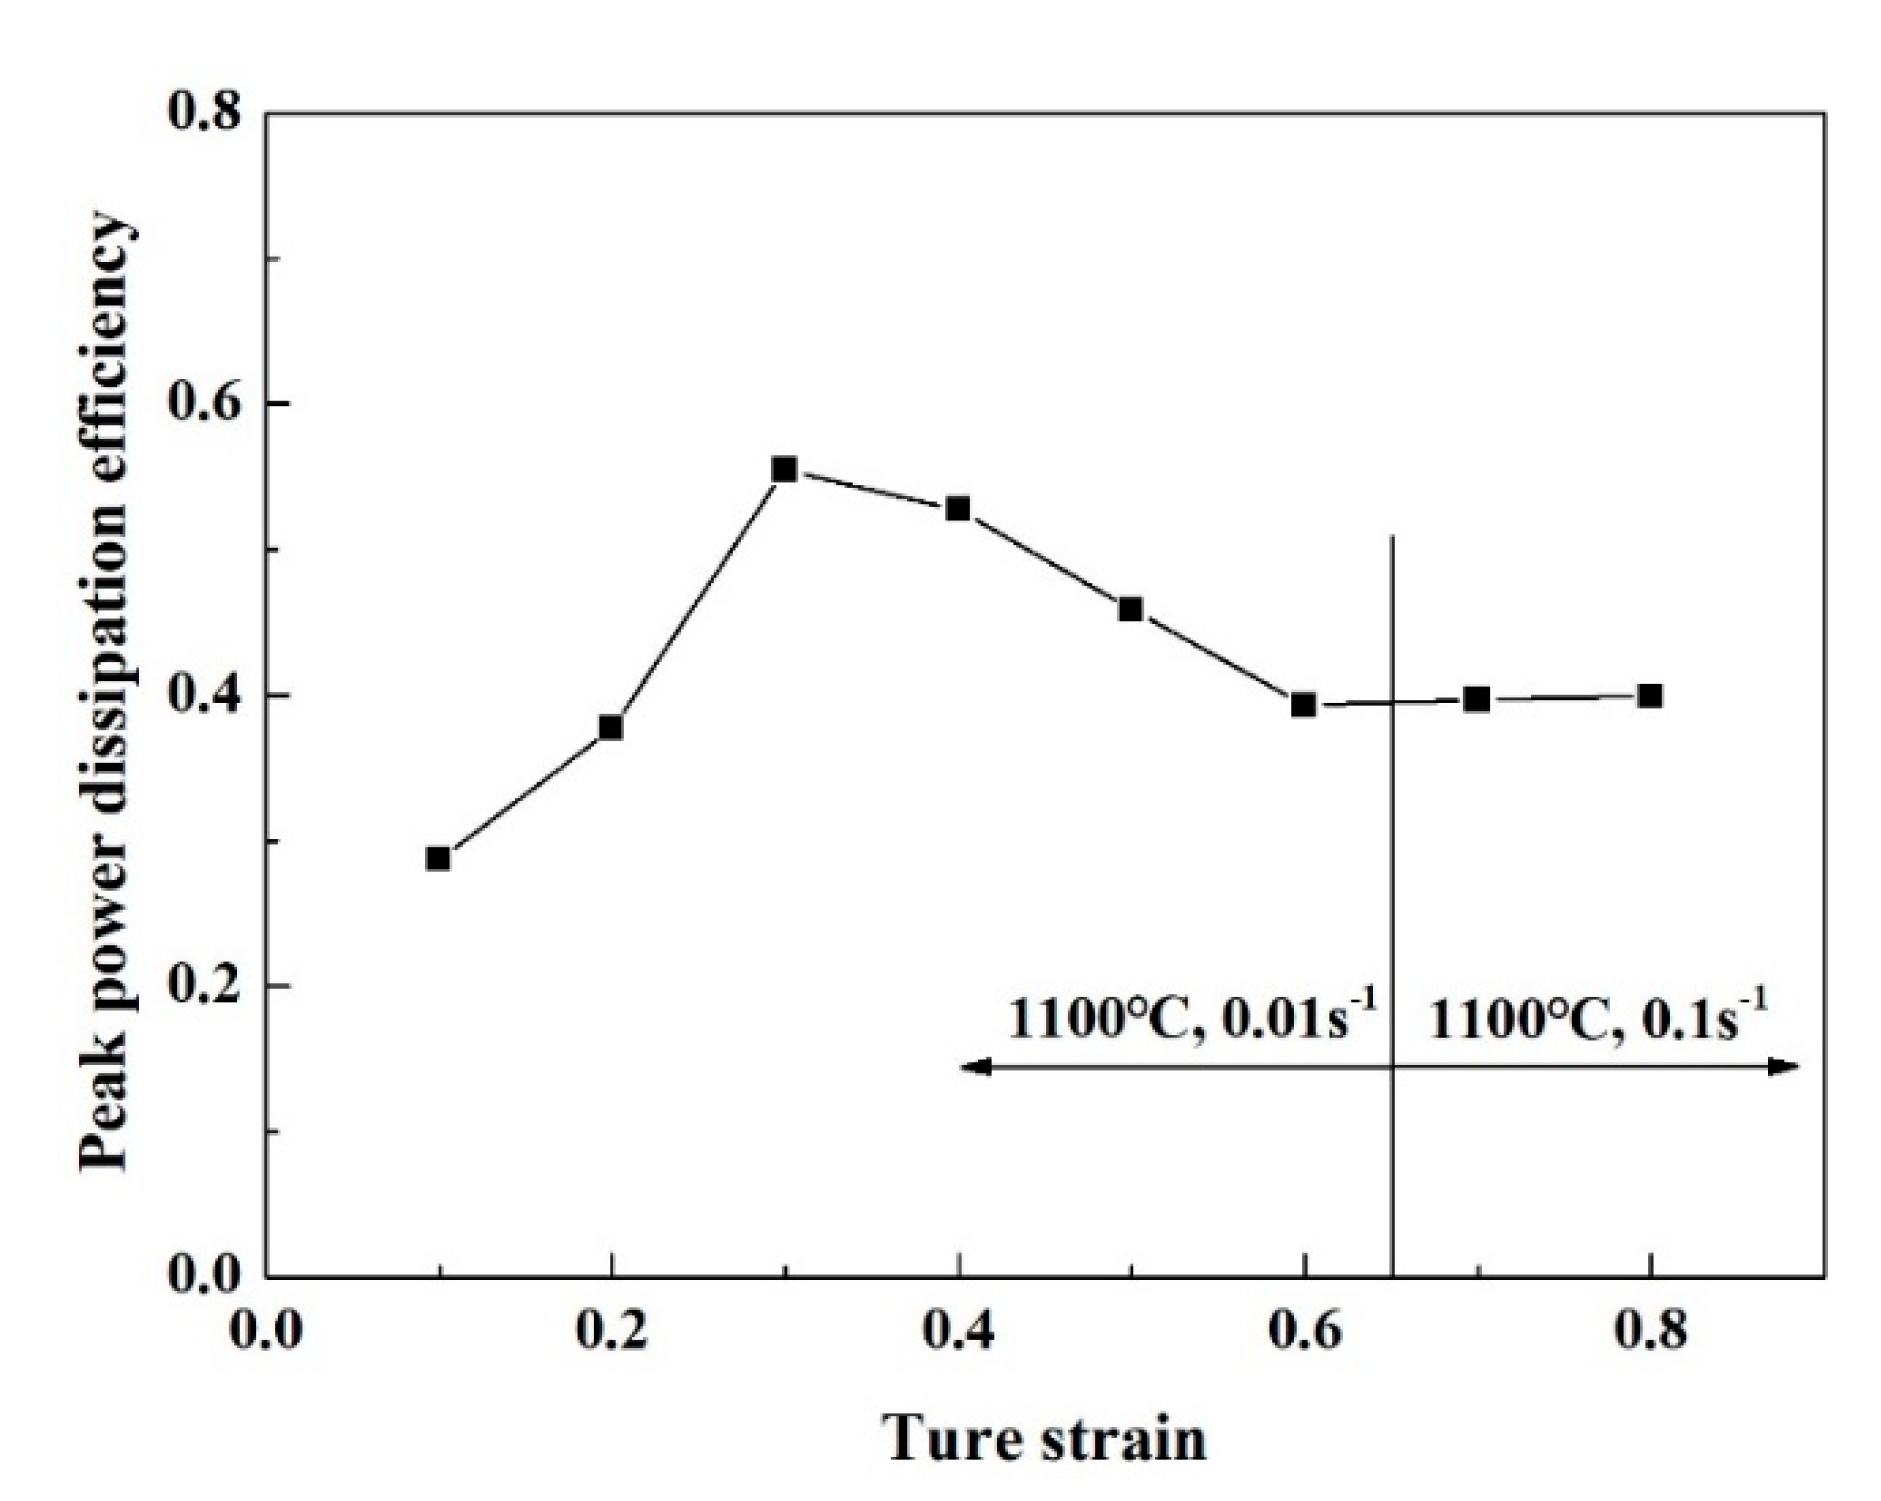
Figure 11 shows the processing maps of the experimental steel at different true strains when the hot deformation temperature ranges from 950 to 1150 °C and strain rate ranges from 0.01 to 10 s−1. The number against each contour represents the value of the efficiency of power dissipation, while the gray regions in these maps denote the unsafe domains which should be avoided during hot working. It can be seen from Figure 11 that with the true strain increased from 0.2 to 0.8, the characteristics of the power dissipation efficiency maps were basically unchanged which meant that the effect of true strain on the efficiency of power dissipation was not significant. Figure 12 shows the peak power dissipation efficiency under different true strains. As shown in Figure 12, it can be seen that the peak power dissipation efficiency mainly appeared in two hot deformation conditions. One appeared at the temperature of 1100 °C and strain rate of 0.01 s−1 when the true strain was less than 0.7, the other one occurred at the temperature of 1100 °C and strain rate of 0.1 s−1 when the true strain was no less than 0.7.
As shown in Figure 11d, when the true strain increases to 0.8, a single relatively high power dissipation efficiency region can be observed on the map which is located at the temperature of 1000–1150 °C and strain rate of 0.1–1 s−1. In this field, the power dissipation efficiency is generally higher than 30%, and the peak power dissipation efficiency of 39.9% occurs at 1100 °C/0.1 s−1. Generally, the high value of power dissipation efficiency means that more energy is consumed by the microstructure change during the hot deformation process, and the DRX occurs when the power dissipation efficiency is between 0.3–0.5 [42]. So, DRX should occur at the above mentioned single high power dissipation efficiency region when the true strain is 0.8, the stress−strain curves shown in Figure 4b at the temperature of 1050–1150 °C also show the features of DRX. Therefore, the preferred processing parameters for hot deformation at the true strain of 0.8 should be located in this domain.
As shown in Figure 11a−d, it can be seen that the true strain has a considerable impact on the unstable region. At the true strain of 0.2, two unstable regions occurred at the lower temperatures: one located at 950–1067 °C/0.01–0.13 s−1, and the other occurred at 956–1045 °C/1.07–10 s−1. With the true strain increased to 0.4, three unstable regions which were mainly located at the medium and higher strain rates could be observed: 950–1053 °C/0.09–10 s−1, 1049–1110 °C/0.03–1.15 s−1 and 1132–1150 °C/4.64–10 s−1. When the true strain was 0.6, two unstable regions were exhibited, the major one occurred at the higher strain rates: 950–1146 °C/0.66–10 s−1, while the minor one was located at the medium strain rates: 950–954 °C/0.08–0.12 s−1. When true strain reached 0.8, two larger unstable regions appeared at the lower temperatures and lower strain rates and higher temperatures and higher strain rates respectively: 950−1049 °C/0.01–0.14 s−1 and 1027–1150 °C/0.81–10 s−1.

3.3.3. Microstructures Corresponding to the Processing Map

In order to investigate the hot deformation mechanism of the experimental steel and validate the processing map constructed above, the microstructures under different deformation conditions at the true strain of 0.8 were observed. The typical microstructures in the stability region with relatively high power dissipation efficiency (where the values of η are higher than 30%) are shown in Figure 13. It can be seen that all of these microstructures had recrystallized with fine grains, which indicated that DRX had occurred in these hot deformation conditions. This phenomenon was consistent with the PM results analyzed in Section 3.3.2. Moreover, the DRX grain sizes of the hot deformation conditions of 1000 °C × 0.1 s−1, 1100 °C × 0.1 s−1, 1100 °C × 1 s−1 and 1150 °C × 1 s−1 were 11.4, 17.9, 16.2 and 18.0 μm, respectively. It was evident that with the increase of deformation temperature, the DRX grain grew larger. The reason for this is that the higher temperature provides more energy for the movement of dislocation, which makes the grains grow more easily. Additionally, with the increase of strain rate, the DRX grain size decreases. It can be attributed to the fact that at a higher strain rate, the interaction between dislocations becomes stronger which increases the dislocation density and strain stored energy. The higher strain stored energy provides more driving force to overcome the obstacle of the nucleation of DRX, thus increases the nucleation rate of DRX [43]. In addition, at a higher strain rate, there is less time for the movement of the grain boundary. Therefore, the DRX grain size decreases with the increase of strain rate.
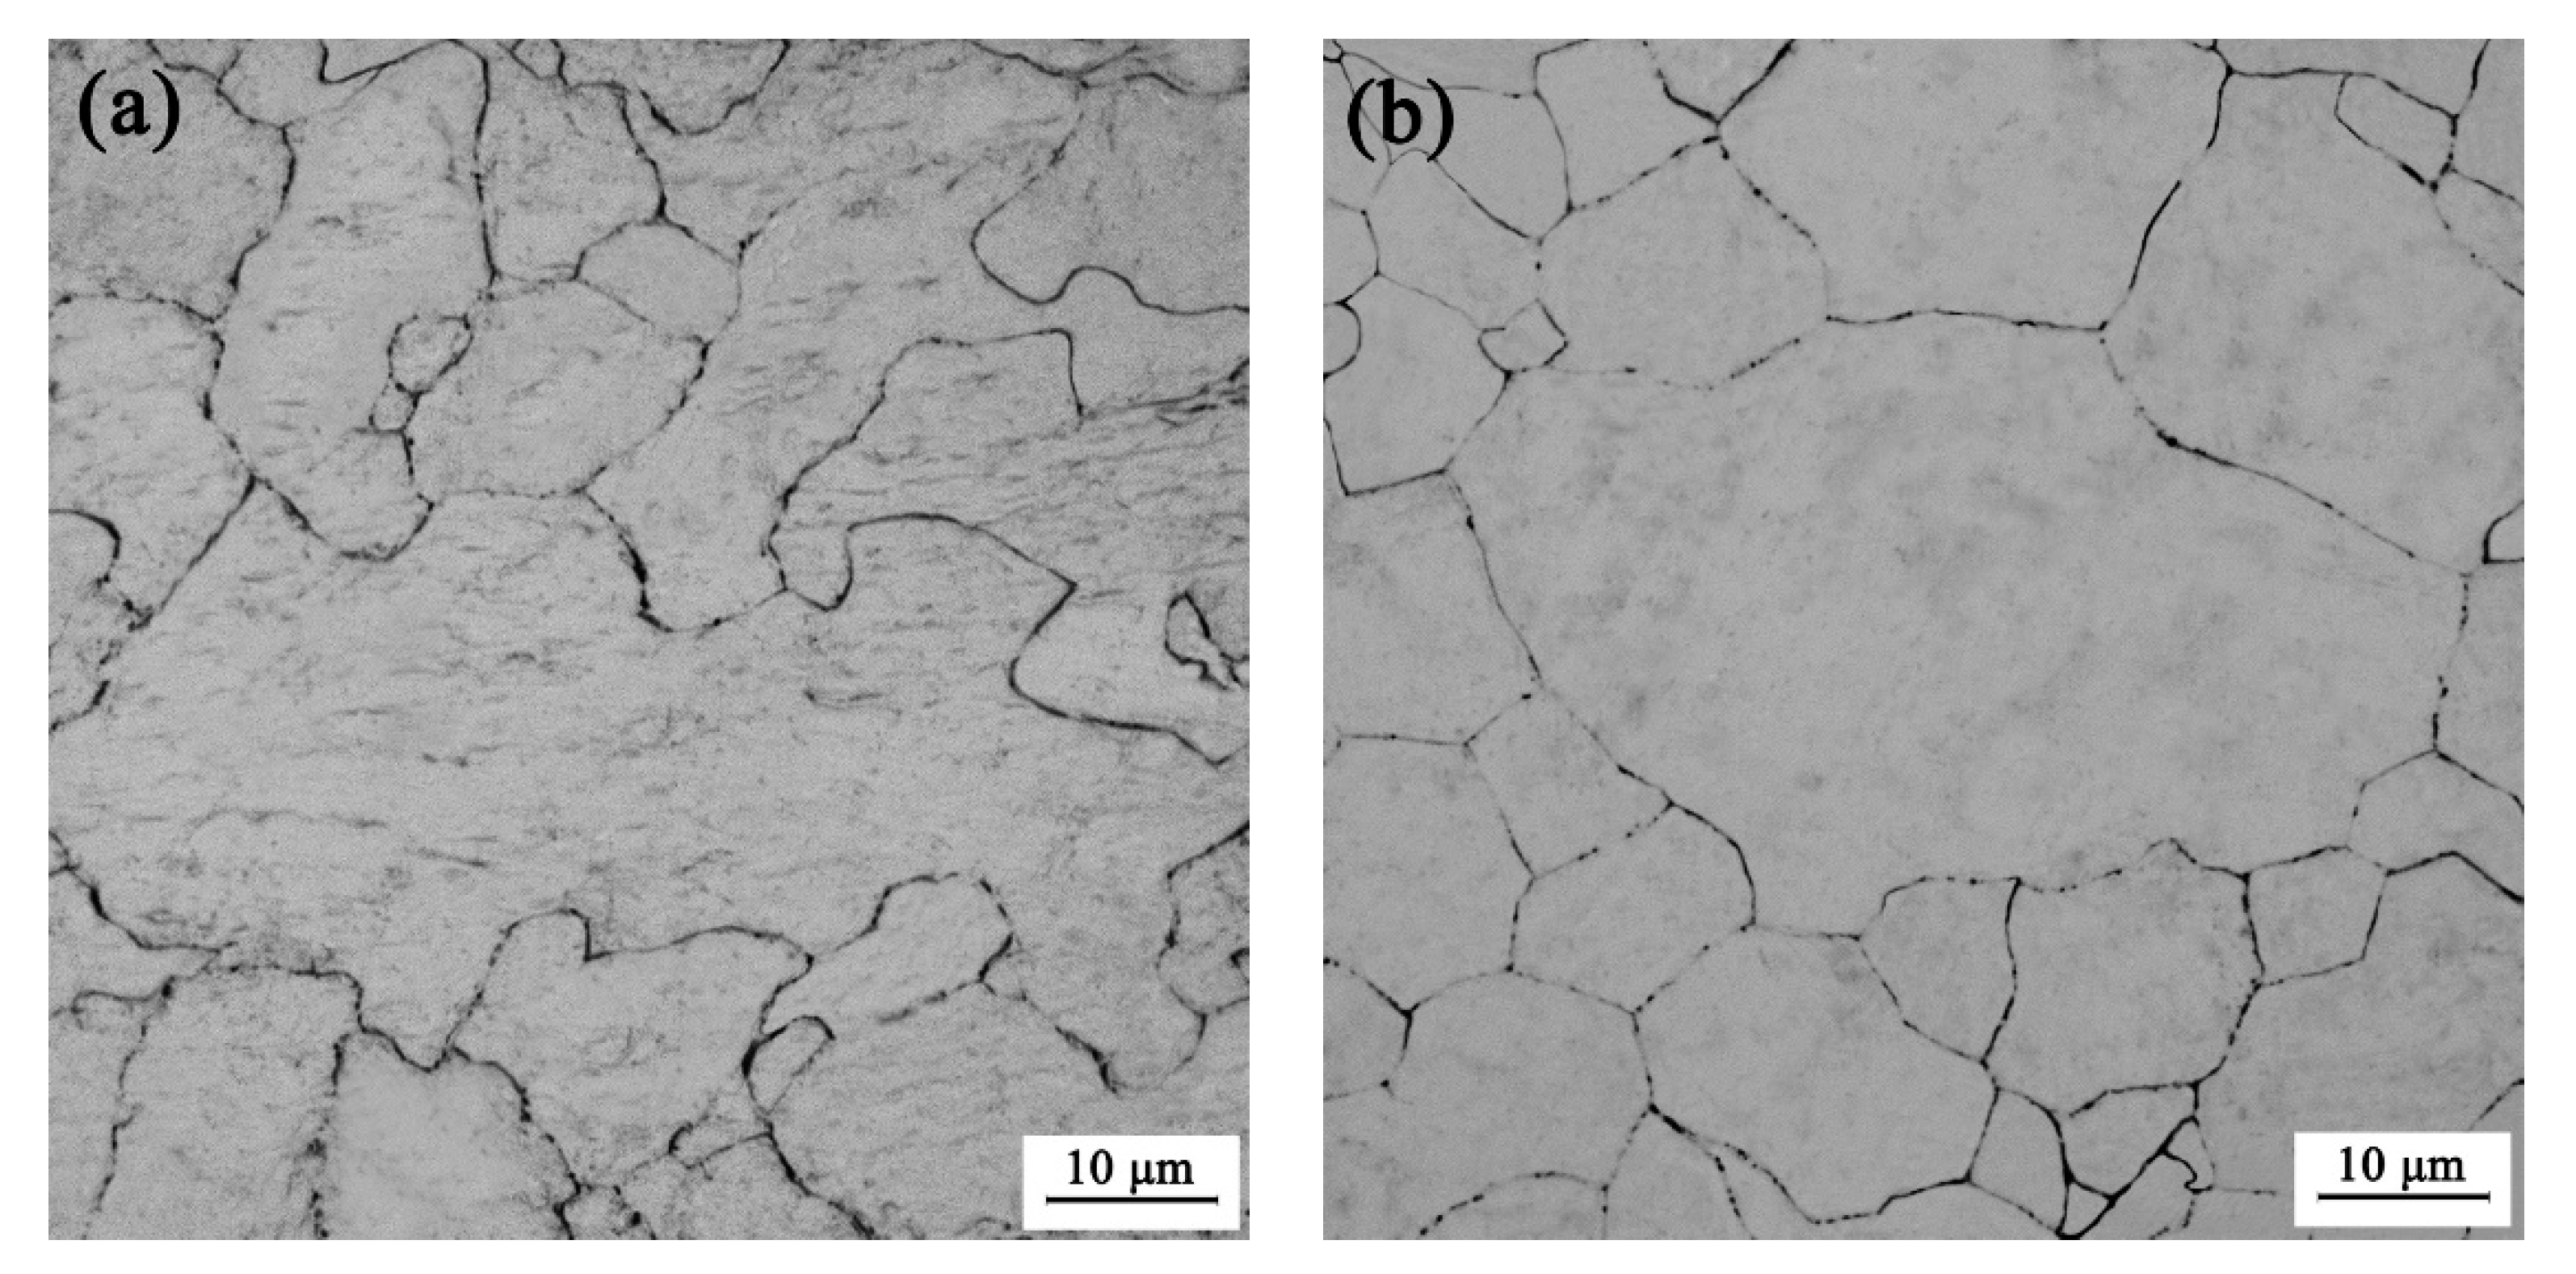
The microstructures in the stability region with low power dissipation efficiency are shown in Figure 14a,b. At the temperature of 950 °C and strain rate of 10 s−1 (Figure 14a), where the power dissipation efficiency was 16.9%, the original equiaxed grains were elongated along the deformation direction and the serrated grain boundaries could be observed. This suggests that the main softening mechanism at this hot deformation condition is DRV. Moreover, some recrystallized grains were formed along the grain boundaries, which meant that partial DRX occurred. The reason for this is that the grain boundary region has a higher dislocation density, which can provide a higher driving force and more nucleation sites for DRX, thus facilitating the occurrence of DRX. As the hot deformation temperature increased to 1000 °C (Figure 14b), more DRX grains could be found around the elongated grains and the undesirable “necklace structure” was formed. Due to the partial DRX and the necklace structure, the two above mentioned conditions are not suitable for hot deformation.
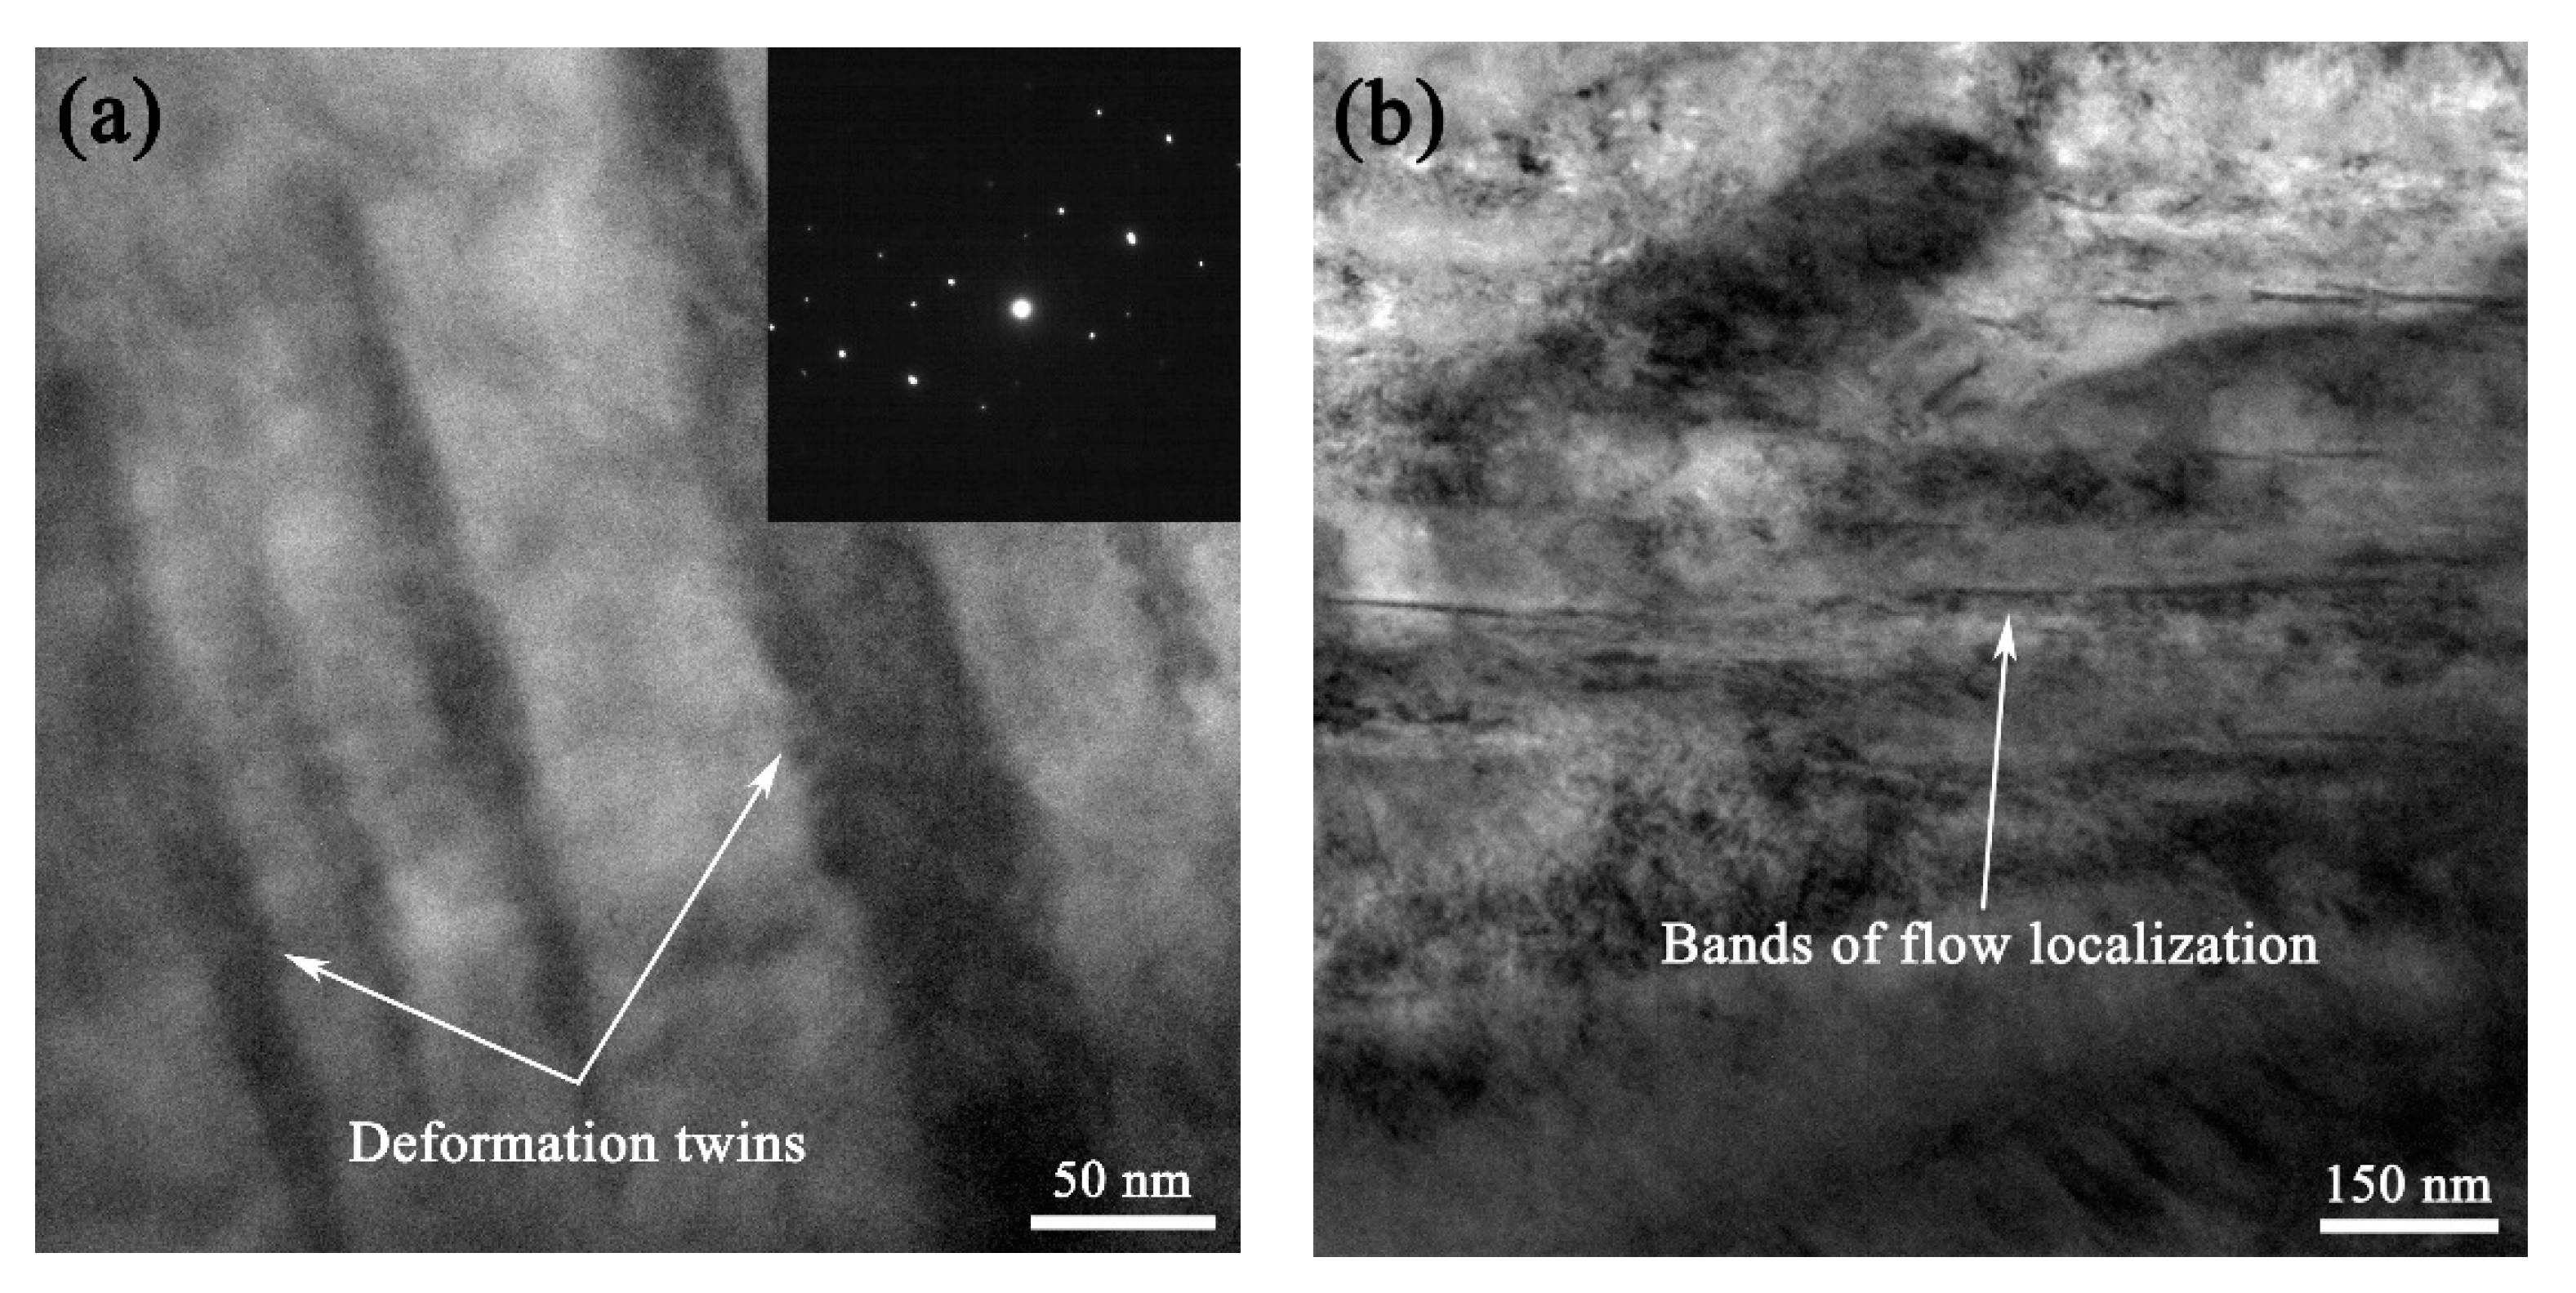
The typical microstructures of the unstable regions of the material are illustrated in Figure 15. At the hot deformation condition of 1000 °C/0.01 s−1 (Figure 15a), the elongated grains together with the dynamic recrystallized grains could be observed. Furthermore, a detailed observation of the microstructure analyzed by TEM (Figure 16) manifested the deformation twins (verified by the corresponding selected area electron diffraction (SAED) pattern) and the bands of flow localization. It is commonly recognized that the boundaries of the deformation twins would inhibit the dislocation motion, causing dislocation pile-ups which result in stress concentration and could induce the microcracks and voids. Additionally, cracks can also be easily initiated by these undesired bands of flow localization. These instability phenomena were also observed in other alloys during hot deformation, such as magnesium alloys and austenitic stainless steel [25,44]. Figure 15b shows the typical microstructure of the hot deformation condition of 1100 °C/10 s−1 in another unstable region. It can be seen that under this deformation condition complete DRX had occurred but some of the DRX grains grew remarkably, which led to mixed grain structure. The mixed grain structure may result in microcracks, thus should be avoided during hot deformation.

4. Conclusions

The hot deformation behavior of a nitrogen-bearing martensitic stainless steel has been studied through hot compression test in the temperature range of 950–1150 °C and strain rate range of 0.01–10 s−1. The following principal conclusions can be drawn from this paper.
(1) The hot deformation temperature and strain rate had a notable effect on the true stress of the nitrogen-bearing martensitic stainless steel. The true stress decreases with the increasing of deformation temperature and the decreasing of strain rate.
(2) The activation energy values of hot deformation of the experimental material at the true strains of 0.1–0.8 are between 407 and 487 KJ mol−1. The relationships between material constants (α, n, Q and A) and strain are fitted by sixth order polynomials, and the strain compensated Arrhenius-type constitutive equation is established. The correlation coefficient and average absolute relative error are 0.994 and 4.76%, respectively, indicating that the developed constitutive equation can accurately predict the true stress.
(3) The true strain has a significant impact on the instability region. When the true strain is between 0.2 and 0.6, the instability regions are mainly distributed in the lower temperature and higher strain rate condition. As the true strain increases to 0.8, the instability region occurs mainly in two areas: 950–1049 °C/0.01–0.14 s−1 and 1027–1150 °C/0.81–10 s−1, in which deformation twins, bands of flow localization and mixed grain structure occur.
(4) The optimal hot working window at the true strain of 0.8 is in the region of 1000–1150 °C/0. 1–1 s−1 with a peak power dissipation efficiency of 39.9%. The microstructures in this domain are fine and uniform DRX grains.

Author Contributions

Conceptualization, X.L. and L.H.; methodology, X.L. and Z.W.; writing—original draft preparation, X.L.; writing—review and editing, L.H.; project administration, L.H. and Y.W. All authors have read and agreed to the published version of the manuscript.

Funding

This research was supported by the Key Scientific Research Project in Shanxi Province (Grant No. MC2016-06, 201603D111004, 20181101014 and 201805D121003), Special Found Projects for Central Government Guidance to Local Science and Technology Development, Research Project Supported by Shanxi Scholarship Council of China (2017-029), Corrosion and Protection Engineering Technology Research Center of Shanxi Province, Science and Technology Major Projects of Shanxi Province (20181101015 and 20191102004), the Scientific Research Project of Returned Overseas Students of Shanxi Province, Natural Science Foundation of Shanxi Province of China (2019D111102).

Conflicts of Interest

The authors declare no conflict of interest.

References

  1. Tsai, M.C.; Chiou, C.S.; Du, J.S.; Yang, J.R. Phase transformation in AISI 410 stainless steel. Mater. Sci. Eng. A 2002, 332, 1–10. [Google Scholar] [CrossRef]
  2. Marcelin, S.; Pébère, N.; Régnier, S. Electrochemical characterisation of a martensitic stainless steel in a neutral chloride solution. Electrochim. Acta 2013, 87, 32–40. [Google Scholar] [CrossRef] [Green Version]
  3. Krishna, S.C.; Tharian, K.T.; Chakravarthi, K.V.A.; Jha, A.K.; Pant, B. Heat treatment and thermo-mechanical treatment to modify carbide banding in AISI 440C steel: A case study. Metallogr. Microstruct. Anal. 2016, 5, 108–115. [Google Scholar] [CrossRef]
  4. Ghosh, R.; Krishna, S.C.; Venugopal, A.; Narayanan, P.R.; Jha, A.K.; Ramkumar, P.; Venkitakrishnan, P.V. Corrosion and Nanomechanical Behaviors of 16.3Cr-0.22N-0.43C-1.73Mo Martensitic Stainless Steel. Corros. Sci. Technol. 2016, 15, 281–289. [Google Scholar] [CrossRef] [Green Version]
  5. Zhao, Y.; Liu, X.; Li, X.; Wang, Y.; Zhang, W.N.; Liu, Z. Pitting corrosion behavior in novel Mn–N alloyed lean duplex stainless steel containing Cu. J. Mater. Sci. 2018, 53, 824–836. [Google Scholar] [CrossRef]
  6. Li, H.B.; Jiang, Z.H.; Yang, Y.; Gao, Y.; Zhang, Z.R. Pitting corrosion and crevice corrosion behaviors of high nitrogen austenitic stainless steels. Int. J. Miner. Metall. Mater. 2009, 16, 517–524. [Google Scholar] [CrossRef]
  7. Simmons, J.W. Overview: High-nitrogen alloying of stainless steels. Mater. Sci. Eng. A 1996, 207, 159–169. [Google Scholar] [CrossRef]
  8. Schneider, R.; Perko, J.; Reithofer, G. Heat Treatment of Corrosion Resistant Tool Steels for Plastic Moulding. Mater. Manuf. Process. 2009, 24, 903–908. [Google Scholar] [CrossRef]
  9. Trojahn, W.; Streit, E.; Chin, H.A.; Ehlert, D. Progress in Bearing Performance of Advanced Nitrogen Alloyed Stainless Steel, Cronidur 30. Mater. Sci. Technol. 2000, 30, 605–611. [Google Scholar] [CrossRef]
  10. Li, H.B.; Jiao, W.C.; Feng, H.; Jiang, Z.H.; Ren, C.D. Influence of Austenitizing Temperature on the Microstructure and Corrosion Resistance of 55Cr18Mo1VN High-Nitrogen Plastic Mould Steel. Acta Metall. Sin. 2016, 29, 1148–1160. [Google Scholar] [CrossRef] [Green Version]
  11. Krishna, S.C.; Karthick, N.K.; Jha, A.K.; Pant, B.; Venkitakrishnan, P.V. Microstructure and Properties of Nitrogen-Alloyed Martensitic Stainless Steel. Metallogr. Microstruct. Anal. 2017, 6, 425–432. [Google Scholar] [CrossRef]
  12. López, D.; Falleiros, N.A.; Tschiptschin, A.P. Corrosion–erosion behaviour of austenitic and martensitic high nitrogen stainless steels. Wear 2007, 263, 347–354. [Google Scholar] [CrossRef]
  13. Qi, X.; Mao, H.H.; Yang, Y. Corrosion behavior of nitrogen alloyed martensitic stainless steel in chloride containing solutions. Corros. Sci. 2017, 120, 90–98. [Google Scholar] [CrossRef]
  14. Li, X.; Wei, Y.H.; Wang, B.; Wei, Z.Y. Effect of cold rolling reduction on microstructure and mechanical properties of a nitrogen bearing martensitic stainless steel. Spec. Met. 2019, 40, 60–63. (In Chinese) [Google Scholar]
  15. Li, X.; Wei, Y.H. Effect of austenitising heat treatment on microstructure and properties of a nitrogen bearing martensitic stainless steel. Open Phys. 2019, 17, 601–606. [Google Scholar] [CrossRef] [Green Version]
  16. Ma, M.L.; Zhang, K.L.; Xing, G.; Li, Y.J.; Zhang, K. Hot deformation behavior of rare earth magnesium alloy without pre-homogenization treatment. Trans. Nonferrous Met. Soc. China 2008, 18, 132–139. [Google Scholar] [CrossRef]
  17. He, J.L.; Zhang, D.T.; Zhang, W.W.; Qiu, C.; Zhang, W. Constitutive Equation and Hot Compression Deformation Behavior of Homogenized Al–7.5Zn–1.5Mg–0.2Cu–0.2Zr Alloy. Materials 2017, 10, 1193. [Google Scholar] [CrossRef]
  18. Prasad, Y.V.R.K. Processing maps: A status report. J. Mater. Eng. Perform. 2003, 12, 638–645. [Google Scholar] [CrossRef]
  19. Zhao, Q.Y.; Yang, F.; Torrens, R.; Bolzoni, L. Evaluation of the hot workability and deformation mechanisms for a metastable beta titanium alloy prepared from powder. Mater. Charact. 2019, 149, 226–238. [Google Scholar] [CrossRef]
  20. Wen, D.X.; Lin, Y.C.; Chen, J.; Deng, J.; Chen, X.M.; Zhang, J.L.; He, M. Effects of initial aging time on processing map and microstructures of a nickel-based superalloy. Mater. Sci. Eng. A 2015, 620, 319–332. [Google Scholar] [CrossRef]
  21. Li, C.M.; Liu, Y.; Tan, Y.B.; Zhao, F. Hot Deformation Behavior and Constitutive Modeling of H13-Mod Steel. Metals 2018, 8, 846. [Google Scholar] [CrossRef] [Green Version]
  22. Ren, F.C.; Chen, F.; Chen, J.; Tang, X.Y. Hot deformation behavior and processing maps of AISI 420 martensitic stainless steel. J. Manuf. Process 2018, 31, 640–649. [Google Scholar] [CrossRef]
  23. Murty, S.V.S.N.; Rao, B.N.; Kashyap, B.P. Identification of flow instabilities in the processing maps of AISI 304 stainless steel. J. Mater. Process. Technol. 2005, 166, 268–278. [Google Scholar] [CrossRef]
  24. Momeni, A.; Dehghani, K. Characterization of hot deformation behavior of 410 martensitic stainless steel using constitutive equations and processing maps. Mater. Sci. Eng. A 2010, 527, 5467–5473. [Google Scholar] [CrossRef]
  25. Chen, L.; Xue, H.Y.; Ma, X.C.; Jin, M.; Long, H.J.; Mao, T.Q.; Wang, J.F. Processing map and hot deformation characteristics of 21Cr-11Ni-N-RE lean austenitic heat-resistant steel. Steel Res. Int. 2015, 86, 1583–1593. [Google Scholar] [CrossRef]
  26. Pu, E.X.; Zheng, W.J.; Xiang, J.Z.; Song, Z.G.; Li, J. Hot deformation characteristic and processing map of superaustenitic stainless steel S32654. Mater. Sci. Eng. A 2014, 598, 174–182. [Google Scholar] [CrossRef]
  27. Cai, Z.W.; Chen, F.X.; Guo, J.Q. Constitutive model for elevated temperature flow stress of AZ41M magnesium alloy considering the compensation of strain. J. Alloys Compd. 2015, 648, 215–222. [Google Scholar] [CrossRef]
  28. Liu, J.T.; Chang, H.B.; Wu, R.H.; Hsu, T.Y.; Ruan, X.Y. Investigation on hot deformation behavior of AISI T1 high-speed steel. Mater. Charact. 2000, 45, 175–186. [Google Scholar] [CrossRef]
  29. Jonas, J.J.; Sellars, C.M.; Tegart, W.J.M. Strength and structure under hot-working conditions. Int. Metall. Rev. 1969, 14, 1–24. [Google Scholar] [CrossRef]
  30. Li, H.B.; Jiao, W.C.; Feng, H.; Li, X.X.; Jiang, Z.H.; Li, G.P.; Wang, L.X.; Fan, G.W.; Han, P.D. Deformation characteristic and constitutive modeling of 2707 hyper duplex stainless steel under hot compression. Metals 2016, 6, 223. [Google Scholar] [CrossRef] [Green Version]
  31. Sun, C.Y.; Liu, G.; Zhang, Q.D.; Li, R.; Wang, L. Determination of hot deformation behavior and processing maps of IN 028 alloy using isothermal hot compression test. Mater. Sci. Eng. A 2014, 595, 92–98. [Google Scholar] [CrossRef]
  32. Mirzadeh, H.; Cabrera, J.M.; Prado, J.M.; Najafizadeh, A. Hot deformation behavior of a medium carbon microalloyed steel. Mater. Sci. Eng. A 2011, 528, 3876–3882. [Google Scholar] [CrossRef]
  33. Xiao, Y.H.; Guo, C.; Guo, X.Y. Constitutive modeling of hot deformation behavior of H62 brass. Mater. Sci. Eng. A 2011, 528, 6510–6518. [Google Scholar] [CrossRef]
  34. Zhang, J.Q.; Di, H.S.; Wang, X.Y.; Cao, Y.; Zhang, J.C.; Ma, T.J. Constitutive analysis of the hot deformation behavior of Fe–23Mn–2Al–0.2C twinning induced plasticity steel in consideration of strain. Mater. Des. 2013, 44, 354–364. [Google Scholar] [CrossRef]
  35. Dehghan, H.; Abbasi, S.M.; Momeni, A.; Karimi, T.A. On the constitutive modeling and microstructural evolution of hot compressed A286 iron-base superalloy. J. Alloys Compd. 2013, 564, 13–19. [Google Scholar] [CrossRef]
  36. Cao, Y.; Di, H.S.; Misra, R.D.K.; Yi, X.; Zhang, J.C.; Ma, T.J. On the hot deformation behavior of AISI 420 stainless steel based on constitutive analysis and CSL model. Mater. Sci. Eng. A 2014, 593, 111–119. [Google Scholar] [CrossRef]
  37. Ebrahimi, G.R.; Keshmiri, H.; Maldar, A.R.; Momeni, A. Dynamic recrystallization behavior of 13%Cr martensitic stainless steel under hot working condition. J. Mater. Sci. Technol. 2012, 28, 467–473. [Google Scholar] [CrossRef] [Green Version]
  38. Kim, S.I.; Yoo, Y.C. Dynamic recrystallization behavior of AISI 304 stainless steel. Mater. Sci. Eng. A 2001, 311, 108–113. [Google Scholar] [CrossRef]
  39. Sena, I.; Kottadab, R.S.; Ramamurty, U. High temperature deformation processing maps for boron modified Ti–6Al–4V alloys. Mater. Sci. Eng. A 2010, 527, 6157–6165. [Google Scholar] [CrossRef]
  40. Tan, Y.B.; Yang, L.H.; Tian, C.; Liu, W.C.; Liu, R.P.; Zhang, X.Y. Processing maps for hot working of 47Zr–45Ti–5Al–3V alloy. Mater. Sci. Eng. A 2014, 597, 171–177. [Google Scholar] [CrossRef]
  41. Murty, S.V.S.N.; Rao, B.N.; Kashyap, B.P. Instability criteria for hot deformation of materials. Int. Mater. Rev. 2000, 45, 15–26. [Google Scholar] [CrossRef]
  42. Quan, G.Z.; Zhao, L.; Chen, T.; Wang, Y.; Mao, Y.P.; Lv, W.Q.; Zhou, J. Identification for the optimal working parameters of as-extruded 42CrMo high-strength steel from a large range of strain, strain rate and temperature. Mater. Sci. Eng. A 2012, 538, 364–373. [Google Scholar] [CrossRef]
  43. Mandal, S.; Jayalakshmi, M.; Bhaduri, A.K.; Sarma, V.S. Effect of Strain Rate on the Dynamic Recrystallization Behavior in a Nitrogen-Enhanced 316L(N). Metall. Mater. Trans. A 2014, 45, 5645–5656. [Google Scholar] [CrossRef]
  44. Barnett, M.R. Twinning and the ductility of magnesium alloys: Part II. “Contraction” twins. Mater. Sci. Eng. A 2007, 464, 8–16. [Google Scholar] [CrossRef]
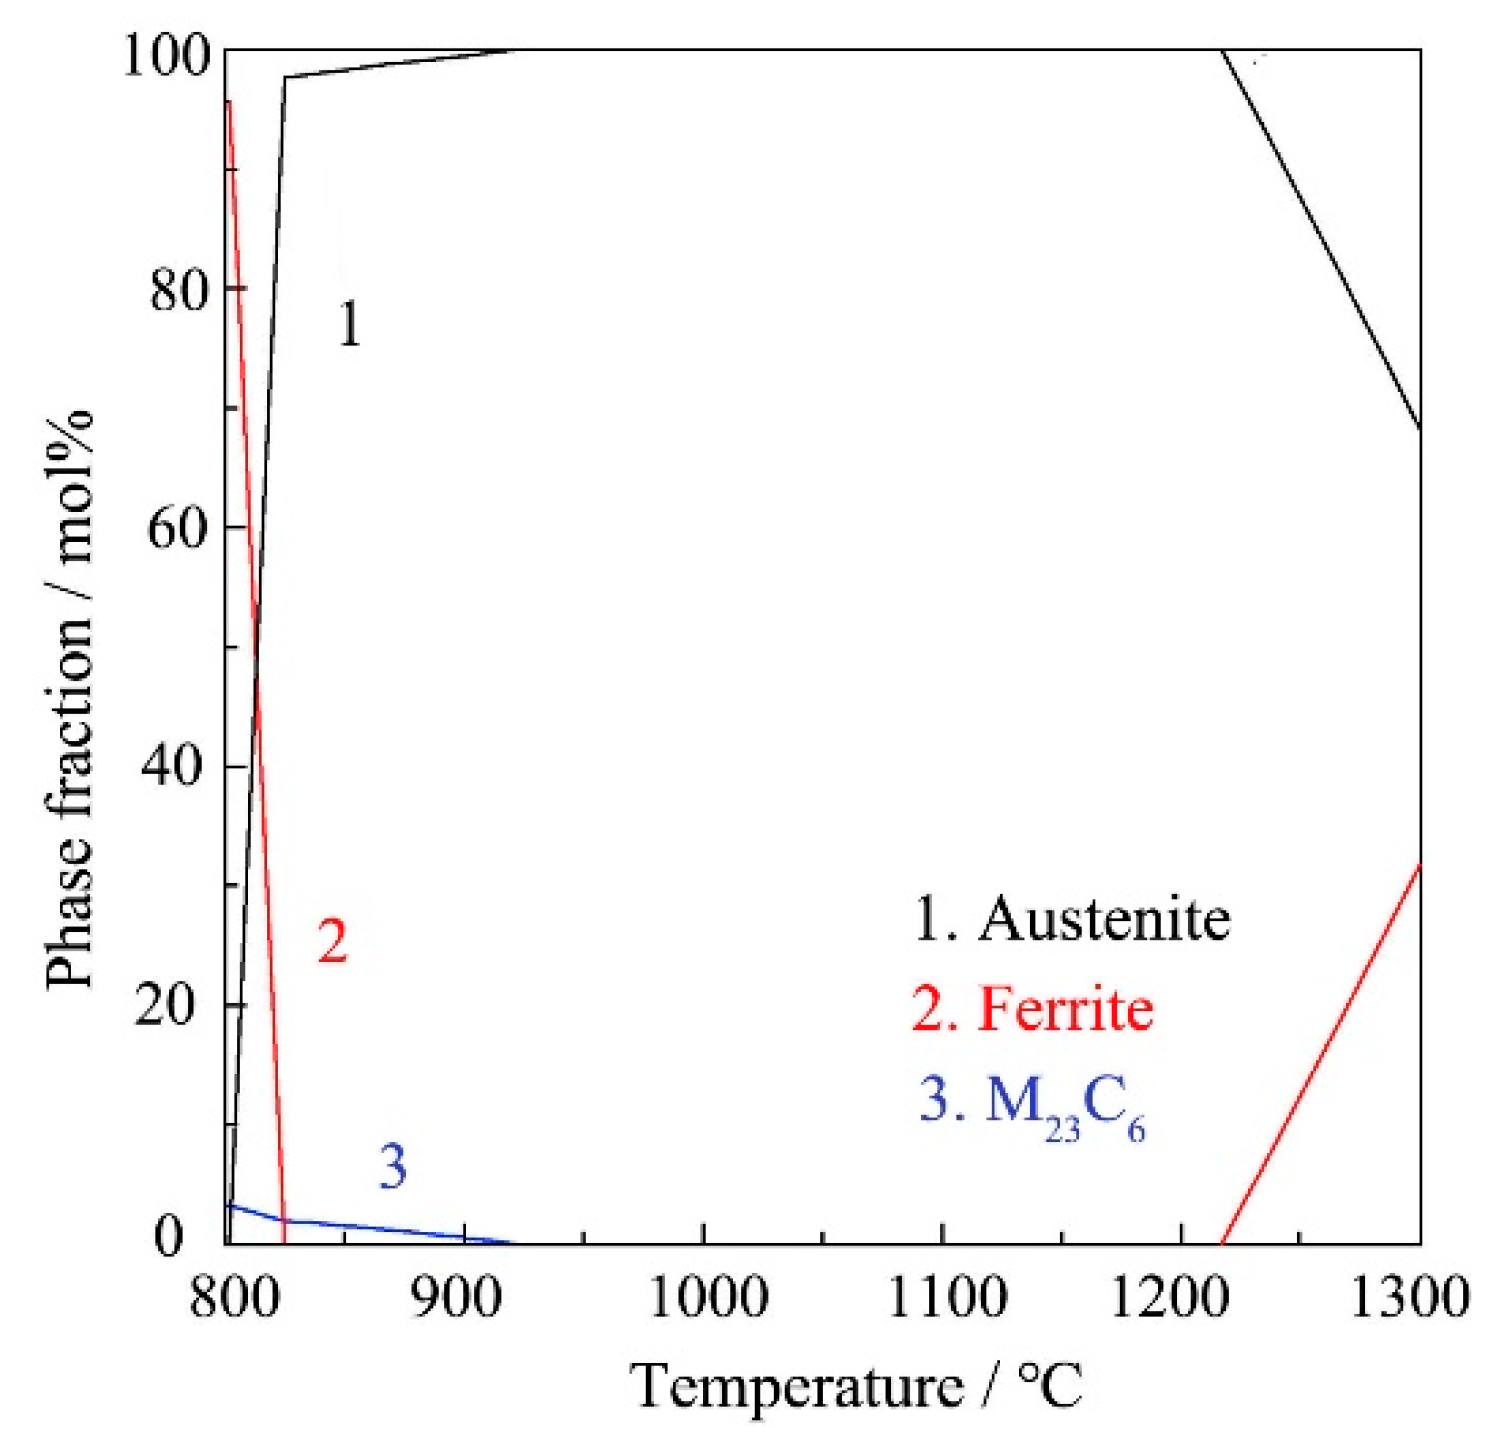
Figure 1. Phase diagram of the experimental steel calculated by Thermo-Calc.
Metals 10 01502 g001
Figure 2. Schematic diagram of the hot compression test procedure.
Metals 10 01502 g002
Figure 3. The initial microstructure of the tested material after reheating.
Metals 10 01502 g003
Figure 4. Typical true stress–true strain curves of the nitrogen-bearing martensitic stainless steel under different deformation conditions: (a) temperature = 1000 °C; (b) strain rate = 0.1 s−1.
Metals 10 01502 g004
Figure 5. Linear relationships between (a) lnσ and ln ε ˙ and (b) σ and ln ε ˙ under different deformation temperatures.
Metals 10 01502 g005
Figure 6. Linear relationships between (a) lnsinh(ασ) and ln ε ˙ under different deformation temperatures, (b) 1/T and lnsinh(ασ) at different strain rates and (c) lnsinh(ασ) and lnZ.
Metals 10 01502 g006aMetals 10 01502 g006b
Figure 7. Relationships between material constants (a) α, (b) n, (c) Q and (d) lnA with true strain.
Metals 10 01502 g007aMetals 10 01502 g007b
Figure 8. (a) Comparison between the values of the experimental and predicted true stress when strain rate is 1 s−1; (b) Correlation between experimental and predicted true stress in this study.
Metals 10 01502 g008
Figure 9. Comparison between the experimental and calculated true stress under the conditions of 950 °C with the strain rate of 0.5 s−1 and 1050 °C with the strain rate of 5 s-1.
Metals 10 01502 g009
Figure 10. Variation of true stress with strain rate at different hot deformation temperatures when true strains are: (a) 0.2, (b) 0.4, (c) 0.6 and (d) 0.8.
Metals 10 01502 g010
Figure 11. Processing maps of the experimental steel at true strains of: (a) 0.2, (b) 0.4, (c) 0.6 and (d) 0.8.
Metals 10 01502 g011
Figure 12. Relationship between peak power dissipation efficiency and true strain.
Metals 10 01502 g012
Figure 13. Microstructures of the hot deformed material under the deformation conditions of: (a) 1000 °C/0.1 s−1, (b) 1100 °C/0.1 s−1, (c) 1100 °C/1 s−1 and (d) 1150 °C/1 s−1.
Metals 10 01502 g013aMetals 10 01502 g013b
Figure 14. Microstructures of the experimental steel at the hot deformation conditions of: (a) 950 °C/10 s−1 and (b) 1000 °C/10 s−1.
Metals 10 01502 g014
Figure 15. Microstructures of the experimental steel at the hot deformation conditions of: (a) 1000 °C/0.01 s−1 and (b) 1100 °C/10 s−1.
Metals 10 01502 g015
Figure 16. TEM images of the experimental material at the deformation condition of 1000 °C/0.01 s−1: (a) deformation twins and (b) bands of flow localization.
Metals 10 01502 g016
Table 1. The sixth-order polynomial fitting coefficients of each material constants.
αValuenValueQValuelnAValue
B00.016C09.306D0524.619E045.432
B1−0.094C1−40.067D1−890.774E1−73.425
B20.533C2242.724D23918.746E2285.684
B3−1.624C3−818.773D3−6409.682E3−299.800
B42.723C41450.887D419.204E4−548.697
B5−2.343C5−1283.694D58418.527E51285.237
B60.806C6448.645D6−5332.214E6−676.125
Publisher’s Note: MDPI stays neutral with regard to jurisdictional claims in published maps and institutional affiliations.