Article

Variation of Grain Height Characteristics of Electroplated cBN Grinding-Wheel Active Surfaces Associated with Their Wear

Faculty of Mechanical Engineering and Aeronautics, Rzeszow University of Technology, 35-959 Rzeszów, Poland
*
Author to whom correspondence should be addressed.
Metals 2020, 10(11), 1479; https://doi.org/10.3390/met10111479
Submission received: 14 September 2020 / Revised: 31 October 2020 / Accepted: 2 November 2020 / Published: 6 November 2020
(This article belongs to the Special Issue Sustainable Machining of Modern Difficult-to-Cut Materials)

Abstract

:
During the operation of a single-layer grinding wheel (SLGW), irreversible changes occur on its active surface due to wear. The study of grinding-wheel microgeometry changes can be based on the measurement of the surface texture as well as the determination and analysis of its parameters. The article deals with the selection of suitable texture parameters and an appropriate mathematical model carrying information about the SLGW condition. In the study, samples of Pyrowear 53 steel were ground using electroplated cBN single-layer grinding wheels until they were completely worn out or removed assumed volume of the workpiece material. Each SLGW worked with constant process parameters. Among the 144 parameters tested, the highest sensitivity to changes in wheel active surfaces caused by wear was shown by the mean value of the mean island heights Zmean_m. In-depth research was conducted for Zmean_m and reduced peak height Spk. Compared to Spk, Zmean_m has proven to be a better measure of wear, especially when large areas of sticking occur. Moreover, the second-degree models linking Zmean_m and Spk to the process parameters and the specific material loss were better suited to the empirical data than the exponential models.

1. Introduction

In the middle of 20th century there were developed effective methods of fabrication, based on synthesis, of two abrasives which play an important role in abrasive machining of materials, i.e., polycrystalline diamond (PCD) and cubic boron nitride (cBN). Both abrasives have been shown to have significantly bigger hardness than other abrasives used before the development of PCD and cBN. For that reason they quickly became important machining materials applied, among other things, to making abrasive tools.
One of the varieties of abrasive tools is single-layer grinding wheels with the cBN abrasive. Those grinding wheels have a single layer of abrasive grains, embedded on a metal core material and joined with that core material with a binder. That binder is usually made using a galvanic method, i.e., in the electroplating process. Electrolytic placement of a nickel-based binder enables manufacturing profile grinding wheels with big repeatability [1]. The profile of such kind of grinding wheel does not change significantly during its operation because its active surface (AS) contains a single layer of a super-hard abrasive material [2,3]. Moreover, strong structure of those grinding wheels enables both applications of high cutting speed while grinding [4,5,6] and removing large amounts of material from machined workpieces in a unit of time [2].
The immutability of grinding-wheel profile makes possible manufacturing products with high repeatability of high quality without the need for grinding-wheel dressing. Therefore, those grinding wheels are often used for profile grinding of machine parts which must be made with high precision. The examples are gears made of steels with big hardness applied in the aeronautical industry [3,7,8] or such machine parts made of nickel superalloys such as: integrally bladed rotor, bladed disc (blisk) [9,10,11], turbine blade [12,13], rotating disc grounded blade slots [9,12,14,15,16,17] and thin-walled honeycomb structures applied to compensation purposes, e.g., in combination with turbine blades, which change their shape under high temperatures [18].
The existence of only one layer of abrasive on a grinding wheel helps in stabilizing the shape of its profile. On the other hand, it makes its machining potential significantly limited due to a relatively small number of abrasive grains located on its AS. Therefore, in the case of single-layer grinding wheels the problem of tool wear, important for all kinds of grinding wheels in general, becomes significantly important [2,19,20,21,22,23,24,25]. The knowledge concerning wear processes taking place during operation of those grinding wheels and knowledge about their effects observed through changes of the AS texture may be very helpful in more effective application of such grinding wheels and better grinding process control. Those factors may lead to calculable and substantial financial benefits.
One of the methods applied to the investigation of the AS condition is the analysis of its microgeomtry based on tactile measurements [26,27,28,29] or optical measurements [30,31,32,33,34,35]. Observed surface texture can be described using many developed parameters which are described in suitable standards [36,37]. Apart from that set of well-described parameters there are several ones which can be determined using specialized analysis software dedicated to measurement data representing surface texture. Taking into consideration that analyzing a large set of parameters is troublesome, it makes sense to select only some parameters describing the texture of AS which can be treated as representative parameters. Those parameters should be the most suitable to interpret and analyze in the context of investigating grinding-wheel wear and its current machining potential. The mentioned analysis and interpretation of condition concerning grinding-wheel AS should be as clear and understandable as possible.
Proper analysis of surface texture, even using some specialized software developed for that purpose, requires suitable knowledge of which texture parameters there should be more attention focused on compared to other parameters. That knowledge is task-dependent because there are no universal parameters which can represent the most important information about particular surface texture in all cases. In other words, the selection of parameters which enable insightful assessment of the measured surface should be made carefully taken into consideration for specific features if the investigated problem concerns, among other things, surface texture and its condition in the context of, e.g., machining potential.
The paper shows which parameters of grinding-wheel AS, selected from a big set containing 144 parameters, change the most with grinding-wheel wear. Parameters included in the standards and parameters corresponding to grains, areas of sticking and deep dimples on AS were analyzed. Those parameters were established as a result of performed comprehensive statistical analyses. It also explains which parameters may be useful to characterize the AS of investigated grinding wheels and observe how their surface textures change due to wear during their operation. At the final stage of investigations described in the paper there were selected two parameters which were further used to develop, using regression analysis, mathematical models representing relations between the grinding process adjustable parameters, the volume of material removed from workpiece and the condition of the grinding-wheel AS.
The above-mentioned regression models were developed in two forms. One of them is associated with second-degree polynomials and the other is based on the exponential function. There are presented and discussed in the paper the results of investigations concerning both developed types of models. The models which are more useful from the point of view of their application in practice are briefly indicated and discussed.
It should be mentioned that the presented methodology of grinding-wheel AS measurement and analysis can be useful also for other single-layer grinding wheels. Similarly, parameters considered to be wear-sensitive may reveal this property not only with regard to the mentioned cBN grinding wheels but also some other types of grinding wheels, e.g., brazed diamond grinding wheels.

2. Materials and Methods

2.1. Experiment

To observe and analyze changes of a single-layered grinding wheel with electroplated binder placed in galvanic process caused by wear there were made suitable investigations. The data collected during those investigations are presented in Table 1. Seventeen grinding wheels were used with the same specification and belonging to the same manufacturing batch. The grinding wheels had monocrystalline abrasive made of cBN grains No B35. During the experiments there were ground flat surfaces of samples made of high-alloyed steel Pyrowear 53. That steel is applied for highly loaded machine parts such as elements of power systems, i.e., shafts and gears of highly loaded aviation gear transmissions [38,39,40]. Each of grinding wheels worked with constant values of process parameters such as grinding speed v s , feed speed v w and grinding depth a e . The values of adjustable parameters for each grinding wheel were designated using applied plan of experiment computed with a statistical software package JMP 12 developed by SAS Institute [41].
The grinding process with the particular grinding wheel was completed after removing by grinding the following specific material volume V = 2652 mm 3 / mm or recognition of catastrophic tool wear signaled by very intensive noise coming from the ground material volume or observing the strands of scuffed-off abrasive with the unaided eye.

2.2. Examination of Surface Texture

During the period of grinding-wheel exploitation the texture of its AS was investigated 5 to 6 times, excluding those grinding wheels which become worn out in a very short time Table 5. For this purpose replicas of the surface located on AS were done in 6 different locations. Those locations were uniquely identified. Therefore, at each stage of experiment the same locations on the AS were determined and mapped with the help of replicas. The replicas were measured at the next stage using the InfiniteFocus microscope which applies the focus variation technique for computing a three-dimensional image of the surface [42]. Measurement parameters are presented in Table 2. During measurements there were collected sets of data representing 480 surface measurement areas.
In measurements done with the InfiniteFocus microscope a replica mode was always applied. In such mode the measurement system takes into account that the measurements of replicas consider the so-called negative geometry of a sample surface. Therefore, measurement points were mirrored along the vertical axis automatically. Thanks to that procedure the analyzed data represented the real form of the surface texture of particular grinding-wheel AS and not the form of made replicas. During measurements performed with the InfiniteFocus microscope each measurement point was assigned suitable color, reflecting the magnitude of height of that point, i.e., location along the vertical axis. Thanks to that it became possible to obtain a real view of the measured surface, including both its shape and real colors. Based on such information it was possible to recognize dominating forms of wear concerning grinding-wheel AS.
Processing of measurement data was made using software package SPIP 6.4.2. The introductory processing stage consisted of filtering input data representing the profile of shape with second-degree polynomial filter and selective removal of artifacts, i.e., errors typical in optical measurements. Almost each measured data contained were a few of such artifacts varying from 0 to 10. The values of points’ coordinates obtained during optical measurements of selected areas were replaced with values computed by approximation of coordinates of points adjacent to those areas. Based on data modified that way there were determined 144 parameters describing microgeometry of grinding-wheel AS. The first set of such parameters contains space parameters computed from the whole set of measurement points detected on a particular measured area:
  • 40 parameters of texture defined in SPIP 6.4.2 software, including parameters defined in ISO and ASME standards [36,37] and in European Union Report [43];
  • 35 parameters of texture joined to the SPIP 6.4.2 software library using own developed procedures (scripts):
    parameters Vmp, Vmc, Vvc, Vvv (computed according to the ISO 25178-2:2012 standard [36]);
    Smc(mr)—the height of surface (elevation value) for a bearing area value mr, for m r obtaining values from 5 % to 95 % with step 5 % (computed according to the ISO 25178-2:2012 standard [36]);
    Smc(mr1_mr2)—average value of elevation between two bearing area values mr1 and mr2 (expressed with Formula (1)): Smc(0_5), Smc(0_10), Smc(0_15), Smc(0_20), Smc(0_30), Smc(0_40);
    S m c ( m r 1 _ m r 2 ) = i = 1 n h i n
    where: h i —elevation values from within the range of bearing area ( m r 1 , m r 2 ), n—the number of points from within the range of bearing area values (mr1,mr2);
    dSmc(mr1_mr2)—relative average value of elevation between two bearing area values mr1 i mr2 (where mr 2 > mr 1 ), assuming elevation value equal 0 on the level associated with Smc(mr2) (expressed with Formula (2)): dSmc(0_5), dSmc(0_10), dSmc(0_15), dSmc(0_20), dSmc(0_30), dSmc(0_40).
    d S m c ( m r 1 _ m r 2 ) = i = 1 n h i S m c ( m r 2 ) n
    where: h i —elevation values from within the range of bearing area values (mr1,mr2), Smc(mr2)—the height associated with bearing area mr2, n—the number of points from within the range of bearing area values (mr1,mr2);
The rest 69 parameters were determined for only selected areas associated with such characteristic elements existing on the grinding-wheel AS such as grains, sticking areas and deep dimples formed during the manufacturing process or after grain removal (pores). In order to determine parameters related to particles corresponding to grains and sticking areas as well as pores it was necessary to extract those elements from the measured textures. The methodology of those procedures is described in detail in [44]. In particular, it is possible to determine the bearing area curve (BAC) three ranges which approximately are related to characteristic features of grinding-wheel AS.
The elevation area is related to the measurement points reflecting abrasive grains and sticking areas. Sticking areas that developed during grinding are associated with gumming up of grinding wheels. The area of the valleys can be associated with hollows in the binder, e.g., due to grain tearing out. The core area is mainly represented with points related to the binder. Compared to the binder cavities, grains and sticking areas, the measuring points in the area of the binder have a small variance in height.
During computations there was searched such fragment of the bearing area curve which represented a 40% of bearing area with the smallest slope. The mean point height for that section of the curve was taken as the mean level of the binder. That level was used as a limit level for determining the cutoff level for pores and particles. Depending on the surface area, the particles were divided into grains and sticking areas. Sticking areas were particles with an area bigger than 2500 μ m 2 . Among all investigated parts of new grinding wheels’ active surfaces at least 99 % of grains had area smaller than 2500 μ m .
Parameters of areas of type grain, sticking area and pore were computed using the module Particle & Pore of the SPIP 6.4.2 software. From the very numerous groups of available island parameters there were selected 23 parameters related to:
  • the base area of the islands: mean value Am , standard deviation Asd , the percentage of islands in the entire area of analysis A % ;
  • the volume of the islands V: sum value Vsum , mean value Vm , standard deviation Vsd ;
  • the maximum height of the island Zmax : average value for all islands Zmax _ m , standard deviation value of all islands Zmax _ sd ;
  • the average altitude of the island Zmean : average value for all islands Zmean _ m , standard deviation value of all islands Zmean _ sd ;
  • equivalent diameter of the islands dD (diameter of a circle with the same surface area as the island): average value dDm , standard deviation dDsd ;
  • the largest Ferret diameter of the islands dF : mean value dFm , standard deviation dFsd ;
  • the length of the islands L defined in [45]: mean value Lm , standard deviation Lsd ;
  • the width of the islands B defined in [45]: mean value Bm , standard deviation Bsd ;
  • the circumference of the islands P: mean value Pm , standard deviation Psd ;
  • the distance to the nearest island ND : mean value NDm , standard deviation NDsd ;
  • the number of islands Lw.
The ‘s’ index was added to the particles representing sticking areas and the ‘p’ index was added to the parameters representing the deep valleys. The parameters of grain-related particles were not assigned an additional index. For example: A % means the percentage of grain type particles in the entire area of the analysis, while A % ( s ) means the percentage of sticking area type particles throughout the analysis area.

3. Results and Discussion

3.1. Forms of Grinding Wheel as Wear

Depending on the forms of abrasive, machined material, wear grade and adjustable parameters of grinding process grinding wheels with single-layer galvanic binder (i.e., binder put on the grinding-wheel core material in a galvanic process) often wear due to:
  • grain crushing,
  • grain grinding,
  • breaking grains from the binder.
In performed investigations all forms of grinding-wheel wear excluding breaking grains from the binder were determined from the 3D images of replicas reflecting real colors of observed textures. However, the forms of wear associated with breaking grains from the binder were observed as a result of the analysis concerning texture maps.
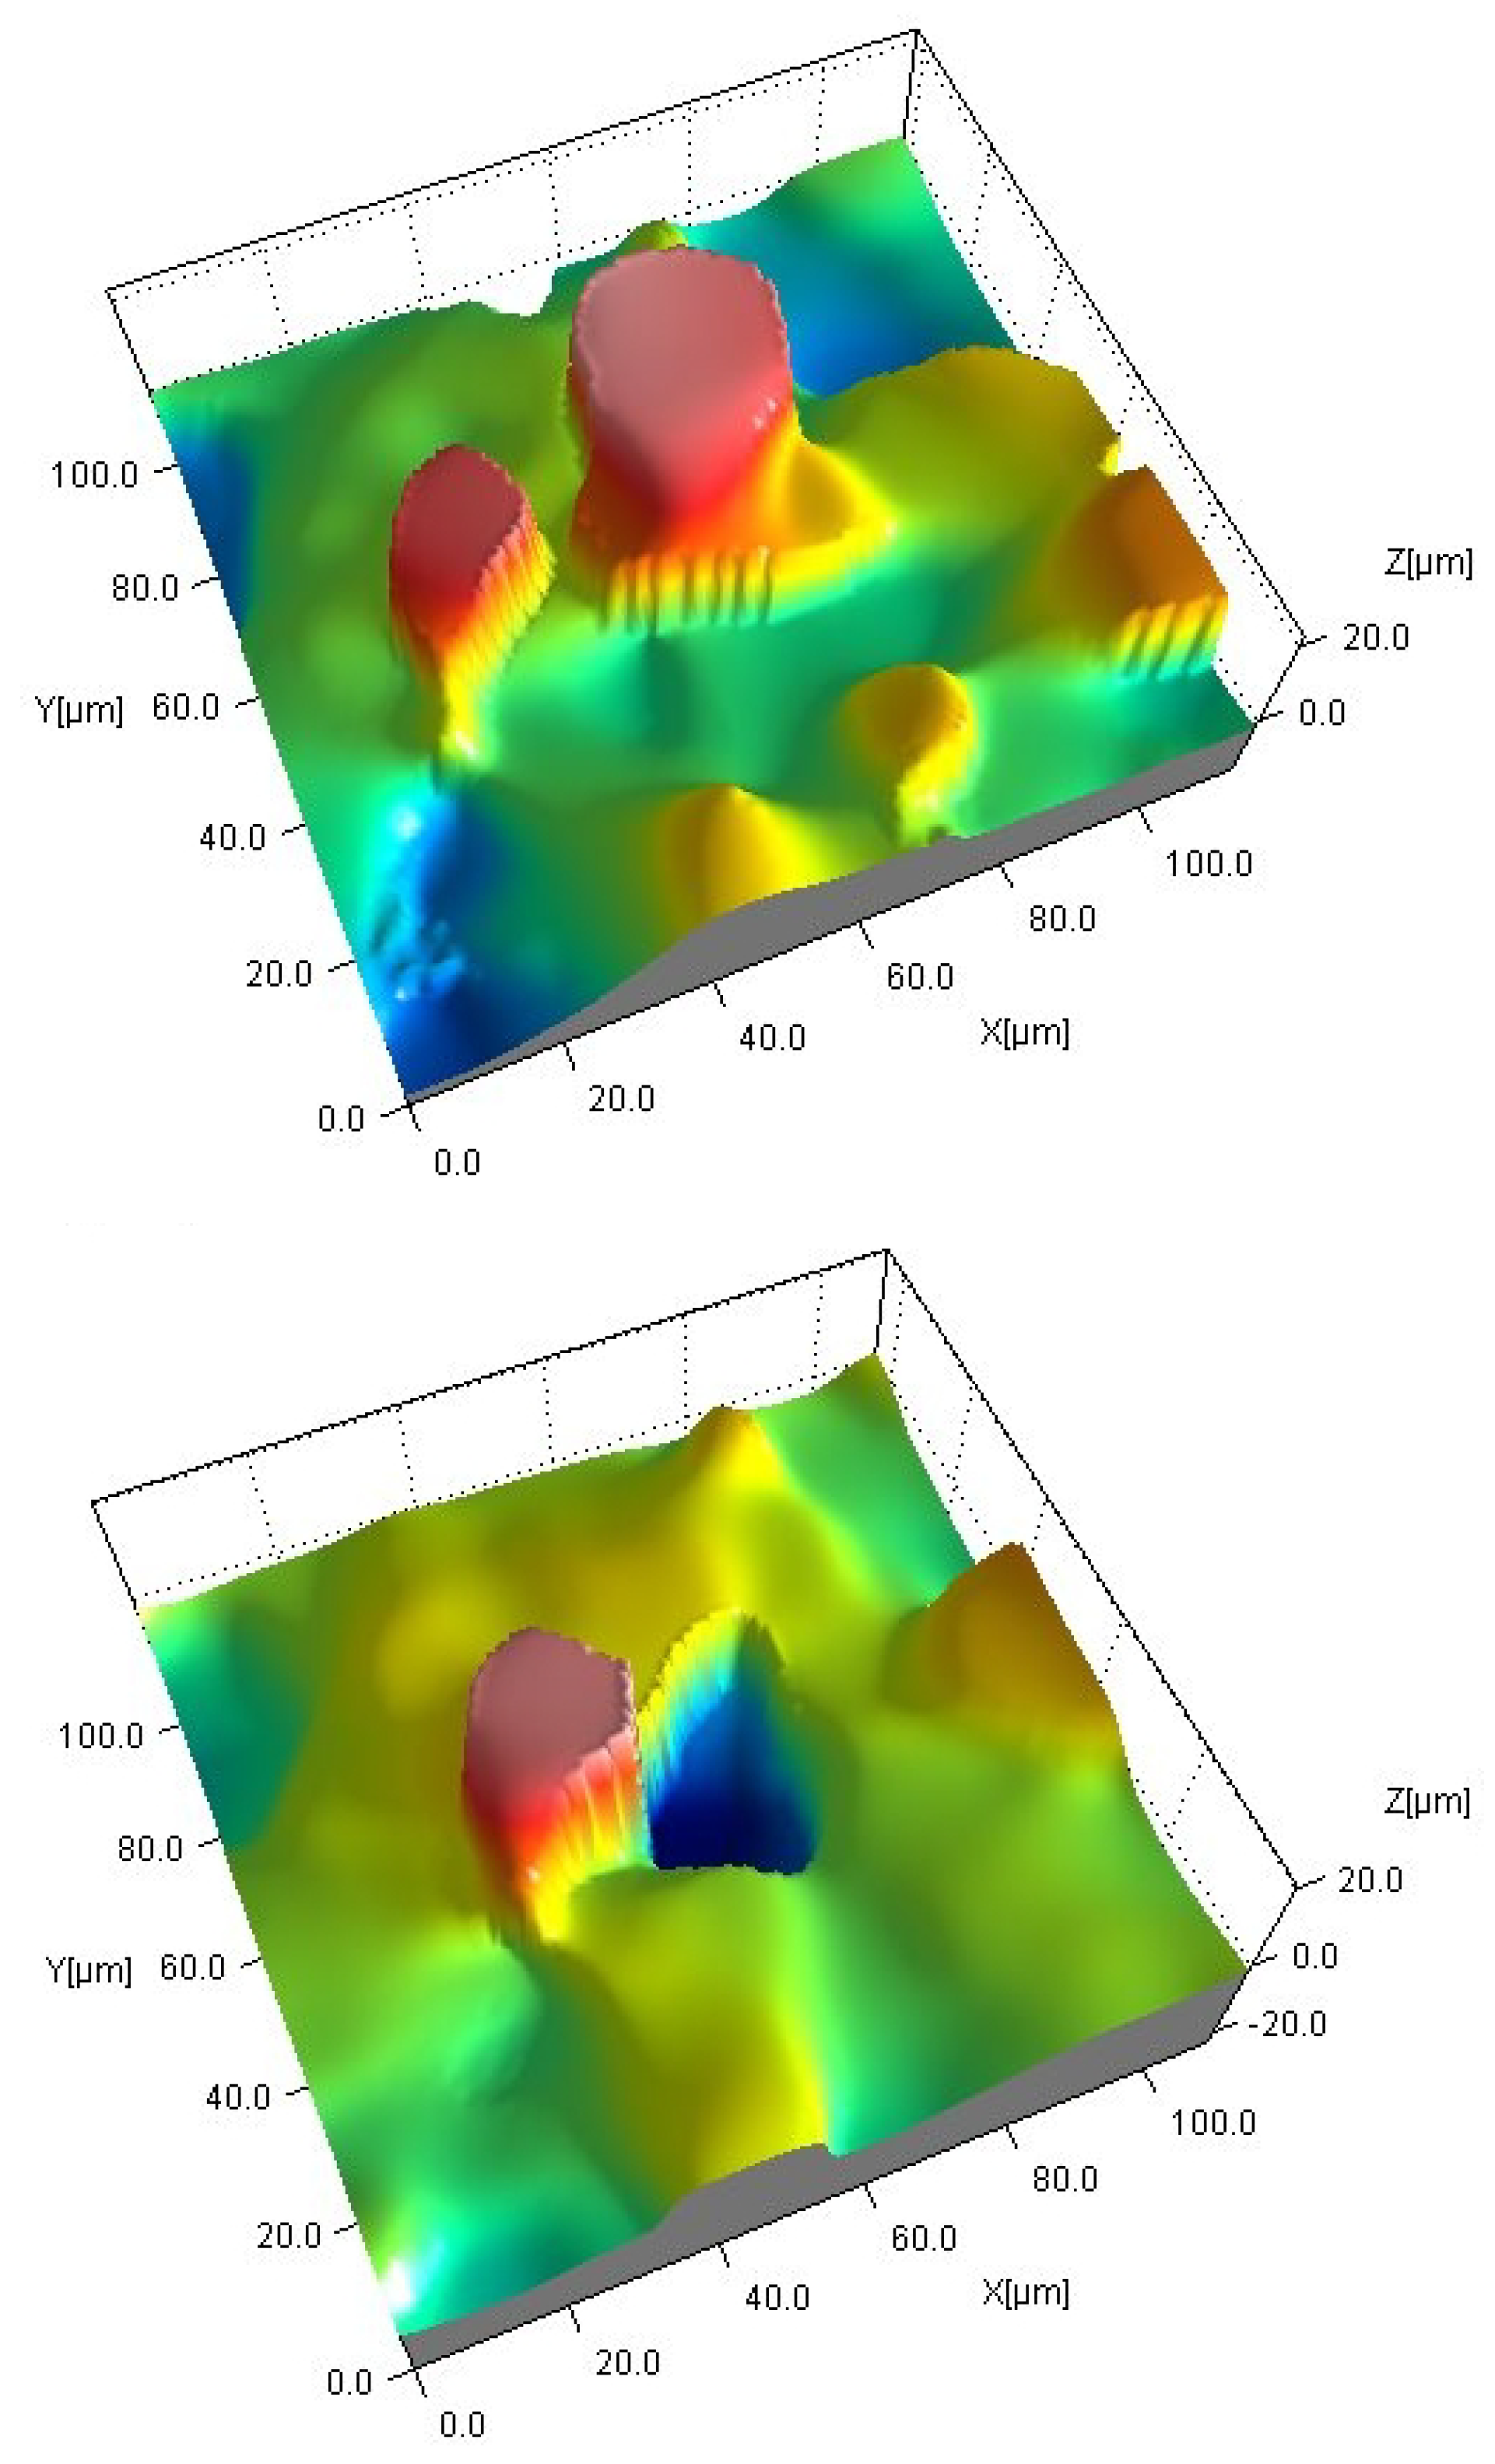
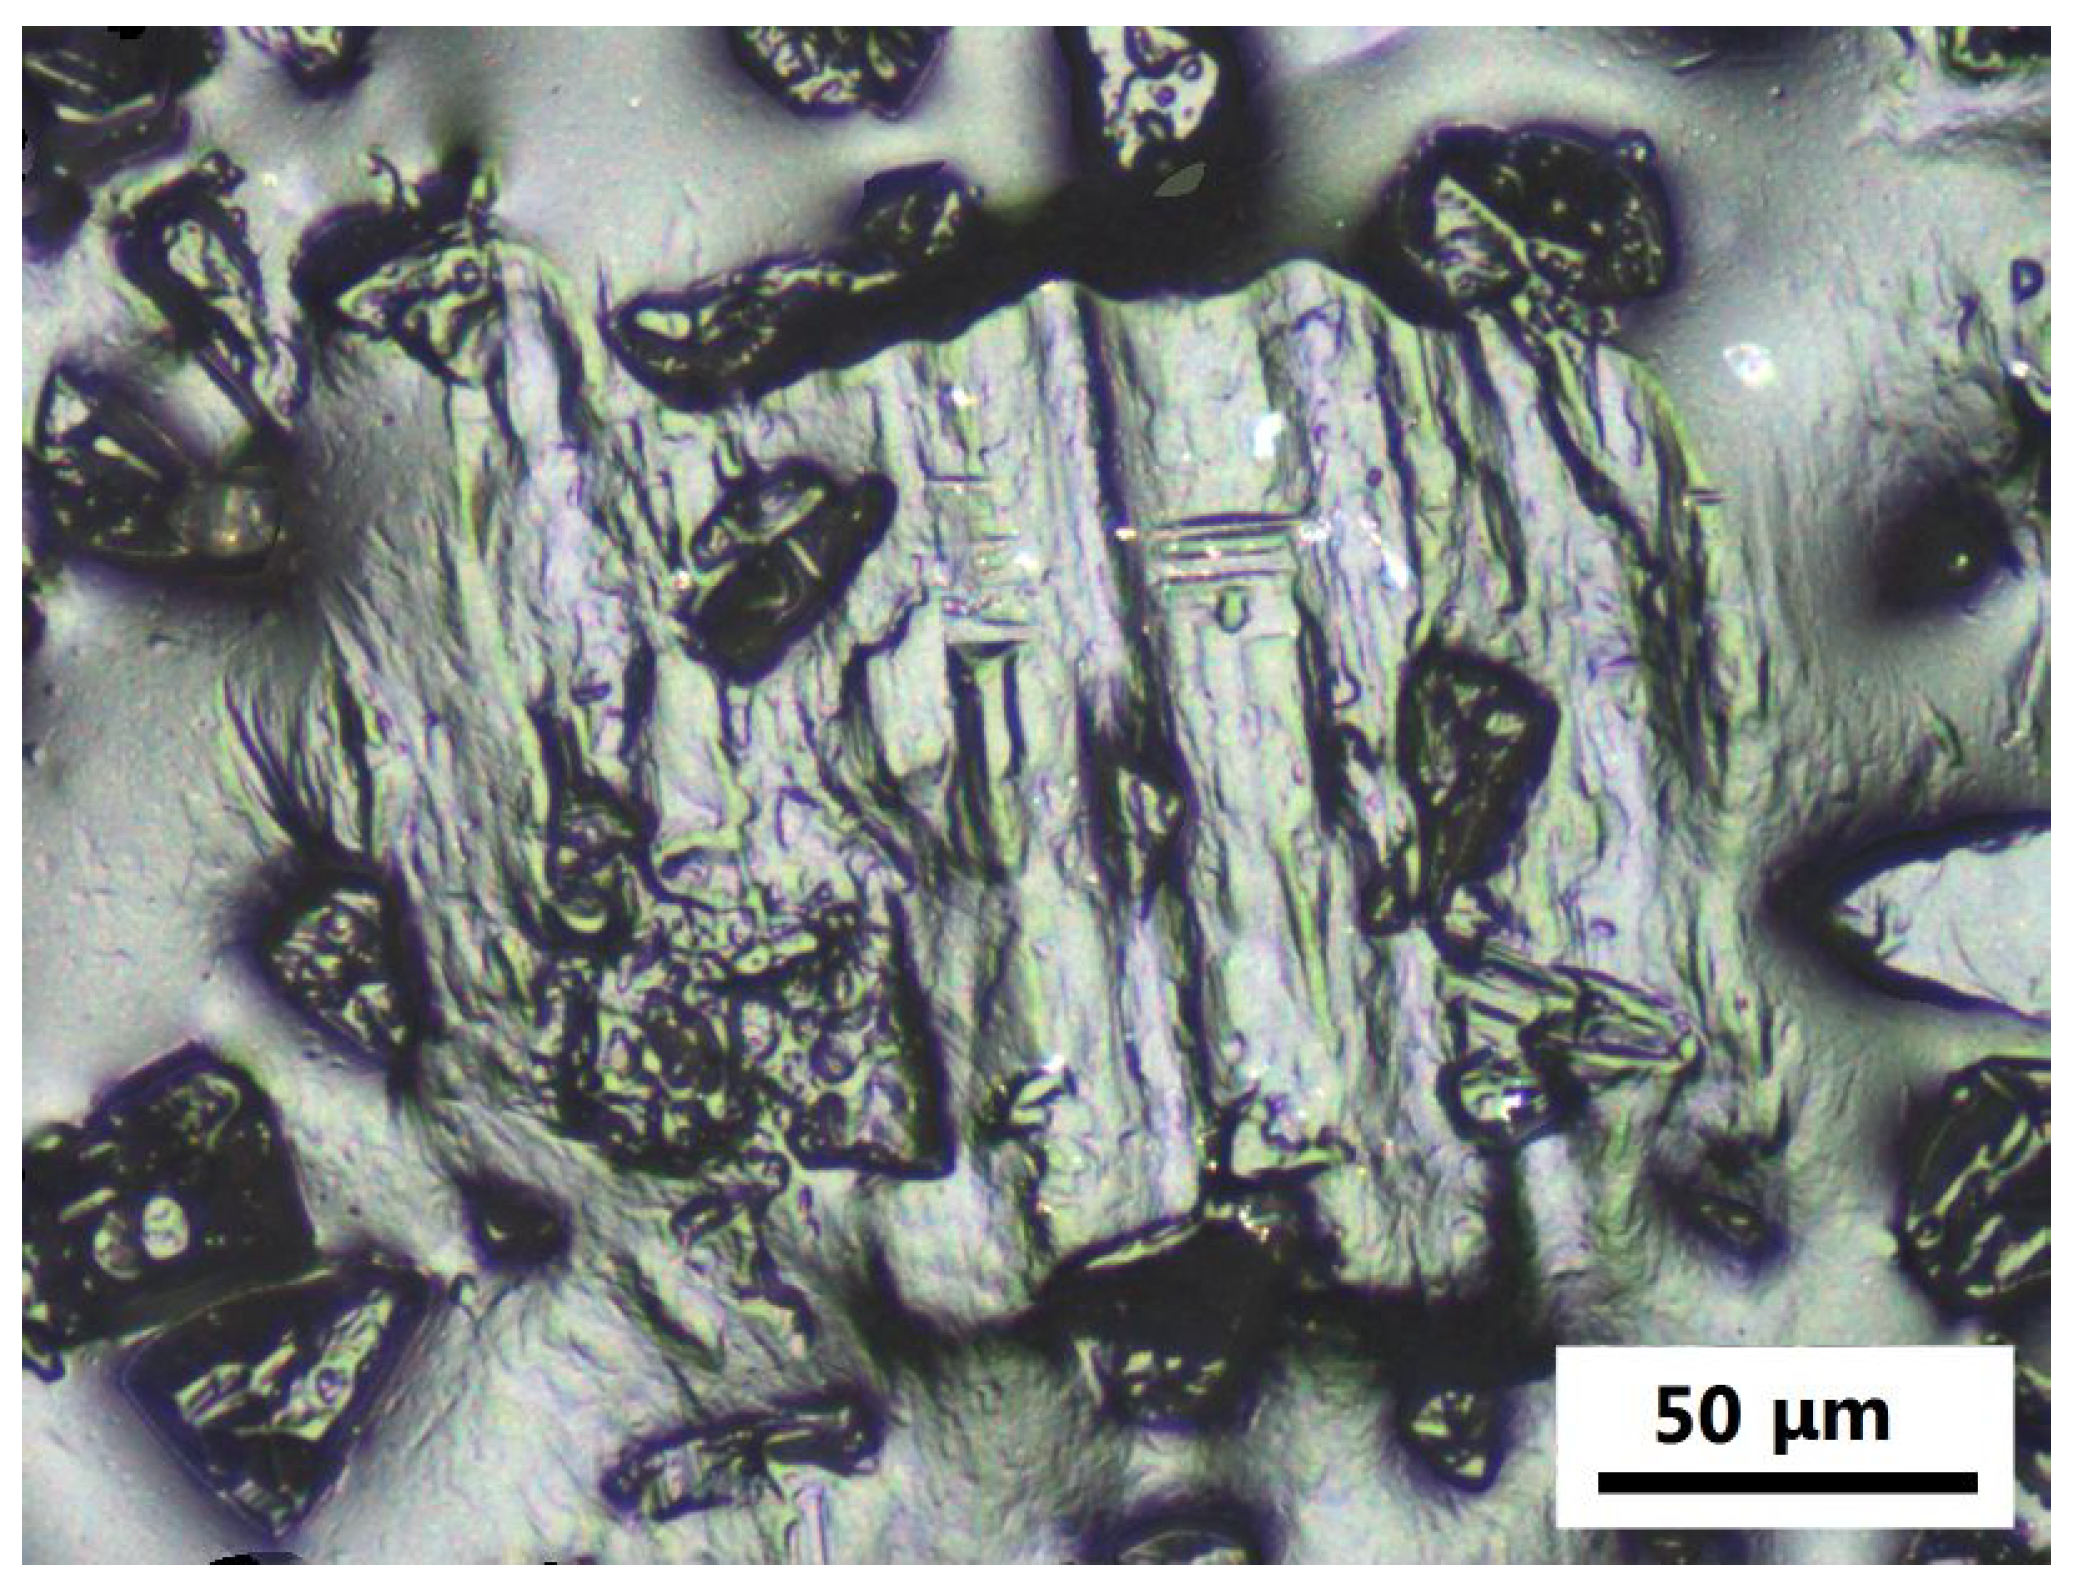
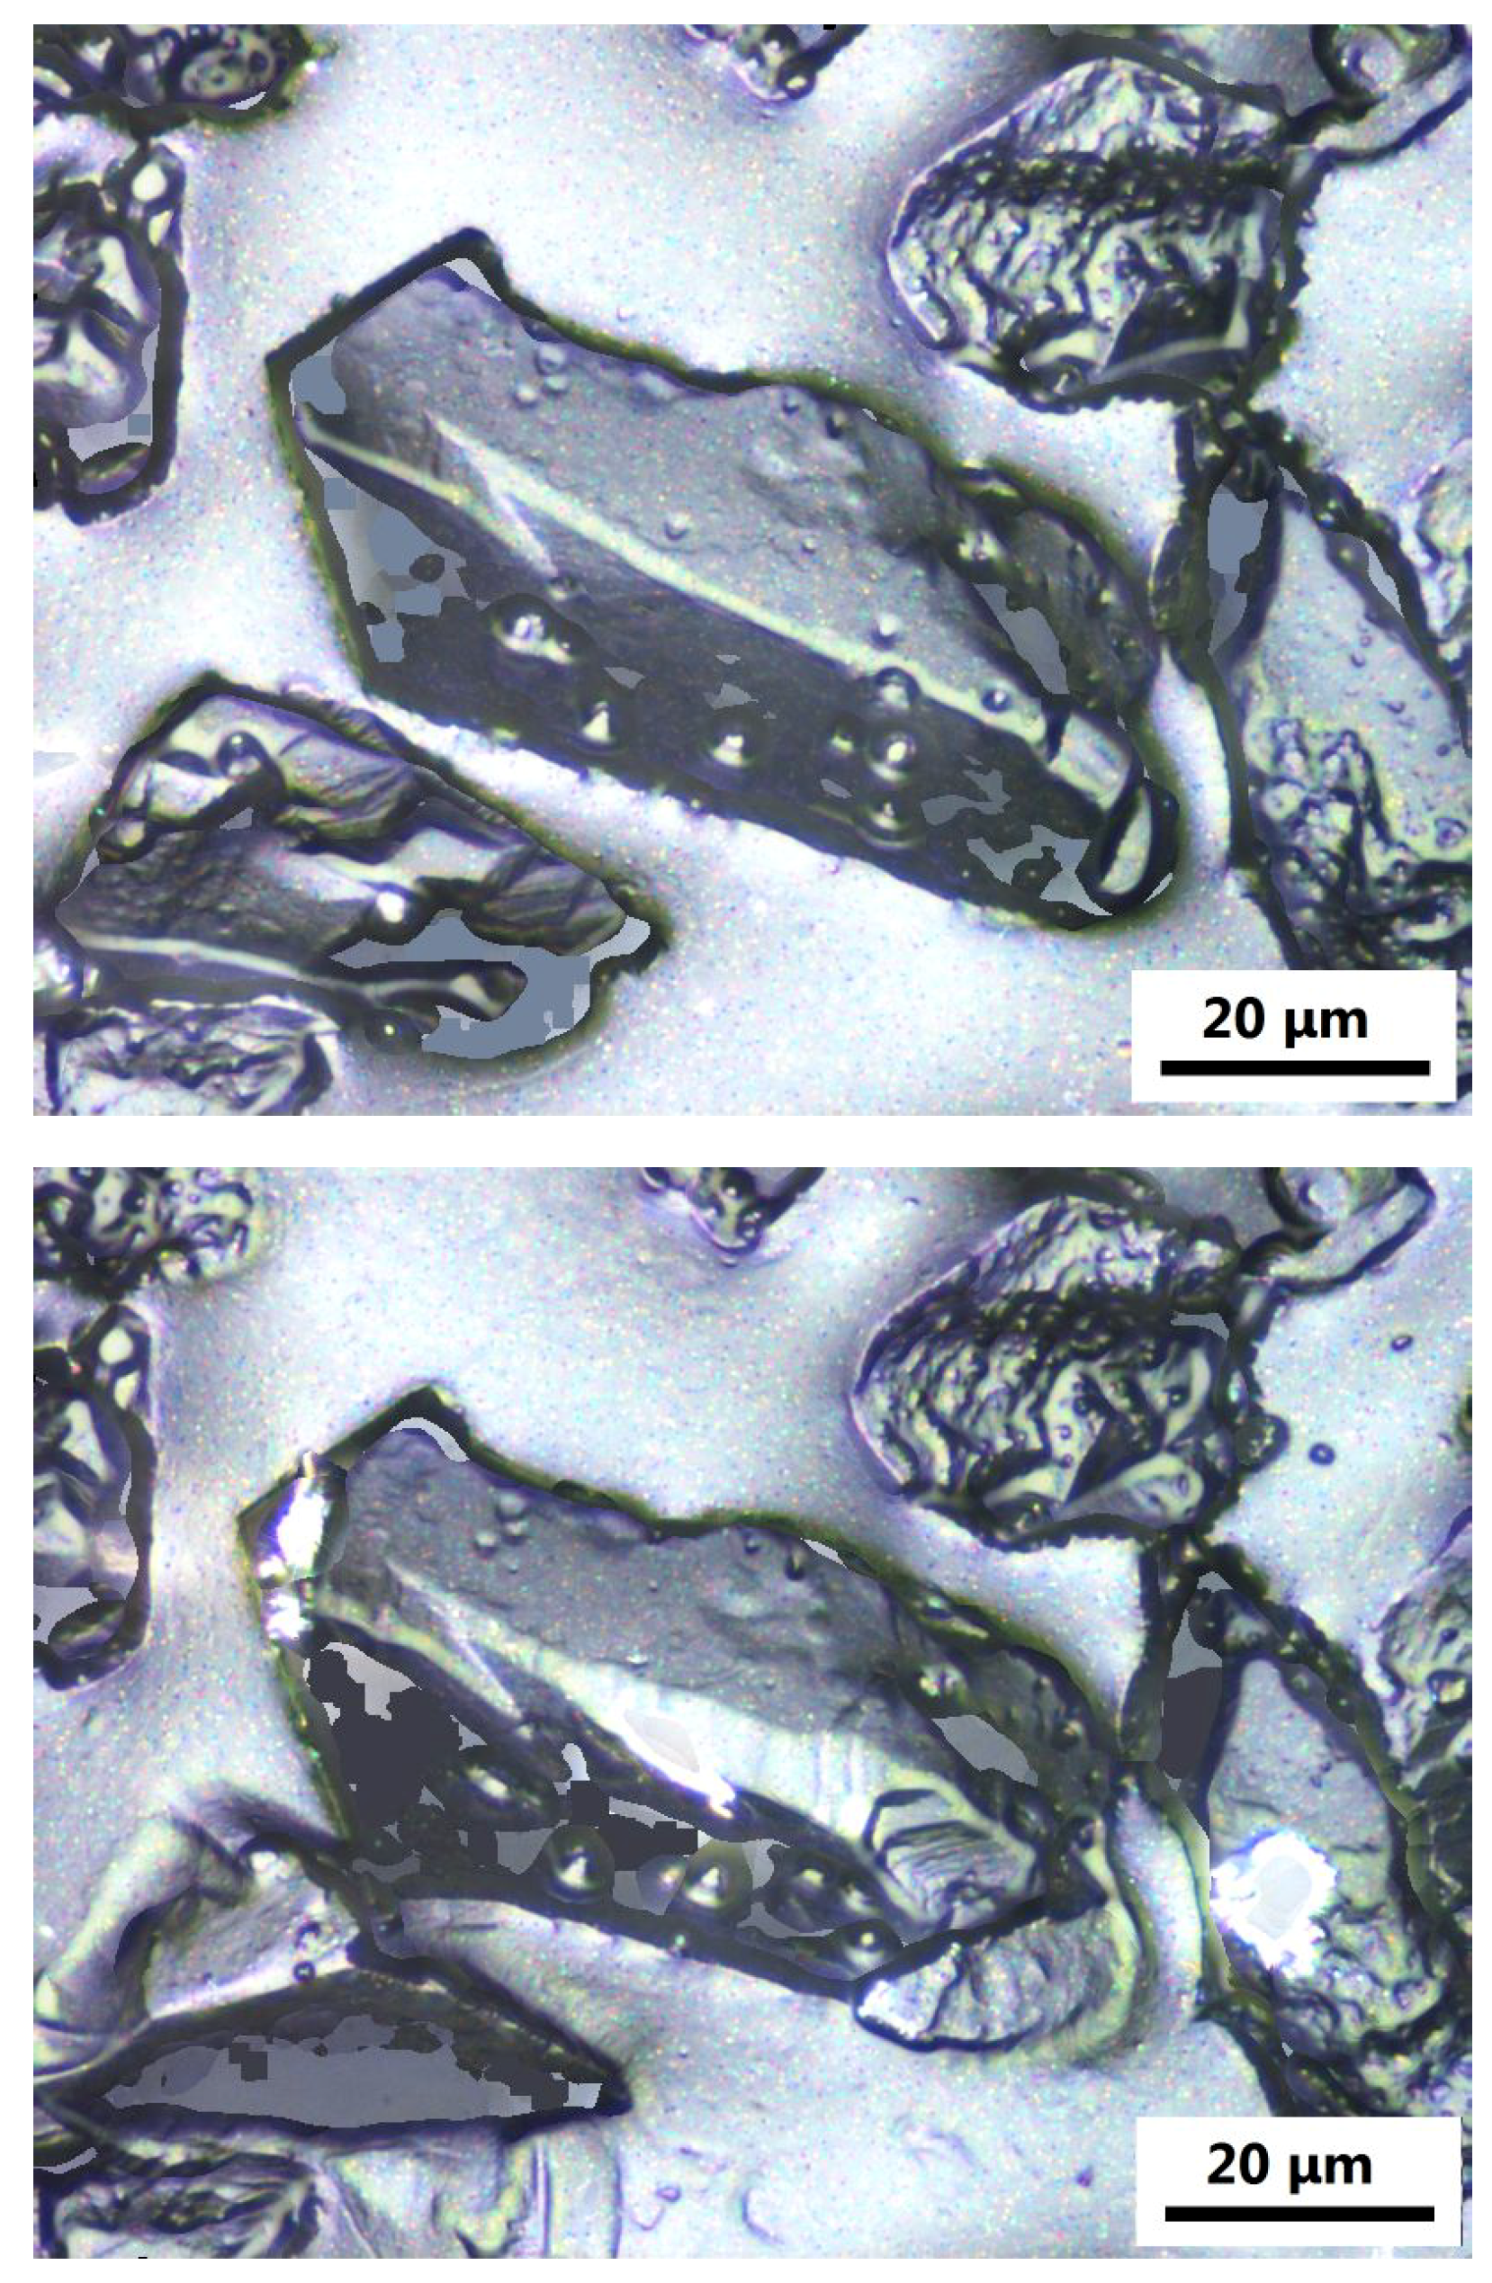
In the case of each grinding wheel there were analyzed one representative measurement area at each stage of the grinding wheel wear. It was noted that the predominant form of wear for all grinding wheels was grain crushing (Figure 1). Breaking grains from the binder (Figure 2) was less common. However, that form of wear was present on each grinding wheel after its operation. Sticking areas were identified on 13 from 17 investigated grinding wheels (Figure 3). They usually covered several abrasive grains. There were found approximately 0 to 4 sticking areas ( Q 3 = 4 ) on each analyzed fragment of the observed surface. Grain grinding (Figure 4) was noticed only rarely.
The observed wear of investigated grinding wheels had its impact both on change of their textures and values of parameters describing surface texture.

3.2. The Selection of Parameters Sensitive to Wear of Grinding-Wheel AS

To determine parameters that changed most with the wear of the grinding wheel the Analysis of Variance for repeated measurements (ANOVA) was applied for the results of measuring the same surfaces several times. The null hypothesis H 0 of the performed test assumed that the value of a particular parameter does not change in subsequent observations. There were excluded from the analysis of those replicas which were made after the grinding wheel was worn out. It was assumed that the selection of parameters should be based on their sensitivity to grinding-wheel wear at the stages, when grinding wheels still have their cutting properties for continuing work.
The measure of the “intensity of changes” of particular parameter caused by the AS wear was associated with the probability p used in the test verifying of the null hypothesis H 0 . The value of p above the established significance level of the test α = 0.05 signified no grounds for rejection of the null hypothesis H 0 . It led to the conclusion that a particular parameter was not significantly changing on observed surfaces which were compared with each other. Therefore, in such case, i.e., p > 0.05 it was concluded that the parameter is not sensitive to grinding-wheel wear. The value of probability p below the established significance level of the test ( α = 0.05 ) indicated that the analyzed parameter should be rejected from the set because it is insensitive to wheel wear as a result of the grinding process.
Taking into consideration the above-mentioned interpretation of “intensity of changes” concerning the analyzed parameter its sensitivity related to the grinding-wheel wear was defined as a value inversely proportional to the value p. Computations performed to determine the intensity of changes concerning analyzed parameter in correlation with grinding-wheel wear had to consider the number representing degrees of freedom (DOF). According to the statistical hypothesis testing theory [46,47,48], in order to compare the significance of the influence of different factors on the dependent variable, it should be ensured that the number of degrees of freedom when analyzing those factors is the same. It is important because the number of degrees of freedom affects the value of the calculated probability p. All analyses presented in the paper were computed using the statistical package JMP 12.
To verify the null hypothesis H 0 in performed investigations two statistical tests were used:
  • Fisher testem (F test),
  • Greenhouse–Geisser test (G-G test).
The Fisher test is the basic test used to verify the null hypothesis in the Multivariate Analysis of Variance (MANOVA) with repeated trials and in the conducted research it provided the same number of degrees of freedom for all tested parameters. However, the F test assumes spherical variance. The calculations made on collected data showed that this condition was met for most of the analyzed parameters.
If condition concerning the sphericality of the variance is not met, the Greenhouse–Geisser test is applied, which introduces an amendment to the F test taking into account the above-mentioned deviations from the sphericality of the variance. However, this amendment reduces the number of degrees of freedom. Therefore, after its application, the final number of DOF degrees of freedom of individual parameters was different and depended on the amount of the introduced correction.
For both the F test and the G-G test, the CPS parameters were arranged in two series, in ascending order of probability p. Each of the two series had a rank assigned to them. There was noticed a very high similarity regarding the order of parameters in each of the series—the ranks of a given parameter calculated for the F test and the G-G test were equal or differed by only a maximum of several positions. In the case of both tests calculated for a set of the same 42 parameters, there were no grounds for rejecting the null hypothesis H 0 , so these parameters were considered “insensitive” to wheel wear and were excluded from further analysis. More than half, i.e., 20, of the parameters for which there were no grounds for rejecting the null hypothesis H 0 are the parameters describing sticking areas related to gumming up of grinding wheels.
For parameters for which the null hypothesis H 0 was rejected, which predestined them to be a subset of the wheel wear-sensitive parameters, the mean value of the combination was calculated from both ranks assigned to them in each series. The lower the mean value, the more sensitive the parameter was to wheel wear. Based on the univariate Analysis of Variance (ANOVA), it was also possible to determine how the tested parameters changed at subsequent stages of testing, i.e., along with the wear of the grinding wheel.
The list of parameters which to a statistically significant extent, as determined by the ANOVA analysis result, changed with the wear of the wheel and the mean value of ranks calculated for them is presented in Table 3. The sign (−) in Table 3 next to the parameter name means that its value decreased with the wear of the grinding wheel. The sign (+) indicates the opposite relationship.
Two parameters, i.e., Zmean_m and Zmean_sd obtained the lowest value of ranks. These parameters were almost fully positively correlated with each other–the value of the r-Pearson correlation coefficient was 0.99. In order to present variation of grain height on AS caused by wear the parameter Zmean_m was selected in the following stages of investigations, because in such case it is relatively easy to understand the information it provides. To compute the Zmean_m value of a given area, the mean value of the height of points from the area h m is determined for each grain particles. The parameter Zmean_m is the average value of h m :
Z m e a n _ m = j = 1 k h m k = j = 1 k i = 1 n h i j n j k
where: h i j —the height of i-th point from j-th particle, n j —the number of points in j-th particje, k—the number of particles.
In simple terms, the Zmean_m parameter therefore represents the average height of the grains. It gives an overview of how many grains “stick out” above the level of the binder, and thus the depth to which they can penetrate the processed material in order to deform it and cut it. It is intuitive to link this parameter with the cutting potential of the grinding wheel. It can be also stated that the Zmean_m parameter is directly proportional to them.
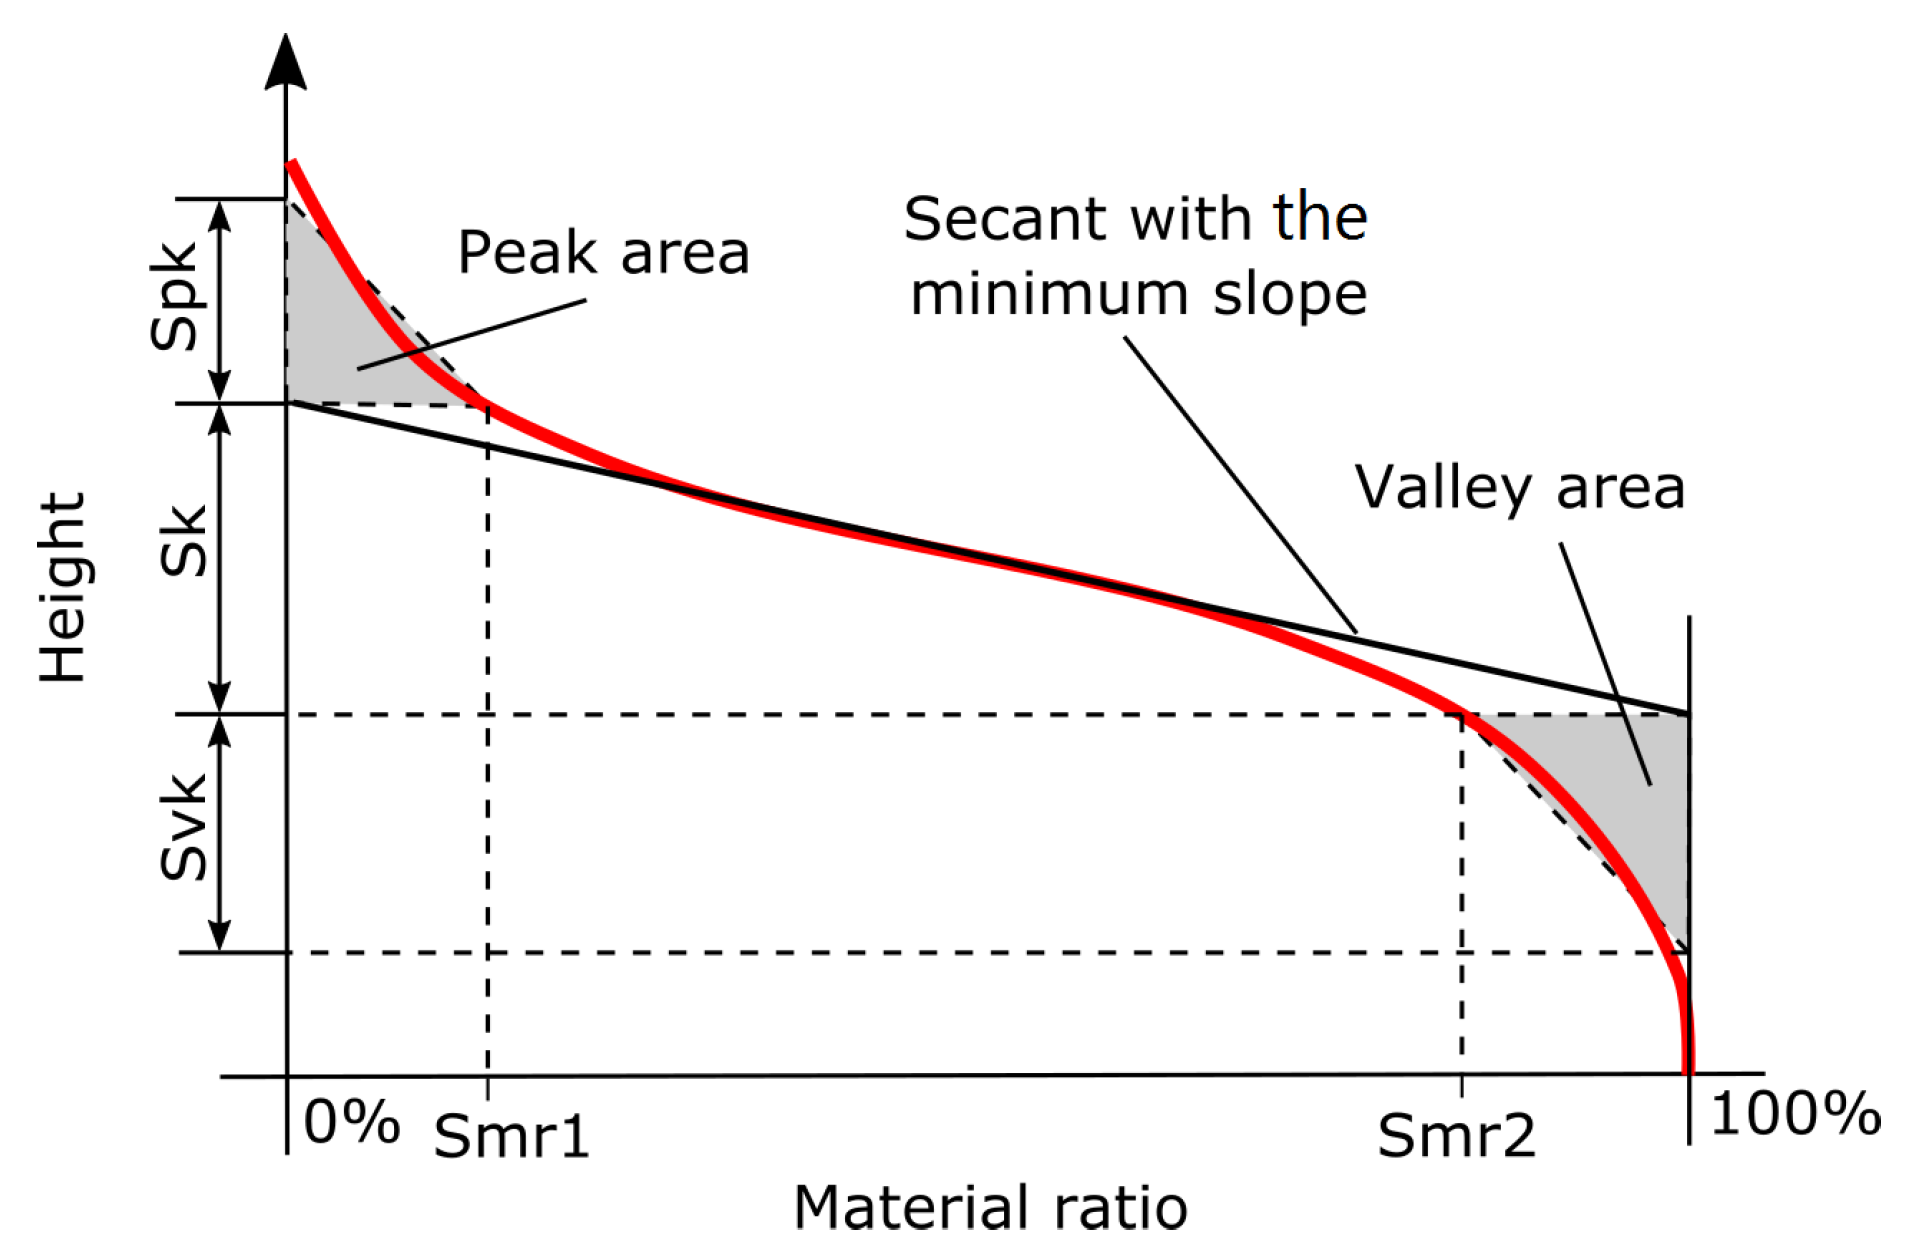
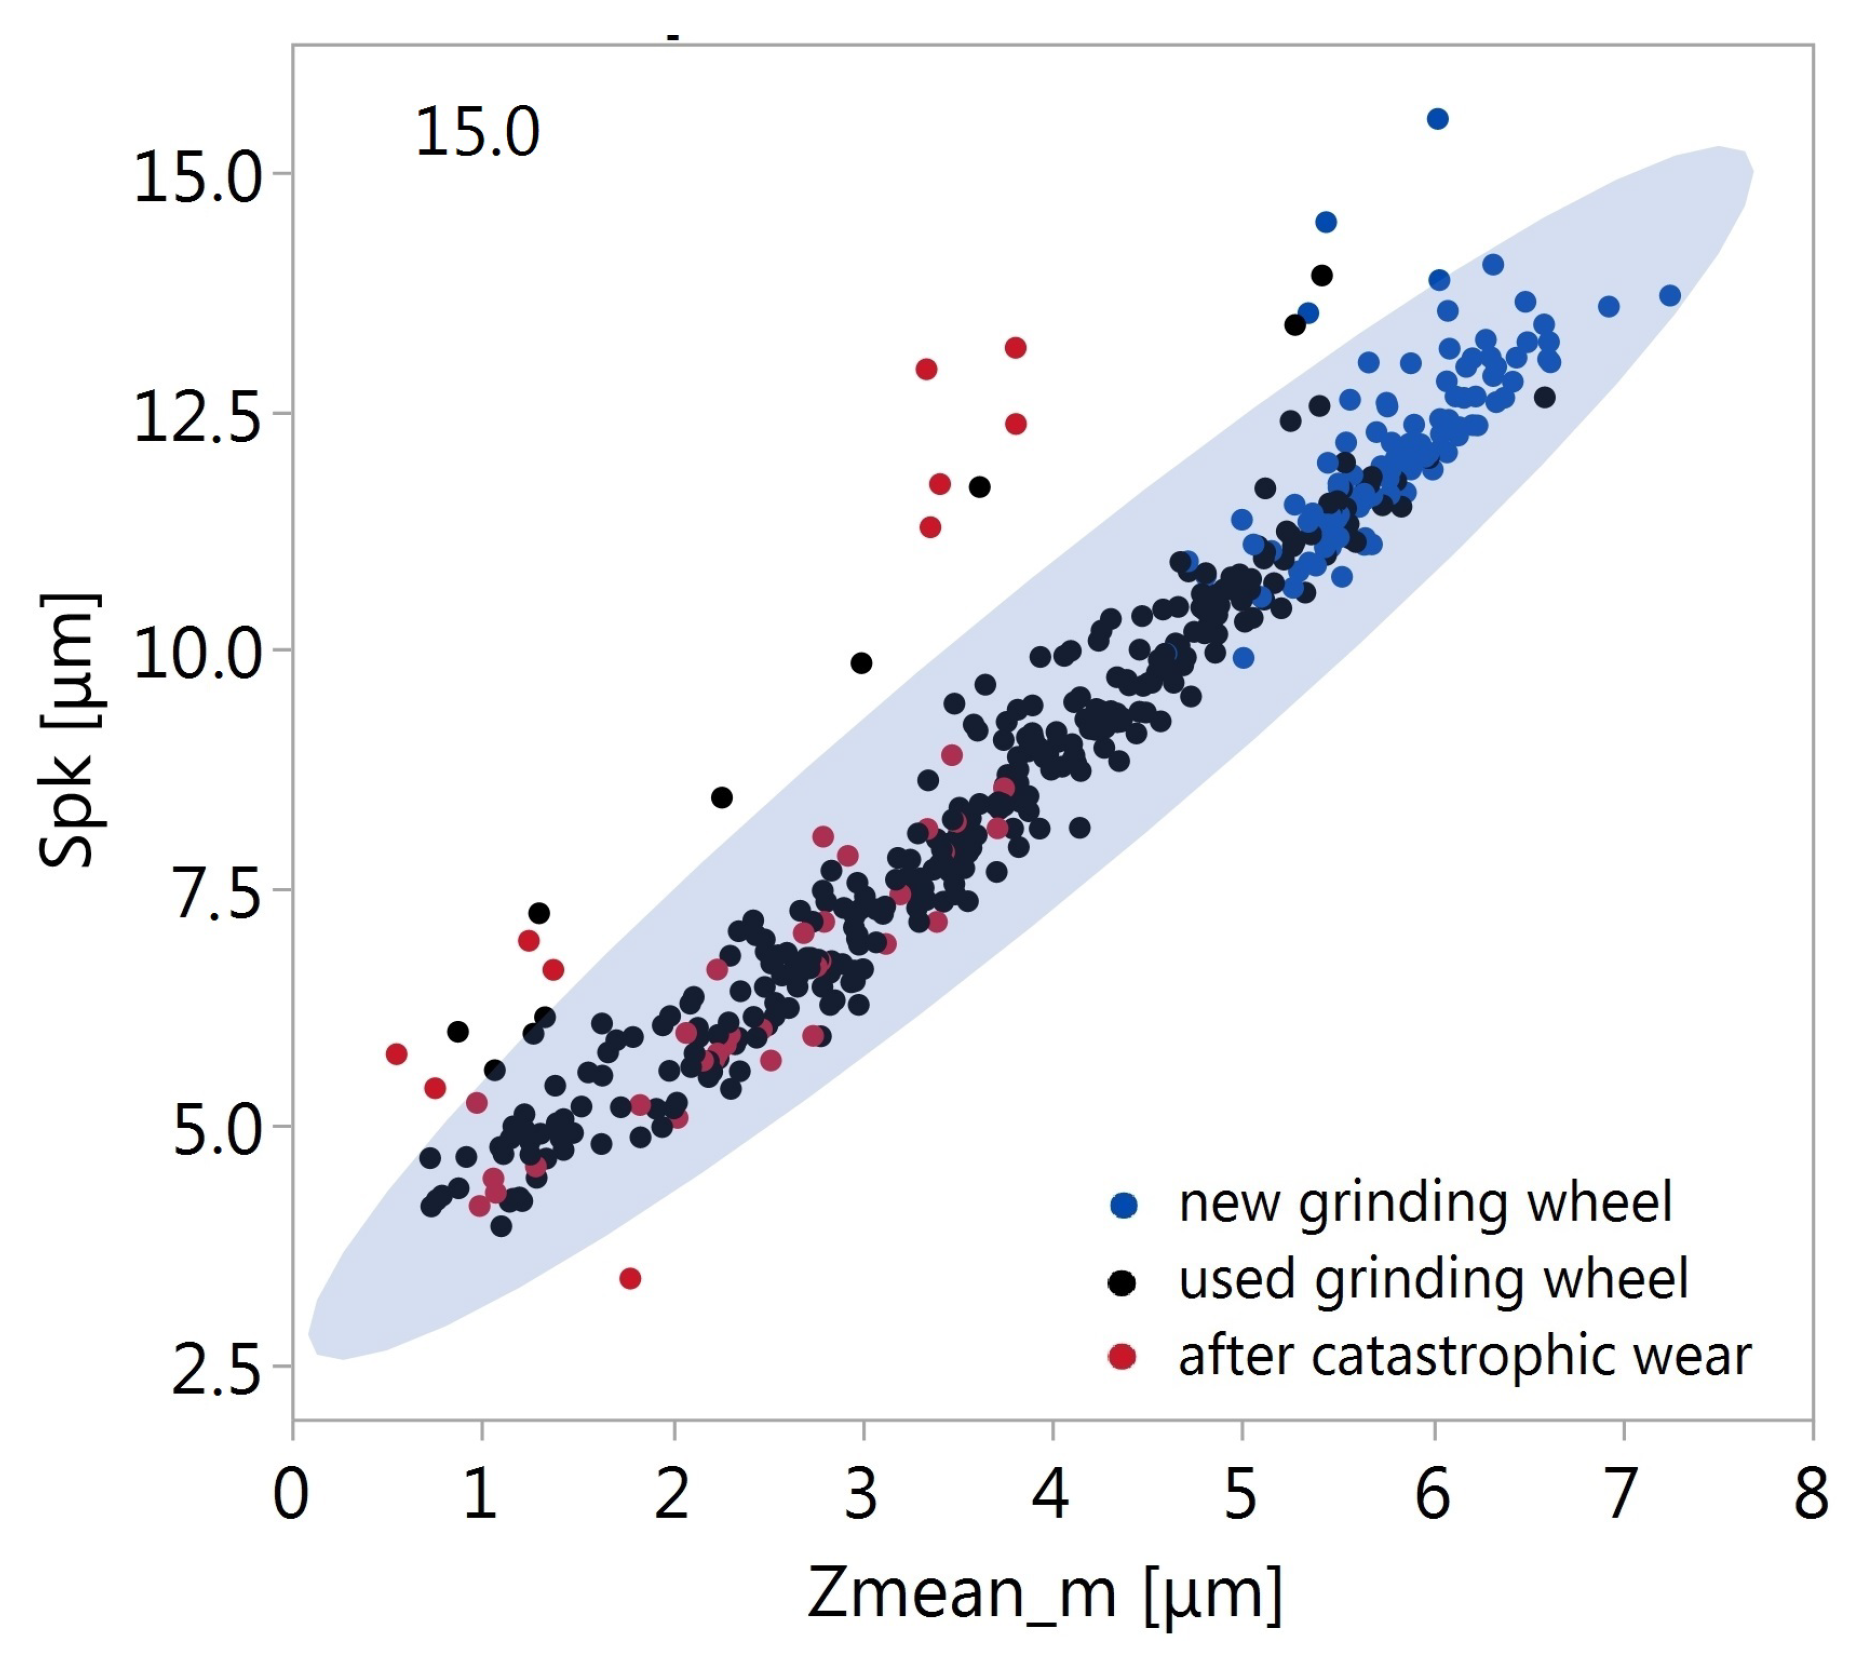
Among the parameters not included via proprietary developed programs, called scripts, which also had small rank values, i.e., less than 18, was Spk–reduced peak height [36]. It represents the height of the protruding peaks above the core surface (Figure 5). It is worth noting that the core material is determined based on the analysis of the bearing area curve—just like the average level of the binder, determined when calculating Zmean_m. Based on the data collected for all grinding wheels, at all the analyzed stages of wear, it was shown that there was a strong positive correlation between the above-mentioned parameters Spk and Zmean_m (Figure 6). The r-Spearman and r-Pearson correlation coefficients were equal to 0.96.
For this reason, in further research it was decided to use both the Zmean_m parameter, which showed the highest sensitivity to wear, and the Spk parameter. The latter parameter has the advantage that it is standardized and determined by commercial programs for the analysis of the geometric structure of the surface. The calculation of this characteristic is therefore easier for most users and may therefore be of more practical importance.
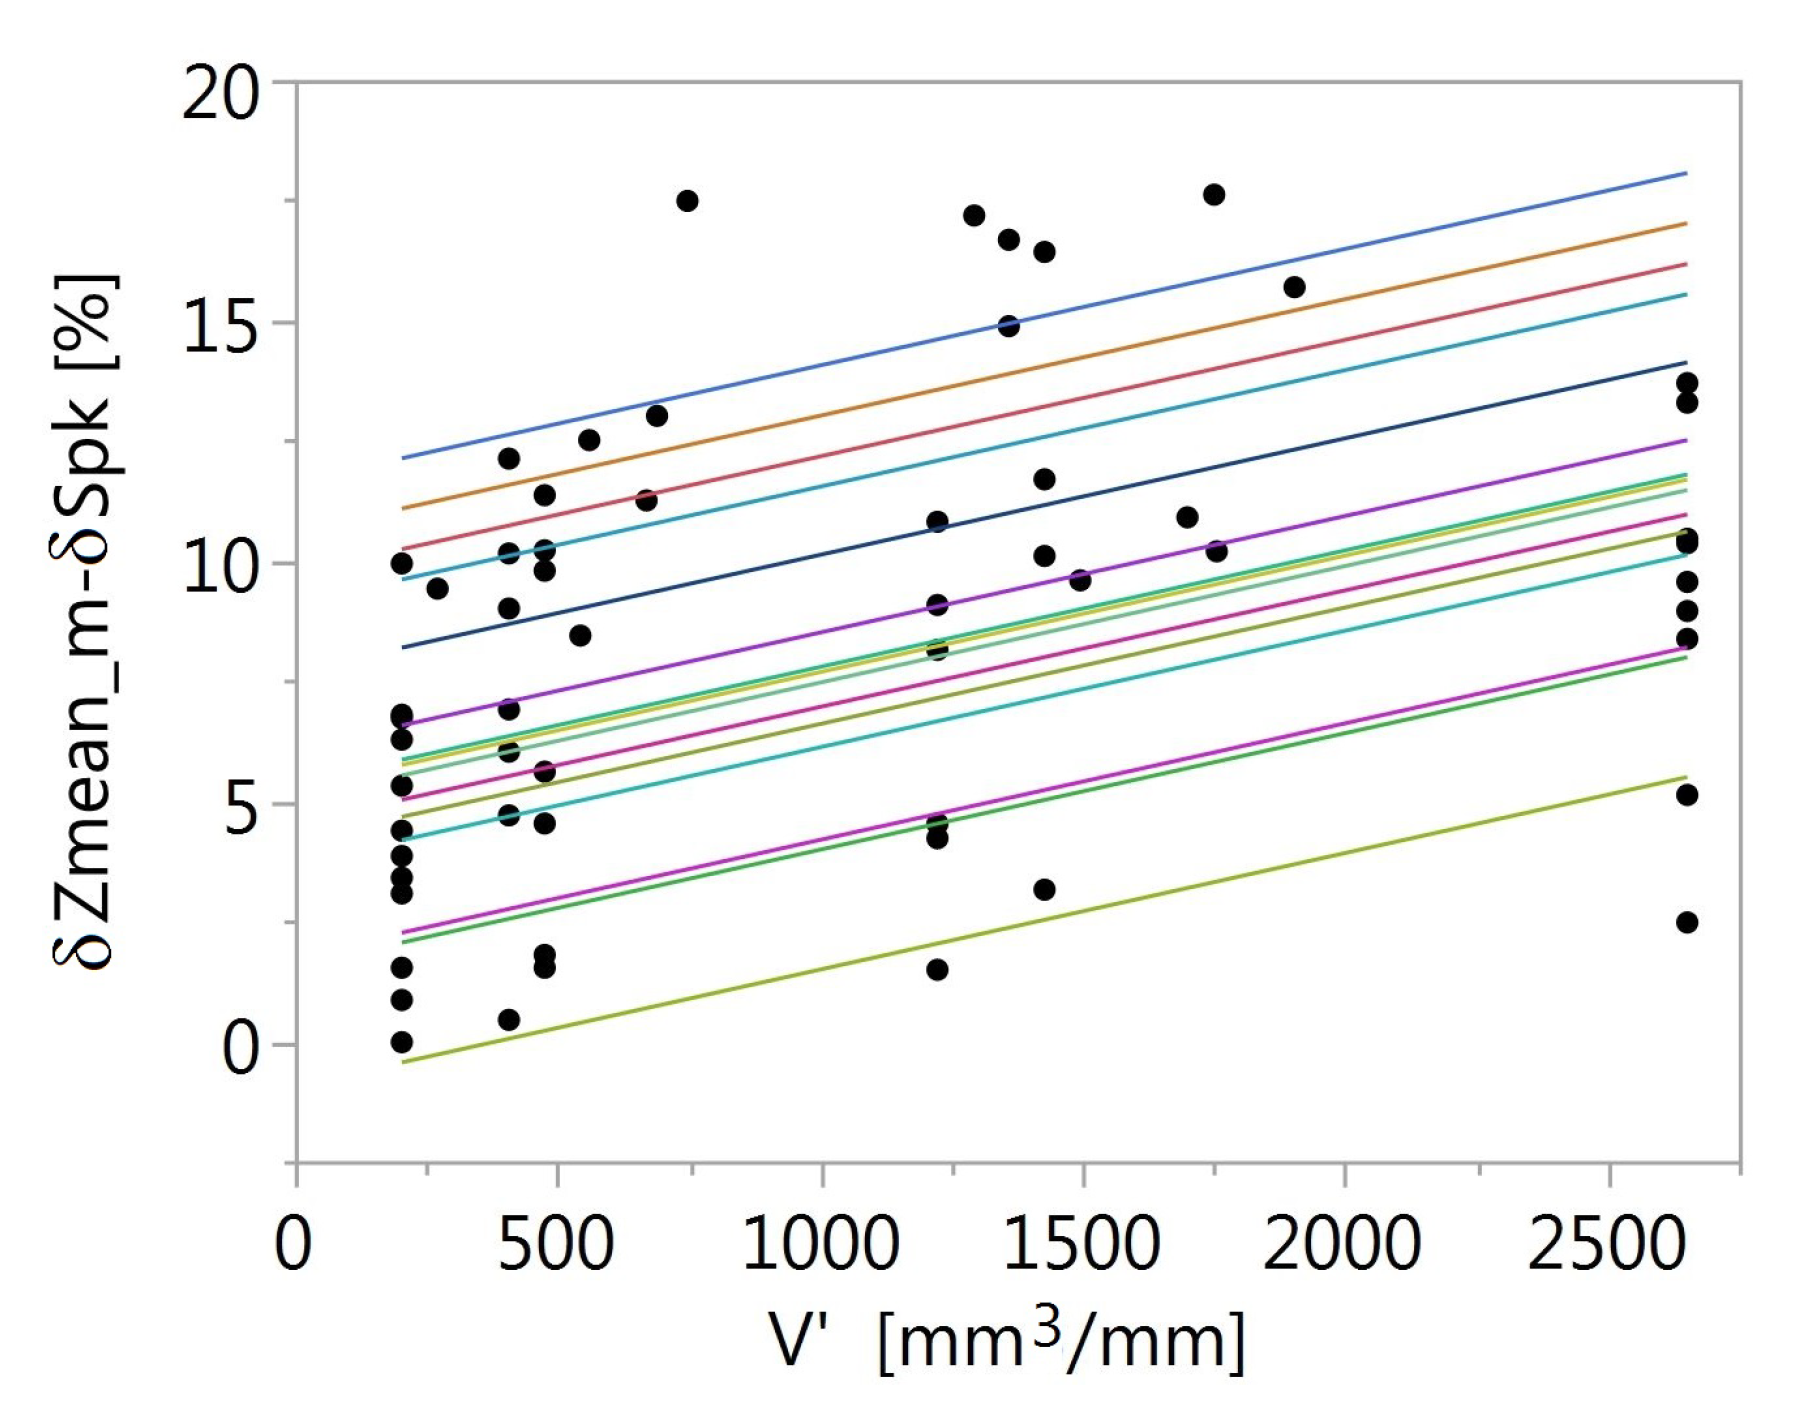
To determine how much more strongly Zmean_m reacts to changes resulting from wheel wear than Spk for each wheel, there were calculated the relative changes δ in the value of the above-mentioned parameters that occurred during the research (Table 4). On average, the relative change in Zmean_m on a given grinding wheel was almost 11 % greater than the change in Spk. This means that compared to the parameter Zmean_m, the Spk parameter was increasingly less sensitive to wear over the grinding-wheel life (Figure 7). This is a very important observation because the intensity of changes in the AS texture is the highest in the initial phase of the grinding-wheel operation [2,20,22,49,50]. In the phase of stable wear, the changes in the AS microgeometry are no longer clear and, as established, the Zmean_m parameter is able to visualize them to a greater extent than Spk parameter.
The results presented in Table 4 do not take into consideration the grinding wheel which became worn out very quickly (item 1. in Table 5). Very large areas of sticking were observed on this grinding wheel, compared to the other wheels. The average share of sticking areas from 6 measurement sites at the end of considered grinding-wheel operation was 5.9 % of the area, and the maximum observed share of sticking areas for one measurement site was 16.7 % . Among the remaining grinding wheels, the highest average percentage of sticking areas was 1.4 % and the maximum for one measurement site was 5.5 % . This contributed to δ Zmean_m = 41.9 % , while δ Spk was only 7.1 % which is less than calculated values of considered parameter for any other grinding wheel . The effect of decreasing the Spk value due to grain chipping and breaking grains from the binder was neutralized, i.e., reduced due to the occurrence of sticking areas on grinding-wheel AS.

3.3. Model Relations Concerning Wear Depending on Adjustable Process Parameters

On the basis of the tests described in Section 3.2, Zmean_m and Spk were selected for the representative characteristics of the grinding-wheel AS reflecting the condition of the grinding wheel and related to its different degree of wear. They were used to build regression models linking a given AS parameter with the adjustable process parameters and the specific material loss. These equations were therefore of the general form:
Z m e a n _ m = f ( v s , v w , a e , V )
and
S p k = f ( v s , v w , a e , V )
Two types of regression equations were determined in the research: second-degree polynomial model (SD) (Equation (6)) and exponential model (EXP) (Equation (7)). Second-degree models are more universal, and they are often used in the analysis of empirical data [51]. They are the simplest polynomial models to reflect the curvature. Much more complex mathematical operations are required to determine exponential models. For this reason, their dissemination in various statistical computing packages was associated with the development of computerization. They are relatively often used in subtractive machining as models linking cutting or grinding parameters with their effects, e.g., forces or temperatures in the process [52,53].
Y = β 0 + β 1 v s + β 11 v s 2 + β 2 a e + β 22 a e 2 + β 3 v w + β 33 v w 2 + β 4 V + β 44 V 2 + + β 12 v s a e + β 13 v s v w + β 14 v s V + β 23 a e v w + β 24 a e V + β 34 v w V
where: Y—dependent variable Zmean_m or Spk, β —coefficients of regression equation.
Y = C 0 · v s β 1 · a e β 2 · v w β 3 · V β 4
where: Y—dependent variable Zmean_m or Spk, C 0 —coefficient of regression equation, β i —exponents in regression equation.
In total, for all grinding wheels, at various stages of wear, the grinding-wheel AS parameters were determined 79 times. Of these, 17 cases related to the condition of the new grinding wheel, i.e., for V = 0 mm 3 / mm . As the new grinding wheel cannot be assigned the values of the set parameters with which the grinding wheel worked, these tests were not taken into account when developing the models. During the development of the models, two more tests were excluded from the analyzes—those related to grinding wheels, which were worn out very quickly. In the case of polynomial surface models, these observations were excluded based on Cook’s distance analysis. The observation was considered influential if Cook’s distance value was greater than D = 0.7 [54,55]. Exponential models were designated in JMP nonlinear platform, which uses iterative computation techniques. In these cases, influential observations were automatically excluded by the software.
The parameters with which the above-mentioned grinding wheels worked are presented in Table 5. For comparison, for the remaining grinding wheels, the smallest specific material loss during the service life was V = 660 mm 3 / mm .
The statistical significance of the determined regression models was checked using the analysis of variance with the significance level α = 0.05 . In the case of polynomial models, backward regression was used, removing statistically insignificant factors from the equation also assuming the significance level α = 0.05 .
In both developed polynomial models in which the dependent variables were the parameters Zmean_m and Spk (Equations (8) and (9)) the same effects turned out to be statistically significant:
  • 4 main linear effects: v s , v w , a e and V ;
  • 3 effects, related to squares of variables: v w · v w , v s · v s and V · V ;
  • 2 interaction effects: v w · v s and v w · a e .
Z m e a n _ m = 2.259 + 0.102 v s + 0.005 ( v s 29.662 ) 2 + 0.039 a e 0.4 v w + 0.043 ( v w 3.76 ) 2 + 5.49 e 4 V + 2.14 e 7 ( V 1031.17 ) 2 + + 0.015 ( v s 29.66 ) ( v w 3 , 76 ) 0.016 ( a e 19.95 ) ( v w 3.76 )
S p k = 6.302 + 0.152 v s + 0.008 ( v s 29.662 ) 2 + 0.06 a e 0.658 v w + 0 , 088 ( v w 3.76 ) 2 + 7.38 e 4 V + 2.78 e 7 ( V 1031.17 ) 2 + + 0.031 ( v s 29.66 ) ( v w 3 , 76 ) 0.027 ( a e 19.95 ) ( v w 3.76 )
The determined exponential models were as follows:
Z m e a n _ m = 1.57 · v s 0.53 · a e 0.05 · v w 0.26 · V 0.1
S p k = 4.86 · v s 0.34 · a e 0.03 · v w 0.18 · V 0.06
The values of the R 2 , i.e., coefficient of determination, for the SD models were 0.95 in the case of the model for Zmean_m (Equation (8)) and 0.94 in the case of the model including Spk (wz. (9)). For the exponential models the coefficient of determination R 2 was 0.74 (Equation (10)) and 0.7 (Equation (11)), respectively.
In the case of exponential models it is possible to determine directly in the equations what are the dominant trends determining the influence of the dependent variables on Zmean_m and Spk. The form of exponential models is much more complicated than polynomial ones, which makes their direct interpretation much more difficult. For example, v w appears 4 times in the equation: in a linear part, in a quadratic part, and in two interactions. When analyzing the influence of v w on the dependent variable, one should therefore take into account 4 coefficients and their sign depending on the value of v w itself, as well as the values of the factors with which it interacts. When interpreting a complex polynomial regression equation, it is easier to use a graphical representation of the derived equations (Figure 8). The models for Zmean_m and Spk are similar in the above-mentioned graphs, which results from a strong positive correlation between these parameters.
On the basis of the developed models, in the studied state space, it was recognized that the mean value of the mean grain heights and the reduced height of the peaks decreased when:
  • grinding speed v s decreased,
  • grinding depth a e increased,
  • feed v w increased,
  • specific material loss V increased.
The dominant direction of the predictors’ influence on the observed variable is the increase in the average wear rate along with the increase in the feed and depth of grinding and with the reduction of the grinding speed. A small v w value and a large v s value cause that the maximum chip thickness of h max is small. If the grinding depth is also small, it may turn out that the abrasive grains only slightly penetrate the workpiece material. This leads to greater participation of the plastic deformation of the workpiece and a reduction of the cutting process. This, in turn, adversely affects the grinding force and grinding-wheel life. At low feed and high grinding speeds, an increase in the grinding depth can therefore improve the grinding conditions by increasing the maximum chip thickness. A similar characteristic of the dependencies of the studied variables is also described in [56].
As predicted, the impact of the specific material loss V on the parameters Zmean_sr and Spk is greater for its small values. This relation results from bigger wear intensity in the initial phase of the grinding wheel (Figure 8).

4. Conclusions

Based on the research, the following conclusions and observations can be drawn:
  • In the conducted tests, the highest sensitivity to changes in grinding-wheel AS caused by wear was shown by the average value of the mean island heights Zmean_m (Table 3).
  • This decrease in Zmean_m and Spk was related to the loss of abrasive resulting from various types of wear processes. In the presented studies, the above-mentioned parameters changed mainly due to grain breaking and, to a lesser extent, due to tearing them out of the binder (Section 3.1).
  • As wheel wear increased, the Spk parameter, compared to Zmean_m, became less susceptible to grinding-wheel AS changes (Figure 7). The analysis of grinding-wheel AS state based on Spk with high wear is therefore more error-prone than would be the case with the value of the parameter Zmean_m.
  • The Zmean_m parameter turned out to be a better measure of wear than Spk (Table 4), especially in the case of large sticking areas (Section 3.2, p. 11).
  • Without taking into account the grinding wheel on which very large areas of sticking were observed, the average relative change Zmean_m on a given grinding wheel was almost 11% greater than the change in parameter Spk (Section 3.2, p. 11).
  • The developed polynomial models of the response surface linking Zmean_m and Spk with the process parameters and the specific material loss were very well suited to the empirical data ( R 2 = 0.95 and 0.94).
  • The developed polynomial models linking textitZmean_m and Spk with the process parameters and the specific material loss were well suited to the empirical data ( R 2 = 0.74 and 0.70).
  • The tendencies of the influence of the adjustable process parameters on the grinding-wheel wear predicted by the models can be explained in the context of physics of the grinding process. They are consistent with the general grinding theory. Reducing v s and increasing v w and a e lead to a greater load operating on the wheel. In turn, the bigger forces acting on the abrasive grains contribute to their faster wear (Section 3.3).
  • The effect of the specific material loss V on the parameters Zmean_sr and Spk is greater for its small values. This effect results from the greater wear intensity in the initial phase of the grinding wheel’s work (Figure 8).
It should be kept in mind that the developed models linking the grinding-wheel AS state represented by selected parameters of its texture and process parameters as well as the specific material loss do not take into account all factors. In detail, they will change for different conditions of the experiment, e.g., for a different machine, holder, or grinding-wheel manufacturer. The general trends revealed by the model, the preferred form of the model, and the advantages of the parameter Zmean_sr over Spk bring, on the one hand, new information about the grinding processes and wear of the grinding wheel, and on the other, are more utilitarian.
The proposed methodology for testing the active surface of a grinding wheel at various stages of wear can also be useful for testing other single-layer wheels, i.e., brazed wheels. For each type of wheel, it is worthwhile to consider analyzing the parameters determined for the entire measurement area, but maybe even more, also those related to its selected elements such as abrasive grains, pores and embedding areas. The presented methodology of conducting statistical analyses, aimed at determining parameters sensitive to AS wear, is also universal and does not depend on the type of tool being tested. It can be assumed that the indicated parameters most sensitive to wear will also manifest this property in the case of other grinding processes, where wear is related to the loss of abrasive on a single layer, e.g., with diamond brazed grinding wheel worn by attrition.

Author Contributions

Conceptualization, A.K., A.B., T.R. and P.K.; methodology, A.K. and A.B.; software, A.B. and P.K.; validation, A.B. and A.K.; investigation, A.K. and A.B.; writing—original draft preparation, A.B.; writing—review and editing, A.K.; visualization, A.B. and T.R.; supervision, A.K. All authors have read and agreed to the published version of the manuscript.

Funding

This research received no external funding.

Conflicts of Interest

The authors declare no conflict of interest.

Abbreviations

The following abbreviations are used in this manuscript:
ASActive surface
EXPExponential
SDSecond-degree
SLGWSingle-layer grinding wheel

References

  1. Bhaduri, D.; Chattopadhyay, A. Study on the role of PVD TiN coating in improving the performance of electroplated monolayer superabrasive wheel. Surf. Coat. Technol. 2010, 205, 658–667. [Google Scholar] [CrossRef]
  2. Upadhyaya, R.; Fiecoat, J. Factors Affecting Grinding Performance with Electroplated CBN Wheels. CIRP Ann. Manuf. Technol. 2007, 56, 339–342. [Google Scholar] [CrossRef]
  3. You, H.Y.; Ye, P.Q.; Song, W.J.; Deng, X.Y. Design and application of CBN shape grinding wheel for gears. Int. J. Mach. Tools Manuf. 2003, 43, 1269–1277. [Google Scholar] [CrossRef]
  4. Jackson, M.J. A review of the design of grinding wheels operating at excessive speeds. Int. J. Adv. Manuf. Technol. 2018, 94, 3979–4010. [Google Scholar] [CrossRef]
  5. Tawakoli, T.; Rabiey, M.; Wegener, K. The Effect of Special Structured Electroplated CBN Wheel in Dry Grinding of 100Cr6. Adv. Mater. Res. 2009, 76, 119–124. [Google Scholar] [CrossRef]
  6. Choudhary, A.; Naskar, A.; Paul, S. Effect of minimum quantity lubrication on surface integrity in high-speed grinding of sintered alumina using single layer diamond grinding wheel. Ceram. Int. 2018, 44, 17013–17021. [Google Scholar] [CrossRef]
  7. Lv, M.; Zhang, M.D.; Zhao, H. The Deformation Analysis on Tooth Profiles with Electroplated CBN Hard Gear-Honing-Tools. Adv. Mater. Res. 2012, 426, 159–162. [Google Scholar] [CrossRef]
  8. Kohler, J.; Schindler, A.; Woiwode, S. Continuous generating grinding. Tooth root machining and use of CBN-tools. CIRP Ann. Manuf. Technol. 2012, 61, 291–294. [Google Scholar] [CrossRef]
  9. Guo, C.; Ranganath, S.; McIntosh, D.; Elfizy, A. Virtual high performance grinding with CBN wheels. CIRP Ann. Manuf. Technol. 2008, 57, 325–328. [Google Scholar] [CrossRef]
  10. Xun, L.; Fanjun, M.; Wei, C.; Shuang, M. The CNC grinding of integrated impeller with electroplated CBN wheel. Int. J. Adv. Manuf. Technol. 2015, 79, 1353–1361. [Google Scholar] [CrossRef]
  11. Zhao, Z.; Qian, N.; Ding, W.; Wang, Y.; Fu, Y. Profile grinding of DZ125 nickel-based superalloy: Grinding heat, temperature field, and surface quality. J. Manuf. Process. 2020, 57, 10–22. [Google Scholar] [CrossRef]
  12. Xun, L.; Fanjun, M.; Shuang, M. Surface integrity of {GH4169} affected by cantilever finish grinding and the application in aero-engine blades. Chin. J. Aeronaut. 2015, 28, 1539–1545. [Google Scholar] [CrossRef] [Green Version]
  13. Guo, C.; Shi, Z.; Attia, H.; McIntosh, D. Power and Wheel Wear for Grinding Nickel Alloy with Plated CBN Wheels. CIRP Ann. Manuf. Technol. 2007, 56, 343–346. [Google Scholar] [CrossRef]
  14. Aspinwall, D.; Soo, S.; Curtis, D.; Mantle, A. Profiled Superabrasive Grinding Wheels for the Machining of a Nickel Based Superalloy. CIRP Ann. Manuf. Technol. 2007, 56, 335–338. [Google Scholar] [CrossRef]
  15. Caggiano, A.; Teti, R. CBN Grinding Performance Improvement in Aircraft Engine Components Manufacture. Procedia CIRP 2013, 9, 109–114. [Google Scholar] [CrossRef]
  16. Gift, F.; Misiolek, W. Fluid Performance Study for Groove Grinding a Nickel-Based Superalloy Using Electroplated Cubic Boron Nitride (CBN) Grinding Wheels. J. Manuf. Sci. Eng. 2004, 126, 451–458. [Google Scholar] [CrossRef]
  17. Zhao, Z.; Fu, Y.; Xu, J.; Zhang, Z.; Liu, Z.; He, J. An investigation on high-efficiency profile grinding of directional solidified nickel-based superalloys DZ125 with electroplated CBN wheel. Int. J. Adv. Manuf. Technol. 2016, 83, 1–11. [Google Scholar] [CrossRef]
  18. Tian, Y.B.; Zhong, Z.W.; Rawat, R. Comparative study on grinding of thin-walled and honeycomb-structured components with two CBN wheels. Int. J. Adv. Manuf. Technol. 2015, 81, 1097–1108. [Google Scholar] [CrossRef]
  19. Ding, W.; Xu, J.; Chen, Z.; Su, H.; Fu, Y. Grain wear of brazed polycrystalline CBN abrasive tools during constant-force grinding Ti–6Al–4V alloy. Int. J. Adv. Manuf. Technol. 2011, 52, 969–976. [Google Scholar] [CrossRef]
  20. Zhang, F.L.; Zhou, Y.M.; Guo, C.W.; Mao, J.B.; Huang, H.P. Performance of Brazed Diamond Tool for Machining Dental Ceramic. Adv. Mater. Res. 2014, 1027, 84–87. [Google Scholar] [CrossRef]
  21. Upadhyaya, R.P.; Malkin, S. Thermal Aspects of Grinding With Electroplated CBN Wheels. J. Manuf. Sci. Eng. 2004, 126, 107–114. [Google Scholar] [CrossRef]
  22. Shi, Z.; Malkin, S. Wear of Electroplated CBN Grinding Wheels. J. Manuf. Sci. Eng. 2005, 128, 110–118. [Google Scholar] [CrossRef]
  23. Shi, Z.; Malkin, S. An Investigation of Grinding with Electroplated CBN Wheels. CIRP Ann. Manuf. Technol. 2003, 52, 267–270. [Google Scholar] [CrossRef]
  24. Ghosh, A.; Chattopadhyay, A. Performance enhancement of single-layer miniature cBN wheels using CFUBMS-deposited TiN coating. Int. J. Mach. Tools Manuf. 2007, 47, 1799–1806. [Google Scholar] [CrossRef]
  25. Bhaduri, D.; Chattopadhyay, A. Effect of Pulsed DC CFUBM Sputtered TiN Coating on Performance of Nickel Electroplated Monolayer cBN Wheel in Grinding Steel. Surf. Coatings Technol. 2010, 204, 3818–3832. [Google Scholar] [CrossRef]
  26. Nguyen, A.T.; Butler, D.L. Correlation of grinding wheel topography and grinding performance: A study from a viewpoint of three-dimensional surface characterisation. J. Mater. Process. Technol. 2008, 208, 14–23. [Google Scholar] [CrossRef]
  27. Blunt, L.; Ebdon, S. The application of three-dimensional surface measurement techniques to characterizing grinding wheel topography. Int. J. Mach. Tools Manuf. 1996, 36, 1207–1226. [Google Scholar] [CrossRef]
  28. Butler, D.; Blunt, L.; See, B.; Webster, J.; Stout, K. The characterisation of grinding wheels using 3D surface measurement techniques. J. Mater. Process. Technol. 2002, 127, 234–237. [Google Scholar] [CrossRef]
  29. Kapłonek, W.; Nadolny, K. Skaterometryczna ocena ściernic po procesie szlifowania walcowych powierzchni wewnętrznych materiałów trudnoobrabialnych. In XXXIV Naukowa Szkoła Obróbki Ściernej; Pismo PG: Gdansk, Poland, 2011; pp. 39–52. [Google Scholar]
  30. Jamshidi, H.; Gurtan, M.; Budak, E. Identification of active number of grits and its effects on mechanics and dynamics of abrasive processes. J. Mater. Process. Technol. 2019, 273, 116239. [Google Scholar] [CrossRef]
  31. Kang, M.; Zhang, L.; Tang, W. Study on three-dimensional topography modeling of the grinding wheel with image processing techniques. Int. J. Mech. Sci. 2020, 167, 105241. [Google Scholar] [CrossRef]
  32. Li, P.; Jin, T.; Xiao, H.; Chen, Z.; Qu, M.; Dai, H.; Chen, S. Topographical characterization and wear behavior of diamond wheel at different processing stages in grinding of N-BK7 optical glass. Tribol. Int. 2020, 151, 106453. [Google Scholar] [CrossRef]
  33. Setti, D.; Kirsch, B.; Aurich, J.C. Characterization of micro grinding tools using optical profilometry. Opt. Lasers Eng. 2019, 121, 150–155. [Google Scholar] [CrossRef]
  34. Kacalak, W.; Tandecka, K. A method and new parameters for assessing the active surface topography of diamond abrasive films. J. Mach. Eng. 2016, 16, 95–108. [Google Scholar]
  35. Zhao, Q.; Guo, B. Ultra-precision grinding of optical glasses using mono-layer nickel electroplated coarse-grained diamond wheels. Part 1: {ELID} assisted precision conditioning of grinding wheels. Precis. Eng. 2015, 39, 56–66. [Google Scholar] [CrossRef]
  36. ISO 25178-2:2012 Geometrical Product Specifications (GPS). Surface Texture: Areal–Part 2: Terms, Definitions and Surface Texture Parameters; International Organization for Standardization: Geneva, Switzerland, 2012. [Google Scholar]
  37. ASME B46:1 Surface Texture. Surface Roughness, Waviness, and Lay; The American Society of Mechanical Engineers: New York City, NY, USA, 2019. [Google Scholar]
  38. Velazquez-Hernandez, R.; Melnikov, A.; Mandelis, A.; Sivagurunathan, K.; Rodriguez-Garcia, M.E.; Garcia, J. Non-destructive measurements of large case depths in hardened steels using the thermal-wave radar. NDT E Int. 2012, 45, 16–21. [Google Scholar] [CrossRef]
  39. Dychton, K.; Kocurek, P.; Rokicki, P.; Wierzba, B.; Drajewicz, M.; Sieniawski, J. Microstructure and Residual Stress in AMS 6308 Steel after Vacuum Carburizing and Gas Quenching. Acta Phys. Pol. A 2016, 130, 953–955. [Google Scholar] [CrossRef]
  40. Rokicki, P.; Dychton, K.; Nownotnik, A.; Goral, M.; Drajewicz, M.; Sieniawski, J.; Zagula-Yavorska, M. Heat treatment process effect on carburized layer of aircraft engine heavily-loaded steel components. Sustain. Ind. Process. Summit SIPS Compos. Ceram.-Quasi-Crystals, Nanomater. Coatings 2014, 5, 543–550. [Google Scholar]
  41. JMP 12 Design of Experiments Guide; SAS Institute: Cary, NC, USA, 2015.
  42. Helmli, F. Focus Variation Instruments. In Optical Measurement of Surface Topography; Leach, R., Ed.; Springer: Berlin/Heidelberg, Germany, 2011; pp. 131–166. [Google Scholar] [CrossRef]
  43. Stout, K.J.; Sullivan, P.J.; Dong, W.P.; Mainsah, E.; Luo, N.; Mathia, T.; Zahouani, H. The Development of Methods for the Characterization of Roughness in Three Dimensions; Butterworth-Heinemann: Oxford, UK, 1994. [Google Scholar]
  44. Bazan, A.; Kawalec, A. Methods of grain separation from single-layer grinding wheel topography. Mechanik 2018, 91, 926–928. [Google Scholar] [CrossRef]
  45. Jorgensen, J. Scanning Probe Image Processor SPIP Version 6. User’s and Reference Guide; CreateSpace Independent Publishing Platform: Scotts Valley, CA, USA, 2012. [Google Scholar]
  46. Francuz, P.; Mackiewicz, R. Liczby Nie Wiedzą, Skąd Pochodzą. Przewodnik Po Metodologii i Statystyce Nie Tylko Dla Psychologów; Wydawnictwo KUL: Lublin, Poland, 2007. [Google Scholar]
  47. Kot, S.M.; Jakubowski, J.; Sokołowski, A. Statystyka; Difin: Warsaw, Poland, 2011. [Google Scholar]
  48. Sobczyk, M. Statytstyka; Wydawnictwo Naukowe PWN: Warsaw, Poland, 2016. [Google Scholar]
  49. Nithin, M.T.; Dhanavathu, N.N.; Vijayaraghavan, L. Wear of Electroplated Super Abrasive CBN Wheel during Grinding of Inconel 718 Super Alloy. J. Manuf. Process. 2019, 43, 1–8. [Google Scholar]
  50. Hood, R.; Medina Aguirre, F.; Soriano Gonzalez, L.; Novovic, D.; Soo, S.L. Evaluation of superabrasive grinding points for the machining of hardened steel. CIRP Ann. 2019, 68, 329–332. [Google Scholar] [CrossRef]
  51. Myers, R. Response Surface Methodology: Process and Product Optimization Using Designed Experiments; Wiley: Hoboken, NJ, USA, 2009. [Google Scholar]
  52. Liu, Q.; Chen, X.; Wang, Y.; Gindy, N. Empirical modelling of grinding force based on multivariate analysis. J. Mater. Process. Technol. 2008, 203, 420–430. [Google Scholar] [CrossRef]
  53. Brinksmeier, E.; Tönshoff, H.K.; Czenkusch, C.; Heinzel, C. Modelling and optimization of grindingprocesses. J. Intell. Manuf. 1998, 9, 303–314. [Google Scholar] [CrossRef]
  54. Chatterjee, A.H.; Price, B. Regression Analysis by Example, 3rd ed.; Wiley: Hoboken, NJ, USA, 2000. [Google Scholar]
  55. McDonald, B. A Teaching Note on Cook’s Distance—A Guideline. Res. Lett. Inf. Math. Sci. 2002, 3, 122–128. [Google Scholar]
  56. Malkin, S.; Guo, C. Grinding Technology: Theory and Application of Machining with Abrasives; Industrial Press: New York, NY, USA, 2008. [Google Scholar]
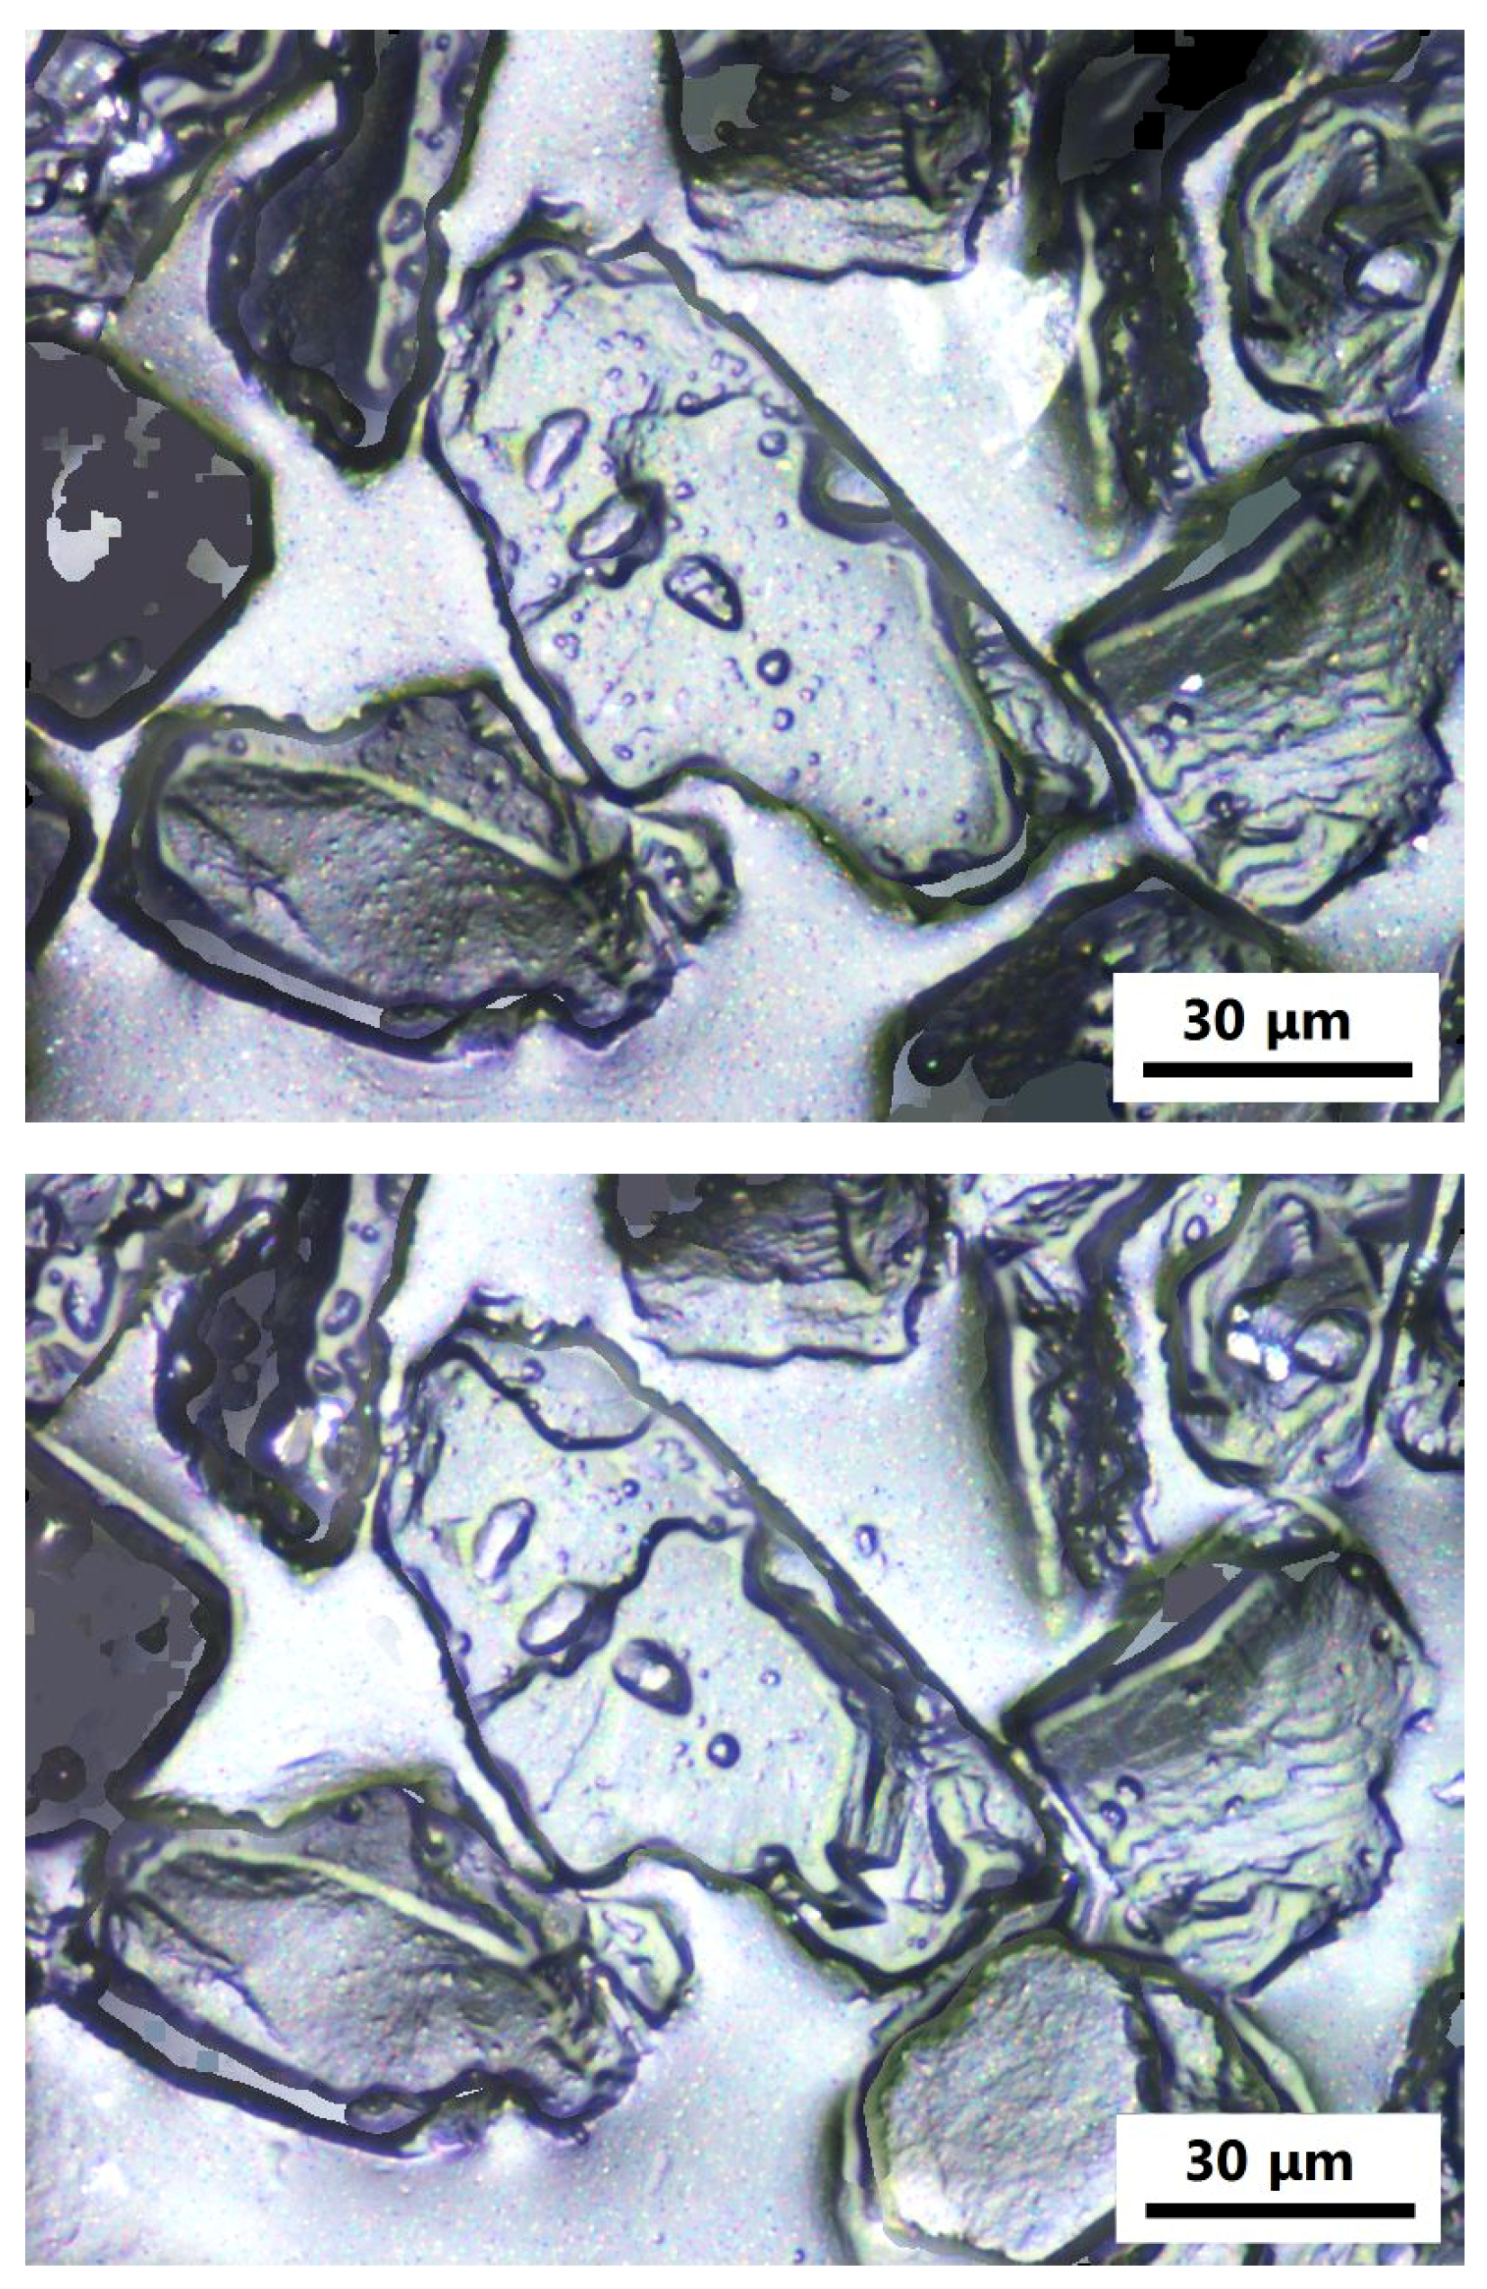
Figure 1. Grains on a new grinding wheel (top) and after grinding using that wheel (bottom): visible wear due to breaking grains from the binder (views of 3D texture maps).
Metals 10 01479 g001
Figure 2. Abrasive grain on the grinding-wheel AS before grinding (top) and after grinding using that wheel (bottom): visible wear due to grain crushing (views obtained from replicas).
Metals 10 01479 g002
Figure 3. Sticking area on grinding-wheel AS visible on its replica.
Metals 10 01479 g003
Figure 4. Abrasive grain before grinding (top) and after grinding (bottom): visible wear due to grain grinding and grain crushing (view obtained from replica).
Metals 10 01479 g004
Figure 5. Graphical interpretation of the parameter Spk [36].
Metals 10 01479 g005
Figure 6. Relationship between parameters Spk and Zmean_m (ellipse— 95 % coverage).
Metals 10 01479 g006
Figure 7. Graphical representation of a linear regression equation for individual grinding wheels ( R 2 = 0.79 ) showing the change in δ Zmean_m δ Spk depending on the specific material loss V .
Metals 10 01479 g007
Figure 8. Dependence of Zmean_m and Spk on grinding speed v s as well as specific material loss V with a e = 18 μ m and v w = 3 m / min .
Metals 10 01479 g008
Table 1. The most important investigated parameters.
Grinding conditions
GrinderFortis firmy Michael Deckel
Type of processplane grinding
Processing liquidgrinding oil
Grinding speed ( d = 100 mm ) v s = 20 40 m / s
Feed speed v w = 1 7.5 m / min
Grinding depth a e = 7 30 μ m
Grinding wheel
Shapeconical
Cone angle 140
Max. diameter d100 mm
Binderelectroplated (Ni)
AbrasivecBN
Grain numberB35
Workpiece
MaterialPyrowear 53
Treatmentthermo-chemical treatment
Hardness81 HRA
Table 2. Measurement parameters of grinding-wheel AS texture.
Material of replicasRepliSet-F5 by Struers
Resolution of replicas 0.1 μ m
Measurement microscopeInfiniteFocus G4 by Alicona
Lens × 20
Measurement area2.35 mm × 2.59 mm
Vertical resolution5 μ m
Horizontal resolution3.91 μ m
Pixel size0.44 μ m  × 0.44 μ m
Table 3. Mean values of ranks assigned to surface texture parameters, islands and pores for which the null hypothesis H 0 was rejected. The sign (−) next to the parameter name means that its value decreased with the wear of the grinding wheel. The sign (+) indicates the opposite relationship.
Parameter
AS
Mean
of Ranks
Parameter
AS
Mean
of Ranks
Parameter
AS
Mean
of Ranks
Zmean_m(−)1.5Sa(−)36.5 dDsd ( p ) (−)62
Zmean _ sd (−)1.5Zmean_sd(p)(+)37 Lsr ( p ) (−)62.5
Zmax _ m (−)3Svi(+)37.5 dFsr ( p ) (−)63
Vsr(−)4Sq(−)38Ssc(−)65
dSmc(0_30)(−)7.5Smc(_40)(+)39Sfd(−)67.5
Smc(0_5)(−)7.5Smr1(−)40Bsr(−)68.5
Smc(_60)(+)8.5Sk(−)40.5Vsr(p)(+)69
dSmc(0_20)(−)9Vsum(−)41Asr(p)(−)69
dSmc(0_15)(−)10Smc(_15)(−)41.5Smc(_25)(−)72
Smc(_65)(+)10Zmax_sd(−)43.5NDsr(+)73
Smc(_55)(+)10.5Sdc5_10(−)44Bsr(p)(−)73
dSmc(0_40)(−)11.5Smc(_85)(+)44.5Asd(p)(−)74
Smc(0_10)(−)13Zmax_sd(p)(+)45dDsr(p)(−)74.5
Smc(_70)(+)15.5Zmean_m(p)(+)45S10z(−)75
Vsd(−)15.5Zmax_m(p)(+)46Str37(−)75.5
Smc(_50)(+)16.5Sp(−)46.5Sz_tph(−)76
Spk(−)16.5Vmc(−)47.5St(−)77
Smc(0_15)(−)17Sdq6(−)48Vvv(+)77
dSmc(0_10)(−)20Sdq(−)49.5Zmean_m(s)(−)78
Smc(0_20)(−)20.5S3A(−)50.5dDsr(−)79
Vmp(−)21Sdr(−)51.5Vsum(p)(+)81
Smc(_75)(+)22.5Smc(_20)(−)52.5A%(p)(−)81.5
dSmc(0_5)(−)23Sci(−)54NDsd(+)82
Sdc10_50(−)25Smr2(−)54Sds(−)84.5
Smc(0_30)(−)25.5Sdc0_5(−)56Str20(−)85
Smc(_45)(+)26.5Smc(_90)(+)57dFsr(−)87
Vvc(−)27Sbi(+)57Asr(−)88
Smc(_5)(−)28.5Zmax_(s)(−)58Lsr(−)88.5
Smc(0_40)(−)29.5Svk(+)58.5Sv(+)90.5
Ssk(−)31.5Psd(p)(−)59Smc(_95)(+)92
A%(−)31.5Psr(p)(−)59Zmax_sd(s)(−)93
Smc(_80)(+)32.5dFsd(p)(−)60Psr(−)94
Lw(−)32.5Lsd(p)(−)60.5Shw(+)94.5
Smc(_10)(−)34.5Smc(_35)(+)61Scl37(+)96
Table 4. Selected statistical characteristics of the relative change of parameters Zmean_m and Spk as well as differences between them.
Relative ChangeMeanMinMax
δ Zmean_m [%]50.622.373.5
δ Spk [%]39.719.856.4
δ Zmean_m δ Spk [%]12.42.534.7
Table 5. The adjustable process parameters with which the grinding wheels worked, excluded from the regression analysis, and the specific volume of the material they ground.
Lp. v s
[m/s]
v w
[m/min]
a e
[ μ m]
V
[mm 3 /mm]
1207.50205
2204.252058
Publisher’s Note: MDPI stays neutral with regard to jurisdictional claims in published maps and institutional affiliations.