Article

The Influence of Aluminum Content on Oxidation Resistance of New-Generation ODS Alloy at 1200 °C

Institute of Physics of Materials, The Czech Academy of Sciences, Zizkova 22, 616 62 Brno, Czech Republic
*
Author to whom correspondence should be addressed.
Metals 2020, 10(11), 1478; https://doi.org/10.3390/met10111478
Submission received: 17 June 2020 / Revised: 31 October 2020 / Accepted: 3 November 2020 / Published: 6 November 2020

Abstract

:
The aim of the paper is to evaluate the effect of aluminum content on the oxidation resistance of new-generation of oxide dispersion strengthened (ODS) alloy at 1200 °C. Three grades of the alloy of chemical composition Fe-15Cr-xAl-4Y2O3 with different Al contents x = 0.3 wt.%, 2.0 wt.% and 5.5 wt.% are prepared by mechanical alloying. The alloys are consolidated by high temperature rolling followed by heat treatment. To study the oxidation resistance the samples are isothermally aged in the air for 1 h, 4 h, 16 h and 64 h at 1200 °C. The oxidation kinetics, composition and formation mechanism of the oxide layers are analyzed. The weight gain of prepared steels is estimated. The kinetics of oxidation is studied on metallographic cross-sections of the exposed samples by scanning electron microscopy (SEM) and energy dispersive spectrometer (EDS) analysis. The oxides on the surfaces are identified by X‑ray diffraction (XRD) analysis. The Al content significantly enhances the oxidation resistance of the alloy. For a sufficiently high Al content in the alloy a compact oxide layer of α‑Al2O3 on the surface is formed, which significantly suppresses further oxidation process.

1. Introduction

The current top creep and oxidation resistant alloys are represented by Ni-based superalloys for temperatures up to 1100 °C [1,2,3] and by ferritic oxide dispersion strengthened (ODS) steels for temperatures up to 1300 °C [4,5,6,7]. The Ni-based superalloys are strengthened by coherent ordered γ′-precipitates, the mechanisms of creep in single crystals are summarized in the overview paper [8] and addressed by micromechanical unit cell models [9,10]. However, the γ′-phase cutting by dislocations and the instability of the γ′-precipitates due to their coarsening or rafting above 900 °C limit the applicability of the Ni-based superalloys in the range of temperatures 900–1100 °C. Compared to Ni-based superalloys, current ODS ferritic steels (alloys) exhibit significant microstructural stability also in the temperature regime 1100–1300 °C [11,12,13]. The microstructure of the ODS alloys consists of an alloy matrix strengthened by the dispersion of stable nano‑oxides, usually Y-based, typically of a size between 5–30 nm and of volume fraction of about 0.5%. The processing route of the ODS alloys involves two steps: (1) the nanocomposite powder consisting of the matrix and Y-nano‑oxides is produced by mechanical alloying (MA) and (2) the powder is then hot consolidated. There is a variety of commercially produced ferritic ODS alloys like MA 956 or MA 957 [5,11], PM 2000 or PM 2010 [14], ODM alloys [15] as well as research variants like 14YWT [11], 12YWT [11], 9YWT [16], Eurofer ODS [17,18], etc. Excellent creep strength of the ODS alloys is associated with an attractive interaction between dislocations and nano‑oxides as it is successfully modelled by Rösler and Arzt [19], who also predict a threshold stress for creep and its significant drop with coarsening of the nano‑oxides. The coarsening kinetics of particles in multicomponent systems is modelled by Fisher et al. [20] and experimentally studied e.g., by Bartkova et al. [21] or by Svoboda et al. [22] indicating a very high resistance of Y-nano‑oxides against coarsening in ODS alloys. The benefits of high creep resistance of ODS alloys at very high temperatures are conditioned by a sufficiently good oxidation resistance. It is common knowledge that Cr-alloying itself is insufficient in such temperature region, see [23,24,25], and a certain content of Al is inevitable, to ensure a sufficient oxidation resistance like, e.g., in MA 956 [5], or PM 2000 [14] ODS alloys.
The research effort of the authors resulted in development of a mechanically alloyed powder with a very high content of O, allowing production of an ODS alloy (called new-generation ODS alloy by the authors) of rather high nano‑oxide volume fraction of about 5%, which exceeds the volume fraction in classical ODS alloys by one order of magnitude [4,6]. The processing of the new-generation ODS alloy consists of three steps [22]: (1) MA to produce chemically homogeneous powders, (2) hot consolidation of the powders by intensive plastic deformation, e.g., by rolling, providing a compact ultra-fine grained alloy due to an intensive dynamic recrystallization and (3) heat treatment to provoke secondary recrystallization leading to rather coarse-grained microstructure conditioning an excellent creep resistance. A complex optimization of the chemical composition of the new-generation ODS alloy performed recently by the authors of the Institute of Physics of Materials leads to conclusion that pure Y-nano‑oxides as strengthening particles are much better with respect to coarsening than other nano‑oxides [21,22], as well as in terms of the cohesive strength of grain boundaries being influenced by wetting of the nano‑oxides (unpublished results). Moreover, the influence of Mo, Ta, La, Ti, Co and Ni alloying on the creep resistance is evaluated as negative or neutral and Cr alloying as slightly positive (unpublished results). A very good creep resistance is obtained for the content of Al up to 10 wt.% (publication in preparation). Now we are in the position to complete the knowledge on the new-generation ODS alloy by studying the influence of Al alloying on high‑temperature oxidation resistance.
The oxidation resistance of steels is usually increased by high Cr alloying [26,27], Al alloying [28] or their combination [29,30]. The protective oxide layer is in the case of high‑Cr steels composed mainly of Cr2O3 [27]. At high temperatures a significant amount of Cr2O3 evaporation occurs in atmospheres containing water vapor in which the volatilization of Cr2O3 is based on its reaction with oxygen and water creating CrO2(OH)2 [31,32,33]. The described volatilization reaction is active at temperatures from 600 °C, and depends on the composition and parameters of the environment [32,33,34]. Next to it, at temperatures higher than 900 °C, the Cr2O3 readily oxidizes in the reaction with oxygen to volatile CrO3 [35]. Both volatilization reactions reduce the surface oxide layer, thus, lowering the protective capability of oxide scale and decreasing oxidation resistance [32,35]. The 14Cr ODS steel shows acceptable oxidation resistance at temperature slightly above 700 °C, with a more pronounced effect on mechanical properties rather than on the oxidation resistance [36]. Detailed studies on the oxidation of high-Cr ferritic-martensitic steels P92 and of ferritic stainless steel containing W and Ce are presented in [23,24,25], from which one can conclude that a high content of Cr itself can ensure the sufficient long-term oxidation resistance at temperatures only up to 700 °C, and it can be increased up to 1000 °C by addition of W, Ce and Si. However, the long-term oxidation resistance can be drastically increased by the addition of Al, as shown for steels in [29,37], and for the top creep resistant ODS alloys MA 956 and PM 2000 containing about 5 wt.% of Al, the oxidation resistance of which extends to the temperature of 1300 °C [5,38]. Excellent high‑temperature oxidation resistance is achieved when Al forms a dense and continuous layer of Al2O3 on the surface of the alloy. The formation and polymorphs of the Al2O3 layer depends on the temperature and alloy composition [29,37,39].
The aim of the present paper is to perform a detailed study of the influence of Al alloying on oxidation resistance of the new-generation ODS alloys with a high content of Y2O3.

2. Materials and Methods

Three grades of new-generation ODS alloy of chemical composition Fe-15Cr-xAl-4Y2O3 with different Al content of x = 0.3 wt.%, 2.0 wt.% and 5.5 wt.%, are prepared by the powder metallurgy route. A custom-made ball mill is used for MA. A vacuum-tight milling container with volume of 22 dm3 and diameter of 400 mm made from low alloyed steel is filled with 100 balls of diameter 40 mm made from hardened low carbon Maraging 350 steel (25 kg) to minimize contamination of the mechanically alloyed powder by carbon due to abrasion of milling balls. The inputs in the form of powders of pure elements or compounds (yttria) are used, which allow a very easy variation of chemical composition of the resultant ODS alloy. The following metals powders are used for the ODS powder preparation: Fe-powder ABC100.30 (Höganäs, Sweden), 100 mesh Al-powder of purity 99.9% (CNPC POWDER, Shanghai, China), Y2O3-powder of purity 99.9% of 500 mesh (Anhui Herrman Impex Co Ltd., Anhui, China) and Cr metal size 1–4 mm of purity 99.9% (Kovy a slitiny, Zaječice, Czech Republic). A total amount of 1 kg of the powder (the ball to powder ratio is 25) is mechanically alloyed by rotation of the milling container at 70 rpm along the horizontal axis. After a sufficiently long MA (two weeks) in vacuum, the powder properties become saturated and the powder particles consist of a homogeneous solid solution with a huge density of defects like dislocations and vacancies. After MA, the powder is poured under the protective atmosphere (CO2) in the rolling container made from steel tube 20/1 mm, evacuated and sealed by welding. Then the container is rolled in three steps to thicknesses 7.5 mm, 4.9 mm and 3.25 mm at temperature 900 °C. The rolling leads to pore-free ultra fine‑grained microstructure due to heavy plastic deformation inducing dynamic recrystallization. The strain rate during rolling is estimated as 10 s−1. After stripping from the rolling container, the ODS alloy is secondary recrystallized by annealing at 1200 °C for 16 h. The nominal chemical composition of the grades is presented in the Table 1.
The specimens for oxidation tests represented by prisms of dimensions 8 × 8 × 2.5 mm are cut with a wire electric spark cutter. All the surfaces of the samples are ground to the same grade on metallographic SiC sandpapers up to density 1200. After grinding the samples are ultrasonically cleaned in acetone. The oxidation tests are performed at 1200 °C in a muffle furnace on air for 1 h, 4 h, 16 h and 64 h. For each test time and grade tested, one specimen is used. In total, twelve specimens are employed in the oxidization experiment. To account for possible oxide delamination of the specimens during cooling, each specimen is placed on an alumina plate and weighted with the plate before and after oxidation test. The alumina plates are annealed at 1250 °C for 4 h to stabilize their weight before the test. An analytical balance with an accuracy of 0.1 mg is used for weighing of specimens. The microstructure, surface morphology of the oxide scales and cross‑sections of the oxide layers of the grades are characterized by a Tescan LYRA 3 XMH FEG/SEM scanning electron microscopy (SEM, Tescan, Brno, The Czech Republic) equipped with the energy dispersive spectrometer (EDS) analyzer X‑Max80 (Oxford Instruments, High Wycombe, UK). The observation is conducted in the secondary electron mode using an acceleration voltage 20 kV and a beam spot size of 15 nm. The specimens for microstructural and cross‑sectional observations of the oxide layers are hot and cold mounded with resin, respectively. The specimens are then ground with SiC sandpaper up to density 2500 and polished with 3 µm and 1 µm diamond pastes and OPS suspension. Prior to the observation, the specimens of the oxide scales and cross‑sections of the oxide layers are coated by a carbon film of thickness ~17 nm to prevent charging. The oxide layer thickness is measured in ten lines on three different locations of the specimen.
The phase composition of the grades and of the surface oxide scales is analyzed by X-ray diffraction of the bulk material by X-ray diffractometer (Empyrean, PanAnalytical, Almelo, The Netherlands) using the Co (Kα1,2) radiation measured with beta filter and 1-D detector (Pixel3D). It works in Theta-Theta geometry, Bragg-Brentano continuous mode with step 0.04° and 300 seconds per step. The diffracted patterns were analyzed by HighScorePlus 4 (PanAnalytical, Almelo, The Netherlands) with PDF2 and ICSD databases and by FullProffSuite [40,41] equipped with Rietveld analysis. According to the ICSD database the following phases are identified with corresponding identification codes and PDF cards in the brackets: α-Fe (ISCD code No. 607480, PDF 00-034-0396), Y2O3 (77081, 98-029-0960), α-Al2O3 (160606, 98-002-8919), Y3Al5O12 (31496, 98-009-3633), (Cr,Fe)2O3 (163943, 98-016-3943), (Fe,Cr)3O4 (163943, 98-008-6577).

3. Results and Discussion

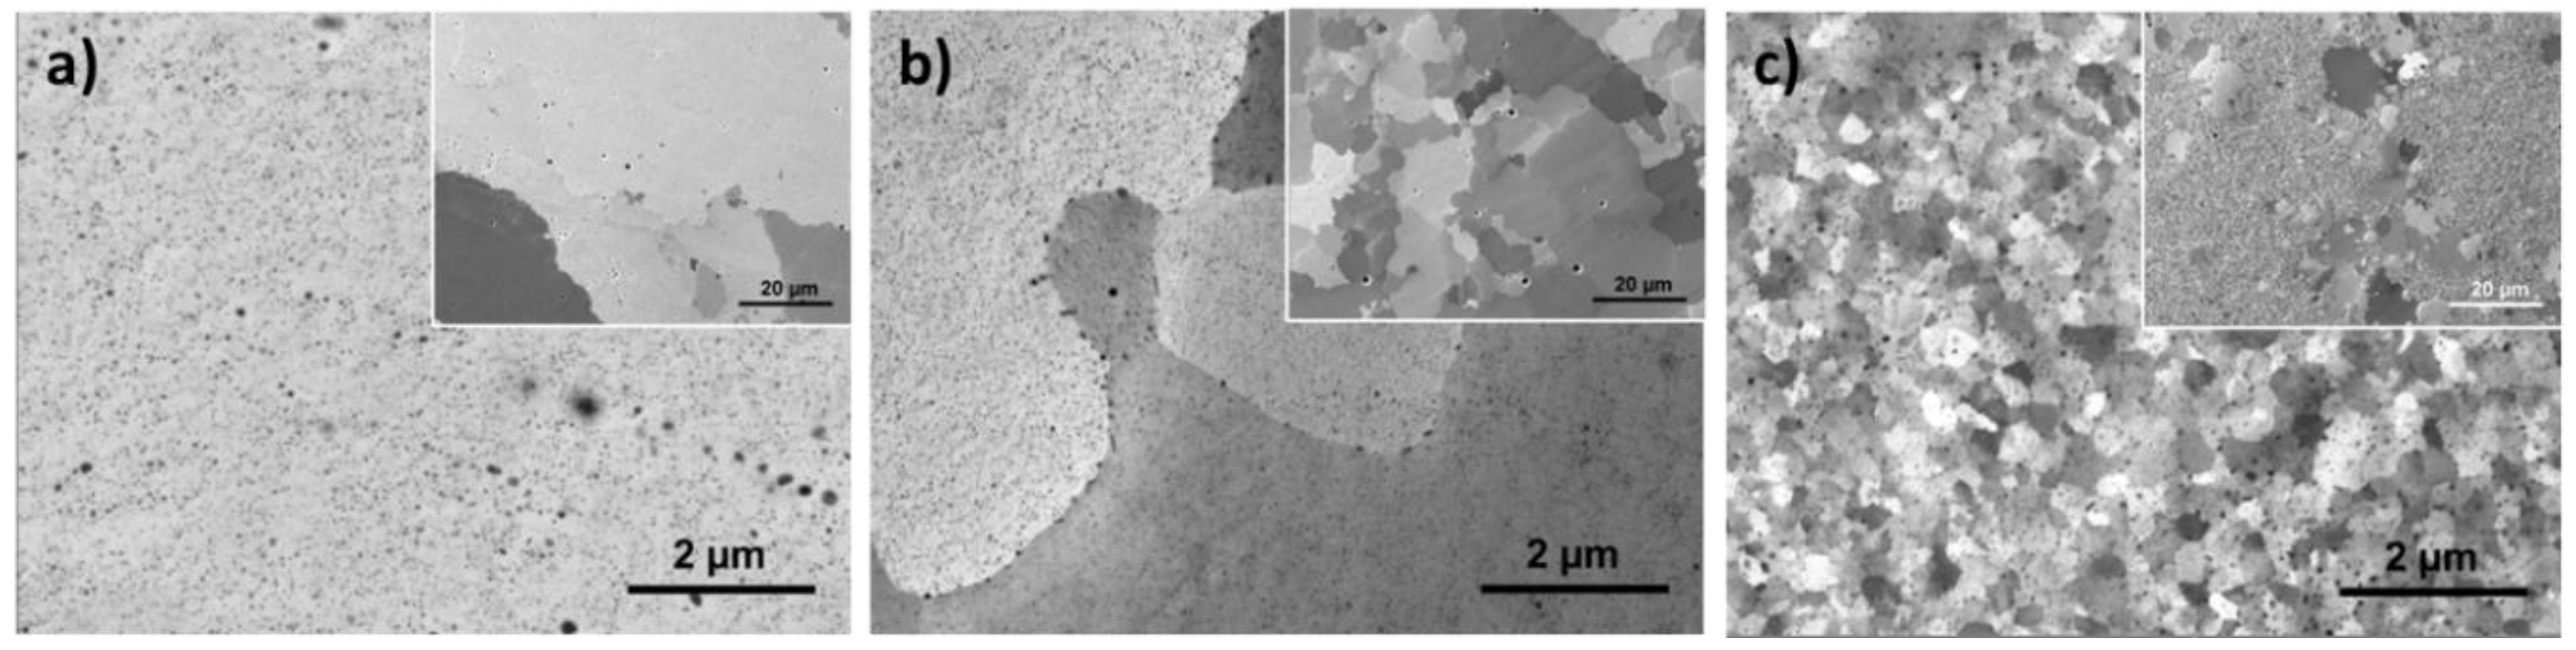
3.1. Description of the Microstructure of As‑Annealed ODS Alloys

The microstructures of the grades of new-generation ODS alloys with different Al content are shown in Figure 1. The influence of Al content on the resultant grain microstructure is significant. Grade A1 with 5.5 wt.% of Al fully recrystallizes to rather large grains. Grade A2 with 2.0 wt.% Al also fully recrystallizes, but a smaller grain size is obtained. The recrystallization process of grade A3 is, however, not completed, leading to bimodal grain size distribution. Homogeneous nanosized particles dispersion is observed in the grain interiors and on the grain boundaries of fine grains. The black large particles are identified as aluminum nitrides (AlN) by EDS analysis. The results of X-ray diffraction (XRD) revealed ferrite (α-Fe) and a relatively high amount of Y2O3 nanoparticles of ~4 vol.%, see Figure 2. The absence of AlN in the XRD spectrum is due to its small quantity, bellow 0.3 wt.% in the microstructure. The particle analyses by transmission electron microscopy refer for FeCrAl ODS alloys with similar chemical composition such as PM 2000 (Fe-19Cr-5.5Al-0.5Ti-0.5Y2O3) [42] and MA 956 (Fe-19.9Cr-4.6Al-0.4Ti-0.5Y2O3) [43], also the presence of complex Y‑Al oxides YAG (bcc lattice, Y3Al5O12), YAP (orthorhombic lattice, YAlO3) and A2O3 oxides together with Y-Al complex oxide YAP (orthorhombic lattice, YAlO3). Especially for the grades with the increased Al content, i.e., A1 and A2, Al2O3 oxides and Y-Al complex oxides can be expected. The lack of identification of those phases in this work is probably connected with their low amount in the microstructures of the grades and by the detection limits of performed XRD analyses.
The effect of Al addition on microstructure and mechanical properties of the studied FeCrAl ODS alloy can be described as follows. The increase of Al content in the studied range from 0.3 wt.% to 5.5 wt.% enhances the recrystallization ability of the grades after thermo‑mechanical treatment of high temperature rolling. A larger grain size with smaller portion of grain boundaries is favorable for creep properties of the alloy [4,44]. The influence of rolling temperature of thermo‑mechanical treatment and of Al content between 4–11 wt.% is described in the separated study [45]. It is observed that the increase of Al content has positive effect on creep strength, the contribution of which is identified as an improved cohesion strength of grain boundaries.

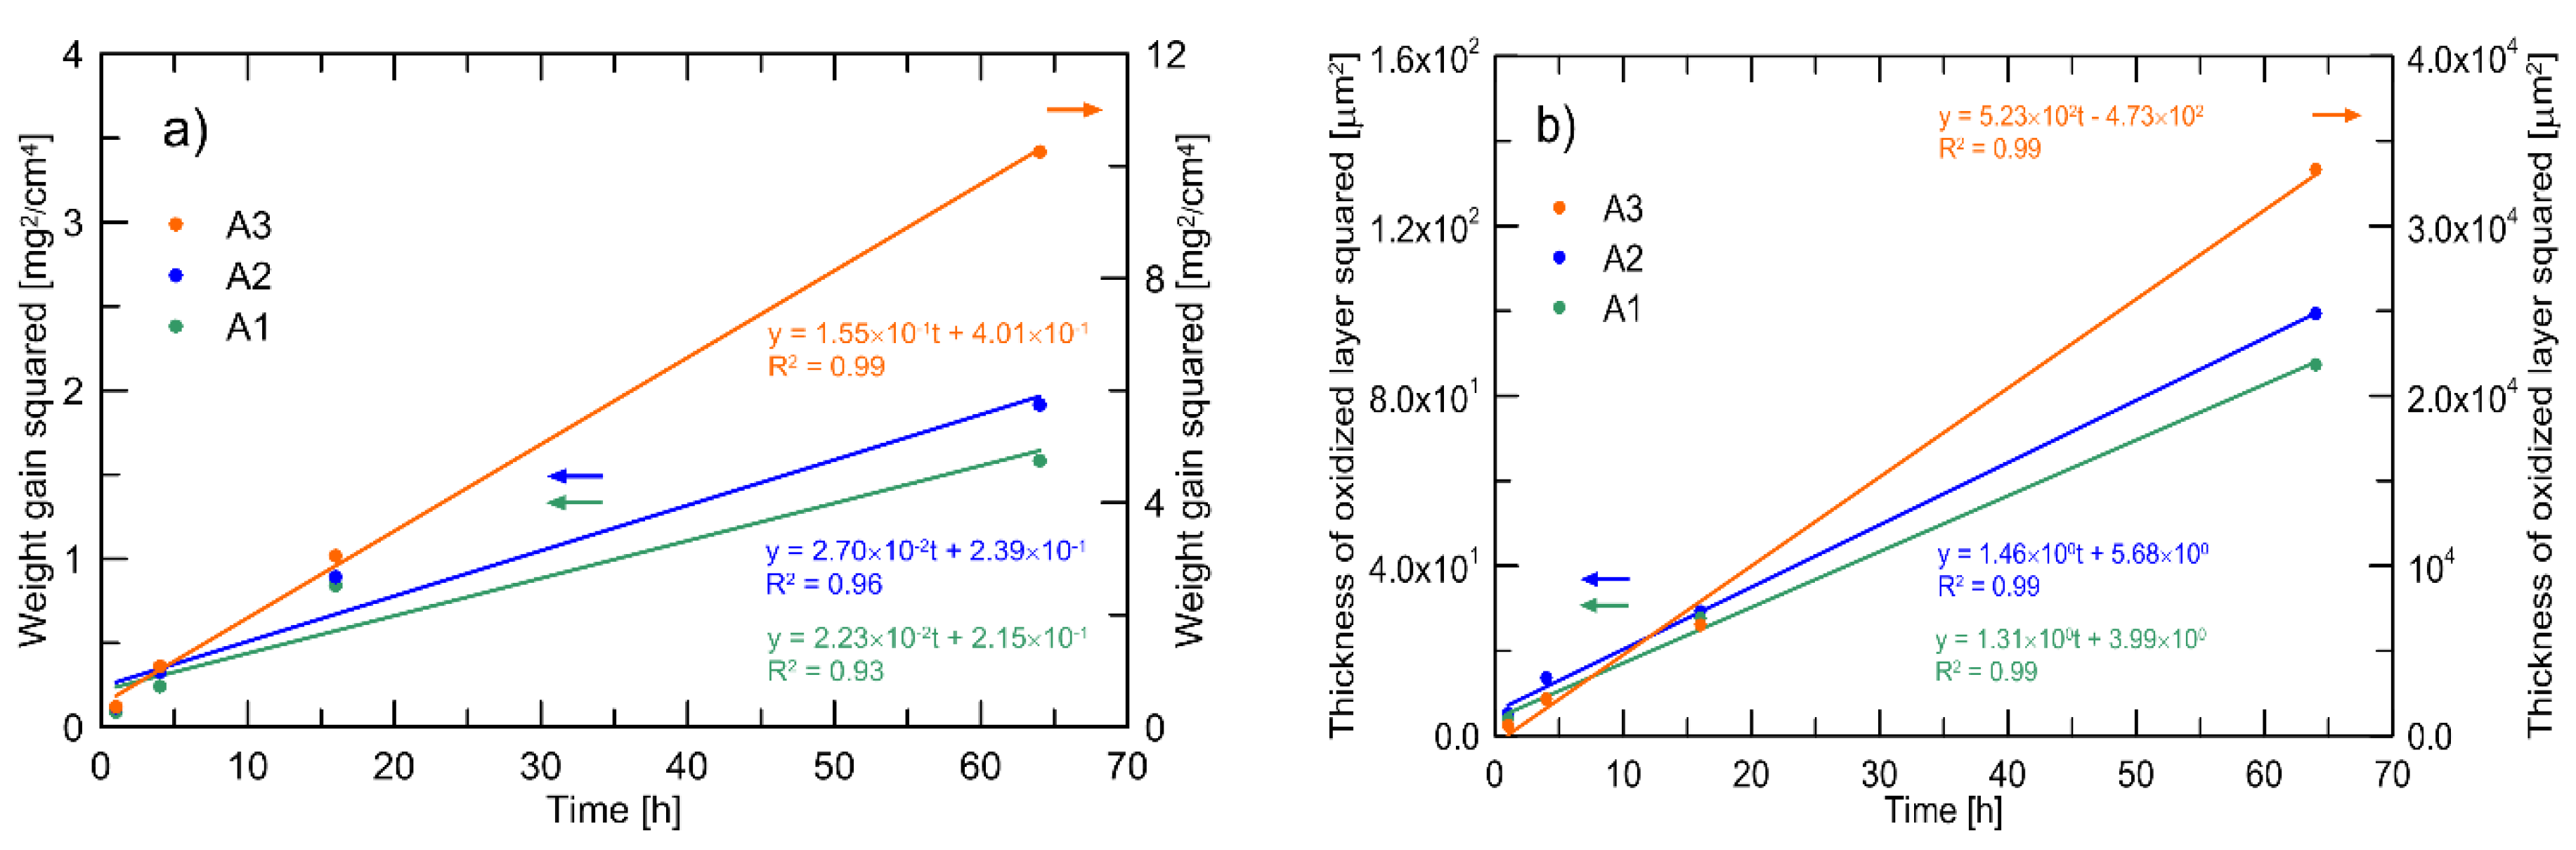
3.2. Oxidation Kinetics

The oxidation kinetics of the grades at 1200 °C is shown in Figure 3. Obviously, there is a sharp decrease of the oxidation weight gain with the increase of Al content from 0.3 wt.% to 2.0 wt.%, see Figure 3a. The weight gain of grade A3 with the lowest Al content 0.3 wt.% is 3.2 mg/cm2, whereas that of grade A2 with 2.0 wt.%, is only 1.4 mg/cm2 after the oxidation at 1200 °C for 64 h. Further increase of Al content to 5.5 wt.% in A1 has only a slight effect leading to the weight gain 1.3 mg/cm2. A similar trend of data is observed for thicknesses of oxidized layers (see Figure 3b) determined by examination of the cross‑sections of exposed specimens. The thickness of the oxidized layer is considered as the thickness of the surface layer, where a significant change of chemical composition with respect to the alloy matrix occurs, see Chapter 3.4. Grade A3 with the lowest Al content 0.3 wt.% shows by a factor of 20 a faster growth of the oxidized layer to that in grades A2 and A1 with Al content 2.0 wt.% and 5.5 wt.%. After the exposure for 64 h, the oxidized layer thickness for grade A3 is 180 µm in contrast to grades A2 and A1 with thicknesses of 10 µm and 9 µm, respectively.
To analyze the oxidation kinetics, the time dependence of the mass gain and oxide layer thickness are described according to the Wagner’s theory [46]. The data of mass gain and oxide thickness is fitted to the parabolic law using the equation:
X n = k t ,
where X is either the mass gain defined as a change of the weight Δm per unit area before the exposure Am/A) or a change of oxide layer thickness Δd, k is the oxidation rate constant, t is the exposure time in s and n is the rate exponent. For the linear, parabolic, sub-parabolic or cubic and sub‑cubic oxidation kinetics, the values of n are 1, 2, ≤3 and ≤4, respectively. Assuming the n = 2 a parabolic rate constant kp can be obtained by plotting the square of the measurement variable against time, Figure 4. In the case of kp, the data is fitted by the equation:
X 2 = C + k p t ,
where C is a constant.
The results of oxidation kinetics of the weight gain data are presented in Table 2. A non‑parabolic growth law is determined for the examined alloys. Grades A1 and A2 obey nearly a cubic growth law, whereas grade A3 follows a sub‑parabolic growth law at studied conditions. Parabolic rate constants of grades A1 and A2 forming α‑Al2O3 oxide scale layer seem to be quite similar with the ODS alloy PM 2000 with coarse grains [47]. The oxidization kinetics of grades A1 and A2 are also well comparable with the kinetics of the intermetallic ODS alloys Fe40Al Grade 3 and ALUSI 1 with one order lower values determined at 1100 °C [48]. In comparison with alumina forming Ni‑based single crystal superalloy DD6 [49], the A1 and A2 grades provide only one order higher kp at 200 °C higher temperature. On the other hand, grade A3 with chromium oxide scale layer demonstrates similar oxidization kinetics as binary Ni‑30Cr alloy [35] or high‑Cr steel 19Cr-2Mo-0.3Mn-0.5Si [25]. The effect of Al content on the oxidization kinetics can be also noticed on the results of the 15Cr steel, with Al contents of 0.08 wt.% and 2.45 wt.% forming a chromium oxide and alumina oxide scale layer at 1000 °C [29]. Considering the lower temperature of the oxidization experiment 1000 °C, comparable results to those of grades A1, A2 and A3 are obtained. The results of oxidation kinetics of the oxide scale thickness data are presented in Table 3. The kinetics of growth of oxide layer thickness is sub‑parabolic, cubic and parabolic for grade A1, A2 and A3, respectively. The parabolic rate constant of oxide layer thickness of grade A3 is three orders higher than of grades A1 and A2. Such a big difference is particularly caused by the internal oxidation of grade A3, see Chapter 3.4. The oxide scale thicknesses of grades A1, A2 and A3 are quite similar to the ODS alloys PM 2000 [47], MA 956 [50] and binary Ni 30Cr alloy [35] at corresponding exposure times, respectively.

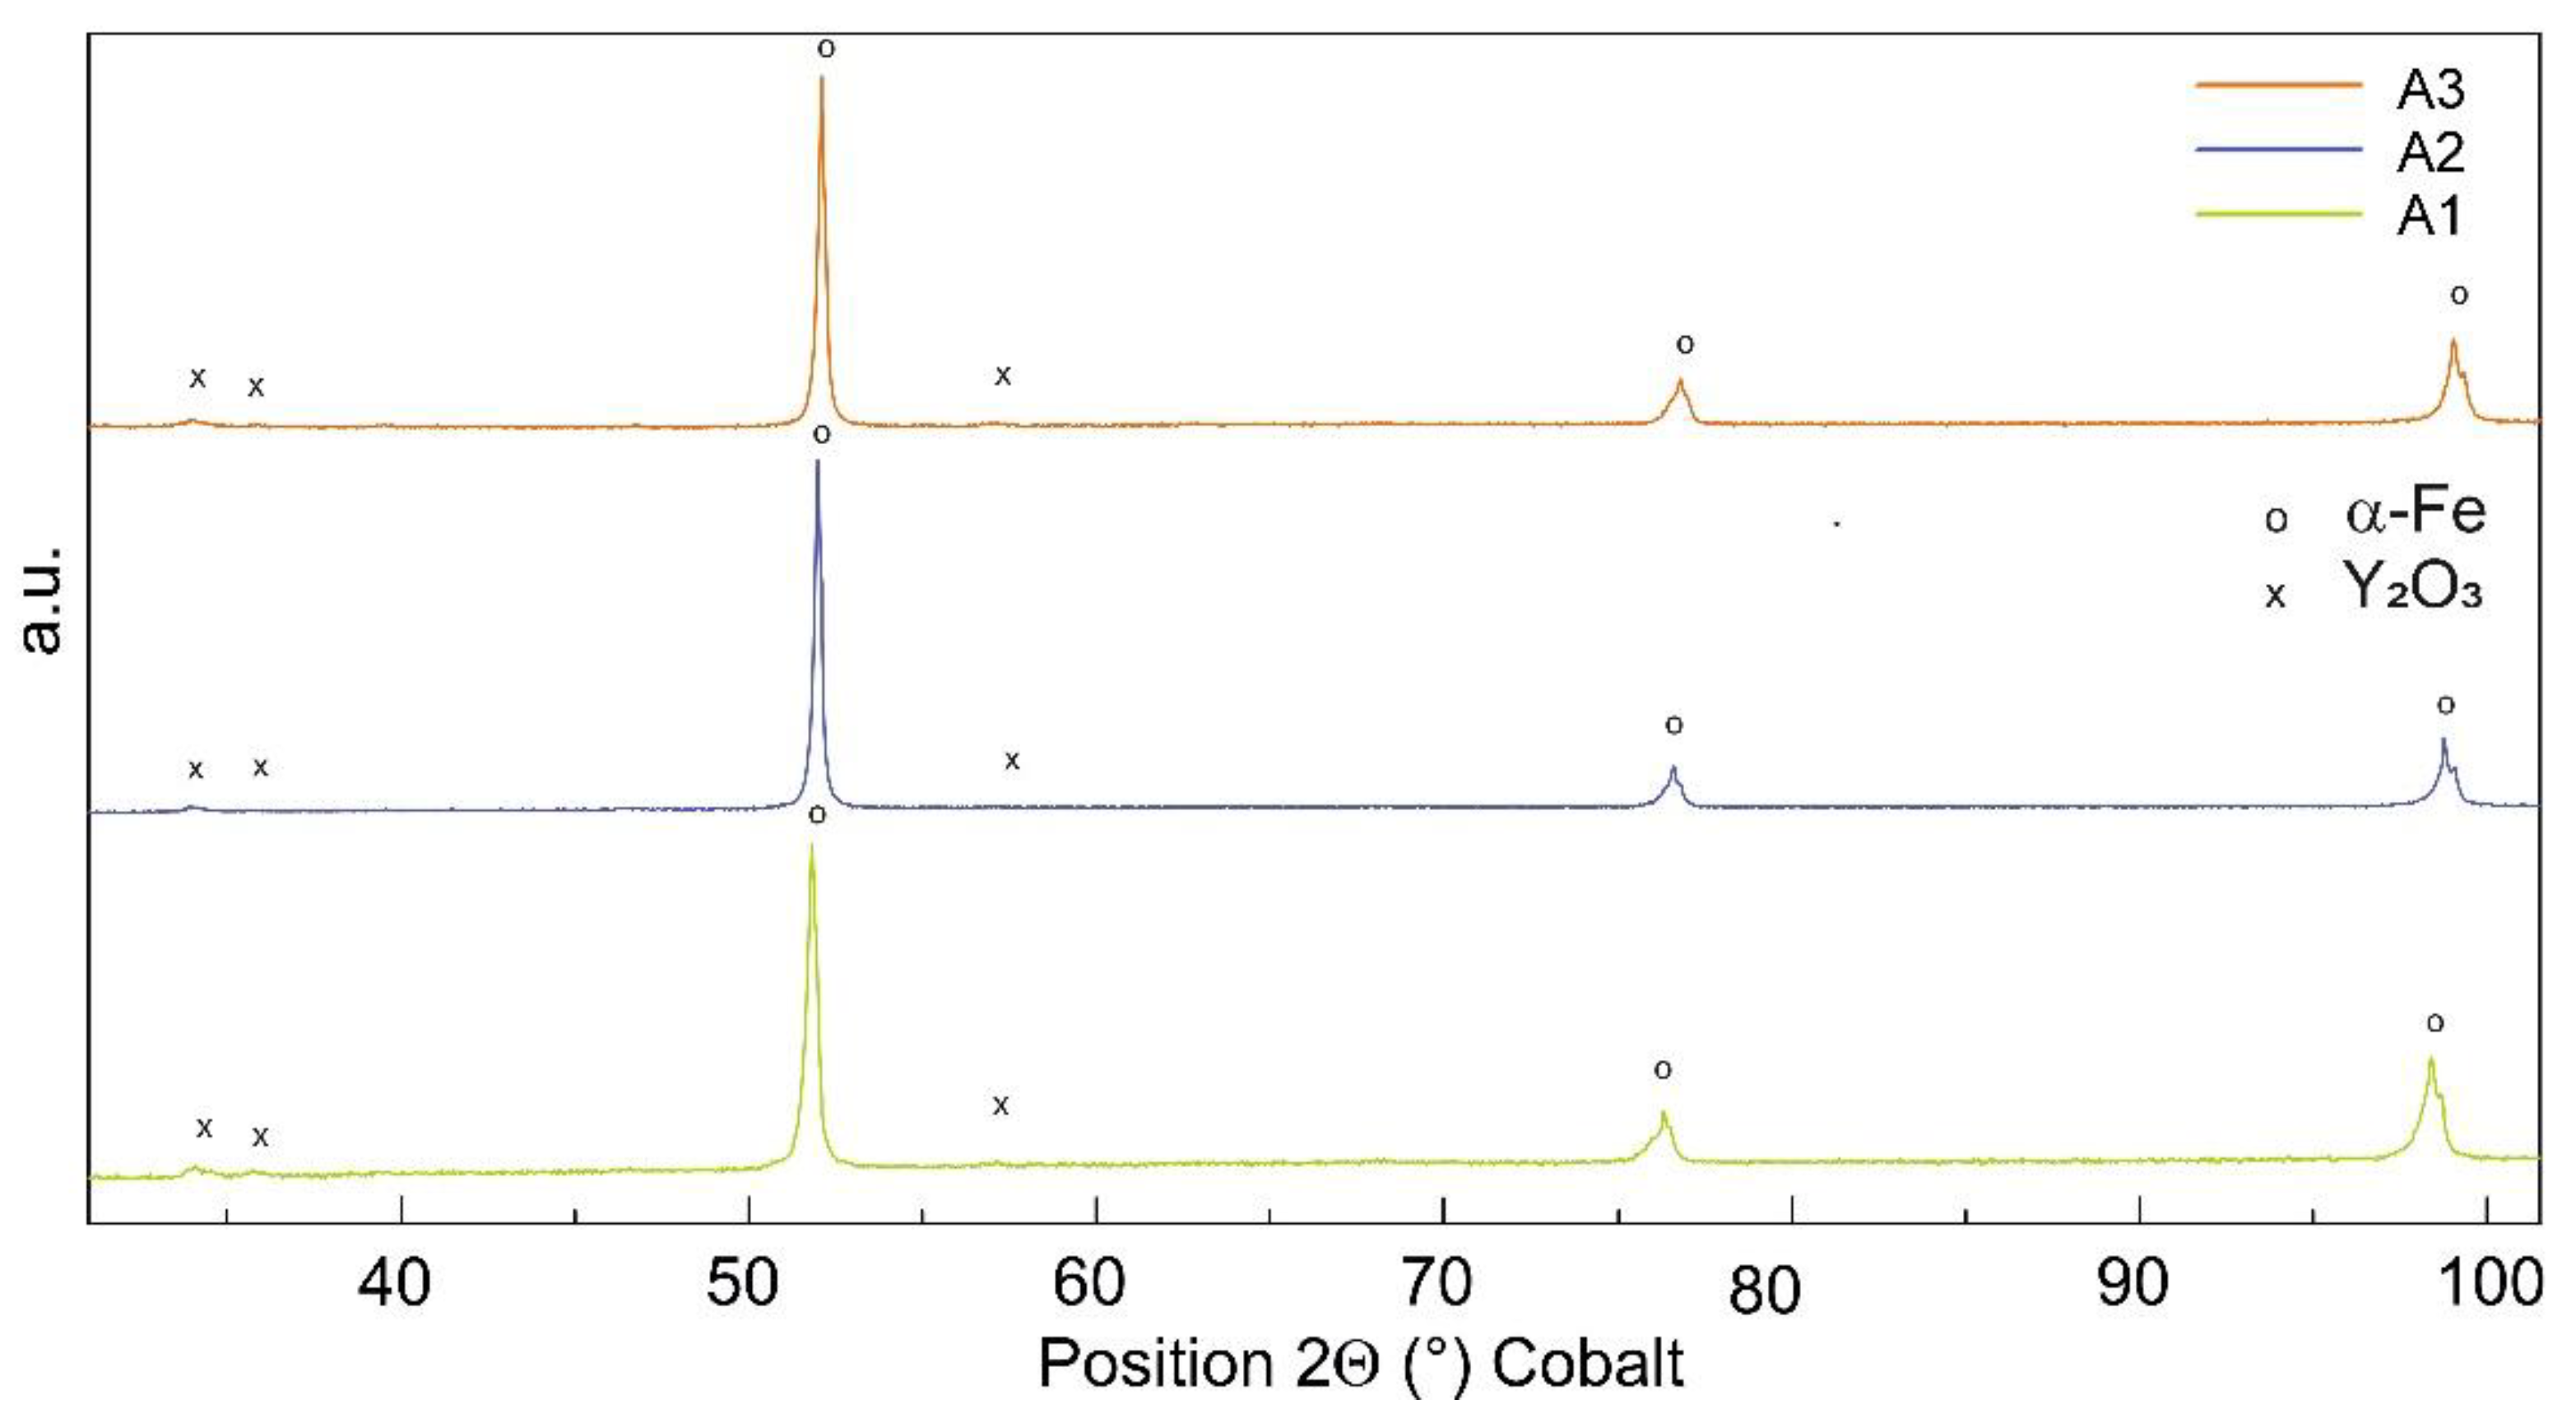
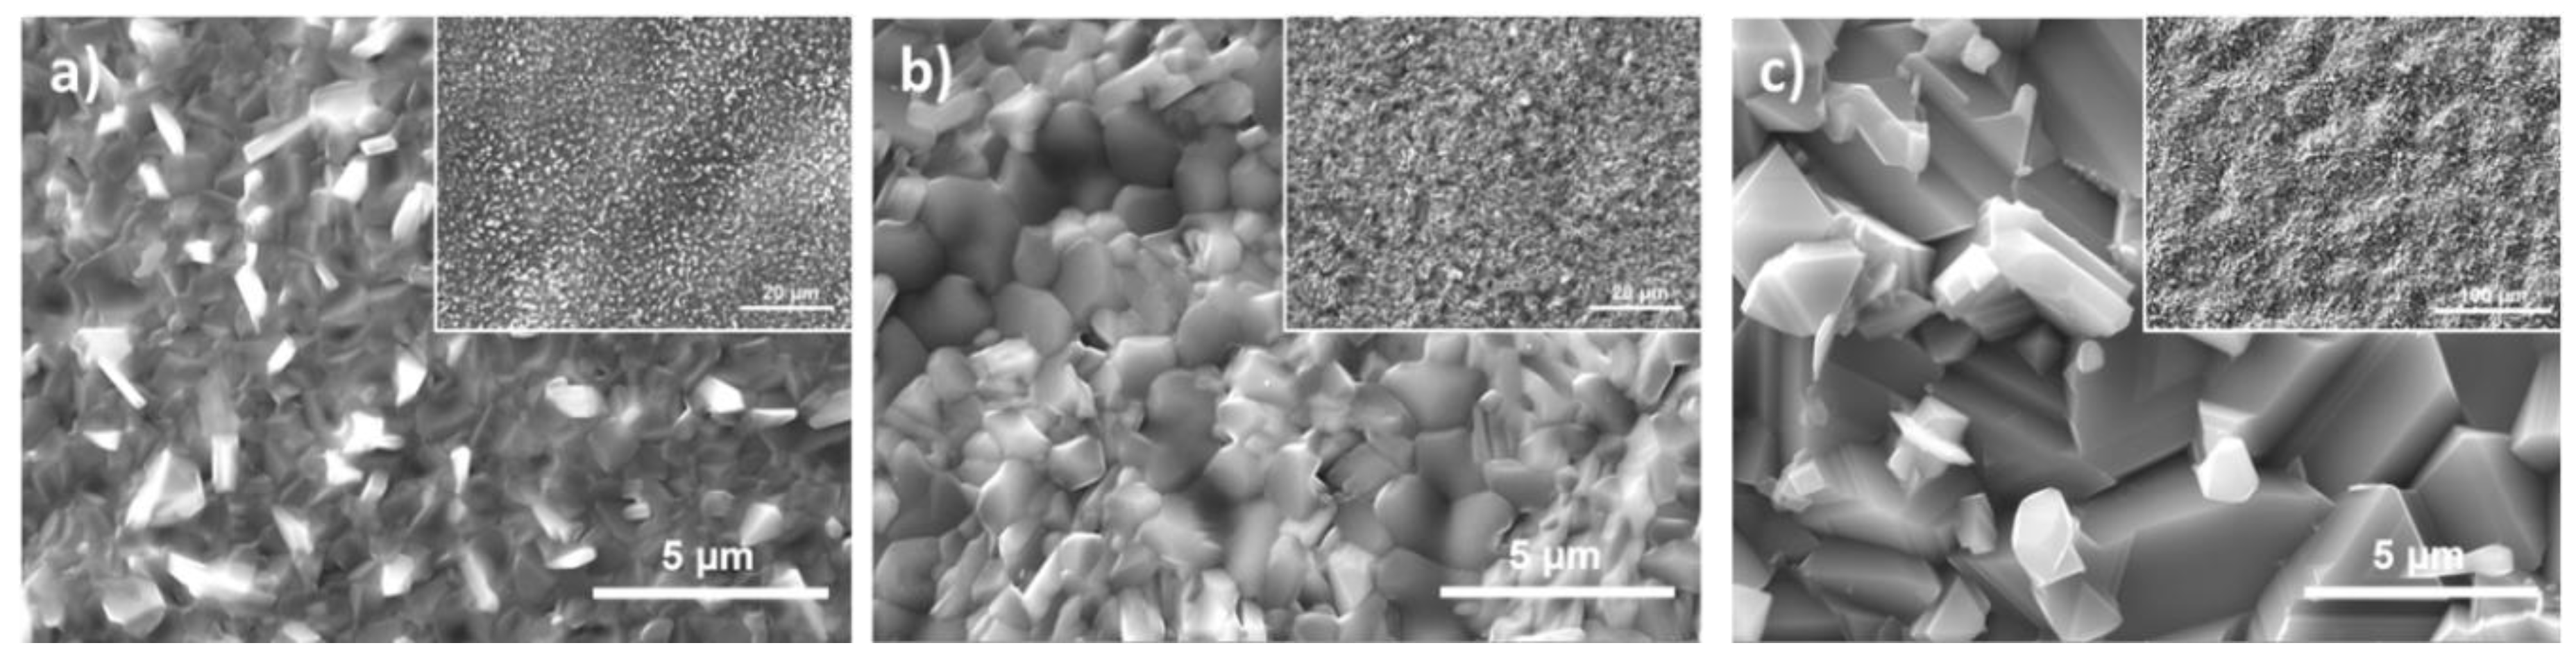
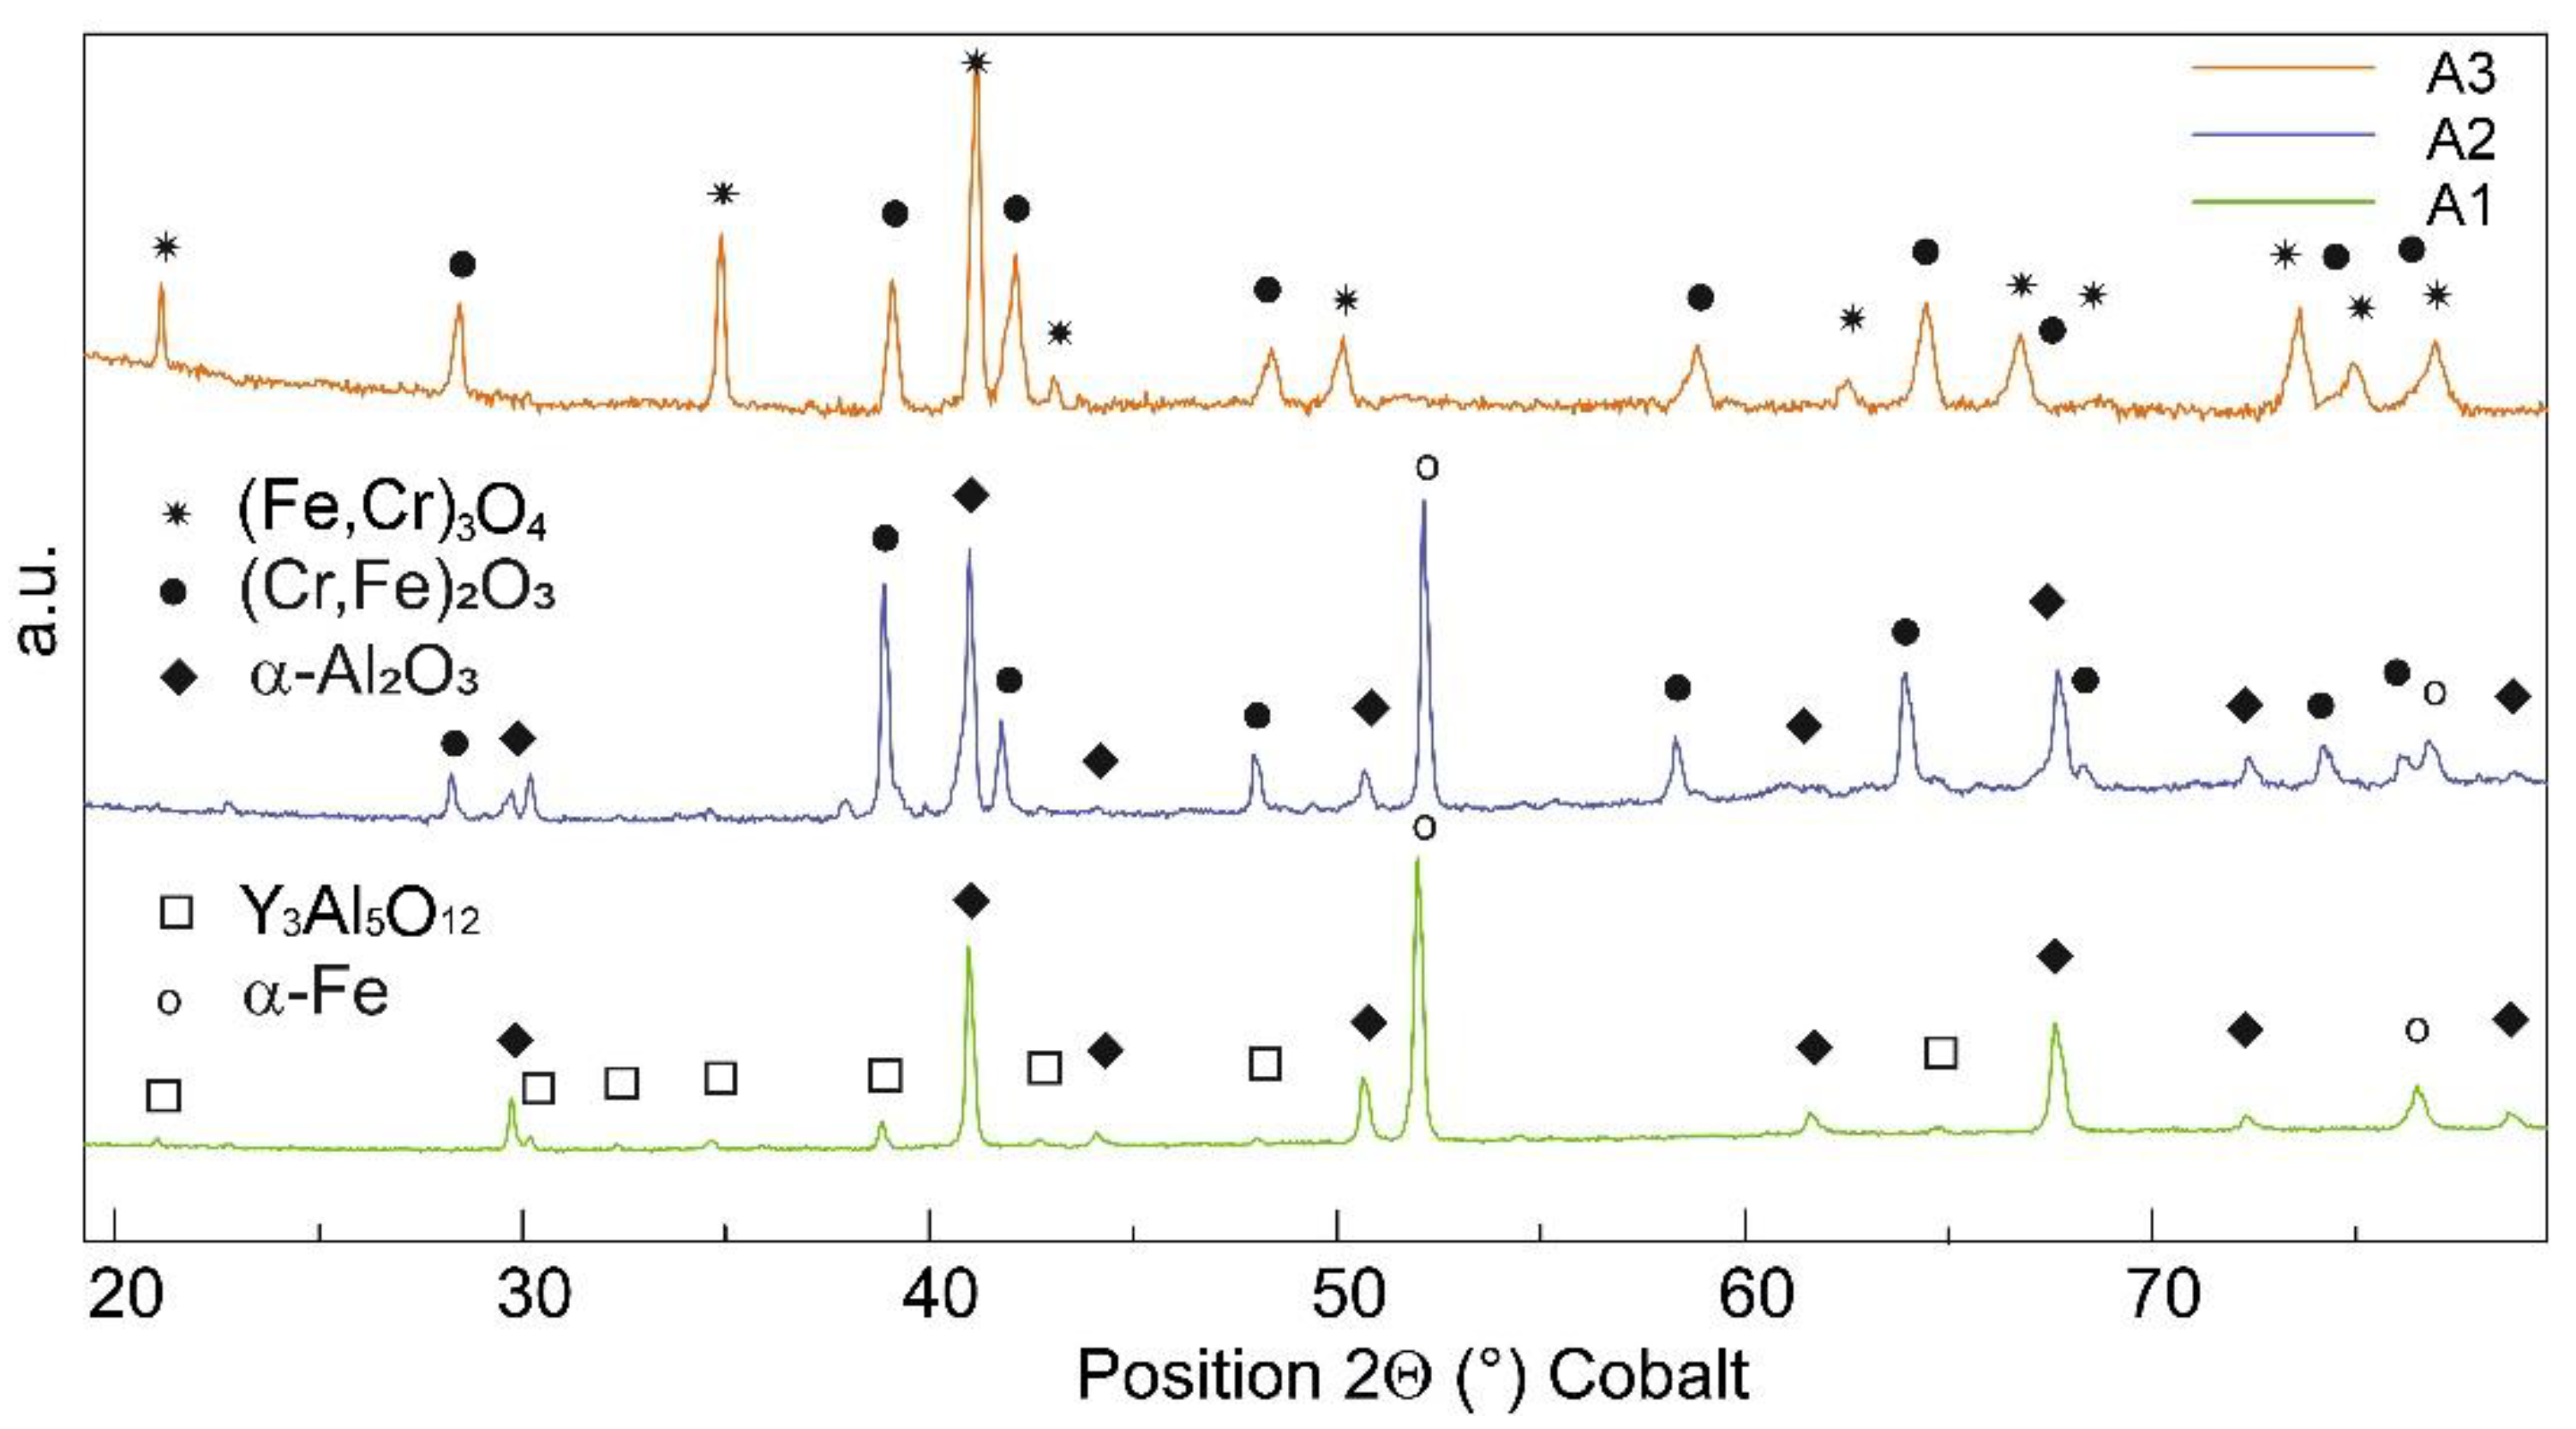
3.3. Surface Morphology and Phase Composition of the Oxides

The morphology of the surfaces of oxidized samples of grades A1, A2 and A3 is shown in Figure 5. The oxide grains of grades A1 and A2 are rather fine after the exposure for 64 h at 1200 °C. The equiaxed grains of grade A1 are of size less than 1.5 μm. The EDS analysis revealed that the oxides are dominantly composed of Al and O, see Chapter 3.4. Next to it, a small amount of Y, Fe and Cr are detected too. In comparison to grade A1, the equiaxed grains of surfaces oxides of the grade A2 are slightly larger (2 µm). Additionally, in the case of the A2 alloy, the EDS analysis detected that fine oxides are dominantly composed of Al and O. In addition to it, the significantly larger amounts of Y, Fe and Cr are detected too. Moreover, compared to grade A1, the bright oxides of larger size and regular distribution are presented on the oxidized surface of grade A2, compare Figure 5a,b. Based on the results of EDS measurements, these bright oxides contain Al, O, Fe and a slightly increased amount of Cr. The surface morphology of the oxide layer on the oxidized grade A3 alloy is rather coarse, see Figure 5c. One can also notice a much higher roughness of the oxide surfaces with pronounced protrusions. The oxide grains of grade A3 attain size up to 7 µm which is the largest size observed for the studied grades. According to the EDS analysis, the surfaces oxides contain O, Fe and Cr. Neither Y nor Al is detected in the surface oxides in this case.
The XRD spectra of the oxides grown on the surfaces of specimens after the exposure for 64 h/1200 °C are given in Figure 6. The estimated penetration depth of the applied XRD measurement is 30 μm and is, therefore, considered in the interpretation of the results. The surface layer of grade A1 is dominantly composed of corundum (α-A2O3) and of a small amount of complex Al, Y-rich oxides identified as Y3Al5O12 (YAG). The oxidized surface of grade A2 also contains a significant amount of corundum together with a certain amount of complex Cr‑Fe oxide identified as (Cr,Fe)2O3. Due to the small thickness of the oxide layers around 10 μm, both diffraction spectra of grades A1 and A2 also contain diffraction peaks of the ferritic matrix (α-Fe). On the contrary, the XRD measured only the oxide layer on the specimen of grade A3, due to its significantly larger thickness. This oxide layer is formed by nearly the same amount of complex Cr‑Fe oxides analyzed as (Cr,Fe)2O3 and (Fe,Cr)3O4.

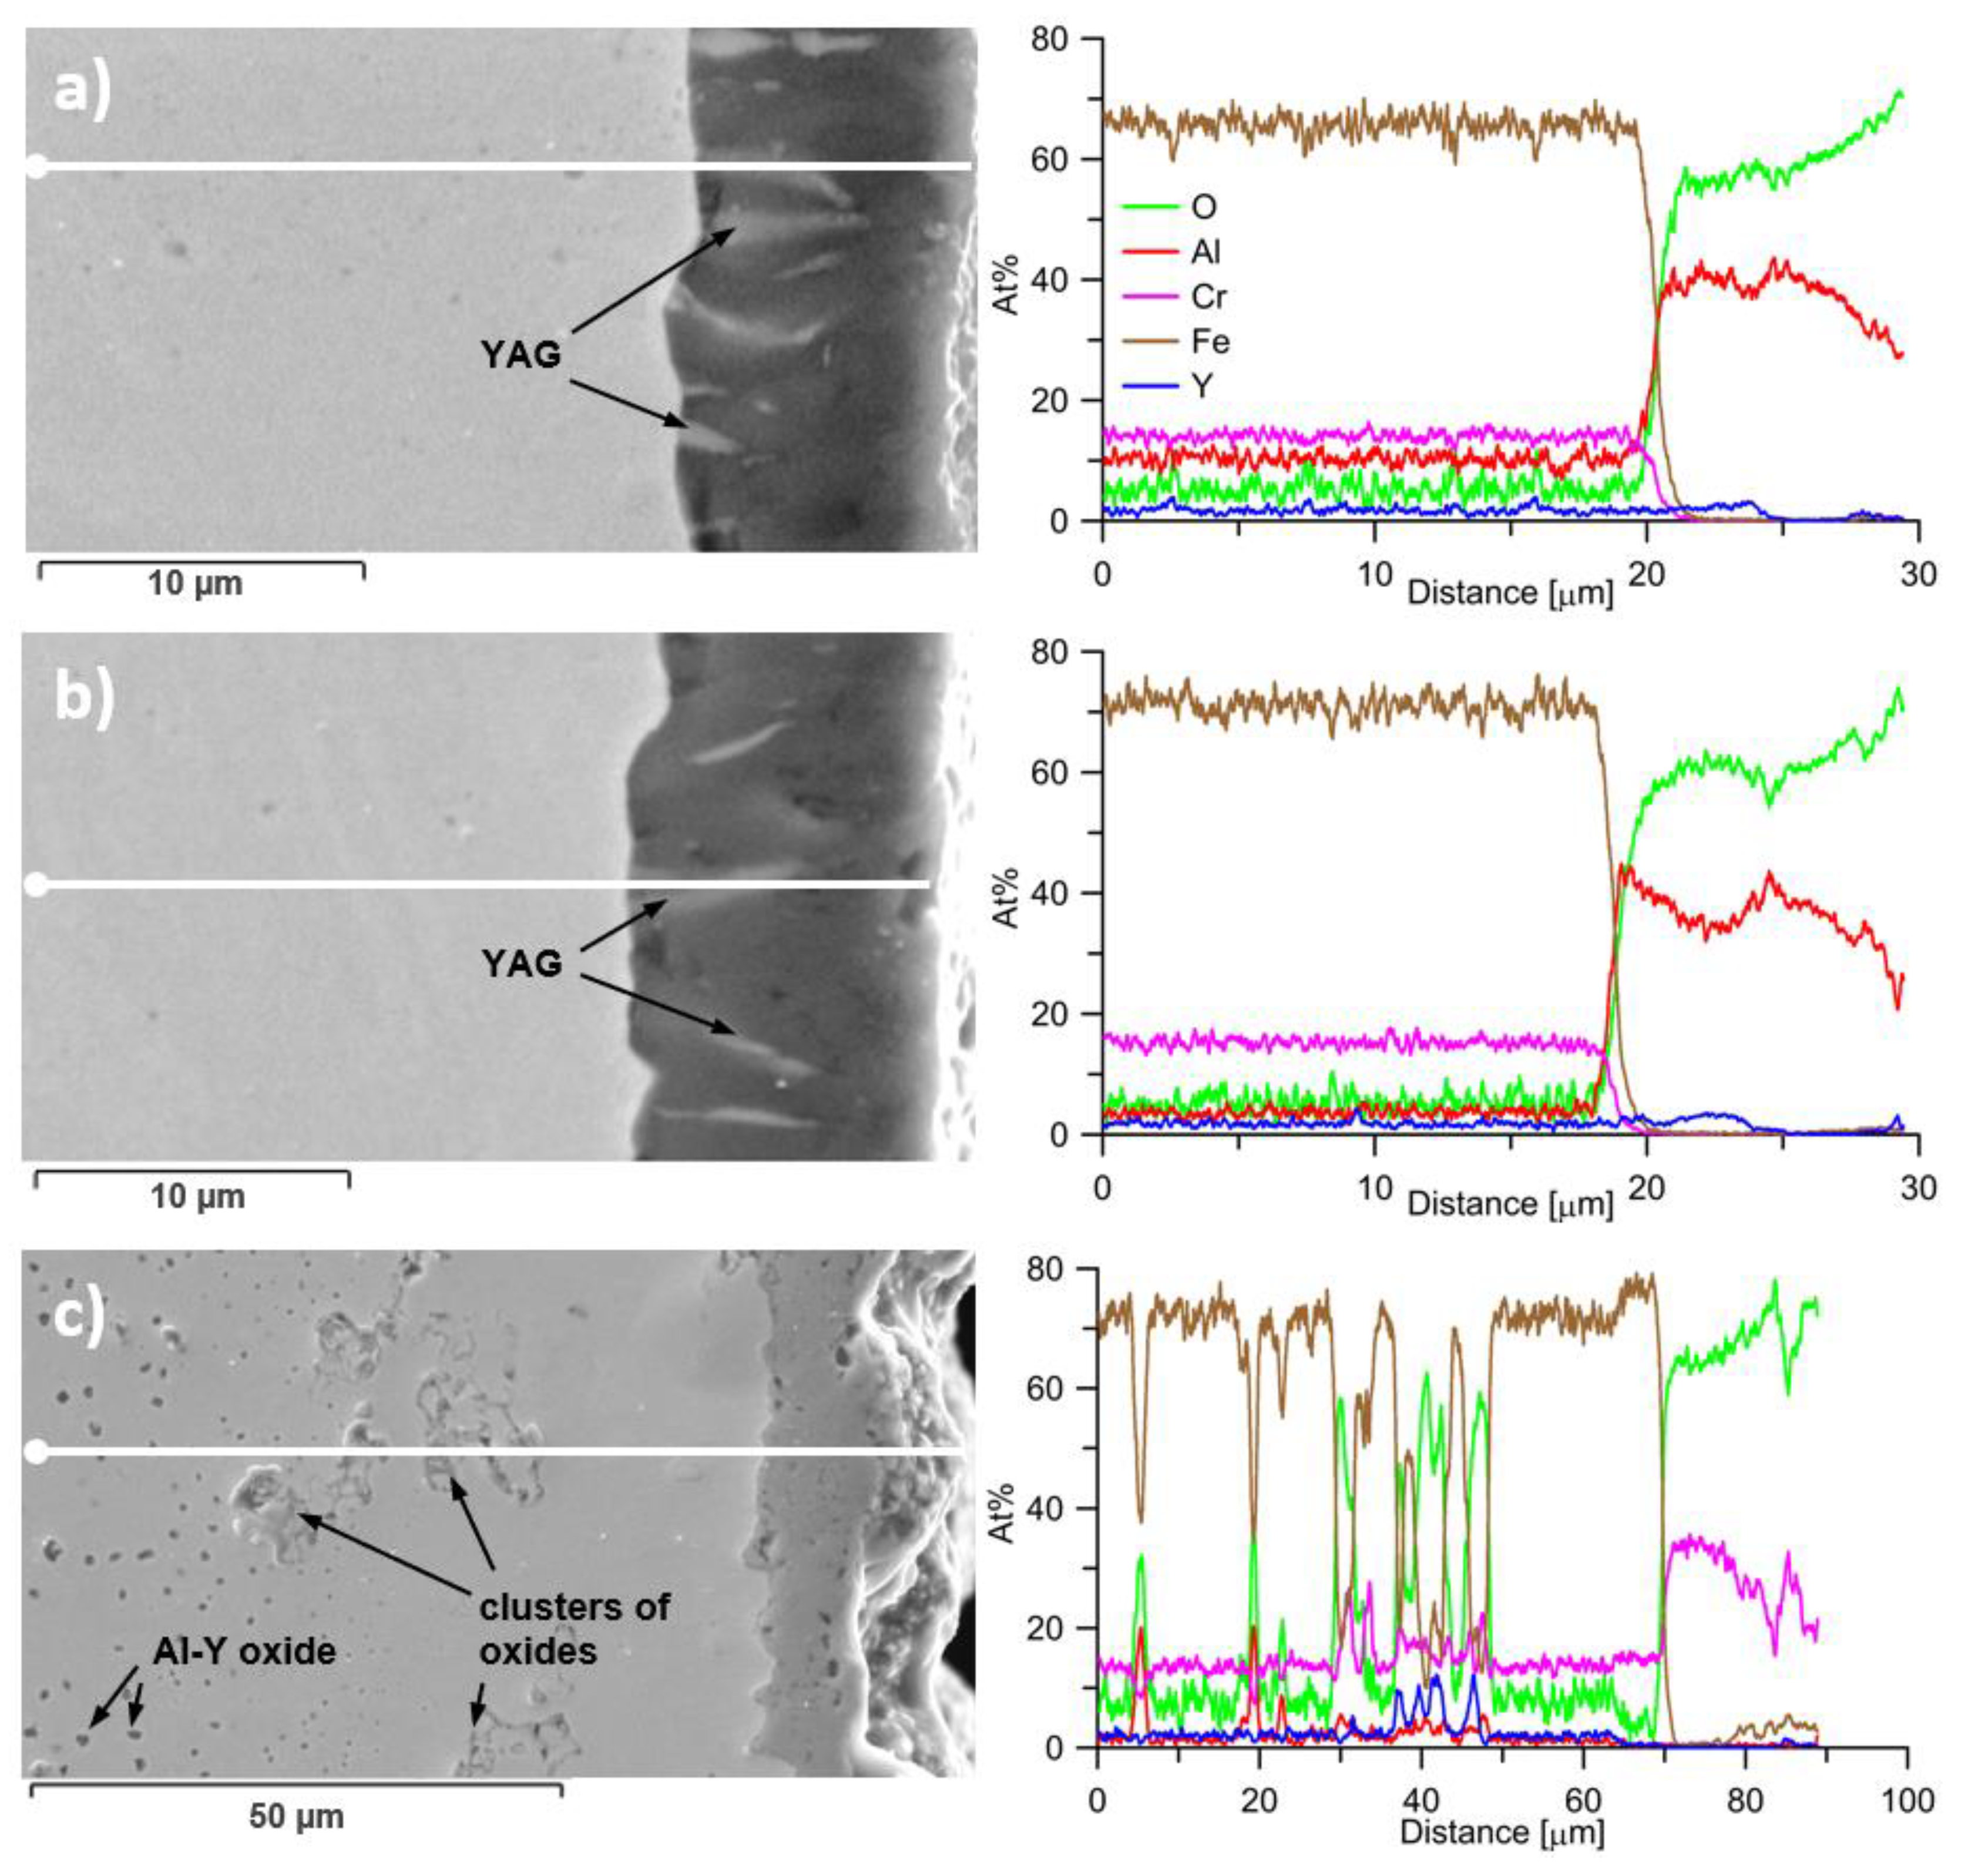
3.4. The Analysis of Cross‑Sections of the Oxidized Layers

The cross‑sectional morphologies and corresponding EDS line scans of the specimens of grades A1, A2 and A3 exposed to 64 h/1200 °C are presented in Figure 7. It can be noticed that the thickness of the oxide layer significantly depends on the Al content as it is already shown in Figure 3b. The oxidized surface layers on grades A1 and A2 are compact with smooth outer surface, see Figure 7a,b. The oxidized surface layer is dominantly composed from corundum (α-A2O3), forming a top (outer) layer of equiaxed grains and a bottom (inner) layer containing columnar grains. The ratio of bottom to total oxide layer thickness of grade A1 continuously develops from 0.47 to 0.69 for 1 h and 64 h of exposure, respectively. The oxide scale of grade A2 follows a similar trend with the ratios 0.48 and 0.74 for corresponding exposure times. In the inner corundum layer the dendrites of YAG originated from reaction of yttria nano‑oxides with corundum are observed, see Figure 6. The only sporadic isolated pores are observed inside corundum layers and no peeling of oxide layers is detected up to 64 h of exposure.
On the contrary, the oxide layer on the surface of grade A3 with Al content 0.3 wt.% consists of mixed Cr, Fe oxides, see Figure 7c. Moreover, there are significant changes of the chemical composition in the oxidized layer concerning O, Cr and Fe elements. The outer region of the oxide scale is composed mainly of O and Cr with a small amount of Fe, the amount of which decreases throughout the thickness of the oxide scale. Further, below the oxide layer, the clusters of oxides rich in Fe, Cr and Y are presented in the alloy matrix. Next, an intensive formation of small Al‑Y‑rich oxides can be observed at 30–180 µm beneath the surface representing the inner region of the oxide scale. Note that these Al‑Y rich isolated oxides are not detected in the as‑annealed state of grade A3. Following, there is an increased amount of O in the matrix of grade A3 below the oxide scale. Regarding morphology, the oxide scale of grade A3 is rough. A significant amount of cavities, presented both in the oxide scale and also on the interface of oxide scale/matrix, is observed. The cracks on the interface of oxide scale/matrix are detected too. The oxide scale is compact after 4 h of exposure but it shows a significant tendency to spall after 16 h of exposure. No additional oxidation is observed below unstuck oxide scale which indicates that the cracking/spallation of oxide scale takes place during cooling to the room temperature.

3.5. Discussion of the Effect of Al Content on Oxidization Mechanisms

From the results it is evident that two significantly different oxidation mechanisms occur in the studied grades’ systems. The oxidization mechanism of grades A1 and A2 is the same, and can be described as the following. At the beginning of the oxidation, the oxygen molecules are adsorbed onto the surface of the sample. The Cr and Al are both strong oxide formers which have a high affinity for oxygen. These elements are preferentially oxidized when added to a base metal such as Fe due to the lower free energy of formation [51]. In case of grade A1 with Al content 5.5 wt.%, the oxygen anions diffuse into the substrate and firstly react with Al cations to form Al2O3 nucleating on the surface. As the time extends, the crystal nucleus of Al2O3 grows into a single, thin, dense and continuous α-Al2O3 film. Hereafter, the interface of oxide/substrate is established and O2− penetrate through the α‑Al2O3 film and react with Al3+ at the interface. The formation of α-Al2O3 layer leads to the depletion of Al3+ at the subsurface. Therefore, the oxidation starts to be controlled by the inward diffusion of O2− to react with Al3+ at the oxide/metal interface, due to fact that the O2− diffuses faster than Al3+ throughout the Al2O3 layer [48]. The oxidation layer predominantly grows by the inward displacement of the oxide/substrate interface. This is also proved by the observed dominant growth of α-Al2O3 layer via columnar grains into the substrate, i.e., the inward growth of the oxide scale. Dominant inward growth of α-Al2O3 is referred for the alloys with various Al content at comparable conditions of exposure [48,50,52]. This is due to the excellent protective function of the single α-Al2O3 film the oxidation rate gradually decreases with the thickening of the film. The non‑parabolic growth law of grades A1 and A2 seems to be a consequence of several factors, such as: the interference of the inter diffusion described by the thermodynamics models reported in [51,53,54], of the effect of the inter-diffusion of Al and Y elements and the columnar growth of α-Al2O3 grains [48,50,52]. The presence of a relatively large amount of Y2O3 nanoprecipitates in the system allows a significant modification of the oxide layer, because the phase diagram of the Al2O3—Y2O3 binary system predicts the formation of three stoichiometric phases YAG, YAP (YAlO3) and YAM (Y4Al2O9) [55]. In our case having a Al2O3 rich system, the mixture of Al2O3 and YAG is formed as it is observed in Figure 7.
The oxide scale formation of grade A2 with Al content 2.0 wt.% follows similar oxidation mechanism as grade A1. Nevertheless, at the beginning of oxidation, the formation of a continuous α‑Al2O3 layer is slightly delayed owning to the lower Al content. Before the continuous α‑Al2O3 layer is created the Cr-Fe-rich oxides (Cr,Fe)2O3 are formed in the oxide scale in the gaps between the islands of α‑Al2O3. Those (Cr,Fe)2O3 oxides then remain in small amount in the top part of oxide scale of this grade.
The results of the surface oxidation of specimens of grade A3 indicate that the oxidation resistance is much lower, and the process is more complex to that of grades A1 and A2. When the Al content is in a low level of 0.3 wt.%, the outer oxide layer composes of complex Cr-Fe-rich oxides identified as (Cr,Fe)2O3 and (Fe,Cr)3O4. The Cr-Fe-rich oxides are formed prior to Al2O3 because of the both higher content of Cr and Fe with respect to Al and a higher growth rate of (Cr,Fe)2O3 compared with that of Al2O3. The Cr element plays the most important role in protecting the alloy and the diffusion of Cr3+ cations from inner to outer layers leads to the depletion of Cr in the inner layer. The porous outer (Cr,Fe)2O3 layer becomes compact with the increased oxidation time. The Cr in the initially formed (Cr,Fe)2O3 gradually changes into volatile CrO3 under a high oxygen partial pressure and flows over the oxide surface. Simultaneously, some internal Fe ions diffuse outwards creating (Fe,Cr)3O4. The oxide scale of grade A3 composed of (Cr,Fe)2O3 and (Fe,Cr)3O4 grows outwardly unlike for grades A1 and A2 with α‑Al2O3 oxide scale. This indicates that the matrix continues to maintain the supply of Cr and Fe to the oxide scale, resulting in the Cr and Fe depletion at the subsurface region and causing the local matrix enrichment of Al and Y. The oxygen anions easily penetrate through porous oxide scale composed of Cr-Fe-rich oxides and develop Al-Y-rich oxides in this region. The oxidization of Al and Y promotes the creation of Cr-Fe‑rich oxides in their surroundings, leading to the formation of clusters of oxides. These oxide clusters contribute to weakening of the stability composition of the matrix solid solution accelerating the diffusion of oxygen ions into the material. The higher partial pressure of oxygen in the subsurface matrix solid solution further promotes the internal oxidation of the alloy, resulting in the formation of individual Al-Y-rich oxides in the inner region of the oxide scale. The outer oxide scale is non‑compact after 16 h of exposure at 1200 °C, and shows a tendency to peel off during the cooling stage. The oxide scale spallation most probably is caused by the difference in the thermal expansion coefficient between the oxide scale and matrix of the alloy [56,57]. Next, the high Kirkendall porosity, modelled, e.g., in [53,58], together with the misfit stresses induced by volumetric changes between the oxide and metal matrix [57], may also contribute to the spallation phenomenon.
A comparison of oxidation resistance performance of three studied grades of the new-generation ODS alloy leads to the conclusion that Al content over 2 wt.% ensures an excellent resistance to high temperature oxidation. The long‑time high temperature oxidation protection is conditioned by the integrity of Al2O3 oxide scale layer preventing the oxygen diffusion into the material and its repetitive formation in case of oxide scale spallation. For ferritic steels, the formation of uniform Al2O3 oxide scale seems to be ensured for Cr and Al concentrations larger than 14 wt.% and 2 wt.%, respectively [30]. The results of other authors show that the uniform oxide scale of α‑Al2O3 is repeatedly formed for ferritic steels with 4.6 wt.% of Al [59]. The long‑term formation of the stable oxide layer of the A1 grade with 5.5 wt.% of Al is therefore ensured. Grade A2 with 2.0 wt.% of Al is expected to provide slower formation of a uniform Al2O3 oxide layer on the surface in case of spallation and thus a less durable oxidation resistance to that of grade A1.

4. Conclusions

The oxidation mechanisms and kinetics are investigated for three grades of the new-generation ODS alloys of chemical composition Fe-15Cr-xAl-4Y2O3 with different Al contents x = 0.3 wt.%, 2.0 wt.% and 5.5 wt.%. The results can be summarized as follows:
  • The new-generation ODS alloys are successfully prepared by hot consolidation of mechanically alloyed powders followed by annealing.
  • The oxidation tests using the limited number of test specimens are performed at 1200 °C on air for 1 h, 4 h, 16 h and 64 h. The oxidation kinetics obeys the non‑parabolic law.
  • In the case of sufficiently high Al content x = 2.0 wt.% and 5.5 wt.%, a compact corundum-based oxide layer of α‑Al2O3 is formed on the surface, which protects the alloys from internal oxidation very effectively.
  • In the case of a low Al content x = 0.3 wt.%, a mixture of Fe, Cr oxides forms a porous and non-compact layer on the specimen surface, which cannot protect the alloy from internal oxidation and degradation of mechanical properties.
  • As the Fe-15Cr-xAl-4Y2O3 new-generation ODS alloys contains a high amount of Y2O3, the corundum-based oxide layer of the grades with the high Al content x = 2.0 wt.% and 5.5 wt.% reacts with the Y2O3 and YAG dendrites grow in the layer.
  • The Al content exceeding 2 wt.% ensures an excellent oxidation resistance of the new-generation ODS alloys. Nevertheless, for long‑term oxidation resistance grade A1 with higher Al content 5.5 wt.% is expected to provide an improved performance.

Author Contributions

L.S. and J.S. proposed the concept of the work and designed the experiment; J.S. prepared the test material; L.S. conducted oxidation testing; P.R. performed and evaluated XRD analysis; V.H. and P.D. contributed by data collection and analysis; L.S. and J.S. wrote the manuscript, P.R., V.H. and P.D. contributed to discussion of results and formulation of conclusions. All authors have read and agreed to the published version of the manuscript.

Funding

This work has been supported by the project No. 17-01641S of the Czech Science Foundation (L.S., V.H., P.D., J.S.) and by the project CEITEC 2020 (LQ1601) supported by the Ministry of Education, Youth and Sports of the Czech Republic under the National Sustainability Programme II (P.R.).

Conflicts of Interest

The authors declare no conflict of interest.

References

  1. Murakumo, T.; Kobayashi, T.; Koizumi, Y.; Harada, H. Creep behaviour of Ni-base single-crystal superalloys with various γ′ volume fraction. Acta Mater. 2004, 52, 3737–3744. [Google Scholar] [CrossRef]
  2. Long, H.; Mao, S.; Liu, Y.; Zhang, Z.; Han, X. Microstructural and compositional design of Ni-based single crystalline superalloys—A review. J. Alloys Compd. 2018, 743, 203–220. [Google Scholar] [CrossRef]
  3. Yu, H.; Xu, W.; van der Zwaag, S. Microstructure and dislocation structure evolution during creep life of Ni-based single crystal superalloys. J. Mater. Sci. Technolog. 2020, 45, 207–214. [Google Scholar] [CrossRef]
  4. Wasilkowska, A.; Bartsch, M.; Messerschmidt, U.; Herzog, R.; Czyrska-Filemonowicz, A. Creep mechanisms of ferritic oxide dispersion strengthened alloys. J. Mater. Process. Technol. 2003, 133, 218–224. [Google Scholar] [CrossRef]
  5. Material Data Sheet, INCOLOY, Alloy MA 956, Special Metals Corporation, USA, 2004. Available online: http://specialmetals.ir/images/technical_info/Fer-base/Incoloy-alloy-MA956.pdf (accessed on 26 October 2020).
  6. Klueh, R.L.; Shingledecker, J.P.; Swindeman, R.W.; Hoelzer, D.T. Oxide dispersion-strengthened steels: A comparison of some commercial and experimental alloys. J. Nucl. Mater. 2005, 341, 103–114. [Google Scholar] [CrossRef]
  7. Yano, Y.; Sekio, Y.; Tanno, T.; Kato, S.; Inoue, T.; Oka, H.; Ohtsuka, S.; Furukawa, T.; Uwaba, T.; Kaito, T.; et al. Ultra-high temperature creep rupture and transient burst strength of ODS steel claddings. J. Nucl. Mater. 2019, 516, 347–353. [Google Scholar] [CrossRef]
  8. Pollock, T.M.; Argon, A.S. Directional coarsening in nickel-base single crystals with high volume fractions of coherent precipitates. Acta Metall. Mater. 1994, 42, 1859–1874. [Google Scholar] [CrossRef]
  9. Svoboda, J.; Lukas, P. Model of creep in 〈001〉-oriented superalloy single crystals. Acta Mater. 1998, 46, 3421–3431. [Google Scholar] [CrossRef]
  10. Svoboda, J.; Lukas, P. Creep deformation modelling of superalloy single crystals. Acta Mater. 2000, 48, 2519–2528. [Google Scholar] [CrossRef]
  11. Miller, M.K.; Hoelzer, D.T.; Kenik, E.A.; Russell, K.F. Stability of ferritic MA/ODS alloys at high temperatures. Intermetallics 2005, 13, 387–392. [Google Scholar] [CrossRef]
  12. Shen, J.; Yang, H.; Li, Y.; Kano, S.; Matsukawa, Y.; Satoh, Y.; Abe, H. Microstructural stability of an as-fabricated 12Cr-ODS steel under elevated-temperature annealing. J. Alloys Compd. 2017, 695, 1946–1955. [Google Scholar] [CrossRef]
  13. Oksiuta, Z.; Lewandowska, M.; Kurzydłowski, K.J. Mechanical properties and thermal stability of nanostructured ODS RAF steels. Mech. Mater. 2013, 67, 15–24. [Google Scholar] [CrossRef]
  14. Korb, G.; Rühle, M.; Martinz, H.-P. New Iron-Based ODS-Superalloys for High Demanding Applications. In Volume 5: Manufacturing Materials and Metallurgy; Ceramics; Structures and Dynamics; Controls, Diagnostics and Instrumentation, Turbo EXPO: Power for Land, Sea and Air, Orlando, FL, USA, 3‑6 June 1991; ASME: New York, NY, USA, 1991; 8p. [Google Scholar] [CrossRef] [Green Version]
  15. Kazimierzak, B.; Prignon, J.M.; Fromont, R.I. An ODS material with outstanding creep and oxidation resistance above 1100 °C. Mater. Des. 1992, 204, 67–70. [Google Scholar] [CrossRef]
  16. Byun, T.S.; Yoon, J.H.; Hoelzer, D.T.; Lee, Y.B.; Kang, S.H.; Maloy, S.A. Process development for 9Cr nanostructured ferritic alloy (NFA) with high fracture toughness. J. Nucl. Mater. 2014, 449, 290–299. [Google Scholar] [CrossRef]
  17. Ramar, A.; Oksiuta, Z.; Baluc, N.; Schäublin, R. Effect of mechanical alloying on the mechanical and microstructural properties of ODS EUROFER 97. Fusion Eng. Des. 2007, 82, 15–24. [Google Scholar] [CrossRef]
  18. Husák, R.; Hadraba, H.; Chlup, Z.; Heczko, M.; Kruml, T.; Puchý, V. ODS EUROFER Steel Strengthened by Y-(Ce, Hf, La, Sc, and Zr) Complex Oxides. Metals 2019, 9, 1148. [Google Scholar] [CrossRef] [Green Version]
  19. Rösler, J.; Arzt, E.A. A new model-based creep equation for dispersion strengthened materials. Acta Metall. Mater. 1990, 38, 671–683. [Google Scholar] [CrossRef] [Green Version]
  20. Fischer, F.D.; Svoboda, J.; Fratzl, P. A thermodynamic approach to grain growth and coarsening. Philos. Mag. 2003, 83, 1075–1093. [Google Scholar] [CrossRef]
  21. Bártková, D.; Šmíd, M.; Mašek, B.; Svoboda, J.; Šiška, F. Kinetic study of static recrystallization in an Fe–Al–O ultra-fine-grained nanocomposite. Phil. Mag. Lett. 2017, 97, 379–385. [Google Scholar] [CrossRef]
  22. Svoboda, J.; Horník, V.; Stratil, L.; Hadraba, H.; Mašek, B.; Khalaj, O.; Jirková, H. Microstructure Evolution in ODS Alloys with a High-Volume Fraction of Nano Oxides. Metals 2018, 8, 1079. [Google Scholar] [CrossRef] [Green Version]
  23. Liu, G.; Xu, Y.-L.; Yang, C.-X.; Xiao, X.-S.; Chen, X.-M.; Zhang, X.-M.; Meng, X.-J. Effects of Alloy Elements on Oxidation Resistance and Stress-Rupture Property of P92 Steel. Acta Metall. Sin. 2015, 28, 129–138. [Google Scholar] [CrossRef] [Green Version]
  24. Yuan, J.; Wu, X.; Wang, W.; Zhu, S.; Wang, F. Investigation on the Enhanced Oxidation of Ferritic/Martensitic Steel P92 in Pure Steam. Materials 2014, 7, 2772–2783. [Google Scholar] [CrossRef] [PubMed] [Green Version]
  25. Wei, L.; Zheng, J.; Chen, L.; Misra, R.D.K. High temperature oxidation behavior of ferritic stainless steel containing W and Ce. Corros. Sci. 2018, 142, 79–92. [Google Scholar] [CrossRef]
  26. McGuire, M.F. Stainless Steels for Design Engineers, 1st ed.; ASM International: Materials Park, OH, USA, 2008; p. 296. ISBN 978-0-87170-717-8. [Google Scholar]
  27. Huntz, A.M.; Reckmann, A.; Haut, C.; Sévérac, C.; Herbst, M.; Resende, F.C.T.; Sabioni, A.C.S. Oxidation of AISI 304 and 439 stainless steels. Mater. Sci. Eng. A 2007, 447, 266–276. [Google Scholar] [CrossRef]
  28. Fujikawa, H.; Newcomb, S.B. High temperature oxidation behaviour of high Al content ferritic and austenitic stainless steels with and without rare-earth element addition. Oxid. Met. 2012, 77, 85–92. [Google Scholar] [CrossRef]
  29. Xu, Y.; Zhang, X.; Fan, L.; Li, J.; Yu, X.; Xiao, X.; Jiang, L. Improved oxidation resistance of 15 wt.% Cr ferritic stainless steels containing 0.08–2.45 wt.% Al at 1000 °C in air. Corros. Sci. 2015, 100, 311–312. [Google Scholar] [CrossRef]
  30. Liu, T.; Wang, C.; Shen, H.; Chou, W.; Iwata, N.Y.; Kimura, A. The effects of Cr and Al concentrations on the oxidation behavior of oxide dispersion strengthened ferritic alloys. Corros. Sci. 2013, 76, 310–316. [Google Scholar] [CrossRef]
  31. Opila, E.J. Volatility of Common Protective Oxides in High Temperature Water Vapor: Current Understanding and Unanswered Questions. Mater. Sci. Form. 2004, 461, 765–774. [Google Scholar] [CrossRef] [Green Version]
  32. Yamauchi, A.; Kurokawa, K.; Takahashi, H. Evaporation of Cr2O3 in Atmospheres containing H2O. Oxid. Met. 2003, 59, 517–527. [Google Scholar] [CrossRef] [Green Version]
  33. Saunders, S.R.J.; Monteiro, M.; Rizzo, F. The oxidation behaviour of metals and alloys at high temperatures in atmospheres containing water vapour: A review. Prog. Mater. Sci. 2008, 53, 775–837. [Google Scholar] [CrossRef]
  34. Young, D.J.; Pint, B.A. Chromium Volatilization Rates from Cr2O3 Scales into Flowing Gases Containing Water Vapor. Oxid. Met. 2006, 66, 137–153. [Google Scholar] [CrossRef]
  35. Berthod, P. Kinetics of High Temperature Oxidation and Chromia Volatilization for a Binary Ni–Cr Alloy. Oxid. Met. 2005, 64, 235–252. [Google Scholar] [CrossRef] [Green Version]
  36. Hojná, A.; Michalička, J.; Hadraba, H.; Di Gabriele, F.; Duchoň, J.; Rozumová, L.; Husák, R. Fracture Resistance of 14Cr ODS Steel Exposed to a High Temperature Gas. Metals 2017, 7, 560. [Google Scholar] [CrossRef] [Green Version]
  37. Gu, C.; Liu, R.; Wang, C.; Sun, Y.; Zhang, S. Effect of Aluminum on Microstructure and High-Temperature Oxidation Resistance of Austenitic Heat-Resistant Steel. Metals 2020, 10, 176. [Google Scholar] [CrossRef] [Green Version]
  38. Klam, H.-J. Temperature and oxidation resistance of the ODS materials MA 956 and PM 2000. J. Phys. IV 1993, 3, C7-731–C7-734. [Google Scholar] [CrossRef]
  39. Swadźba, R.; Swadźba, L.; Wiedermann, J.; Hetmańczyk, M.; Witala, B. Characterization of Alumina Scales Grown on a 2nd Generation Single Crystal Ni Superalloy During Isothermal Oxidation at 1050, 1100 and 1150 °C. Oxid. Met. 2014, 82, 195–208. [Google Scholar] [CrossRef]
  40. Rodríguez-Carvajal, J. Recent advances in magnetic structure determination by neutron powder diffraction. Physica B 1993, 192, 55–69. [Google Scholar] [CrossRef]
  41. Rodríguez-Carvajal, J. Recent Developments of the Program Fullprof. Commun. Powder Diff. (IUCr) 2001, 26, 12–19. Available online: https://www.iucr.org/__data/assets/pdf_file/0019/21628/cpd26.pdf (accessed on 26 October 2020).
  42. Klimiankou, M.; Lindau, R.; Möslang, A.; Schröder, J. TEM study of PM 2000 steel. Powder Metall. 2005, 48, 277–287. [Google Scholar] [CrossRef]
  43. Czyrska-Filemonowicz, A.; Szot, K.; Wasilkowska, A.; Gil, A.; Quadakkers, W.J. Microscopy (AFM, TEM, SEM) studies of oxide scale formation on FeCrAl based ODS alloys. Solid State Ion. 1999, 117, 13–20. [Google Scholar] [CrossRef]
  44. Král, P.; Dvořák, J.; Sklenička, V.; Masuda, T.; Horita, Z.; Kuchařová, K.; Kvapilová, M.; Svobodová, M. The Effect of Ultrafine-Grained Microstructure on Creep Behaviour of 9% Cr Steel. Materials 2018, 11, 787. [Google Scholar] [CrossRef] [Green Version]
  45. Dymáček, P.; Svoboda, J.; Jirková, H.; Stratil, L.; Horník, V. Microstructure evolution and creep strength of new-generation oxide dispersion strengthened alloys with high volume fraction of nano-oxides. Proc. Struc. Integ. 2019, 17, 427–433. [Google Scholar] [CrossRef]
  46. Birks, N.; Meier, G.H.; Pettit, F.S. Introduction to the High Temperature Oxidation of Metals, 2nd ed.; Cambridge University Press: Cambridge, UK, 2006; p. 352. ISBN 9780521480420. [Google Scholar]
  47. Pérez, P. Influence of the alloy grain size on the oxidation behaviour of PM2000 alloy. Corros. Sci. 2002, 44, 1793–1808. [Google Scholar] [CrossRef]
  48. Montealegre, M.A.; Strehl, G.; González-Carrasco, J.L.; Borchardt, G. Oxidation behaviour of novel ODS FeAlCr intermetallic alloys. Intermetallics 2005, 13, 896–906. [Google Scholar] [CrossRef]
  49. Pei, H.; Wen, Z.; Zhang, Y.; Yue, Z. Oxidation behavior and mechanism of a Ni-based single crystal superalloy with single α-Al2O3 film at 1000 °C. Appl. Surf. Sci. 2017, 411, 124–135. [Google Scholar] [CrossRef]
  50. Huang, T.; Lü, J.; Song, P.; Khan, A.; Chen, R.; Yi, J. Effect of Pt doping on oxide scale formation on yttria-dispersion FeCrAl alloy at 1200 °C. Corros. Sci. 2020, 168, 108580. [Google Scholar] [CrossRef]
  51. Robino, C.V. Representation of mixed reactive gases on free energy (Ellingham-Richardson) diagrams. Metall. Mater. Trans. B 1996, 27, 65–69. [Google Scholar] [CrossRef]
  52. Tolpygo, V.K. The Morphology of Thermally Grown α-Al2O3 Scales on Fe-Cr-Al Alloys. Oxid. Met. 1999, 51, 449–477. [Google Scholar] [CrossRef]
  53. Svoboda, J.; Fischer, F.D.; Vollath, D. Modeling of Formation of Binary-Phase Hollow Nanospheres from Metallic Solid Nanospheres. Acta Mater. 2009, 57, 1912–1919. [Google Scholar] [CrossRef]
  54. Svoboda, J.; Gamsjäger, E.; Fischer, F.D.; Kozeschnik, E. Modeling of Kinetics of Diffusive Phase Transformation in Binary Systems with Multiple Stoichiometric Phases. J. Phase Equilib. Diff. 2006, 27, 622–628. [Google Scholar] [CrossRef]
  55. Levin, E.M.; McMurdie, H.F.; Reser, M.K. Phase Diagrams for Ceramists: 1975 Supplement, 1st ed.; American Ceramic Society: Columbus, OH, USA, 1975; p. 513. Available online: https://www.osti.gov/biblio/7351343-phase-diagrams-ceramists-supplement (accessed on 26 October 2020).
  56. Hayashi, A.; Hiraide, N.; Inoue, Y. Spallation Behaviour of Oxide Scale on Stainless steels. Oxid. Met. 2016, 85, 87–101. [Google Scholar] [CrossRef]
  57. Huntz, A.M. Stresses in NiO, Cr2O3 and Al2O3 oxide scales. Mater. Sci. Eng. A 1995, 201, 211–228. [Google Scholar] [CrossRef]
  58. Svoboda, J.; Fischer, F.D. Incorporation of Vacancy Generation/Annihilation into Reactive Diffusion Concept—Prediction of Kirkendall Porosity. Comp. Mater. Sci. 2017, 127, 136–140. [Google Scholar] [CrossRef]
  59. Guttmann, V.; Hukelmann, F.; Griffin, D.; Daadbin, A.; Datta, S. Studies of the influence of surface pre-treatment on the integrity of alumina scales on MA 956. Surf. Coat. Technol. 2003, 166, 72–83. [Google Scholar] [CrossRef]
Figure 1. The microstructures of the grades with different Al content in the initial state after heat treatment 16 h/ 1200 °C: (a) A1; (b) A2; (c) A3 with 5.5 wt.%, 2.0 wt.%, 0.3 wt.% of Al, respectively.
Metals 10 01478 g001
Figure 2. X‑ray diffraction (XRD) spectra and phase analysis of studied grades of the new-generation ODS alloy.
Metals 10 01478 g002
Figure 3. The weight gain (a) and the thickness of the oxidized layer (b) for grades A1, A2 and A3 with Al contents 5.5 wt.%, 2.0 wt.% and 0.3 wt.%, respectively.
Metals 10 01478 g003
Figure 4. The isothermal kinetics of the weight gain (a) and of the thickness of the oxidized layer (b) for grades A1, A2 and A3 with Al contents 5.5 wt.%, 2.0 wt.% and 0.3 wt.%, respectively.
Metals 10 01478 g004
Figure 5. The surface oxides on specimens of grades (a) A1; (b) A2 and (c) A3 after the exposure for 64 h/1200 °C.
Metals 10 01478 g005
Figure 6. X‑ray diffraction (XRD) spectra and phase analysis of oxide layers on surfaces of grades A1, A2 and A3 after the exposure for 64 h/1200 °C.
Metals 10 01478 g006
Figure 7. Scanning electron microscopy (SEM) analysis of the cross-sections of the oxide scales of grades (a) A1; (b) A2; (c) A3 after the exposure for 64 h/1200 °C completed with the energy dispersive spectrometer (EDS) line analysis.
Metals 10 01478 g007
Table 1. The nominal chemical composition of the grades of the new-generation ODS alloy with different Al content (wt.%).
GradeFeAlCrY
A1balance5.514.42.8
A2balance2.014.82.9
A3balance0.315.03.0
Table 2. The results of analyses of the weight gain and comparison with the literature data.
Grade/AlloyT
(°C)
nkp
(g2·cm−4·s−1)
Oxide Layer
A1 (5.5 wt.% Al) 2.826.19 × 10−12α-Al2O3
A2 (2.0 wt.% Al)12002.947.49 × 10−12α-Al2O3
A3 (0.3 wt.% Al) 2.514.30 × 10−11(Cr,Fe)2O3, (Cr,Fe)3O4
Fe-19Cr-5.4Al-0.5Y2O3 (PM 2000) [47]12002.82 a5.79 × 10−12 bα-Al2O3
Ni-30Cr [35]12002.80 a6.70 × 10−11Cr2O3
15Cr-0.08Al [29]10001.72 a1.73 × 10−13Cr2O3
15Cr-2.45Al [29]10002.57 a4.48 × 10−14Al2O3
19Cr-2Mo-0.3Mn-0.5Si [25]11002.70 a5.51 × 10−11Cr2O3, (Mn,Cr)2O4
Fe-24Al-1Y2O3 (Fe40Al-Grade3) [48]11002.15 a6.88 × 10−13 bα-Al2O3
Fe-20Al-12Cr-1Y2O3 (ALUSI 1) [48]11001.94 a1.69 × 10−13 bα-Al2O3
Ni-9Co-8W-2Mo-6Al-7Ta-4Cr-2Re (DD6) [49]10005.68 a2.24 × 10−13α-Al2O3
a, b Estimated from the literature data using the Equations (1) and (2) respectively.
Table 3. The results of analyses of the oxide scales.
Grade/AlloyT
(°C)
nkp
(μm2·s−1)
Oxide Layer
A1 (5.5 wt.% Al) 2.653.64 × 10−4α-Al2O3
A2 (2.0 wt.% Al)12002.884.07 × 10−4α-Al2O3
A3 (0.3 wt.% Al) 2.111.45 × 10−1(Cr,Fe)2O3, (Cr,Fe)3O4
Publisher’s Note: MDPI stays neutral with regard to jurisdictional claims in published maps and institutional affiliations.

