Abstract
The cold metal transfer plus pulse (CMT + P) process was performed to produce a 316L vertical wall through the single-channel multi-layer deposition method. The microstructure of different regions on deposited samples was observed by an optical microscope and a scanning electron microscope (SEM). The phase composition of the as-deposited wall was checked by X-ray diffraction, and the element distribution in the structure was analyzed by an energy-dispersive spectrometer. The tensile strength and microhardness of samples were tested, and the fracture morphology was observed by an SEM. Finally, the electrochemical corrosion characteristics of the as-deposited wall in different regions along the building direction were tested. Results from the experiments indicated that the microstructure of metallography showed a layer band. The metallurgical bounding between layers was carried out by dendrite remelting and epitaxial growth. Along the building direction, the alloy of different regions solidified in an ferritic-austenitic (FA) manner, and due to having undergone different heat histories, their SEM microstructures were significantly distinct. The ultimate tensile strength (UTS) and yield strength (YS) of the vertical specimens were higher than those of the horizontal specimens, displaying obvious anisotropy. Due to a large amount of precipitation of precipitated phases in terms of intermetallic compounds in the middle and upper regions, the tensile strength and microhardness along the building direction showed a trend of first decreasing and then increasing. In the bottom region, a small amount of ferrite precipitated in the austenite matrix, while in the middle of the as-deposited wall, the amount of ferrite gradually increased and was distributed in the austenite matrix as a network. However, due to the heat accumulation effect, the ferrite dissolved into austenite in large quantities and the austenite showed an obvious increase in size in the top region. A stable passivation film was caused by a relatively low dislocation density and grain boundary number, and the middle region of the arc as-deposited wall had the best corrosion resistance. The large consumption of chromium (Cr) atoms and material stripping in the top region resulted in the integrity of the passivation film in this region being the weakest, resulting in the lowest corrosion resistance.
1. Introduction
Traditional machine part manufacturing methods mainly rely on casting and forging [1]. However, the manufacture of molds required for casting and forging requires a great deal of machining cost and time, and this kind of production model cannot adapt to the growing demand for personalized part customization and increasingly frequent product updates. At the same time, this traditional manufacturing method cannot be used for some parts with extremely complex internal cavities and those requiring integrated forming [2]. Additive manufacturing technology [3,4,5,6] is drawing more and more attention in the industry because of its good adaptability to complex part production. However, most of the current wire arc additive manufacturing (WAAM) research is generally based on the traditional pulse current as the arc source, and the range of research mainly focuses on studying the influence of various process parameters such as current, voltage, and welding speed on molding appearance and mechanical properties [7,8,9].
Another popular manufacturing process is powder bed fusion, where the molten alloy is formed by melting powder form in a capillary flow in micropores. The microstructure is generally a fine columnar crystal after directional solidification. Due to the chilling effect, a fine subgrain structure is often formed in the columnar crystal, but the partial melting of the powder and the capillary effect often lead to the formation of micropores in the microstructure. To a certain extent, this has a negative impact on the mechanical properties of the workpiece. In the traditional casting process, liquid metal solidifies in the closed mold, and the microstructure usually forms fine equiaxed grains, columnar grains, and coarse equiaxed grains throughout the workpiece. At the same time, the microstructure of castings usually contains porosity and inclusions, which may negatively affect the mechanical properties of the workpiece.
However, the microstructure of the WAAM part has its own unique characteristics: The droplets are fully formed at the tip of the welding wire and are directly transited into the molten pool. Then, the alloy liquid in the molten pool can fully directionally solidify and develop into dendrites along the same growth orientation, forming a dense microstructure. The dendrite size gradually increases from the bottom to the top in the workpiece. Due to the excellent compactness of the microstructure in WAAM parts, the mechanical properties of workpieces manufactured by this process are more controllable and predictable than those formed by the other two processes mentioned.
For 316L AM, whether by WAAM or the selective laser sintering process, most current research focuses on the differences in microstructure and mechanical properties under different process parameters [10,11,12]. The disadvantage of the above research is that the experimental results of different workpieces belong to different workpieces themselves. The test results belonging to different workpieces do not correlate, and cannot reveal the changes and laws of the microstructure and properties in different regions of an as-deposited workpiece. At the same time, most of the performance test results are considered as caused by a change in grain size caused by heat accumulation, which is insufficient for multi-component alloy steel.
In this paper, the cold metal transfer plus pulse (CMT + P) [13] process was adopted to carry out the 316L stainless steel WAAM experiment. Compared to the thin deposited wall study using the CMT + P process reported in reference [14], we used more abundant material characterization methods to conduct a comprehensive analysis on the as-deposited wall. These methods included microstructure evolution, mechanical properties, element distribution, corrosion resistance, and so on, which provided a reference for the application of this technology in WAAM.
In the experiment, it was found that the microstructure, phase distribution, mechanical properties, and corrosion properties of different deposition layers varied noticeably in different areas of the building direction due to the different thermal histories of the deposition layers. With continuous heating, a large number of Fe-Cr-Ni precipitates were found in the deposited part, which could greatly improve the tensile strength and microhardness of the workpiece, but significantly reduce the corrosion resistance of the workpiece. At the same time, a large number of spherical particles of the second phase were observed at the fracture surface of the tensile specimens, and the element content of these particles was consistent with the precipitation phase mentioned above. Therefore, it was inferred that these particles played an important role in the load-bearing of the stress in the tensile process of the specimen, which could promote the improvement in the tensile strength. Besides, along the deposition direction, the corrosion resistance of each area of the workpiece decreases, the corrosion pits extend deeper, and the corrosion of adjacent areas accelerates.
2. Materials and Methods
First, 316L stainless-steel wire with a diameter of 1.2 mm was selected in this experiment, and its chemical properties are shown in Table 1. A 316L stainless-steel plate with a length of 250 mm, a width of 100 mm, and a thickness of 5 mm was selected as the substrate for deposition. Before the experiment, the surface of the substate was polished and cleaned with acetone (TongYuan Chemical Industry Ltd., Guangzhou, China). The additive manufacturing system consisted of a TransPuls Synergic 5000 CMT R welder (Fronius, Wels, Austria), a VR7000 CMT wire feeder manufactured by the Fronius company of Austria (Fronius, Wels, Austria), a KUKA six-axis robot and robot control cabinet from KUKA Robotics Corporation (KUKA Robotics Corporation, Shelby Charter Twp, MI, USA), and a workbench, as shown in Figure 1.

Table 1.
Chemical properties of ER316L wire (mass fraction/%).
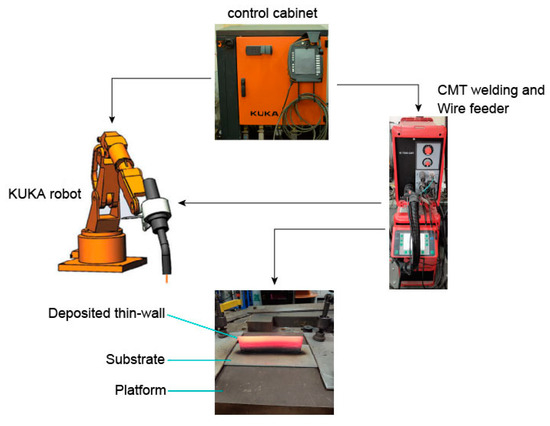
Figure 1.
Cold metal transfer plus pulse (CMT + P) process additive manufacturing system.
The welding machine was equipped with built-in unitary adjustment, which was activated when the welding parameters were altered. Therefore, by only adjusting the current value, other welding process parameters were modified automatically to match the selected current value and ensure a stable deposition process.
The deposition process parameters of this experiment are shown in Table 2. During the reciprocating single-channel multilayer continuous deposition process, the scanning speed of the layers was 0.01 mm/s and the single-channel scanning length was 160 mm. However, the scanning speed for the first layer was 0.005 mm/s, to ensure full connection between the first layer and the substrate. After each layer was deposited, the torch was lifted by 2 mm and the next layer was scanned, except for after the completion of the first deposition layer, where the torch lifting height was 2.3 mm.
Table 2.
Deposition process parameters.
After deposition, both ends of the as-deposited wall were cut off by linear cutting, and the intermediate body was used as the material performance characterization area. On the left side of the as-deposited wall, horizontal tensile specimens were successively cut from the bottom up along the building direction and named as H1, H2, and H3, respectively. The vertical tensile specimens were successively cut from the right side and named as V3, V2, and V1. Due to the existence of standard deviation, three tensile samples were cut from each sampling location and marked as No2, No1, and No3 (such as H1-2, H1-1, and H1-3, respectively). Sampling sizes and test methods were carried out according to the ASTM E384 standard. Cross-sections with thicknesses of 10 mm were cut out in the middle of the as-deposited wall for observation of the microstructure and the microhardness test. The sampling location and the size of the tensile specimens are shown in Figure 2. All tensile specimens were tested at room temperature at a tensile rate of 2 mm/min.
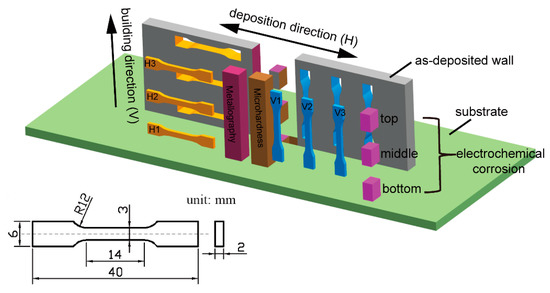
Figure 2.
Schematic diagram of the sampling location and size of the tensile sample.
Grease and dirt on the surface of the metallographic samples were eliminated with acetone, then ground coarsely using metallographic sandpaper with grit sizes of #160, #360, #600, and #800. Fine grinding was performed with #1500, #2000, #3000 sandpaper, and polishing was then carried out using a diamond polishing agent with a particle size of 2.5 μm. After that, aqua regia (HCL:HNO3 = 3:1) (Dongzheng Chemical Glass Instrument Ltd., Guangzhou, China) was used to corrode the metallurgical sample for 20 s, which was then rinsed and dried with water and alcohol (Damao Chemical Reagent Factory, Tianjin, China). An optical metallographic microscope (Leica Microsystems, Wetzlar, Germany) and a nova Nano SEM 430 scanning electron microscope (SEM) (FEI, Eindhoven, The Netherlands) were used to observe the microstructure, and an energy spectrometer (FEI, Eindhoven, The Netherlands) attached to the SEM was used to look at the element distribution. An X-ray diffractometer (XRD) (Malvern panalytical, Alemlo, The Netherlands) was used to measure the phase composition of the as-deposited wall, with a scan angle ranging from 20° to 95°.
An HMV-2T micro Vickers hardness tester (SHIMADZU Ltd., Kyoto, Japan) was used to test all the points along the building direction, on a straight line running through the middle of the cross-section. Adhering to the ASTM E8-16 standard, the test load was 500 g, the load time was 15 s for each test point, and the spacing between test points was 0.5 mm.
An electrolytic cell (Zhonghuan Analytical Instrument Ltd., Taizhou, China) equipped with three electrodes was used to study the electrochemical corrosion behavior of the as-deposited wall. Three specimens with length, width, and height of 1 mm were cut from the as-deposited wall. Acetone was used to clean the oil stains from the specimen surface in an ultrasonic cleaning machine, and #3000 metallographic sandpaper was used to polish their surface, as the working electrode. All electrochemical tests were performed in the 3.5 wt% NaCl (Dingshengxin Chemical Ltd., Tianjin, China) electrolyte at room temperature. Platinum and a saturated calomel electrode were used as the counter electrode and reference electrode, respectively. The test of each specimen was repeated three times to ensure experimental reproducibility.
Potentiodynamic polarization curves were obtained starting from the cathodic branch to the anodic branch, from −600 to +800 mV, at a scan rate of 0.5 mV·s−1. Before the test began, the working system was energized for two hours to stabilize the open-circuit potential (OCP). Finally, under 5 mV AC potential perturbation, the electrochemical impedance spectra were obtained with a 100 kHz to 10 MHz frequency range.
3. Results and Analysis
3.1. Macro Morphology
The overall macroscopic appearance of the as-deposited wall is shown in Figure 3a. From Figure 3b, it can be seen that the weld bead was clear and straight, and no metal flow or collapse was observed on the surface of the as-deposited wall, which shows good adaptability of the CMT + P process for 316L stainless-steel WAAM. The average height was close to 50 mm, which was different from that reported in reference [15]. The height of the reference sample after the deposition of 50 layers using 316L wire with a diameter of 0.8 mm by laser cladding was about 60 mm. Therefore, the deposition efficiency in this experiment was slightly higher than that in the reference mentioned above. From the cross-sectional observation shown in Figure 3c, the bottom of the as-deposited wall was narrower in width, caused by the rapid cooling effect of the substrate on the first few layers. Due to continuous arc heating, the increasing heat accumulation effect reduced the solidification rate of the molten pool during the deposition process. Thus, the liquid had more time to spread on both sides, resulting in a gradual increase in the width of the cross-section along the building direction.
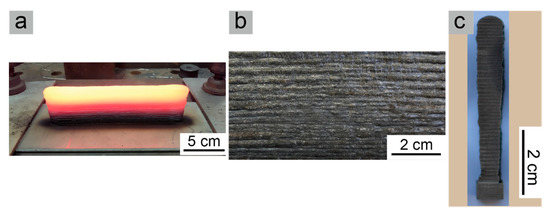
Figure 3.
Macro morphology of the as-deposited wall: (a) Overall appearance of the as-deposited wall, (b) surface bead of the as-deposited wall, and (c) middle cross-section.
3.2. Microstructure Analysis
Overall, the as-deposited wall had a typical layer-belt microstructure, as Figure 4a illustrates. This is because each addition of liquid metal was deposited and solidified on top of the preceding deposited layer. The height of each deposited layer was close to the lifting height of the welding gun after each scan. The heat from transition droplets, as well as the arc heat, re-melted a portion of a deposited layer and promoted the formation of a melt pool on top of the deposited layer. The deposited layer served as the basis for nucleation, resulting in heterogeneous nucleation on top of the deposited layer. Meanwhile, under the action of arc force, the transient droplet impacted the molten pool at an extremely high speed to form a circular stirring flow field, which broke up the growing dendrites to form more and finer dendrites. After the arc moved away from the region, the stirring flow field gradually weakened and tiny dendrites grew vertically upward along the temperature gradient. A typical dendrite growth morphology in terms of epitaxial growth is indicated in Figure 4b, marked with a red ellipse. Subsequently, the dendrites gradually grew until they reached the top of the molten pool. Following the steps described above, the same continuous arc scanning process was followed until the deposition process was completed.
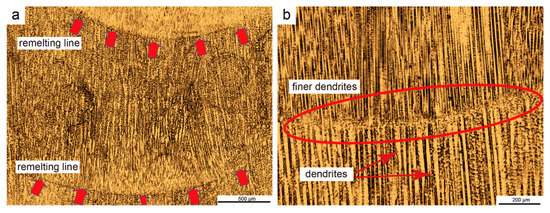
Figure 4.
Microstructure of CMT + P as-deposited wall: (a) Periodic layer belt microstructure, and (b) epitaxial growth morphology of grains in the remelting line.
Figure 5 displays the result of EDS mapping-scan analysis on the locally amplified region. In the figure, it can be observed that chromium (Cr) and molybdenum (Mo) were mostly found in the ferrite, while nickel (Ni) was mainly concentrated in the austenite matrix. Thus, Cr and Mo are elements that promote the formation of ferrite, while Ni is an austenitic formation element.
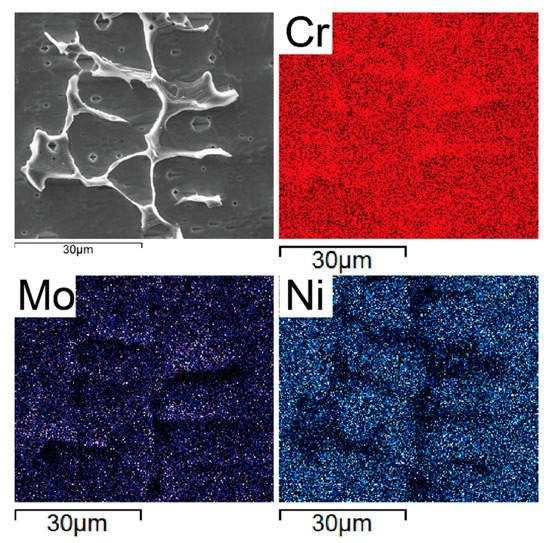
Figure 5.
Element distribution of the ferrite and austenite matrix.
Figure 6 shows the SEM images in the bottom, middle, upper, and top regions of the as-deposited wall. The microstructure was primarily composed of austenite matrix and the ferrite, where the ferrite was dispersed on the matrix in the form of a skeleton and network [16].
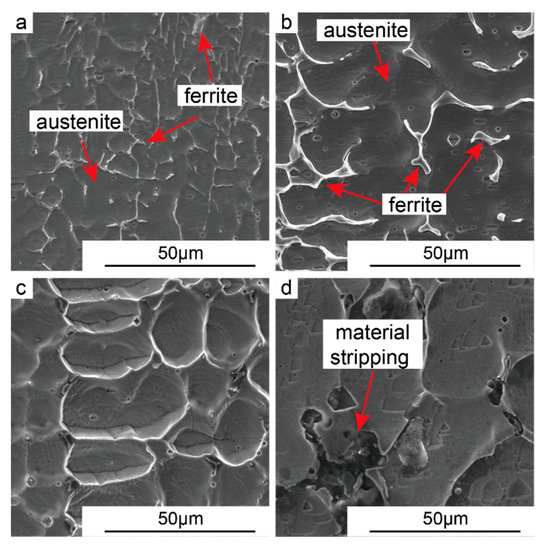
Figure 6.
SEM microstructure of as-deposited wall: (a) Bottom, (b) middle, (c) upper, and (d) top region.
In the early stage of solidification, ferrite first precipitated from the liquid phase. Thereafter, Cr and Mo atoms were enriched on the side of the ferrite, while with the growth of ferrite, Ni atoms were continuously discharged from the ferrite to the liquid phase, thus creating conditions for the formation of austenite [17].
Due to the heat accumulation effect caused by continuous deposition, combined with the cooling effect caused by the shielding gas, the cooling speed of the alloy liquid was sub-rapid, At this cooling speed, the solidification mode of the alloy was the ferritic-austenitic (FA) mode. In the early stage of solidification, high-temperature δ-ferrite first precipitated in the liquid phase. Subsequently, some of the ferrite and surrounding liquid phase underwent a peritectic transformation to form austenite, and most of the remaining liquid phase was then directly solidified and transformed to austenite. Meanwhile, the continuous heat accumulation effect caused some of the primary ferrite to transform into austenite, and the residual ferrites were then distributed in the austenitic matrix in a reticular and skeletal manner, as shown in Figure 6b. In the upper layers of the as-deposited wall, austenite size increased continuously, as can be seen in Figure 6c. However, due to the rapid solidification effect of the substrate in the bottom region, the solidification rate of the alloy was extremely fast and only a small amount of ferrite precipitated from the liquid phase. The remainder of the liquid phase was directly converted to austenite, as Figure 6a shows.
In the top region, the austenite dendrites were etched deeper than in the bottom and middle regions by corrodent. In addition, the ferrites distributed at the austenitic dendrite boundaries became thicker, and it appears to be much higher than the austenite grains. The fact can be mainly attributed to the different degrees of diffusion of solute atoms in different regions. At the bottom of the as-deposited wall, the chilling effect of the substrate promoted the rapid solidification of the droplet and hindered the migration of heavy metal elements such as chromium. This caused the whole structure to have relatively consistent corrosion resistance, and a relatively flat surface was observed.
Along the building direction of the as-deposited wall, dendrite size and dendrite arm spacing increased significantly, which was mainly due to the promotion of dendrite growth due to the increase in heat accumulation, as Figure 7 illustrates.
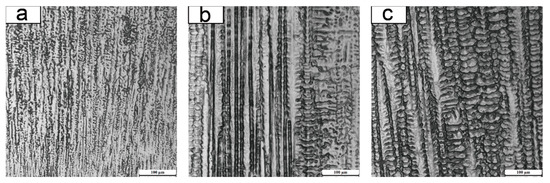
Figure 7.
Microstructural photos of each region along the building direction of the as-deposited wall: (a) Bottom, (b) middle, and (c) top.
At the top of the as-deposited wall, the higher heat promoted the diffusion and migration of heavy metal atoms, such as Cr atoms and corrosion-resistant elements [18], toward the austenitic grain boundaries, which resulted in severe corrosion of the austenite grain center, as shown in Figure 6c. When the deposition process was completed, due to the sudden disappearance of gas protection, the material on the top layer of the as-deposited wall underwent severe oxidation at high temperature, and the material was stripped and even shed off, as is seen in Figure 6d. Meanwhile, X-ray diffraction data also showed that the matrix of the as-deposited wall was mainly composed of ferrite and austenite, as Figure 8 shows.
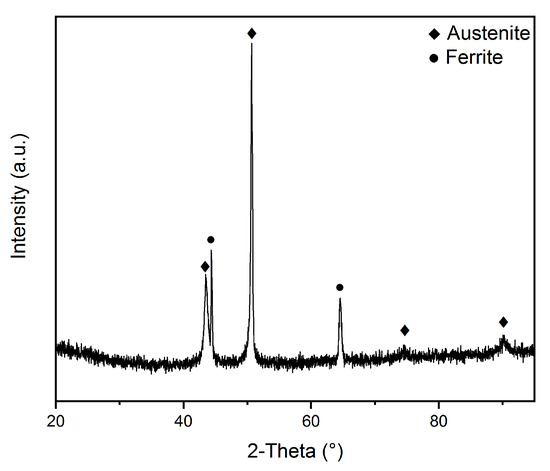
Figure 8.
X-ray diffraction analysis result of as-deposited sample.
In addition, a certain amount of granular materials was observed in some of the microstructure, as Figure 9a,c show. EDS analysis results revealed Cr (20.20%) and Ni (9.53%) enrichment within the microstructure. This is mainly due to alloy nonequilibrium solidification in the deposition pool, which resulted in a very high supersaturation of alloying elements in the austenite phase (i.e., heavy metal elements such as Cr and Ni were dissolved in large quantities in the austenitic matrix) [19]. However, sustained heat accumulation resulted in supersaturated alloying elements precipitating from the dendrites in the form of intermetallic compounds. Due to the consistent temperature gradient over a certain region, combined with the unique rapid solidification of the arc deposition process, a great amount of the sub-grain structures that formed in the primary austenite grains had basically the same crystal plane orientation. Meanwhile, due to the precipitation phases having a coherent relationship with the parent phase, thus precipitating out from the parent phases along a specific habitual surface, the growth angle of all precipitated phases was consistent, that is, pointing to the upper right [20].
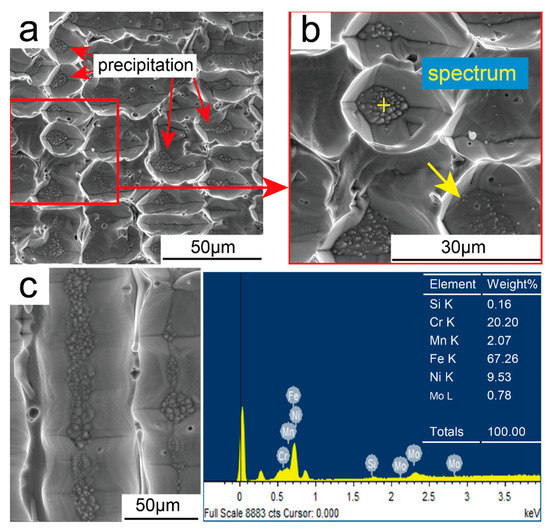
Figure 9.
SEM micrograph of the as-deposited wall: (a) Precipitated phase in the middle region, (b) enlarged view of Figure 9a, and (c) precipitated phase along the columnar grain.
However, as a result of large amounts of alloying elements, including Cr, precipitating from the grains, the corrosion resistance of material was significantly reduced. This resulted in the austenite grain being etched lower by corrosive agents, as shown in the figure. Conversely, because of the enrichment of the Cr element in ferrite, the austenite dendrite boundaries were not etched at all.
3.3. Mechanical Properties
Figure 10 displays the microhardness distribution on the cross-section of the as-deposited wall, with the fitted curve of the data points showing that the values generally change along an inward concave parabola, and showing a trend of first decreasing and then rising. Meanwhile, the inflection point of the curve was near the middle of the as-deposited wall, with the findings being contrary to the recognized relationship between the grain size and the hardness change (i.e., the larger the grain size, the lower the hardness value). The result was mainly attributed to the increasing precipitates in the middle region. Besides, due to the sudden disappearance of the arc heat source after deposition, the airflow around the top of the wall promoted the rapid solidification of the alloy, where only a small amount of ferrite precipitated. The maximum value of hardness measured in this experiment was 174.62 HV, which was higher than the value of 167 HV for the 316L workpiece prepared by the traditional casting process reported in the literature [21]. This shows that the 316L workpiece prepared by the CMT + P continuous deposition process can meet the requirements of industrial applications.
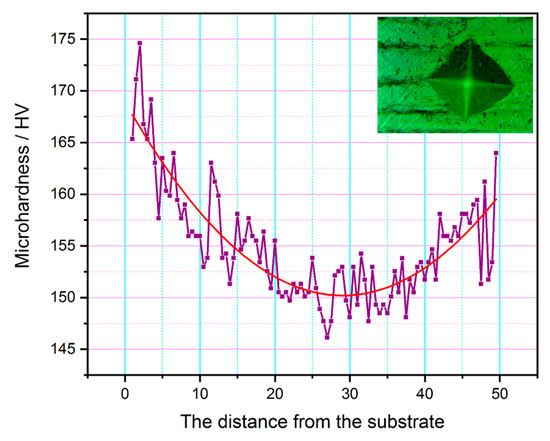
Figure 10.
Microhardness distribution on the whole cross-section of the as-deposited wall along the building direction.
Figure 11a shows the stress–strain curves of all the horizontal (H) and vertical (V) tensile specimens numbered 1. The ultimate tensile strengths of the horizontal and vertical specimens were named UTS-H and UTS-V, respectively. In the same way, YS-H and YS-V represented the yield strengths. Overall, the stress–strain curves of the three vertical directions were all higher than their horizontal counterparts. This phenomenon demonstrates the existence of obvious anisotropy between H and V directions in WAAM 316L.
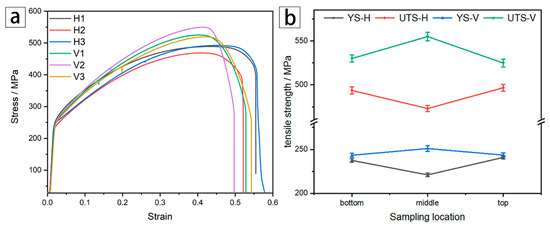
Figure 11.
Tensile test results of each sample: (a) Stress–strain curves of horizontal and vertical tensile specimens, and (b) variation in the tensile strength of horizontal and vertical tensile specimens.
The UTS of the three horizontal tensile specimens (H1–H3) along the building direction are 493.59, 473, and 496.70 MPa, respectively, which displays a trend of first decreasing and then rising. The average value of the longitudinal tensile strength was 531.51 MPa, which was slightly higher than the 528 MPa for SLM 316L reported in reference [22] and also higher than that of the wrought annealed state of 480 MPa [23]. Although the microstructure of the SLM 316L workpiece could reach a very small level, which is beneficial to the improvement of mechanical properties, the porosity in the SLM workpiece would have an adverse effect on the strength of the workpiece. The WAAM process can be performed to produce a very dense workpiece, which makes it preferable to the SLM process. The UTS and YS of specimen H1 exhibit good values, which is mainly due to the improvement in mechanical properties by tiny dendrites, while processive heat accumulation at the middle region led to the growth and coarsening of dendrites, thus decreasing the amount of dislocations and grain boundaries, which deteriorate the mechanical properties. By contrast, the pinning and strengthening effect on grain boundaries brought from the precipitates formed at the top of the as-deposited wall elevated the ultimate strength value again [24], even being higher than that of the tensile sample at the bottom.
The variation in the tensile strength of the horizontal (UTS-H and YS-H) and vertical (UTS-V and YS-V) tensile specimens is shown in Figure 11b. The UTS-V and YS-V values increased first and then decreased. This fact can be attributed to the use of a continuous deposition process, so the arc heating time at both ends of the as-deposited wall was actually the longest. Therefore, the tensile strength values, represented by YS-V and UTS-V, of the specimen from this region were relatively low. However, as the heat dissipation condition in the middle of the as-deposited wall was the worst, the lowest YS and UTS values of the vertical tensile specimens appeared in this region.
The phenomenon of generating anisotropy in WAAM parts can be attributed to the special microstructure in the as-deposited part: The grains in the as-deposited part generally grew vertically upward along the building direction (i.e., the direction of maximum temperature gradient) [25]. As Figure 12 shows, when uniaxial tension acted on the horizontal orientation specimen, the loading was perpendicular to the growth orientation of columnar grains, i.e., the columnar grain boundaries acted as the main load carriers.
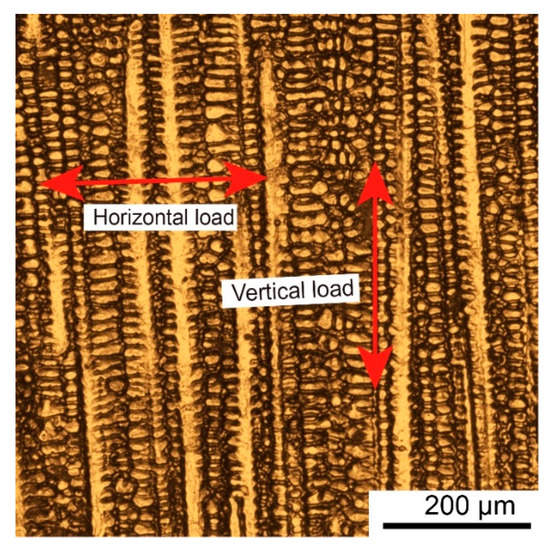
Figure 12.
Schematic diagram of the metallographic structure and load-bearing mode.
It was easy for the WAAM material grain boundaries, with an almost single growth direction, to be drawn away from their original location. This made the material more prone to generate deformation with the lower performance of YS and UTS values at the macro level [26,27]. However, compared with the horizontal tensile specimen, when the vertical tensile specimen was tested, the loading mainly acted along the growth direction of the columnar grain.
The average yield strength values of the horizontal and vertical specimens (YSH, YSV), and that of the ultimate tensile strength of both directional specimens (UTSH, UTSV), are shown in Figure 13. Whether yield strength or ultimate tensile strength, the V values were all higher than the H values, which shows significant anisotropy. However, the anisotropy of YS was lower than that of UTS, and this may be due to the plastic deformation mechanism of the polycrystalline material. The yield of materials under uniaxial load is mainly manifested by the starting of the crystal slip system and dislocation migration. As it is the same material, the lattice type and the manner of dislocation migration were the same, so the yield strengths were similar in value in both directions [28].
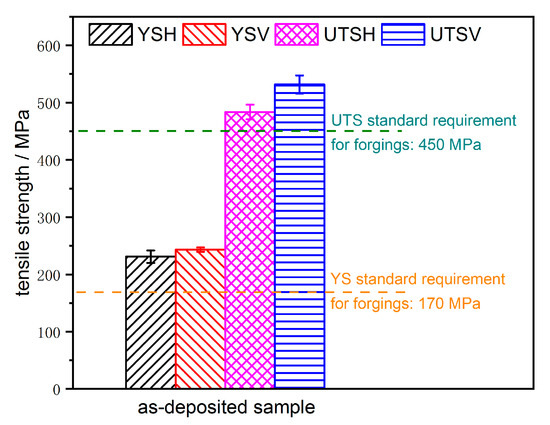
Figure 13.
Average values of yield and ultimate tensile strength in the horizontal and vertical directions.
However, because ultimate tensile strength involves the breaking of materials, and the number and tortuosity of grain boundaries play a decisive role in the fracture properties of materials, the reasons indicated above determined that the ultimate tensile strength of the two directions had a large gap in the arc-welding as-deposited part. Whether H or V direction, both YS and UTS values all satisfy the industrial standard requirement for forgings: 170 MPa for YS and 450 MPa for UTS [29]. Therefore, the results indicate that the CMT + P single-channel multilayer continuous arc-welding deposition process can easily be applied to the additive manufacturing of 316L stainless steel.
Figure 14 shows the microscopic morphology of the tensile specimens H2 and V2. A large number of equiaxed dimples are visible in both images, indicating that the as-deposited part has excellent plasticity. However, a few tearing edges can be observed in Figure 14b, which means that there was a mixed fracture pattern of ductile and brittle fractures on the vertical tensile specimen. In addition, the fracture of specimen V2 had a large number of deeper dimples than those on specimen H2. This is because, during the tensile process of the vertical specimen, the main load acceptor was the dendrites growing vertically up along the building direction, so they had undergone sufficient plastic deformation before fracture. Conversely, the grain boundary extending upward as the main load bearer in the horizontal tensile specimen failed to carry out sufficient plastic deformation before it broke.
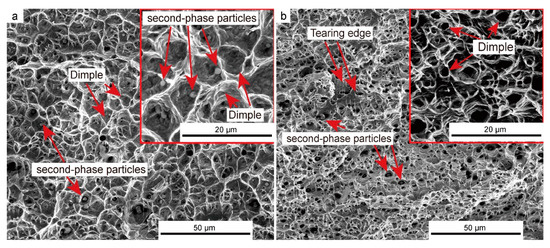
Figure 14.
Microfracture morphology of the tensile specimen: (a) Horizontal tensile specimen H2, and (b) vertical tensile specimen V2.
Meanwhile, the number of dimples in Figure 14b is significantly higher than that in Figure 14a, which is also caused by the unique directional grain growth morphology formed during the arc deposition process, in which the number of grain boundaries bearing horizontal load was less than that of the grains bearing vertical load.
Furthermore, many second-phase spherical particles extending from the center of some dimples were observed in both images. One of the spherical particles was analyzed by EDS, shown in Figure 15, and its element content was very consistent with that of the precipitated phase mentioned in Figure 9. Considering the position of the spherical particles appearing on the fracture, it can be reasonably concluded that the particles are the aforementioned intermetallic compound precipitates, which are an important load carrier during tensile fracture and have an important influence on the improvement in tensile strength.
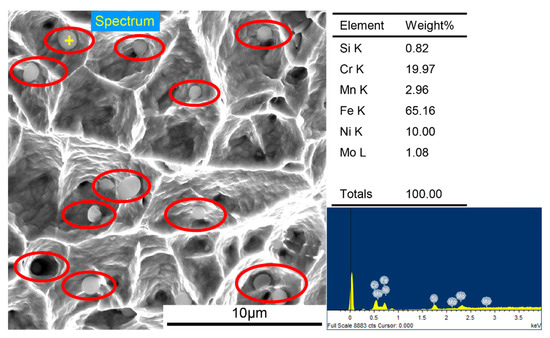
Figure 15.
High-resolution electron microscope image of the fracture and EDS analysis of spherical particle on the fracture.
3.4. Corrosion Resistance
The potentiodynamic polarization curves of the bottom, middle, and top specimens of the as-deposited wall in 3.5 wt% NaCl at room temperature are shown in Figure 16. The passivation zone of the bottom specimen has an obvious and longer platform, which is significantly more stable than the other two specimens. This is mainly because the material surface in the bottom region had a more stable passivation film than the other two regions [30]. Chromium atoms did not have enough time to spread and migrate over long distance and were largely dissolved in the matrix due to the rapid solidification of droplets caused by the chilling action of the substrate during the first few layers of deposition. This led to the formation of stable and uniform passivation films all over the surface of the bottom specimen. However, because of the higher heat at the middle of the as-deposited sample, Cr atoms had higher activation energies, which promoted the long-distance migration of Cr atoms within the grains, and the degree of element segregation was improved. Thus, the uniformity of passivation films on the surface of this region was destroyed, which made local corrosion more likely to occur here, resulting in a passivation platform with a slight slope in Figure 16.
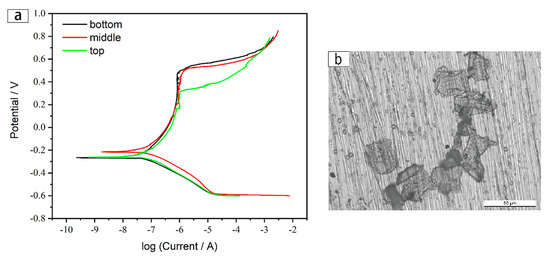
Figure 16.
Electrochemical test results of the as-deposited wall: (a) Potentiodynamic polarization curve of the three regions, and (b) corrosion pit morphology.
However, the pitting potential of the bottom specimen was slightly lower than that of the middle specimen. This is mainly because of the existence of higher-density dislocations and a larger amount of grain boundaries around the bottom region than in the middle. The high stored energy in the grain boundaries, as planar defects in the crystal, were susceptible to corrosion attacks. High temperature caused by heat accumulation decreased the number of grain boundaries and promoted the dislocation migration. Therefore, the dislocation density was reduced, which decreased the sensitivity to corrosion attacks and thus increased the pitting potential of the middle region [31]. It can be seen from Figure 16b that the corrosion pits extended quite deeply and accelerated the corrosion of adjacent areas. Meanwhile, the upward shift in the polarization curve indicates that the middle specimen had higher self-corrosion potential and better resistance.
Besides, the microstructure of the upper specimen consisted of equiaxed grains in the top layer and coarse columnar grains near the top layer, which caused it to be more diverse than the other two portions. The top layer displayed a large amount of material stripping, as seen in Figure 6d, due to the chilling effect and removal of the shielding gas source. Additionally, a large number of poor Cr areas formed near the top, which made the region more susceptible to invasion by chloride ions and thus more prone to pitting. As a result, the pitting potential was lower and the passivation zone was narrower than for the other two test regions. The polarization curve was numerically fitted and results including corrosion potential, corrosion current density, and pitting potential are shown in Table 3.
Table 3.
The test results of potentiodynamic polarization curve (corrosion potential, corrosion current density, and pitting potential).
As the passivation film could form spontaneously on the surface of the as-deposited part, electrochemical impedance analysis (EIS) was carried out on the three parts. The Nyquist plots of the three specimens all showed one depressed semi-circle, as Figure 17a displays. The larger the curvature diameter, the better the stability of the passivated film, and the stronger the anti-electrochemical dissolving ability [32]. For simulating the electrochemical process at the interface between the electrode and electrolyte, and quantizing the charge transfer resistance, the equivalent circuit model shown in Figure 17b was adopted in the tests.
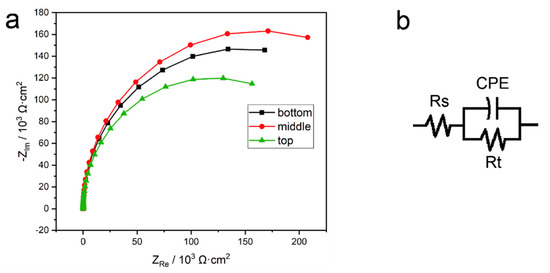
Figure 17.
Electrochemical impedance test data of the bottom, middle, and top region specimens of the wire arc additive manufacturing (WAAM) 316L as-deposited sample: (a) Nyquist plots and (b) equivalent circuit model (EEC).
The high-frequency impedance behavior is related to the resistance of the electrolyte and represented as ‘Rs’ in the equivalent electrical circuit (EEC). CPE is the constant phase element, representing the double-layer capacity of the electrode/electrolyte. Rt is the electrochemical transfer resistance of the test system, where larger values mean it is more difficult for the charge to pass through the two-phase interface of the electrode and the solution, i.e., the electrode material has higher corrosion resistance [33].
Figure 18 shows the values of CPE and Rt calculated from Nyquist plots (Figure 17a) using the EEC model (Figure 17b) in 3.5 wt% NaCl electrolyte. The calculated results of the values of Rs, CPE, and Rt are shown in Table 4. Compared with the other two sites, the lowest CPE value (3.686 × 10⁻⁵ S·sn·cm−2) appeared on the middle specimen, indicating that the defect degree of the passivation film on the middle specimen was lowest. The CPE value of the top part was highest, which was consistent with the microstructure observation mentioned previously. In addition, the higher Rt value exhibited on the middle specimen also confirmed the most stable passivation film and the strongest barrier characteristic compared to the other two regions of the as-deposited wall. The lowest Rt value appears on the top specimen, mainly because of the precipitation of large amounts of alloying elements, greatly reducing the Cr content in the matrix and seriously damaging the passivation film on the surface of the material in this region. In addition, surface defects such as material stripping enhanced the depolarization of chlorine (Cl) ions in this region, which further reduced the Rt value. These results were consistent with those of the dynamic potential polarization tests.
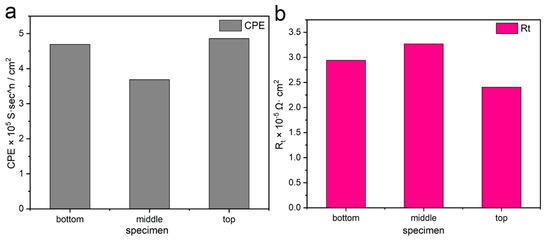
Figure 18.
Comparison of electrochemical corrosion test results: (a) CPE value and (b) Rt value.
Table 4.
Numerical results of the electrochemical impedance experiment.
4. Conclusions
This experiment presented and evaluated the 316L stainless-steel wire single-channel multilayer continuous deposition method based on the CMT + P process of gas metal arc welding (GMAW). The morphology, microstructure, mechanical properties, and corrosion resistance of the as-deposited sample were studied comprehensively, and the conclusions were drawn as follows:
- (1)
- A 316L stainless-steel-deposited part with good appearance and an erect wall was obtained by using the CMT + P process, which proves that this process is suitable for 316L WAAM.
- (2)
- The metallographic microstructure of the 316L as-deposited wall along the building direction by the CMT + P process presents periodic bands as a whole, while tiny dendrites in the interlayer fusion line re-melted and grew vertically upward in a manner of epitaxial growth.
- (3)
- The alloy solidified in the AF mode along the whole deposition wall, with ferrite and austenite being the main constituent phases of the as-deposited wall. The microstructure along the building direction was different: In the bottom region, a small amount of ferrite precipitated in the austenite matrix, while the amount of ferrite gradually increased and was distributed in the austenite matrix as a network at the middle of the as-deposited wall. However, due to the heat accumulation effect, the ferrite dissolved into the austenite in large quantities and the austenite showed an obvious increase in grain size.
- (4)
- Due to the effect of continuous heat treatment during the deposition process, supersaturated alloy elements in the form of globular intermetallic compounds began to separate in large quantities from the interior of the grain in the middle of the as-deposited wall, which caused a great amount of Cr atoms to be consumed by the austenitic matrix, leading to the austenite grains in the upper region being etched deeper than those in the bottom and middle regions by the etching fluid.
- (5)
- The microhardness values changed along a concave parabola on the cross-section along the building direction, i.e., it decreased first and then rose. The influence of intermetallic compound precipitation on microhardness was greater than that of the change in grain size in the arc-deposited part.
- (6)
- The horizontal and vertical loads were mainly carried by the grain boundaries. As the dendrites grew vertically, the vertical load of the UTS and YS on the vertical tensile specimen was higher than that of the horizontal tensile specimen, showing obvious anisotropy. The spherical particles that were observed to be distributed on the tensile fracture were the fracture surfaces of the intermetallic compounds precipitated in the grains and were important load bearers during tensile fracture.
- (7)
- A stable passivation film was formed due to the relatively low dislocation density and grain boundary number, and the middle region of the arc as-deposited wall had the best corrosion resistance. The large consumption of Cr atoms and material stripping in the top region made the integrity of the passivation film in this region worst, which resulted in the lowest corrosion resistance.
Author Contributions
B.X. performed the research, designed the experimental process, analyzed the data, wrote the original manuscript, and reviewed and edited the manuscript. J.X. provided the conception and conducted project management. X.R. provided the resources. All authors have read and agreed to the published version of the manuscript.
Funding
This research was funded by the National Natural Science Foundation of China, grant number [51875213]; The Dong Guan Innovative Research Team Program, grant number [NO. 2017360004004]; 2016 special fund project for talent introduction of Guangdong Academy of Sciences, grant number [2016-GDASRC-0106]; Natural Science Foundation of Fujian Province, grant number [2018J01503]; Science and Technology Project of Longyan City, grant number [2017ly68]. The science and technology projects of Guangdong province, grant number [2018A050506060].
Conflicts of Interest
The authors declare no conflict of interest.
References
- Lin, Z.; Goulas, C.; Ya, W.; Hermans, M.J.M. Microstructure and Mechanical Properties of Medium Carbon Steel Deposits Obtained via Wire and Arc Additive Manufacturing Using Metal-Cored Wire. Metals 2019, 9, 673. [Google Scholar] [CrossRef]
- Olszówka-Myalska, A.; Godzierz, M.; Myalski, J.; Wrześniowski, P. Magnesium Matrix Composite with Open-Celled Glassy Carbon Foam Obtained Using the Infiltration Method. Metals 2019, 9, 622. [Google Scholar] [CrossRef]
- Plangger, J.; Schabhüttl, P.; Vuherer, T.; Enzinger, N. CMT Additive Manufacturing of a High Strength Steel Alloy for Application in Crane Construction. Metals 2019, 9, 650. [Google Scholar] [CrossRef]
- Tlotleng, M.; Pityana, S. Effects of Al and Heat Treatment on the Microstructure and Hardness of Ti–Al Synthesized via In Situ Melting Using LENS. Metals 2019, 9, 623. [Google Scholar] [CrossRef]
- Vutova, K.; Vassileva, V.; Stefanova, V.; Amalnerkar, D.; Tanaka, T. Effect of Electron Beam Method on Processing of Titanium Technogenic Material. Metals 2019, 9, 683. [Google Scholar] [CrossRef]
- Ron, T.; Levy, G.K.; Dolev, O.; Leon, A.; Shirizly, A.; Aghion, E. The Effect of Microstructural Imperfections on Corrosion Fatigue of Additively Manufactured ER70S-6 Alloy Produced by Wire Arc Deposition. Metals 2020, 10, 98. [Google Scholar] [CrossRef]
- DebRoy, T.; Wei, H.L.; Zuback, J.S.; Mukherjee, T.; Elmer, J.W.; Milewski, J.O.; Beese, A.M.; Wilson-Heid, A.; De, A.; Zhang, W. Additive manufacturing of metallic components–Process, structure and properties. Prog. Mater. Sci. 2018, 92, 112–224. [Google Scholar] [CrossRef]
- Wang, C.; Tan, X.; Liu, E.; Tor, S.B. Process parameter optimization and mechanical properties for additively manufactured stainless steel 316L parts by selective electron beam melting. Mater. Des. 2018, 147, 157–166. [Google Scholar] [CrossRef]
- Pace, M.L.; Guarnaccio, A.; Dolce, P.; Mollica, D.; Parisi, G.P.; Lettino, A.; Medici, L.; Summa, V.; Ciancio, R.; Santagata, A. 3D additive manufactured 316L components microstructural features and changes induced by working life cycles. Appl. Surf. Sci. 2017, 418, 437–445. [Google Scholar] [CrossRef]
- Feng, Y.; Zhan, B.; He, J.; Wang, K. The double-wire feed and plasma arc additive manufacturing process for deposition in Cr-Ni stainless steel. J. Mater. Process. Technol. 2018, 259, 206–215. [Google Scholar] [CrossRef]
- Guo, P.; Zou, B.; Huang, C.; Gao, H. Study on microstructure, mechanical properties and machinability of efficiently additive manufactured AISI 316L stainless steel by high-power direct laser deposition. J. Mater. Process. Technol. 2017, 240, 12–22. [Google Scholar] [CrossRef]
- Prado-Cerqueira, J.; Camacho, A.; Diéguez, J.; Rodríguez-Prieto, Á.; Aragón, A.; Lorenzo-Martín, C.; Yanguas-Gil, Á. Analysis of Favorable Process Conditions for the Manufacturing of Thin-Wall Pieces of Mild Steel Obtained by Wire and Arc Additive Manufacturing (WAAM). Materials 2018, 11, 1449. [Google Scholar] [CrossRef]
- Selvi, S.; Vishvaksenan, A.; Rajasekar, E. Cold metal transfer (CMT) technology-An overview. Def. Technol. 2018, 14, 28–44. [Google Scholar] [CrossRef]
- Cong, B.; Qi, Z.; Qi, B.; Sun, H.; Zhao, G.; Ding, J. A Comparative Study of Additively Manufactured Thin Wall and Block Structure with Al-6.3%Cu Alloy Using Cold Metal Transfer Process. Appl. Sci. 2017, 7, 275. [Google Scholar] [CrossRef]
- Xu, X.; Mi, G.; Luo, Y.; Jiang, P.; Shao, X.; Wang, C. Morphologies, microstructures, and mechanical properties of samples produced using laser metal deposition with 316 L stainless steel wire. Opt. Laser Eng. 2017, 94, 1–11. [Google Scholar] [CrossRef]
- Kadoi, K.; Ueda, S.; Tokita, S.; Inoue, H. Effect of MC carbide formation on weld solidification cracking susceptibility of austenitic stainless steel. J. Alloy Compd. 2020, 828, 154423. [Google Scholar] [CrossRef]
- Lei, J.; Xie, J.; Zhou, S.; Song, H.; Song, X.; Zhou, X. Comparative study on microstructure and corrosion performance of 316 stainless steel prepared by laser melting deposition with ring-shaped beam and Gaussian beam. Opt. Laser Technol. 2019, 111, 271–283. [Google Scholar] [CrossRef]
- Hao, Y.; Li, J.; Li, X.; Liu, W.; Cao, G.; Li, C.; Liu, Z. Influences of cooling rates on solidification and segregation characteristics of Fe-Cr-Ni-Mo-N super austenitic stainless steel. J. Mater. Process. Technol. 2020, 275, 116326. [Google Scholar] [CrossRef]
- Yilmaz, O.; Ugla, A.A. Microstructure characterization of SS308LSi components manufactured by GTAW-based additive manufacturing: Shaped metal deposition using pulsed current arc. Int. J. Adv. Manuf. Technol. 2017, 89, 13–25. [Google Scholar] [CrossRef]
- Bodziak, S.; Al-Rubaie, K.S.; Dalla Valentina, L.; Lafratta, F.H.; Santos, E.C.; Zanatta, A.M.; Chen, Y. Precipitation in 300 grade maraging steel built by selective laser melting: Aging at 510 °C for 2 h. Mater. Charact. 2019, 151, 73–83. [Google Scholar] [CrossRef]
- Bartolomeu, F.; Buciumeanu, M.; Pinto, E.; Alves, N.; Carvalho, O.; Silva, F.S.; Miranda, G. 316L stainless steel mechanical and tribological behavior—A comparison between selective laser melting, hot pressing and conventional casting. Addit. Manuf. 2017, 16, 81–89. [Google Scholar] [CrossRef]
- Röttger, A.; Geenen, K.; Windmann, M.; Binner, F.; Theisen, W. Comparison of microstructure and mechanical properties of 316 L austenitic steel processed by selective laser melting with hot-isostatic pressed and cast material. Mater. Sci. Eng. A 2016, 678, 365–376. [Google Scholar] [CrossRef]
- Yadollahi, A.; Shamsaei, N.; Thompson, S.M.; Seely, D.W. Effects of process time interval and heat treatment on the mechanical and microstructural properties of direct laser deposited 316L stainless steel. Mater. Sci. Eng. A 2015, 644, 171–183. [Google Scholar] [CrossRef]
- Li, H.; Jing, H.; Xu, L.; Zhao, L.; Han, Y.; Tang, Z.; Wang, X.; Zhang, Y. Cyclic deformation behavior of an Fe-Ni-Cr alloy at 700 °C: Microstructural evolution and cyclic hardening model. Mater. Sci. Eng. A 2019, 744, 94–111. [Google Scholar] [CrossRef]
- Bermingham, M.J.; Kent, D.; Zhan, H.; StJohn, D.H.; Dargusch, M.S. Controlling the microstructure and properties of wire arc additive manufactured Ti–6Al–4V with trace boron additions. Acta Mater. 2015, 91, 289–303. [Google Scholar] [CrossRef]
- Carroll, B.E.; Palmer, T.A.; Beese, A.M. Anisotropic tensile behavior of Ti–6Al–4V components fabricated with directed energy deposition additive manufacturing. Acta Mater. 2015, 87, 309–320. [Google Scholar] [CrossRef]
- Zhong, Y.; Rännar, L.; Liu, L.; Koptyug, A.; Wikman, S.; Olsen, J.; Cui, D.; Shen, Z. Additive manufacturing of 316L stainless steel by electron beam melting for nuclear fusion applications. J. Nucl. Mater. 2017, 486, 234–245. [Google Scholar] [CrossRef]
- Khadyko, M.; Marioara, C.D.; Ringdalen, I.G.; Dumoulin, S.; Hopperstad, O.S. Deformation and strain localization in polycrystals with plastically heterogeneous grains. Int. J. Plast. 2016, 86, 128–150. [Google Scholar] [CrossRef]
- Standard Specification for Stainless Steel Forgings; ASTM: 100 Barr Harbor Drive, West Conshohocken, PA, USA, 2015.
- Revilla, R.I.; Wouters, B.; Andreatta, F.; Lanzutti, A.; Fedrizzi, L.; De Graeve, I. EIS comparative study and critical Equivalent Electrical Circuit (EEC) analysis of the native oxide layer of additive manufactured and wrought 316L stainless steel. Corros. Sci. 2020, 108480. [Google Scholar] [CrossRef]
- Zhou, C.; Hu, S.; Shi, Q.; Tao, H.; Song, Y.; Zheng, J.; Xu, P.; Zhang, L. Improvement of corrosion resistance of SS316L manufactured by selective laser melting through subcritical annealing. Corros. Sci. 2020, 164, 108353. [Google Scholar] [CrossRef]
- Cruz, V.; Chao, Q.; Birbilis, N.; Fabijanic, D.; Hodgson, P.D.; Thomas, S. Electrochemical studies on the effect of residual stress on the corrosion of 316L manufactured by selective laser melting. Corros. Sci. 2020, 164, 108314. [Google Scholar] [CrossRef]
- Lodhi, M.J.K.; Deen, K.M.; Haider, W. Corrosion behavior of additively manufactured 316L stainless steel in acidic media. Materialia 2018, 2, 111–121. [Google Scholar] [CrossRef]
Publisher’s Note: MDPI stays neutral with regard to jurisdictional claims in published maps and institutional affiliations. |
© 2020 by the authors. Licensee MDPI, Basel, Switzerland. This article is an open access article distributed under the terms and conditions of the Creative Commons Attribution (CC BY) license (http://creativecommons.org/licenses/by/4.0/).