Article

Decrease of Nozzle Clogging through Fluid Flow Control

by
Enif Gutiérrez
1,*,
Jose de Jesus Barreto
1,
Saul Garcia-Hernandez
1,
Rodolfo Morales
2,3 and
María G. González-Solorzano
2
1
TecNM-Instituto Tecnologico de Morelia, Metallurgy Graduate Center, Graduate Center, Av. Tecnologico No.1500, Morelia 58120, Mexico
2
Department of Metallurgy and Materials Engineering-ESIQIE, Instituto Politécnico Nacional, Ed. 7, UPALM, Col, Zacatenco, Cd. de México 07738, Mexico
3
Department of Materials Science and Engineering, University of Toronto, Toronto, ON M5S 1A1, Canada
*
Author to whom correspondence should be addressed.
Metals 2020, 10(11), 1420; https://doi.org/10.3390/met10111420
Submission received: 22 September 2020 / Revised: 11 October 2020 / Accepted: 16 October 2020 / Published: 26 October 2020

Abstract

:
Decreasing the clogging deposition rate of alumina inclusions in continuous casting nozzles is possible through three simultaneous measures: Flow modification, use of raw materials with low impurities contents, and smoothed internal surfaces. The control of the internal flow consists on avoiding dead regions and developing symmetric patterns. A mathematical model performed tests of the feasibility of these measures. The adherence of inclusions to the nozzle wall, using this model, employs a boundary condition based on the thickness of the sublaminar boundary instead of the conventional “trap” boundary condition. The use of the general boundary condition yields deposition rates that are unaffected by the inclusion size. The proposed boundary condition discriminates against the clogging deposition rate through the particle sizes. Plant trials complemented with water modeling, using these nozzles, proved that the present approach could considerably decrease the clogging occurrence.

1. Introduction

The nozzle clogging phenomenon has been one of the most disruptive problems for the continuous casting process for as long as casting machines have been operating. This phenomenon produces an inconsistent flow and temperature variations, steel level fluctuations in the mold, impairment of steel quality, and the steel casting’s abrupt interruption. Clogging starts when solid compounds, mainly steel skull, and non-metallic inclusions, are non-uniformly deposited at the entry nozzle inner wall at some typical preferential zones characterized for neighboring dead flow conditions [1,2,3,4,5]. These inclusions have as primary sources: (1) The reaction between the dissolved oxygen with the deoxidizers [6,7,8,9]; (2) re-oxidation in the tundish or the nozzle [10,11]; and (3) the entrainment of slag or refractory particles [11,12,13,14]. Researchers who have worked on the determination of inclusions sources and clogging recognize that the deposited inclusions at the nozzle wall are mainly alumina inclusions [7,8,9,15,16]. Steel re-oxidation occurs due to possible air aspiration under the flow control valves (slide gate or stopper rod) to maintain the entry flow to the molds [17,18,19]. Besides, regardless of the refractory nozzle composition (alumina graphite, zirconia magnesia, or Al2O3-carbon), steel melt infiltrates the refractory and removes the protective surface [11,20], allowing the entrapment of refractory particles and inclusion attachment at the nozzle wall.
The non-metallic inclusions come from the steelmaking process; several researchers have focused their efforts on studying the variables that induce the inclusion deposition at the inner nozzle wall producing the clogging phenomena [1,11,12,13,14,16]. Steel chemistry and, in particular, steel grades containing titanium, like Ti-SULC, (Ti Stabilized Ultra-Low Carbon Steels), steels enhance the nozzle clogging due to the surface tension properties of this element in liquid steel [21,22,23,24,25]. The wetting of inclusions, rich in Ti oxide, assists in the clustering and compaction of particles. When the ratio Ti/Al is above a threshold dictated by thermodynamics, the wettability of complex oxides of Ti and Al works, intensifying the nozzle’s clogging under the presence of oxygen. This series of papers provides an insight of the clogging phenomena while casting these steel grades.
Concerning the interactions between fluid flow and clogging formation, some of these works concluded that funnel vortices’ action controls the inclusion deposition, creating suitable conditions for conveying the inclusion from the outer flow to the boundary layer wall region. The interaction between the clogging and the fluid flow, considering its growth kinetics, has been studied by numerical models [24,25]. Other researchers claim that if the inclusions are small, most will be entrained while only a few of them may eject; in contrast, if the inclusions are large, few will be entrained, and most of the eject out [26,27,28,29]. Other works have stressed the importance of the nozzle flow patterns since inclusion deposition has presented preferential zones at the upper tundish nozzle (UTN), just after the slide gate, close to the submerged entry nozzle (SEN) ports, and at the nozzle bottom. These zones are characterized by flow recirculation, abrupt geometry changes, and high gradients on the turbulent kinetic energy, pressure, and flow velocity [16,30,31,32,33,34,35]. Slowing down the casting speed enhances the clogging rate online with the formation of dead zones inside the nozzle [3,16,31]. The injection of argon gas through the upper tundish nozzle wall or stopper tip can help to reduce air aspiration, remove inclusions, and decrease clogging. However, the optimal argon flow rate is a complex function of the casting speed, tundish level, and nozzle-bore diameter. Moreover, the injection can form gas pockets and bubbles that greatly affect flow in the mold [36,37,38,39,40].
Based on these results, the nozzle’s fluid dynamics is one of the most important variables affecting the clogging phenomenon reported by other researchers [41,42,43,44,45]. Following this idea, this work focuses on controlling the boundary layer thickness of the flow on the nozzle’s internal surface, looking at the clog’s prevention rather than at its growth and its interaction with the flow. This approach’s feasibility is carried through a one full-scale water model and mathematical simulations.

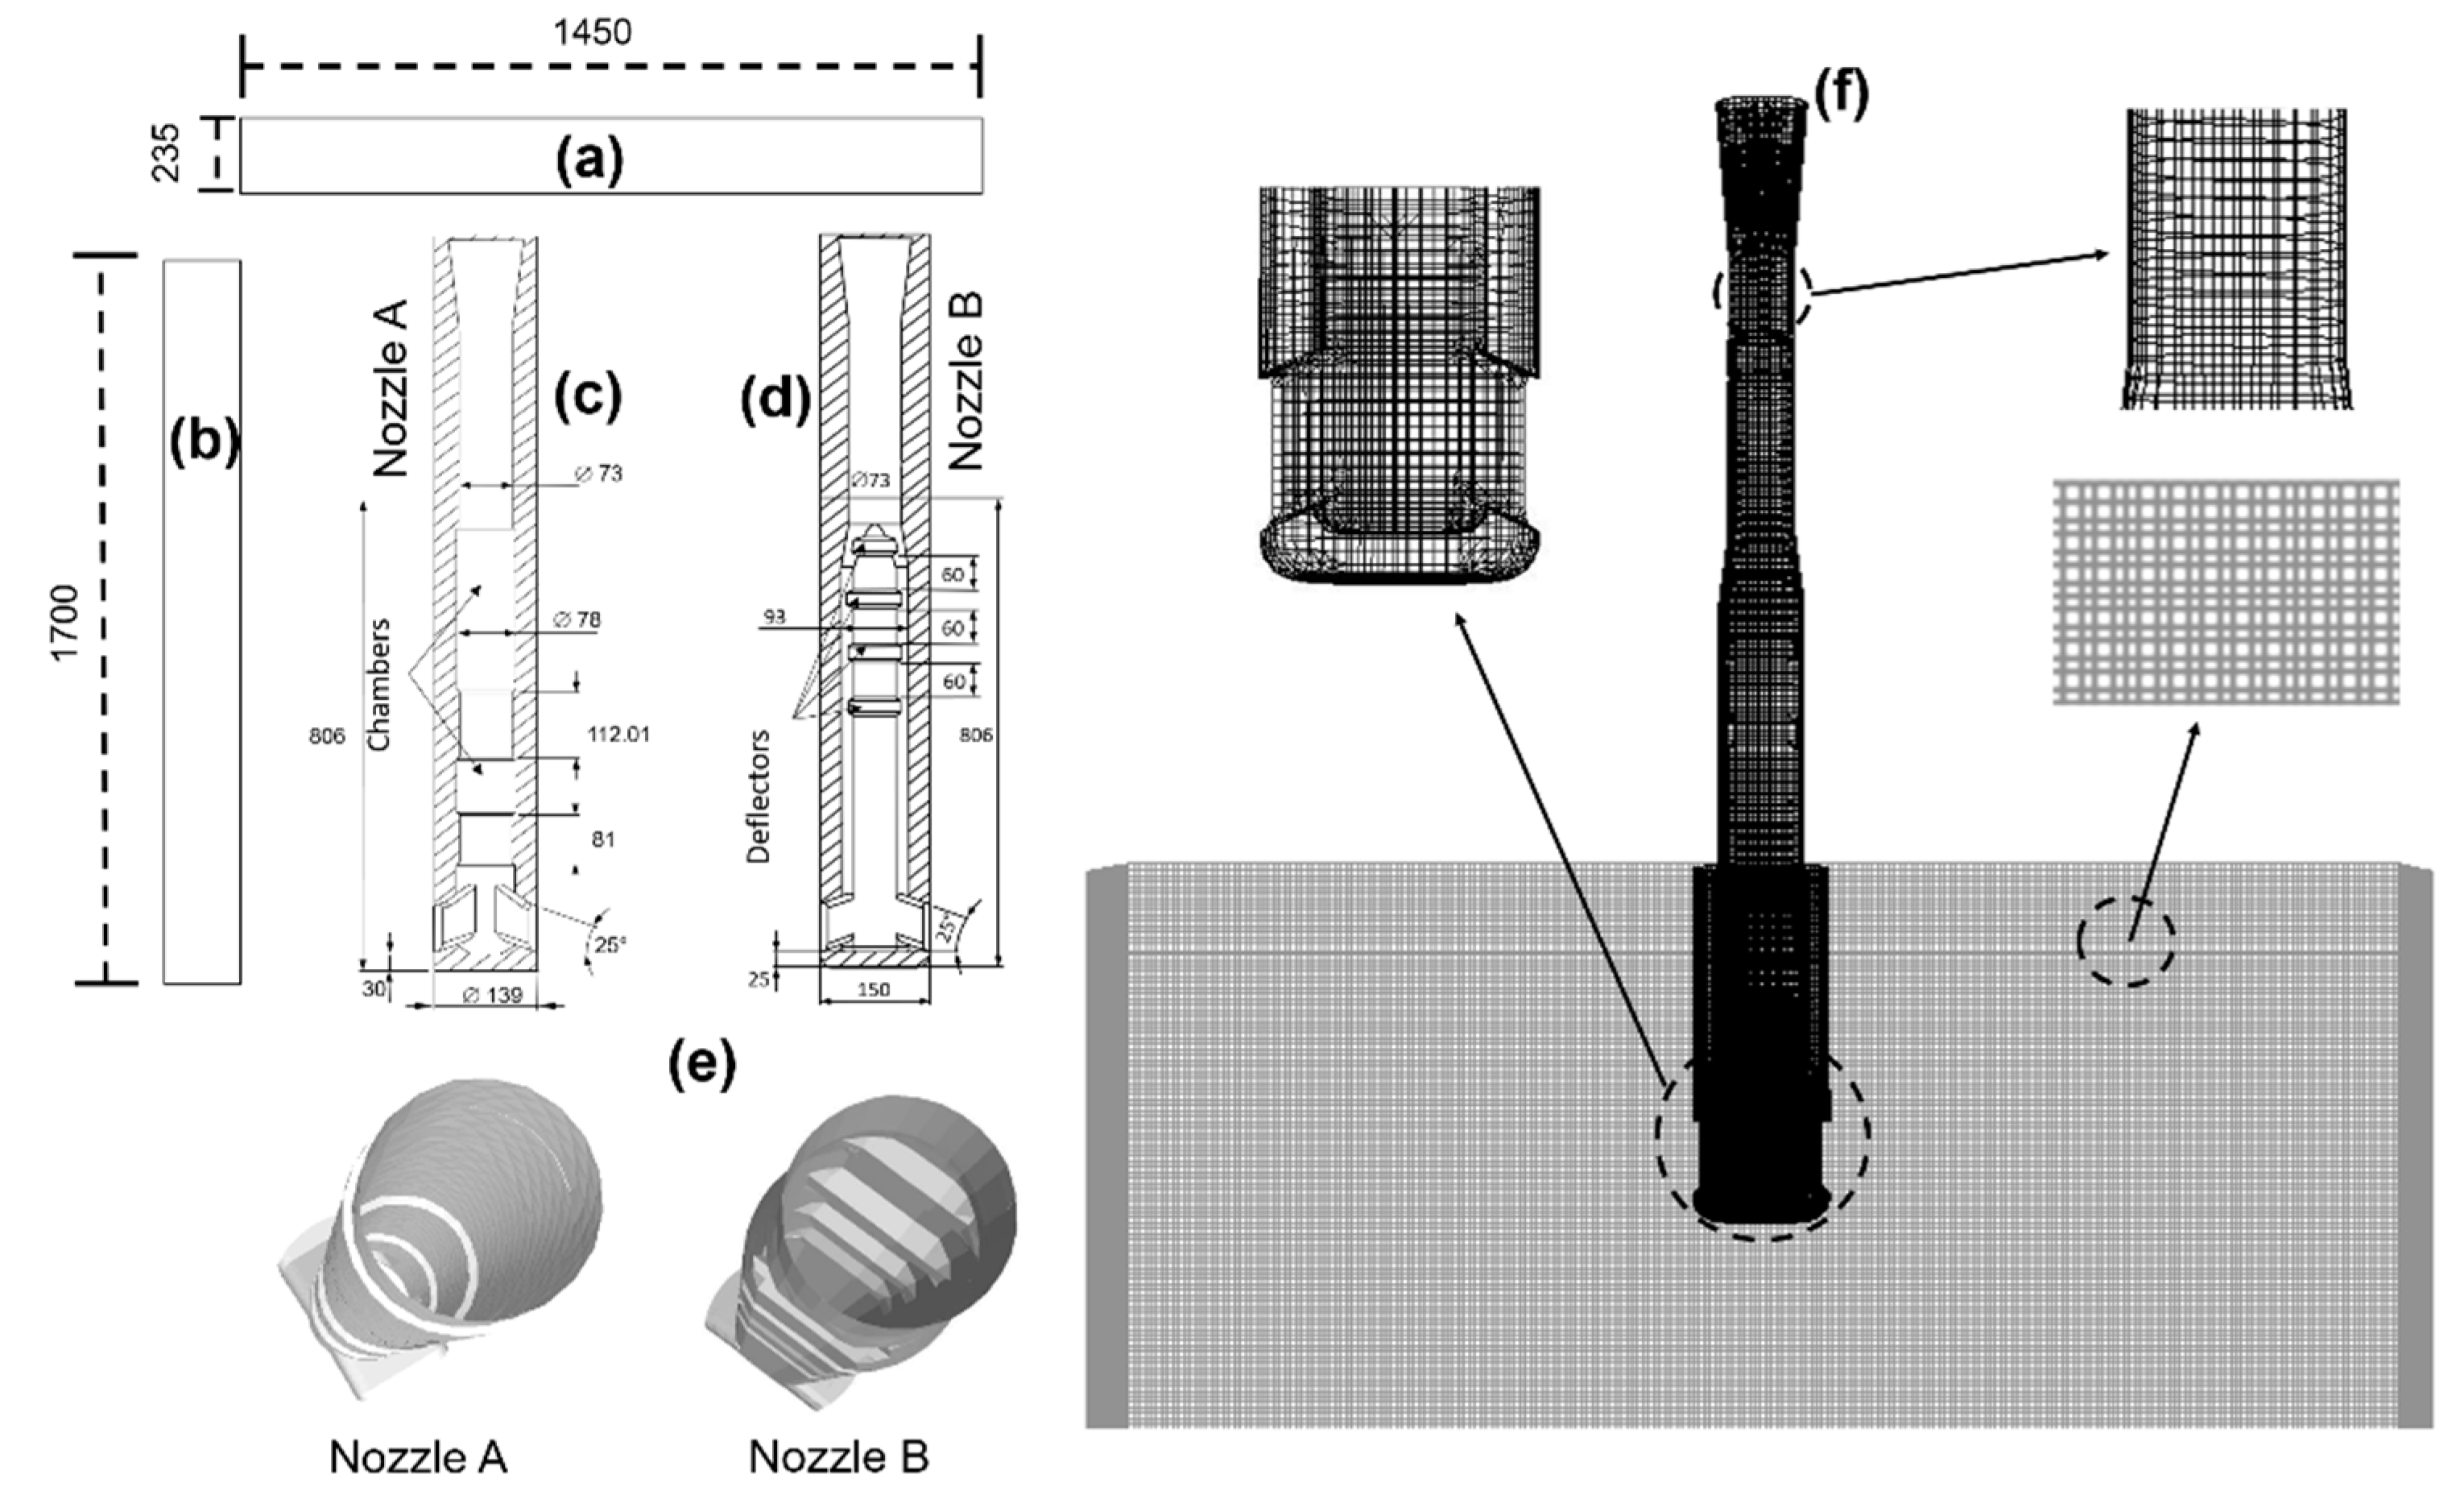
2. Materials and Methods

The numerical simulation was processed using a three-dimensional model considering the continuity equation and Navier–Stokes equations. The standard k-ε and the discrete phase models [46] describe the flow turbulence and the inclusions’ trajectories. These equations were solved simultaneously by a commercial CFD software under the following assumptions and considerations.

2.1. Main Assumptions and Considerations

  • In the present research, the studied clogging mechanism is the inclusion deposition into the inner SEN wall. Other clogging sources as chemical reactions between steel and the nozzle, interaction between steel and slag/refractory interfaces, reoxidation, refractory erosion, growth of the clog, and solidification of the fluid on the wall are not considered in this work.
  • The simulation considers unsteady state and isothermal conditions, with the gravity force acting over the negative y coordinate.
  • The molten steel was assumed to be an incompressible Newtonian fluid with density ρ = 7100 kg/m3 and viscosity μ = 0.0064 Pa·s.
  • The model uses non-slip conditions as boundary conditions at all solid surfaces.
  • There is not any external force affecting the fluid dynamic on the system.
  • The outer flow field relates to the field inside the boundary layer using the log law.
  • Dynamics of inclusions use the flow field data under steady-state conditions in the discrete phase model. The spherical solid inclusions, with alumina properties (ρ = 3960 kg/m3), assuming no interaction among them, were fed at the entry nozzle top center. The studied inclusion sizes were 1, 3, 5,10, 20, 40, 60, 80, and 100 μm. For these particle sizes, the corresponding response times are exceedingly small; in other words, this is a one way coupled flow governed by the liquid phase.
  • As a starting point, at the nozzle wall, the typical or general boundary condition of the “trap,” implemented in the ANSYS-FLUENT® (version 16.2.0, ANSYS Inc., Pennsylvania, PA, USA) package, was applied. In this case, “if the inclusion touches the wall, it is considered as attached”.
  • The estimation thickness of the boundary layer permits the adoption of a more realistic boundary condition in the wall. In this boundary condition, the inclusion is deposited on the wall, if its radius is smaller than the thickness of the sublaminar boundary layer. Essentially, this boundary condition assumes alternating shear rates with high-speed and low-speed regions near the boundary layer. Therefore, with these conditions, the dynamics of small and large inclusions diverge considerably [26,27,28,29].
The current model was selected due to that the k-ε turbulence model has shown results describing the fluid dynamic of the continuous casting and does not require a lot of computational effort [2,3,4,9,33,35,41,42,43].

2.2. Fundamental Equations and Models

The fundamental equations for mass and momentum after assumptions and considerations are as follows:
Mass balance equation:
u i x i = 0
where ui is the fluid velocity in the xi direction.
Momentum equation for turbulent flow conditions:
ρ u i t + ρ ( u i u j ) x i = P x i + μ eff 2 ( u i ) x 2 + ρ g
where ρ is the flow density, μeff = μ + μt is the effective viscosity, μ is the molecular viscosity, μ t = ρ C μ k 2 ε is the turbulent viscosity, P is the static pressure, g is the gravity acceleration, and the subscripts i, j are from one to three.

2.3. The Standard k-ε Turbulence Model Subsection

The following expressions give the equations for turbulent energy k and dissipation rate ε:
ρ t ( k ) + ρ k u i x i = x j [ ( μ + μ t σ k ) k x j ] + G k ρ ε
ρ t ( ε ) + ρ ε u i x i = x j [ ( μ + μ t σ ε ) ε x j ] + C l ε ε k G k C 2 ε ρ ε 2 k
where Gk represents the generation of turbulence kinetic energy, and C 1 ε   =   1.44 , C 2 ε   =   1.92 , σ ε   =   1.3 , σ k   =   1.0 , and C μ   =   0.09 .

2.4. The Lagrangian Discrete Phase Model

The inclusion trajectories are predicted by integrating the balance between the inertial force and the forces acting on the particle, see Equation (5).
d u p i d t = F D ( u i u p i ) + F B + F G + F P + F V M + F S
To incorporate the effect of instantaneous turbulent velocity fluctuation on the particle motion, the Random Walk Model was used. In this model, particle velocity fluctuations are based on the Gaussian distributed random number (ξ), chosen according to the local turbulence kinetic energy [47]. Once the fluid velocity and the particle velocity u p i are known, the inclusion position is calculated based on the Equation (5). F D ( u i u p i ) ,   F B ,   F G ,   F P ,   F V M , and FS are the drag, buoyant, gravitational, pressure gradient, virtual mass, and Saffman forces. For the first term, FD is through the expression:
F D = 18 μ ρ p d p 2 C D R e p 24
where particle Reynolds number R e p , is given by R e p = ρ d p | u p i u i | μ , with d p the inclusion diameter and CD is the drag coefficient C D = 24 R e ( 1 + 0.186 ) R e 0.653 ; this force induces the flow to follow the molten steel trajectory. Second and third terms in Equation (5) are the buoyant and gravity forces, which induce vertical ascendant and descendent movements respectively; then, their effect is jointly calculated by:
F B + F G = ( ρ ρ p ) g ρ p
Moreover, ρ p is the inclusion density. The pressure gradient force ( F P G ), is the result of the pressure differences from one point to another is given by:
F P = ρ ρ p u p u i x i
The virtual mass force, is the force required to accelerate the fluid surrounding the inclusion and then, depends on the relative acceleration between inclusions and the steel. Then we have:
F V M = ρ 2 ρ p d d t ( u u p ) ,
The last term is the Saffman force, which quantifies the velocity difference between steel and inclusions and promotes radial and lifting effects, being calculated as follow:
F S = 1.61   d 2 ( μ 0 ρ ) 1 2 | ω | 1 2 ( ( u u p ) × ω ) ,
where: ω = × u = | i   j   k x   y   z u x   u y   u z | .
In previous works [4,48] it has been established that the leading forces for the particle motion are buoyant, drag and Saffman, being possible to avoid the pressure gradient force and virtual mass force. However, to obtain more accurate results in the present research work, all forces mentioned above are considered in the mathematical simulation.

2.5. Numerical Procedure

The model equations were discretized using the finite volume technique and solved through the commercial ANSYS-FLUENT package, considering the computational segregated-iterative method. The second-order upwind scheme helps in linearizing the non-linear unsteady state URANS equations, and the body force weighted scheme interpolates the pressure field. The pressure–velocity algorithm for computing the velocity fields is a method known as SIMPLEC (Semi-Implicit Method for Pressure Linked Equations-Consistent) [47].
The computational system uses the Cartesian coordinates frame, with the atmospheric pressure equal to 101,325 Pa as the operating pressure. Inlet and outlet boundary conditions were defined as a velocity inlet and calculated for a casting velocity of 1.4 m/min. The computing uses a constant time step equal to 0.01 s. Convergence criterion establishes that when the sum of the residuals of the output variables reached values equal or smaller than 10−4 the computing converges. Since the simulation was time-dependent, the flow fields simulated after 300 s are employed to simulate the inclusions’ dynamics. The flow profiles remain almost constant and this the moment for the injections of the particles. The simulation includes the upper tundish nozzle (UTN), slide gate, submerged entry nozzle (SEN), and mold (see Figure 1), where a slide gate setting aperture of 50% and the grid contains 3,500,000 cells which were 95% structured. The drawing and meshing of the computing domain are through the available tools in ANSYS-FLUENT. The simulations of flow patterns in the entry nozzles connect with their respective flows in the mold.

2.6. The Sub-Laminar Boundary Layer Thickness

Long et al. [1] used the thickness of the sub-laminar boundary layer as the parameter to decide if an inclusion can or cannot deposit at the nozzle wall. In the present work, a similar boundary condition is elaborated through the boundary layer theory.

Theoretical Thickness of the Sub-Laminar Boundary Layer

Dividing the nozzle velocity profile into three regions: The turbulent bulk zone, transition layer, and the sub-laminar boundary layer (see Figure 2). The velocity profile expressed by dimensionless variables of distance and velocity ( y + ) is defined as follows [1,49]:
In the turbulent bulk zone ( y + > 30 )
u ¯ f + = 2.5 ln ( y + ) + 5.5
In the transition layer ( 30 > y + > 5 )
u ¯ f + = 5 ln ( y + ) + 3.05
In the sub-laminar layer zone ( y + < 5 )
u ¯ f + = y +
where ( u ¯ f + ) is the dimensionless velocity of the fluid.
Since the inclusion needs to cross over the sub-laminar boundary layer for its deposition to the wall, it is necessary to determine its thickness. The loss of mechanical energy in the nozzle due to friction; to achieve this condition, is through the friction factor:
f = P 1 2 ρ U ¯ 2 D L
C f = τ w 1 2 ρ U ¯ 2
where P is the pressure, D is the nozzle diameter, L is the axial nozzle length, ρ is the steel density, τ w is the shear stress, and U ¯ is the velocity just in the flow core.
Knowing that τ w = Δ P D / 4 L , the next expression comes from Equations (14) and (15)
f = 4 C f
Substituting Equation (17) in Equation (16):
τ w = f 8 ρ U ¯ 2
Now, the friction velocity is v = τ w ρ implying that
τ w = ρ v 2
equalizing Equations (17) and (18) plus Equation (16), it is gotten the following expression for the friction velocity
v 2 = 1 2   C f   U ¯ 2
finally, according to the log law in the sub-laminar boundary layer (Equation (13)) it is gotten,
y + = y v ν < 5
where y is the distance from the wall, and v is the kinematic viscosity. Therefore, the sub-laminar layer thickness is:
δ l = 5 ν v
this last equation is the basis for the criterion to be proposed.
Then, using Equation (21), the calculation of the thickness of the sub-laminar boundary layer in the nozzle internal surface is done through a user-defined function (UDF) integrated in the computational software.

3. Results

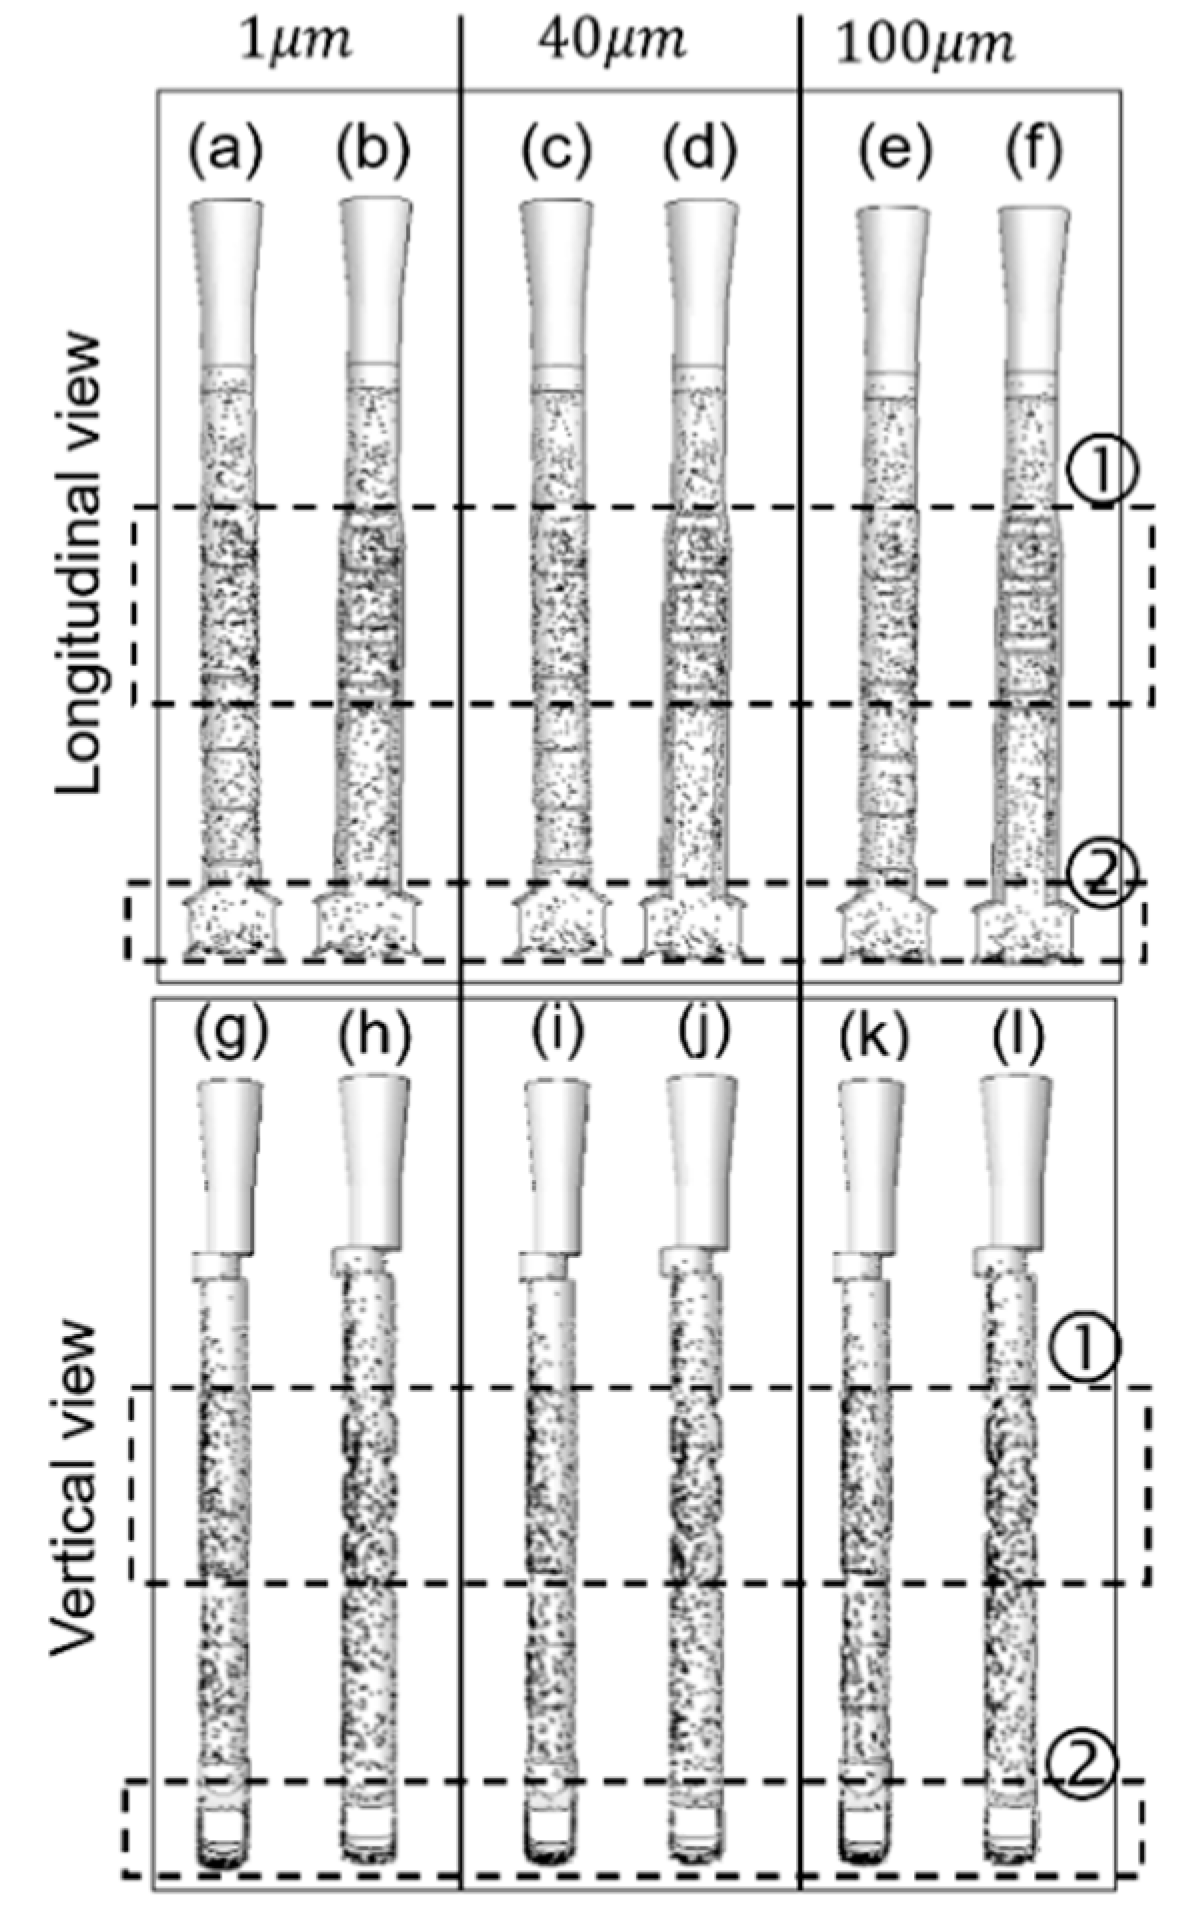
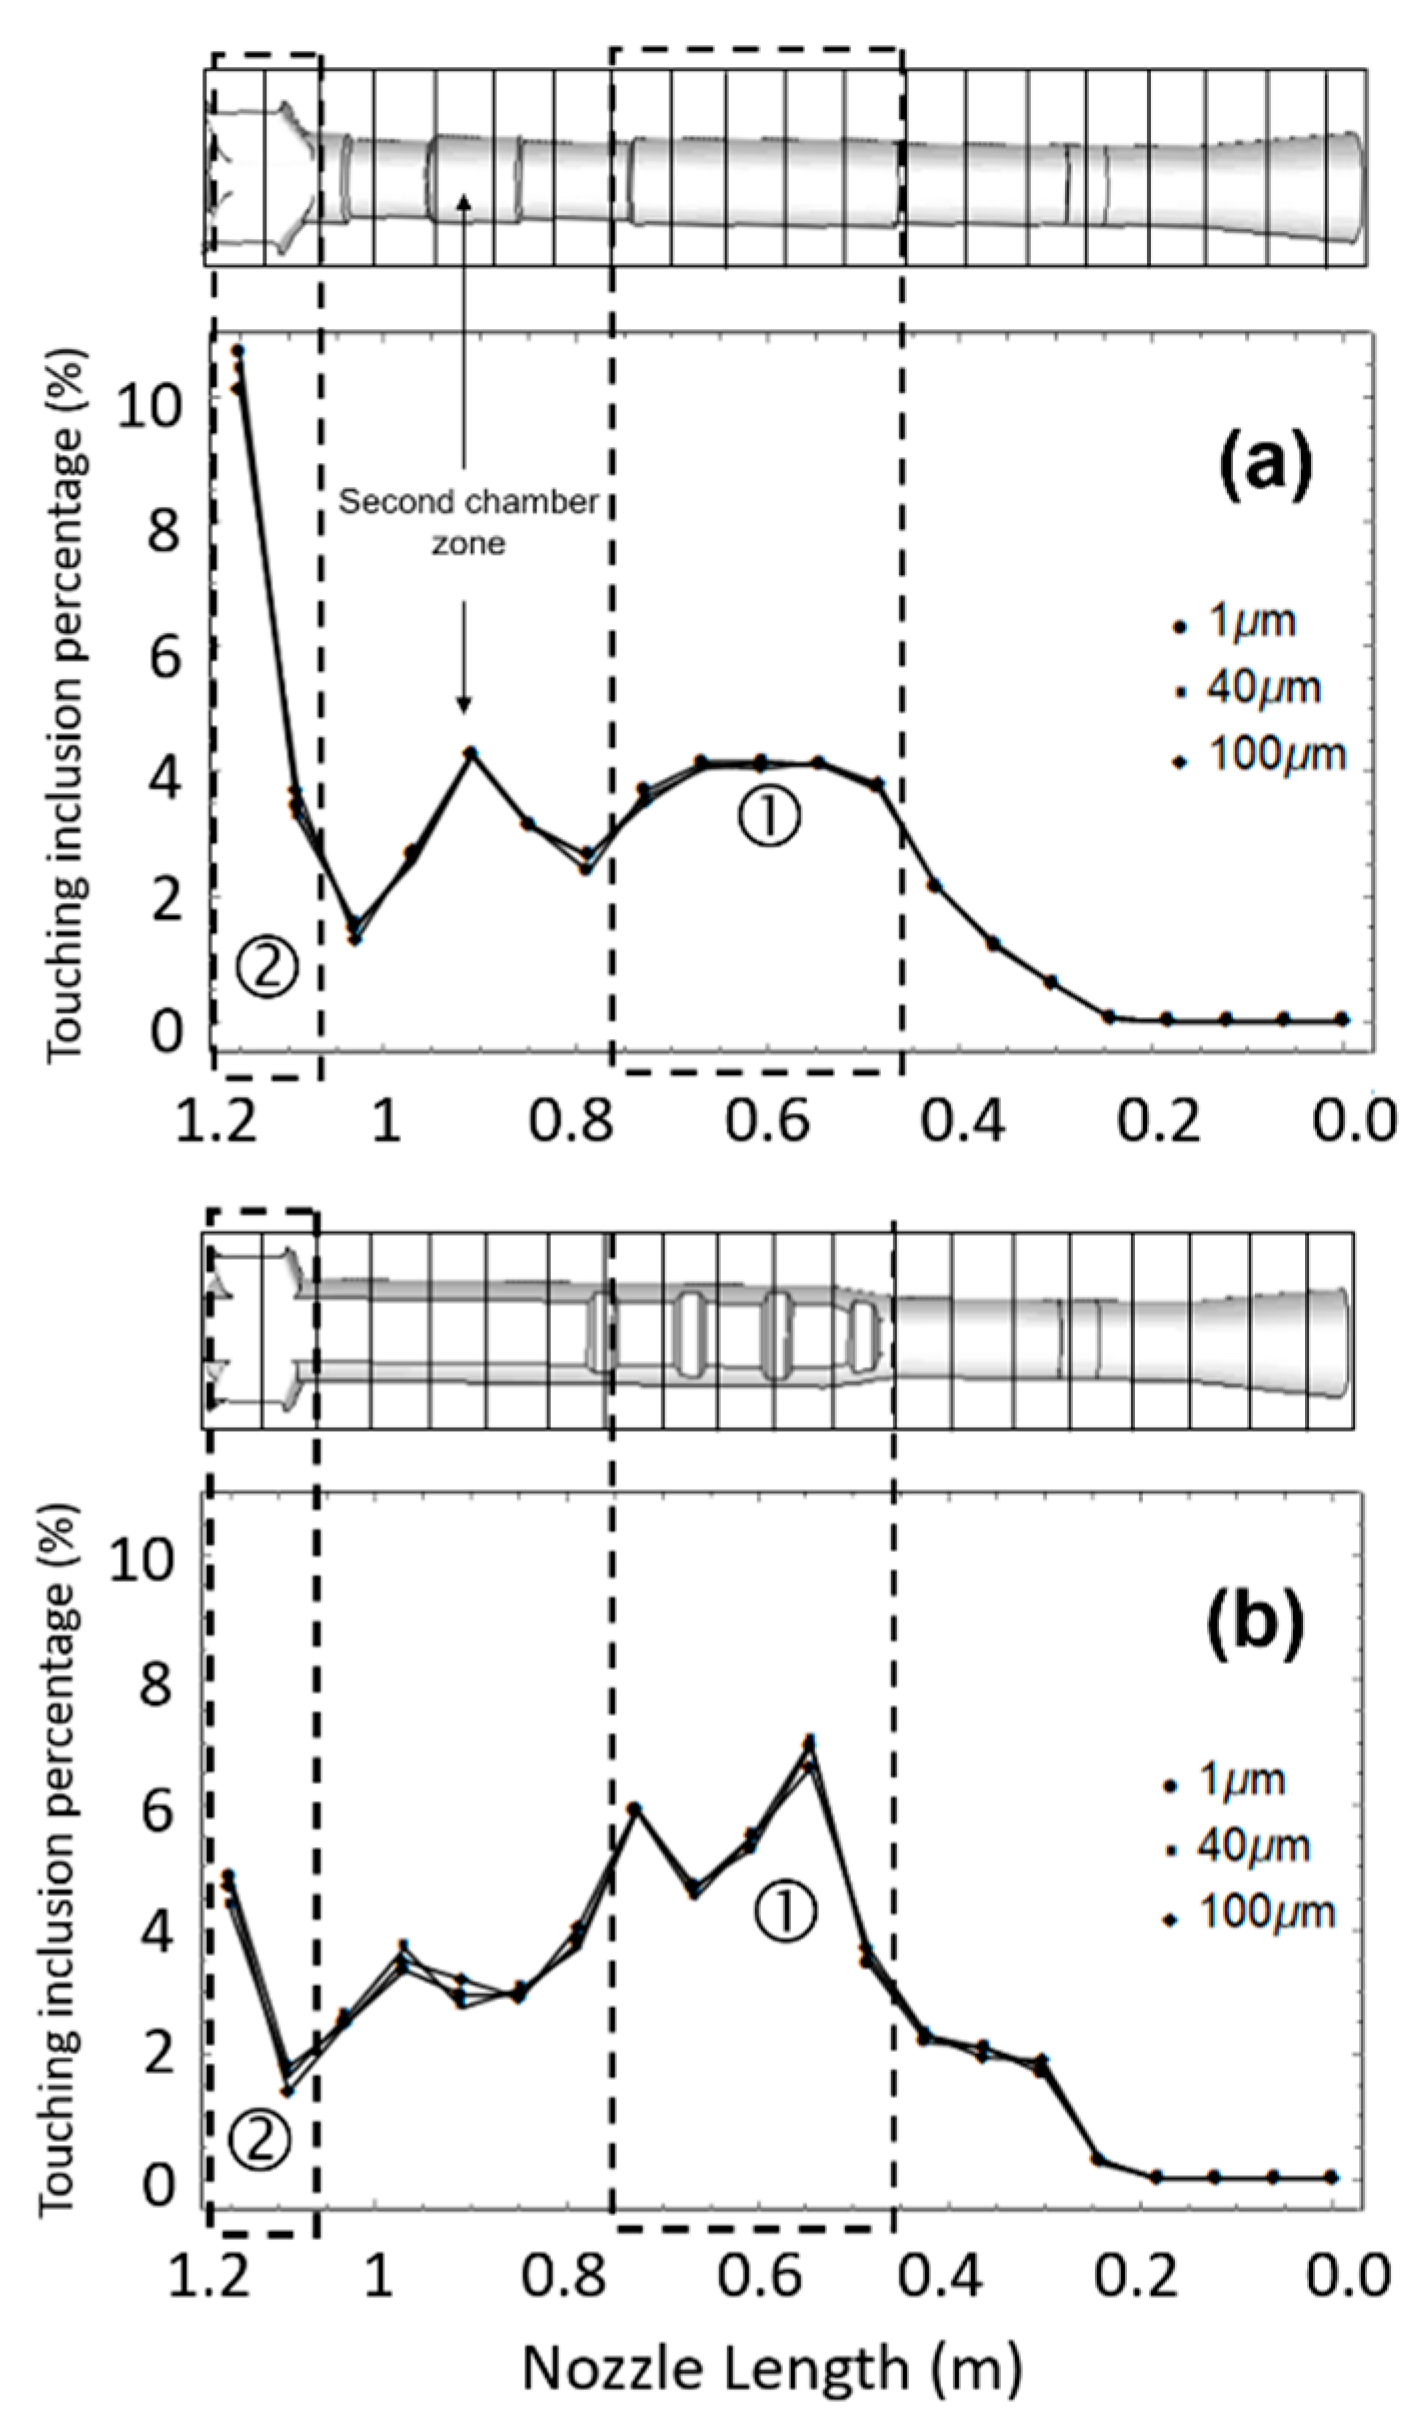
3.1. Touching Inclusions Percentages

Before starting this discussion, it is essential to point out that the typical boundary condition “trap” of the ANSYS-FLUENT package implies that once the inclusion touches the wall, it gets attached; when this consideration is applied, the term “touching” will be employed. Nevertheless, not all inclusions touching the nozzle wall at their first contact are attached, requiring a different criterion to evaluate such condition, based on the sublaminar boundary layer. When this consideration is applied, the term “deposited” will be employed instead of “touching”.
The starting point is counting the inclusions that get attached in the internal nozzle wall using the “trap” condition and how they distribute along with it. The percentages of touching inclusions are calculated for a size range from 1 to 100 μm, and the results are in Figure 3. The results show similar percentages for both cases, indicating that at least 50% of the inclusions passing through the nozzle attached to the wall regardless of the inclusion size. Even when the inclusions size range is broad, the obtained percentages do not represent a significant variation in any of the studied nozzles, despite the differences in the internal geometries. Notwithstanding this observation, likely, the touching inclusion distribution is not even along the inner wall, observing, preferential touching zones.
For this reason, the positions where the inclusions touch the inner wall were identified considering three representative sizes: Small (1 μm), medium (40 μm), and large (100 μm). Figure 4 shows the inclusions distribution, for the three sizes at the instant when they touch the wall, showing that regardless of the size and the type of nozzle, there are two preferential touching zones: The first one is located halfway along with the nozzle (marked with ➀), while a second zone is between the upper part of the ports and the bottom of the pool (marked with ➁). Moreover, the actual size of the inclusion does not show any relevance concerning its distribution for both nozzles since no significant differences are observed even in a longitudinal or vertical views, see Figure 4a–f and Figure 4g–l. However, to establish the number of inclusions observed in each of the mentioned zones quantitatively, the nozzle was subdivided into 20 equidistant sections of 6 mm, calculating in each one the percentage of inclusions touching the wall. To calculate the number of touching inclusions in each section: First, a UDF to acquire the exact position where each inclusion is touching the nozzle wall; then, in each segment was assigned the corresponding inclusions and quantified. When the number of touching inclusions is known, the percentage in each section, considering the total of fed inclusions, is calculated and the results are in Figure 5. The inclusion size does not influence the amount or the zone where inclusions touch; this result is applicable for both nozzles. The preferential touching zones, ➀ and ➁ mentioned in Figure 4, are confirmed and their position for both nozzles are the same. Through these results it is possible to delimit the zones and to quantify the touching percentages in each one as follows: The zone ➀ covers five sections and is located approximately 15 cm below the slide gate accumulating a 19.85% for nozzles A and 26.3% for nozzle B; the zone ➁ corresponds to the last two equidistant sections, giving 14.15% and 7.35%, for nozzle A and B respectively. In Figure 4g–l, in the vertical view, it is evident the non-symmetry on the touching inclusion frequency, being higher on the left side as a consequence of the slide gate aperture. In contrast, in the longitudinal view, there is not evident non-symmetry on the touching inclusion frequency. Moreover, it is noticeable that the touching zones are strongly related to the internal geometry of each nozzle. This result is due to the following: In the zone ➀ the chambers and deflectors generate reductions and expansions of the transversal area, and in the zone ➁, there is a zone characterized for presenting abundant inclusions attachment owing to the change of the flow direction through the discharging ports. In nozzle A, there is another zone showing an increment of the number of inclusions touching the wall, finding that it coincides with the second chamber’s location. It is evident that the chambers and deflectors are inducing an increment in the inclusions touching the inner wall of the SEN, so it is essential to perform a further analysis inside both nozzles to elucidate the reason behind this phenomenon.

3.2. Analysis of the Nozzle Geometry Effects on the Fluid Dynamics and the Inclusions Distribution

The analysis starts by studying the velocity contours taken in the nozzles’ inner vertical- symmetric plane, shown in Figure 6. As the molten steel passes through the slide gate, its velocity increases significantly, inducing a high-velocity flow through the nozzle’s left side. However, once the steel flow arrives and passes through the zone ➀, its velocity slows down, and the radial asymmetry, induced by the slide gate aperture, decreases. It is important to note that there is a reduction of the flow asymmetry in both nozzles. However, it is the nozzle B that presents better radial symmetry thanks to the deflectors’ presence.
Three vertical lines drawn along the nozzles help to quantify the changes in the flow: The first one at the left side, corresponds to the aperture side of the slide gate, the second at the center of the nozzle, and the third at the right side, opposite to the aperture of the slide gate. The velocity profiles along these lines are in Figure 7. Regarding nozzle A, there is a decrement of about 30% on the left side compared to the entry and exit velocities. There is no velocity difference at the center, and the velocity at the right side increases considerably to about 86%. The second chamber zone yields no significant velocity difference. The velocities of the left and center lines are closer in magnitude while the right side remains with a smaller velocity. Although these chambers work as a countermeasure for the radial asymmetry of the steel flow, produced by the slide gate in a significant way, the steel reaching the nozzle ports maintains a significant asymmetry yet. This condition may prevail along with the discharging jets inside the mold.
On the other hand, making the same comparison between the entry and exit velocities in the zone ➀ for nozzle B, it is observed a velocity decrement of 52% in the left side, a velocity difference of 17% at the center, and an increment of 110% in the right side. These results indicate that the flow structure inside the nozzle B recovers, to some extent, a flow pipe behavior since the velocity magnitude at the center is higher than on the left and right sides. These results imply that the deflectors, more than the chambers, are capable devices to eliminate the velocity radial asymmetries induced by the slide gate. It can be appreciated that along the remaining length; the steel flow will reach the ports with lower velocities and an improved velocity-profile uniformity in the radial velocity magnitudes than nozzle A, which could provide more stable jets inside the mold.
The inclusions trajectories and the touching frequency data shown in Figure 4 are related to the turbulent kinetic energy variations. Accordingly, the inclusions tend to migrate from high turbulence to low turbulence zones [3]. Therefore, the turbulent kinetic energy contours and the quantification along the same three vertical lines in Figure 7 are shown in Figure 8, for both nozzles. The results give an increase of the turbulent kinetic energy between the slide gate and zone at the nozzle’s right side, then the number of touching events increases on the left side. In terms of percentages of all inclusions fed for nozzle A and B, quantified in this zone, are 4.0% and 6.3%, respectively. The (left-right) distributions of these percentages are: (3.05% left—0.95% right) for nozzle A and (4.8% left—1.5% right) for nozzle B. In the zone ➀, the higher turbulent kinetic energy values are concentrated mainly at the center of both nozzles with low values near the walls. However, there are many differences for each nozzle that are worthy of being mentioned as follows:
When the flow passes through the first chamber of nozzle A, the turbulent kinetic energy decreases considerably, always showing the lowest values on the left side. On the other hand, when the flow passes through the nozzle B’s deflectors, the turbulent kinetic energy decreases and shows significant fluctuations of this variable close to the wall after each deflector. Nevertheless, the turbulent kinetic energies in the three lines are closer for nozzle B than those observed in nozzle A. The variations of the turbulent kinetic energy indicate that the inclusions must continue moving preferentially towards the nozzle’s left side. This condition is clarified by quantifying the distribution of the touching events in the left and the right sides for nozzle A and nozzle B. The percentages are: Nozzle A; 14.55% left side and 5.3% right side and nozzle B; 17.55% left side and 8.75% right side. These distributions imply that the deflectors in nozzle B induce a more uniform inclusion distribution on the surface than the chambers of nozzle A. Besides, the turbulent kinetic energy does not yield abrupt changes between this zone ➀ and the upper edge of the nozzle ports. Its magnitude is quite similar for the three lines for both nozzles, inducing a reduction of wall touching events of inclusions. This reduction of the touching inclusions is evident through the touching percentages in both sides (9.25% left—4.7% right) for nozzle A and (10% left—5.6% right) nozzle B.
At the zone of the ports, the turbulent kinetic energy suffers an increment which is higher for nozzle A than for nozzle B. These strong variations are due to the different designs of the ports producing a significant increment of the touching inclusion percentages mainly for nozzle A as can be seen in Figure 5.
Based on the previous discussion, the distribution and percentages of the inclusions touching the nozzle wall have support through the analysis of the flow velocity and turbulent kinetic energy, underlining that the touching inclusion percentage should not be taken as the attachment inclusion percentage, as reported in several works [3,50,51]. Experimental results [26,27,28,29] indicate that the proportion of the largest inclusions yield low attachment rates while the numerical results reported here yield no influence of the particle size. The origin of this inconsistency is the boundary condition of “trap”. The lack of a reliable boundary condition leads to devising a new one, which will be explained below.

3.3. The Condition for Particle Deposition

For the quantification of the sublaminar boundary layer, first, both nozzles were divided into two sections called the left and the right side. Each section considers one half of the nozzle, taking as a reference the center point of the nozzle in the vertical view. Next, the boundary layer thickness calculated at each point for both sections is analyzed and plotted in Figure 9. There is the confirmation that the thickness of the sub-laminar boundary layer is not constant, showing large radial and longitudinal variations along the nozzle. Before the slide gate, in the entry nozzle section, the thickness has a certain uniformity level in both radial and longitudinal directions. The thickness of the sub-laminar boundary increases considerably in the chambers, deflectors, and in the ports in both nozzles. The thickness of the layer is thinner on the left side but is more uniform in the right side. This observation is consistent with the higher flow velocity on the left side and contrasts with the right side, where the liquid moves slower, and the thickness is more uniform in both directions, radially and longitudinally.
Since the thickness of the sub-laminar boundary layer is not constant, the following scheme establishes a deposition or adherence criterion:
  • If d p / 2 <   δ l the inclusion adheres to the wall;
  • If d p / 2 >   δ l the inclusion reflects from the wall.
The implementation of these expressions, as a User Defined Function in the CFD software, serves as a deposition criterion of inclusions on the refractory wall.
The thickness of the boundary layer will affect the inclusion deposition rate and the distribution profile shown in Figure 3, Figure 4 and Figure 5. These results were recalculated using the deposition criterion established above. The outputs include the deposition distribution in the nozzle’s inner wall, the deposition rate by zones, and the overall deposition percentages. All these results are shown in Figure 10, Figure 11 and Figure 12, respectively. The results show that for small inclusions in the range from 1 to 20 μm, the average deposition percentage does not change significantly with the proposed deposition criterion (see Figure 3 and Figure 12). The distribution along the nozzle continues to maintain similar patterns (see Figure 4 and Figure 10), and the preferential deposition zones are maintained (see Figure 5 and Figure 11). However, for inclusions larger than 20 μm, the results show that the new criterion has a strong impact since the overall deposition rate decreases drastically for both nozzles (see Figure 3 and Figure 12). The deposition distribution throughout the nozzle no longer maintains the initial pattern for these inclusion sizes (see Figure 4 and Figure 10). The preferential deposition zones remain having some influence but with values that are significantly smaller (see Figure 5 and Figure 11). These results show the direct dependence of the inclusions deposition percentage at the different sections in the inner nozzle wall as a function of the sub-laminar boundary layer thickness. Therefore, these results establish that:
  • For inclusions smaller than 20 μm (10 μm radius indicated by the vertical lines drawn in Figure 9) the probability of being trapped in any zone of the nozzle is high, since its radius is smaller than the thickness of the sub-laminar boundary layer in almost any part of the nozzle. Therefore, these small inclusions will be deposited at the first contact with the wall, making no difference with the above boundary condition.
  • For inclusions larger than 40 μm, the deposition must be considerably lower or null because the radius of the inclusions is larger than the thickness of the layer. However, in zone 1 (delimited with chambers or deflectors) the thickness of the boundary layer increases, making it possible for inclusions in this range for deposition, although with minimum percentages. The thickness of the boundary layer is larger on the right side of nozzle A. In this same sense, in the zone ➁ (port zone) again the thickness of the boundary layer is similarly increased in both sides of the nozzle, facilitating the deposition of larger inclusions with percentages even larger than in zone ➀.
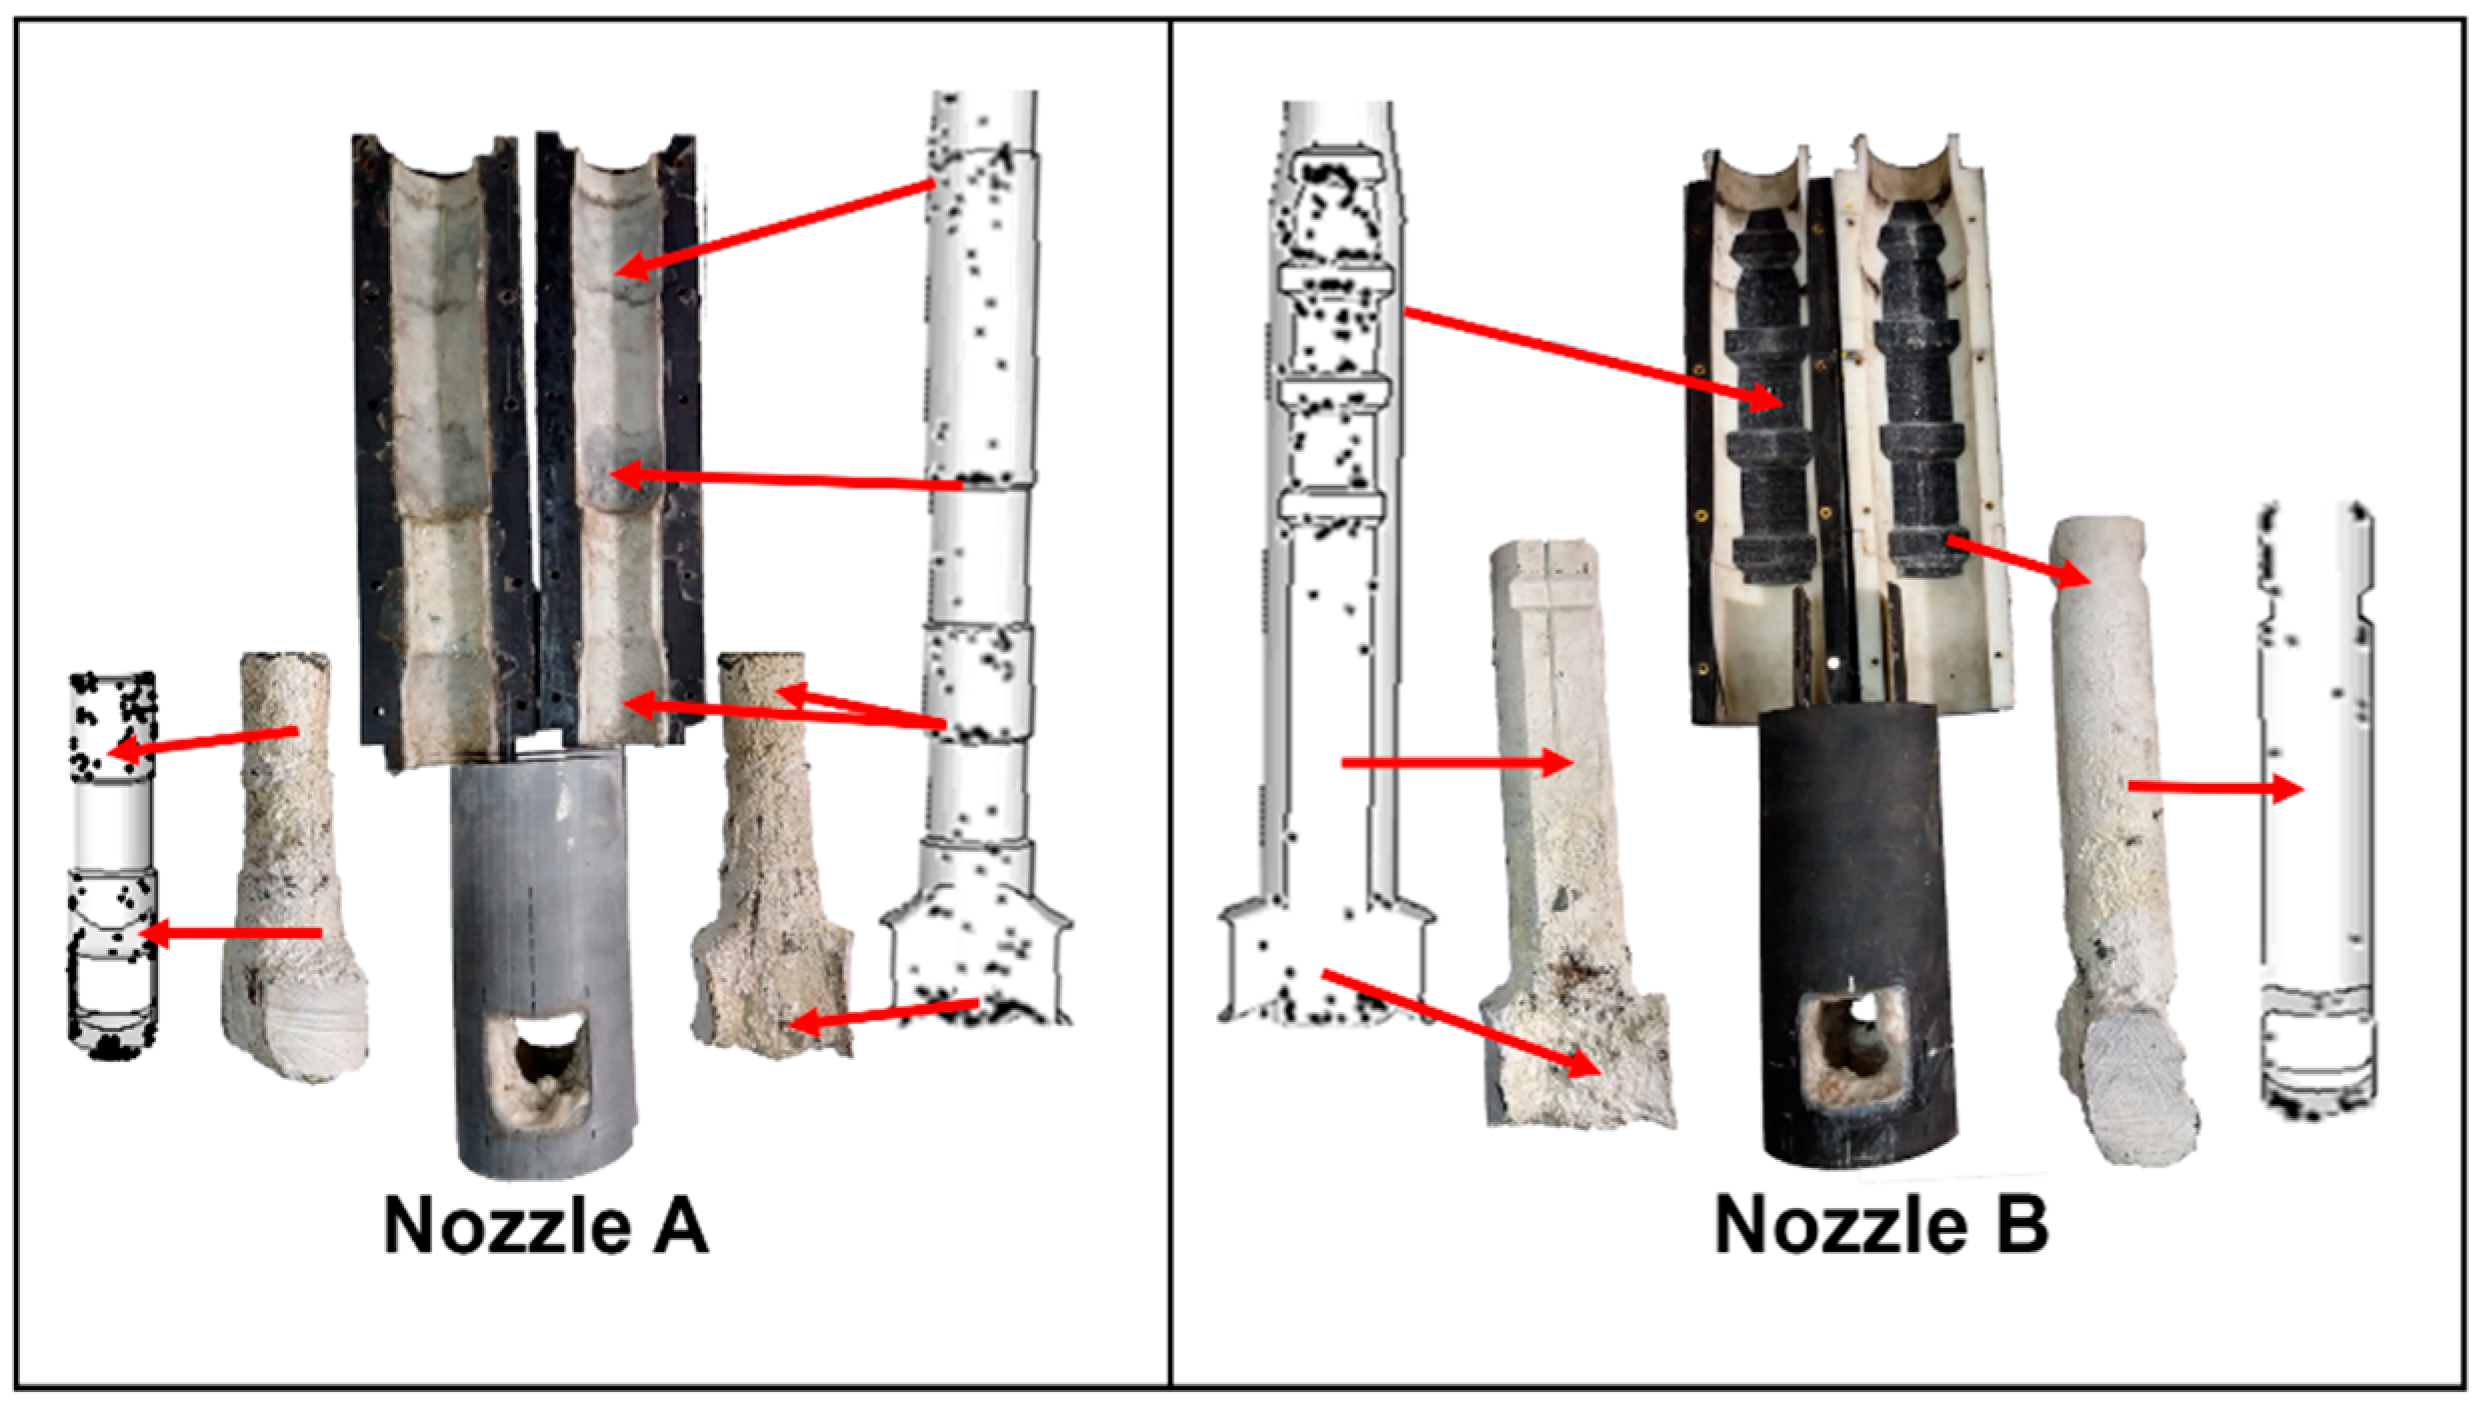
It is worthy of mentioning that the boundary condition proposed here is far from being complete as a criterion to assess the attachment strength of inclusion to the nozzle wall. However, it is more reliable than the simple touching principle, and the application of this boundary condition agrees successfully with a proper inclusion deposition behavior reported by other researchers [26,27,28,29].

4. Validation

4.1. Model Validation

The numerical flow patterns of the nozzle-mold pair permit to compare them with the experimental results of the analogous full-scale water model consisting of a tundish, entry nozzle, and a mold. This mold was made of transparent plastic sheets 15 mm thick, with dimensions of 235 × 1450 mm2 and a height of 1700 mm. The control of the casting speed is through a slide-gate, which is below the tundish. The comparison of the numerical and water model flow patterns is in Figure 13, where the dynamics of the tracer injected into the water model is described satisfactorily by the numerical model. Therefore, fluid dynamics are qualitatively validated.

4.2. Validation of the Boundary Condition

Both nozzle designs were tested in a real caster after a regular operating period and removed after the casting sequence, making replicas of the clogging deposits inside each mold through the following procedure: (1) Both nozzles were filled with a resin to obtain two cores forming negative topographies of the surfaces of both clogging deposits; (2) cutting both nozzles to extract their respective cores; and (3) simultaneously, two model nozzles made of plastic, replicating nozzles A and B, were manufactured in the workshop of our laboratory. The bodies and tips of the model nozzles were 3D printed in six different parts to obtain armored-demountable casting model tubes. Assembling all six pieces of each nozzle model finally has the exact replicas of the original nozzles. These models’ nozzles were compared against the deposited zones from the simulated nozzles, see Figure 14 [45]. Both nozzles yielded inclusions depositions in the zones of the deflectors and chambers, without presenting an excessive amount of inclusions at any point. Nevertheless, it is pointed out that in nozzle B the chambers had a special surface treatment that sought to inhibit the inclusions deposition. This treatment includes raw materials with low concentrations of impurities such as SiO2, Na2O, and K2O and a smoother internal surface. The nozzle shows better cleanliness than nozzle A. On the other hand, in the ports’ zone, the flow of the liquid changes radically the direction to get inside the mold. This change of direction forms a boundary layer separation in the upper edges of the ports [52,53], producing fields of minimal velocities. These velocity fields facilitate the deposition of inclusions in the ports forming thick clogs, regardless of the refractory material’s surface treatment. This result is consistent with the numerical results that point out that the deposition of inclusions in the ports has a higher percentage than in any other zone of the nozzle (zone ➁-Figure 11 and Figure 12). Notably, in the nozzle A, it is observed that the deposition occurs in the lateral and low part of the port wall and minor depositions at the top port wall. In summary, a smaller amount of inclusions deposited corresponds to nozzle A. However, the actual trials demonstrated that the nozzle B yields similar amount of deposited inclusions as nozzle A. The deposition effects are schematized in Figure 14.
Based on the qualitative comparison presented, it is possible to establish that the model is qualitatively successful in predicting the special inclusion deposition zones in both nozzles.

5. Conclusions

A mathematical model permitted to study the effects of internal chambers and deflectors on the flow patterns inside the entry nozzle. From the simulation results and their discussion, the following conclusions are drawn:
  • The usual criterion of “trap” predicts that more than 50% of the inclusions, reaching the nozzle wall, deposit themselves following a non-uniform manner, regardless of the inclusion size or the nozzle design.
  • The thickness of the sublaminar boundary layer is not uniform inside the nozzles and shows a strong dependence on the nozzle geometry and internal design. The layer is thinnest at the side of the slide gate’s opening and thickest near the deflectors and chambers zone, ports, and bottom of the nozzle.
  • For inclusions sizes larger than 20 μm, there are low deposition percentages of inclusions. However, for inclusions under 20 μm, the use of the new criterion showed no significant changes despite the presence of the chambers and the deflectors.
  • Chambers or deflectors significantly reduce the nozzle clogging by promoting a global decrement of the inclusion deposition at the inner SEN walls. These devices effectively control the fluid flow, counteracting the effects promoted by the slide gate opening, favoring the uniformity of the flow velocity and the turbulent kinetic energy, and also promoting a more stable flow to the discharging ports of nozzles.
  • From a fluid-dynamic point of view, nozzle B reduces more the dynamic effects produced by the slide gate.

Author Contributions

Conceptualization, R.M.; methodology and software, E.G. and S.G.-H.; validation, R.M. and M.G.G.- S.; formal analysis and Investigation, J.d.J.B.; writing—original draft preparation, E.G. and S.G.-H.; writing—review and editing J.d.J.B. and R.M. All authors have read and agreed to the published version of the manuscript.

Funding

This research received no external funding.

Acknowledgments

The authors give thanks to the institutions TecNM-ITM, ESIQIE-IPN, CONACYT, and SNI for their permanent support to the Academic Research Groups of Simulation of Materials Processing and Fluidynamics.

Conflicts of Interest

The authors declare no conflict of interest.

References

  1. Long, M.; Zuo, X.; Zhang, L.; Chen, D. Kinetic Modeling on Nozzle Clogging During Steel Billet Continuous Casting. ISIJ Int. 2010, 50, 712–720. [Google Scholar] [CrossRef] [Green Version]
  2. Ni, P.; Jonsson, L.T.I.; Ersson, M.; Jönson, P.G. The Use of an Enhanced Eulerian Deposition Model to Investigate Nozzle Clogging During Continuous Casting of Steel. Metall. Mater. Trans. 2014, 45, 2414–2424. [Google Scholar] [CrossRef]
  3. Gutiérrez, E.; Garcia-Hernández, S.; de Jesús Barreto, J. Mathematical Modeling of Inclusions Deposition at the Upper Tundish Nozzle and the Submerged Entry Nozzle. Steel Res. Int. 2016, 87, 1406–1416. [Google Scholar] [CrossRef]
  4. Gutiérrez, E.; Garcia-Hernández, S.; de Jesús Barreto, J. Mathematical Analysis of the Dynamic Effects on the Deposition of Alumina Inclusions inside the Upper Tundish Nozzle. ISIJ Int. 2016, 56, 1394–1403. [Google Scholar] [CrossRef] [Green Version]
  5. Barati, H.; Wu, M.; Holzmann, T.; Kharicha, A.; Ludwig, A. Simulation of non-metallic inclusion deposition and clogging of nozzle. Miner. Met. Mater. Ser. 2018, 149–158. [Google Scholar] [CrossRef]
  6. Snow, R.B.; Shea, J.A. Mechanism of Erosion of Nozzles in Open-Hearth Ladles. J. Am. Ceram Soc. 1949, 32, 187–194. [Google Scholar] [CrossRef]
  7. Braun, T.B.; Elliott, J.F.; Flemings, M.C. The clustering of alumina inclusions. Metall. Mater. Trans. 1979, 10, 171–184. [Google Scholar] [CrossRef]
  8. Miki, Y.; Kitaoka, H.; Sakuraya, T.; Fujii, T. Mechanism for Separating Inclusions from Molten Steel Stirred with a Rotating Electro-magnetic Field. ISIJ Int. 1992, 32, 142–149. [Google Scholar] [CrossRef]
  9. Zhang, L.; Thomas, B.G. State of the art in the control of inclusions during steel ingot casting. Metall. Mater. Trans. B 2006, 37, 733–761. [Google Scholar] [CrossRef]
  10. Sasai, K.; Mizukami, Y. Mechanism of Alumina Adhesion to Continuous Caster Nozzle with Reoxidation of Molten Steel. ISIJ Int. 2001, 41, 1331–1339. [Google Scholar] [CrossRef] [Green Version]
  11. Tehovnik, F.; Burja, J.; Arh, B.; Knap, M. Submerged entry nozzle clogging during continuous casting of Al-killed steel. Metalurgija 2015, 54, 371–374. Available online: https://hrcak.srce.hr/128965 (accessed on 10 September 2020).
  12. Fukuda, Y.; Ueshima, Y.; Mizoguchi, S. Mechanism of Alumina Deposition on Alumina Graphite Immersion Nozzle in Continuous Caster. ISIJ Int. 1992, 32, 164–168. [Google Scholar] [CrossRef] [Green Version]
  13. Sasai, K.; Mizukami, Y.; Yamamura, H. Reaction Mechanism between Alumina Graphite Immersion Nozzle and Low Carbon Steel. J. Iron Steel Inst. Jpn. 1993, 79, 1067–1074. [Google Scholar] [CrossRef] [Green Version]
  14. Sasai, K.; Mizukami, Y. Reaction Mechanism between Alumina Graphite Immersion Nozzle and Low Carbon Steel. ISIJ Int. 1994, 34, 802–809. [Google Scholar] [CrossRef]
  15. Singh, S.N. Mechanism of alumina buildup in tundish nozzles during continuous casting of aluminum-killed steels. Metall. Mater. Trans. 1974, 5, 2165–2178. [Google Scholar] [CrossRef]
  16. Kojola, N.; Ekerot, S.; Andersson, M.; Jönsson, P.G. Pilot plant study of nozzle clogging mechanisms during casting of REM treated stainless steels. Ironmak. Steelmak. 2011, 38, 1–11. [Google Scholar] [CrossRef]
  17. Yokota, S.; Souma, S.T.; Guchi, M.; Asak, Y.; Hara, S. Prevention of Air Suction from the Contact-part between Sliding Gate and Immersion Nozzle. ISIJ Int. 1998, 38, 1346–1352. [Google Scholar] [CrossRef]
  18. Rackers, K.; Thomas, B.G. Clogging in Continuous Casting Nozzles. 78th Steelmaking Conf. Iron Steel Soc. 1995, 78, 723–734. Available online: http://ccc.illinois.edu/PDF%20Files/Publications/95_ISS%5B1%5D.Conf.paper_post.pdf (accessed on 18 September 2020).
  19. Savolainen, J.; Rousu, A.; Fabritius, T.; Mattila, O.; Sulasalmi, P. Modelling of Pressure Distribution inside the SEN in a Stopper-rod controlled Syste. Steel Res. Int. 2010, 81, 980–986. [Google Scholar] [CrossRef]
  20. Vermeulen, Y.; Coletti, B.; Blanpain, B.; Wollants, P.; Vleugels, J. Material Evaluation to Prevent Nozzle Clogging during Continuous Casting of Al Killed Steels. ISIJ Int. 2002, 42, 1234–1240. [Google Scholar] [CrossRef] [Green Version]
  21. Lee, J.H.; Kang, Y.B. Growth of Initial Clog Deposits during Continuous Casting of Ti-ULC Steel Formation and Reduction of the Initial Deposits at Nozzle/Steel Interface. ISIJ Int. 2020, 426–435. [Google Scholar] [CrossRef] [Green Version]
  22. Lee, J.H.; Kang, M.H.; Kim, S.K.; Kang, Y.B. Oxidation of Ti Added ULC Steel by CO Gas Simulating Interfacial Reaction between the Steel and SEN during Continuous Casting. ISIJ Int. 2018, 1257–1266. [Google Scholar] [CrossRef] [Green Version]
  23. Lee, J.H.; Kang, M.H.; Kim, S.K.; Kim, J.; Kim, M.S.; Kang, Y.B. Influence of Al/Ti Ratio in Ti-ULC Steel and Refractory Components of Submerged Entry Nozzle on Formation of Clogging Deposits. ISIJ Int. 2019, 749–758. [Google Scholar] [CrossRef] [Green Version]
  24. Barati, H.; Wu, M.; Kharicha, A.; Ludwig, A. A transient model for nozzle clogging. Powder Techn. 2018, 181–198. [Google Scholar] [CrossRef]
  25. Barati, H.; Wu, M.; Kharicha, A.; Ludwig, A. Calculation Accuracy and Efficiency of a Transient Model for Submerged Entry Nozzle Clogging. Metall. Mater. Trans. B 2019, 1428–1443. [Google Scholar] [CrossRef] [Green Version]
  26. Rashidi, M.; Hetsroni, G.; Banerjee, S. Particle-turbulence interaction in a boundary layer. Int. J. Multiph. Flow 1990, 16, 935–949. [Google Scholar] [CrossRef]
  27. Kaftori, D.; Hetsroni, G.; Banerjee, S. Particle behavior in the turbulent boundary layer. I. Motion, deposition, and entrainment. Phys. Fluids 1995, 7, 1095–1106. [Google Scholar] [CrossRef]
  28. Hishida, K.; Ando, A.; Maeda, M. Experiments on particle dispersion in a turbulent mixing layer. Int. J. Multiph. Flow 1992, 18, 181–194. [Google Scholar] [CrossRef]
  29. Kaftori, D.; Hetsroni, G.; Banerjee, S. The effect of particles on wall turbulence. Int. J. Multiph. Flow 1998, 24, 359–386. [Google Scholar] [CrossRef]
  30. Smirnov, A.N.; Efimova, V.G.; Verzilov, A.P.; Maksaev, E.N. Clogging of submersible nozzles in continuous slab-casting machines. Steel Transl. 2014, 44, 833–837. [Google Scholar] [CrossRef]
  31. Wu, S.; Zhang, J.; Li, Z. Mathematic Model of SEN Clogging During Continuous Casting of Steel. J. Iron Steel Res. Int. 2010, 17, 6–9. [Google Scholar] [CrossRef]
  32. Zhang, L.; Thomas, B.G. State of the Art in Evaluation and Control of Steel Cleanliness. ISIJ Int. 2003, 43, 271–291. [Google Scholar] [CrossRef] [Green Version]
  33. Yuan, Q.; Thomas, B.G.; Vanka, S.P. Study of transient flow and particle transport in continuous steel caster molds: Part I. Fluid flow. Metall. Mater. Trans. 2004, 35B, 685–702. [Google Scholar] [CrossRef] [Green Version]
  34. Bolender, T.; Jacobi, H.; Weinberg, M.; Wünnenberg, K. Mixing and Oxide Cleanness in Sequence Casting of Heats of Differing Compositions. Steel Res. Int. 2007, 78, 31–38. [Google Scholar] [CrossRef]
  35. Deng, Z.; Zhu, M.; Zhong, B.; Sichen, D. Attachment of Liquid Calcium Aluminate Inclusions on Inner Wall of Submerged Entry Nozzle during Continuous Casting of Calcium-Treated Steel. ISIJ Int. 2014, 54, 2813–2820. [Google Scholar] [CrossRef]
  36. Bai, H.; Thomas, B.G. Effects of Clogging, Argon Injection, and Continuous Casting Conditions on Flow and Air Aspiration in Submerged Entry Nozzles. Metall. Mater. Trans. B 2001, 32, 707–722. [Google Scholar] [CrossRef]
  37. Hyunjin, Y.; Vanka, S.P.; Thomas, B.G. Modeling Argon Gas Behavior in Continuous Casting of Steel. CFD Modeling and Simulation in Materials Processing 2018, 1st ed.; Nastac, L., Pericleous, K., Sabau, A., Zhang, L., Thomas, B., Eds.; Springer: Cham, Switzerland, 2018; Volume 1, pp. 2148–2156. [Google Scholar]
  38. Klaus, T.; Shevchenko, N.; Röder, M.; Anderhuber, M.; Gardin, P.; Eckert, S.; Gerbeth, G. Visualization of liquid metal two-phase flows in a physical model of the continuous casting process of steel. Metall. Mater. Trans. B 2015, 46, 700–710. [Google Scholar] [CrossRef]
  39. Javurek, M.; Thumfard, M.; Wincor, R. Investigations on Flow Pattern and Pressure inside SEN below Stopper Rod. Steel Research Int. 2010, 81, 668–674. [Google Scholar] [CrossRef]
  40. Liu, R.; Thomas, B.G. Model of Gas Flow Through Porous Refractory Applied to an Upper Tundish Nozzle. Metall. Mater. Trans. B 2014, 46, 388–405. [Google Scholar] [CrossRef]
  41. Calderon-Ramos, I.; Morales, R.D. Influence of Turbulent Flows in the Nozzle on Melt Flow within a Slab Mold and Stability of the Metal–Flux Interface. Metall. Mater. Trans. 2016, 47, 1866–1881. [Google Scholar] [CrossRef]
  42. Calderon-Ramos, I.; Morales, R.D.; Garcia-Hernandez, S.; Ceballos-Huerta, A. Effects of immersion depth on flow turbulence of liquid steel in a slab mold using a nozzle with upward angle rectangular ports. ISIJ Int. 2014, 54, 1797–1806. [Google Scholar] [CrossRef] [Green Version]
  43. Arcos-Gutierrez, H.; Barrera-Cardiel, G.; de Jesús Barreto, J.; Garcia-Hernandez, S. Numerical Study of Internal SEN Design Effects on Jet Oscillations in a Funnel Thin Slab Caster. ISIJ Int. 2014, 54, 1304–1313. [Google Scholar] [CrossRef] [Green Version]
  44. Mizobe, A.; Ueki, M. Design of nozzle for steel continuous casting system based on flow analysis II -Submerged entry nozzle (SEN). J. Adv. Mech. Des. Syst. Manuf. 2018, 12, 1–12. [Google Scholar] [CrossRef]
  45. González-Solórzano, M.G.; Morales, R.D.; Gutiérrez, E.; Guarneros, J.; Chattopadhyay, K. Analysis of Fluid Flow of Liquid Steel through Clogged Nozzles: Thermodynamic Analysis and Flow Simulations. Steel Res. Int. 2020, 1–14. [Google Scholar] [CrossRef]
  46. Launder, B.E.; Spalding, D.B. The numerical computation of turbulent flows. Comp. Meth Appl. Mech. Eng. 1974, 3, 269–289. [Google Scholar] [CrossRef]
  47. Fluent Inc. Fluent Guides; Fluent Inc.: Lebanon, NH, USA, 2007. [Google Scholar]
  48. Sun, C.; Guo, Y.; Li, Q.; Shen, Z.; Zheng, T.; Wang, H.; Ren, W.; Lei, Z.; Zhong, Y. Numerical Simulation on Saffman Force Controlled Inclusions Removal during the ESR Process. Metals 2020, 10, 647. [Google Scholar] [CrossRef]
  49. Holland, F.A.; Bragg, R. Fluid Flow for Chemical Engineers, 2nd ed.; Butterworth-Heinemann: Oxford, UK, 1973; pp. 89–93. [Google Scholar] [CrossRef]
  50. Ni, P.; Jonsson, L.; Ersson, M.; Jönsson, P. Turbulent Flow Phenomena and Ce2O3 Behavior during a Steel Teeming Process. ISIJ Int. 2013, 53, 792–801. [Google Scholar] [CrossRef] [Green Version]
  51. Zhang, L.; Wang, Y.; Zuo, X. Flow Transport and Inclusion Motion in Steel Continuous-Casting Mold under Submerged Entry Nozzle Clogging Condition. Metall. Mater. Trans. 2008, 39, 534–550. [Google Scholar] [CrossRef]
  52. Yokoya, S.; Takagi, S.; Ootani, S.; Iguchi, M.; Marukawa, K.; Hara, S. Swirling Flow Effect in Submerged Entry Nozzle on Bulk Flow in High Throughput Slab Continuous Casting Mold. ISIJ Int. 2001, 41, 1208–1214. [Google Scholar] [CrossRef] [Green Version]
  53. Yokoya, S.; Westoff, R.; Asako, Y.; Hara, S.; Szekely, J. Numerical Study of Immersion Nozzle Outlet Flow Pattern with Swirling Flow in Continuous Casting. ISIJ Int. 1994, 34, 889–895. [Google Scholar] [CrossRef]
Figure 1. Geometries including dimensions of the model (mm), (a) upper view of the mold, (b) lateral view of the mold, (c) nozzle A dimensions, (d) nozzle B dimensions, (e) nozzle A and B on a perspective view, and (f) computational mesh with some close views.
Metals 10 01420 g001
Figure 2. Schematic representation of the three zones of the fluid flow in the pipe and inclusion trajectories.
Metals 10 01420 g002
Figure 3. Touching inclusion percentage at the nozzle wall for nozzle A and Nozzle B.
Metals 10 01420 g003
Figure 4. Touching inclusion distribution along both nozzle types for three inclusion sizes: 1 μm (a,b,g,h), 40 μm (c,d,i,j) and 100 μm; (e,f,k,l), (a,c,e,g,i,k) Nozzle A, (b,d,f,h,j,l) Nozzle B.
Metals 10 01420 g004
Figure 5. Touching inclusion percentage as function of the nozzle length for three inclusion sizes (a) Nozzle A and (b) Nozzle B.
Metals 10 01420 g005
Figure 6. (Color) (a,b) Contours of velocity in a vertical view for Nozzle A and Nozzle B.
Metals 10 01420 g006
Figure 7. Velocity magnitude calculated at three lines along both nozzle lengths.
Metals 10 01420 g007
Figure 8. (a,c) Contours of turbulent kinetic energy at the central symmetrical plane and (b,d) turbulent kinetic energy magnitude calculated in tree lines along both nozzle lengths.
Metals 10 01420 g008
Figure 9. Thickness of the laminar sub-layer as function of the nozzle Length for (a,b) Nozzle A and (c,d) Nozzle B.
Metals 10 01420 g009
Figure 10. Schematic deposition of the inclusion distribution along the nozzle length for (a) Nozzle A and (b) Nozzle B considering several inclusion sizes.
Metals 10 01420 g010
Figure 11. Deposition inclusion percentage as function of the nozzle length for three inclusion sizes (a) Nozzle A, (b) Nozzle B.
Metals 10 01420 g011
Figure 12. Deposition inclusion percentage for Nozzle A and B.
Metals 10 01420 g012
Figure 13. (Color) Comparison between the flow behavior through tracer injection, at the instant of 4 s for the mathematical and physical models.
Metals 10 01420 g013
Figure 14. Comparison between the deposited zones for the real nozzle and the simulated nozzle. Reproduced with permission from [45], Wiley-VCH GmbH, 2020.
Metals 10 01420 g014
Publisher’s Note: MDPI stays neutral with regard to jurisdictional claims in published maps and institutional affiliations.

