Article

Optimization of Open Die Ironing Process through Artificial Neural Network for Rapid Process Simulation

1
RINA Consulting Centro Sviluppo Materiali, Via di Castel Romano 100, 00128 Roma, Italy
2
Dipartimento di Ingegneria, Università degli Studi di Perugia, Via G. Duranti 93, 06125 Perugia, Italy
*
Author to whom correspondence should be addressed.
Metals 2020, 10(10), 1397; https://doi.org/10.3390/met10101397
Submission received: 24 September 2020 / Revised: 12 October 2020 / Accepted: 18 October 2020 / Published: 21 October 2020
(This article belongs to the Special Issue Mechanical Properties and Microstructure of Forged Steel)

Abstract

:
The open die forging sequence design and optimization are usually performed by simulating many different configurations corresponding to different forging strategies. Finite element analysis (FEM) is a tool able to simulate the open die forging process. However, FEM is relatively slow and therefore it is not suitable for the rapid design of online forging processes. A new approach is proposed in this work in order to describe the plastic strain at the core of the piece. FEM takes into account the plastic deformation at the core of the forged pieces. At the first stage, a thermomechanical FEM model was implemented in the MSC.Marc commercial code in order to simulate the open die forging process. Starting from the results obtained through FEM simulations, a set of equations describing the plastic strain at the core of the piece have been identified depending on forging parameters (such as length of the contact surface between tools and ingot, tool’s connection radius, and reduction of the piece height after the forging pass). An Artificial Neural Network (ANN) was trained and tested in order to correlate the equation coefficients with the forging to obtain the behavior of plastic strain at the core of the piece.

1. Introduction

Forged steels represent a quite interesting material family, both from a scientific and commercial point of view, following many applications they can be devoted to [1]. Moreover, it is essential to deeply understand the relations between properties and microstructure and how to drive them by process [2,3,4,5,6]. Such steels are widely applied in the machining and forming industry [7,8,9], in automotive applications [10], and in other fields including aerospace, transport, and precision industries [11,12,13]. Moreover, along with the development of the energy industry and the growing power of power engineering devices, the demand for large-sized hot-forged products has also increased. This includes turbine shafts (water, gas, steam), rotors for wind, and gas power generators [14]. The forecast of the Forging Industry Association (FIA) regarding the steady increase in demand for forgings used in the power engineering and oil industries was confirmed at the 20th International Forgemasters Meeting (IFM’2017) in Austria. Furthermore, based on data from EUROFORGE (an organization that associates European production associations, including the Polish Forge Association), the volume of forged products has been growing steadily, and in 2020 it will reach over 10 million tons. The global forging market is likely to grow significantly at a compound annual growth rate (CAGR) of close to 8%, reaching USD 111.1 billion by 2020, according to Technavio’s latest report [15].
In all the above applications, forgings are adopted following a requirement in terms of increasing manufacturing economic efficiency and enhancing mechanical properties, such as high strength, wear resistance, hardness, and toughness [16,17].
Free forging is the oldest forging method commonly adopted to forge heavy charge materials in short production runs. High-pressure hydraulic forging presses are on the other hand used in open die forging of heavy steel forgings (carbon, alloy, high-alloy, stainless and other steels). Open die forging is an incremental forging process that is mainly used to produce large parts requiring high mechanical properties and reliability of the forged parts [16]. In the steel industry, there is a need to produce several large components characterized by high weight, which require high press loads. Such components can be spindles, rolls for rolling mills as well large turbine shafts and nuclear reactor vessels [18,19]. In the open die forging process, the workpiece is processed using dies, which can be flat or shaped (e.g., concave or V-shape). The piece undergoes a plastic deformation at high temperature when is pressed by a series of multiple strokes along the feed direction. In this way the piece changes both its geometry and internal properties [20].
The forging process is able to reduce many defects induced by casting process (e.g., cavities, porosities), thus allowing to manufacture almost defect free pieces by assuring a homogeneous plastic strain in the workpiece [21,22]. The quality of the open die forging process depends on several parameters such as die width, the shape of the die, die overlap, die stagger, ingot shape and dimensions, temperature gradient, pass schedule, and so on [23]. In order to achieve the requirements in term of geometric tolerance and internal quality, it is common practice to set up an appropriate pass schedule which has to be verified using numerical simulations. In order to do that, in the case of forging sequence design and optimization, it is necessary to simulate many different configuration corresponding to different forging strategies in order to identify the best solution. FEM is one of the most commonly adopted approach, anyway, it is reported that it requires significant efforts in terms of both computational resources and time [24,25].
The second limitation of the FEM approach in designing the forging strategy: in fact, it is not always possible to predict process conditions because the manufacturing processes are often quite unpredictable if compared with pilot or laboratory process, as often adopted to validate the simulate. For this reason, it is useful to develop fast calculation models of the open die forging process that allow to perform a rapid calculation of material properties during the layout of the process as well for the online monitoring of the process.
In the past, some authors dedicated to the development of fast models oriented to open die forging process optimization [26,27,28,29,30]. The common idea at the base of the above works was to develop process models able to combine data from online measurements and a simplified plasto-mechanical model for the forecasting of the equivalent strain, strain rate, and the temperature in the core of the forged piece. The final aim of such models is to optimize the stretching forging not only from a geometric point of view but also in terms of final microstructure, internal quality (e.g., casting porosity closure), working temperature to avoid phase transformation during the mechanical processing. Kim et al. [27] developed forging pass schedule algorithms based on artificial neural networks (ANN) are mainly oriented to calculate the optimum number of passes and reduction in each pass to economize power and minimize the forging cycle time. The algorithms were trained on the experimental data from pilot and full-scale industrial forging.
Starting from the approach reported in [28,29,30], a new formulation based on artificial neural networks (ANN) [31,32] is proposed in this work to quickly (fraction of a second) and correctly evaluate the plastic strain at the core of the piece. Starting from the coefficients for the new analytical model, a neural network has been implemented and trained using analytic coefficients in order to obtain a fast estimation of the plastic strain that is able to allow rapid and accurate evaluation of deformation occurring during the forging process. The correct evaluation of plastic strain at the core fiber of the forged product is a parameter to consider in a tool that aims at the internal integrity of the material or the final microstructure optimization.

2. Methods

2.1. FEM Model for Open-Die Forging of 42crmo4 Steel Grade

The open die forging of large products is a very complex process made of a sequence of several forging operations like upsetting, cogging, drawing, also including the furnace soaking to reheat the pieces between deformation steps. In order to fulfill the final requirements for the product, the understanding and prediction of microstructures that develop during deformation processing are necessary. In the stretching forging process, the pass sequence is roughly square or round to octagon to round, where the reduction ratio only varies every second pass. In the considered pass sequence, the round is forged to an oval section with a given height reduction, turned 90°, and then forged again with the same reduction and same bite ratio, producing a square cross-section. The newly obtained square bar is then forged into an octagonal bar, which is an intermediate shape between square and round. Finally, the round bar is produced in successive passes by deforming the octagonal bar. The octagonal bar has a greater cross-sectional area than the final round bar. The round bar is finished in a round-contoured die during the finishing passes. Figure 1 shows the overall forging sequence from a square billet to a round bar.
Simulation of the stretching forging process of a 42CrMo4 steel has been performed by an FE model developed using the commercial code MSC.Marc. Such code is well known for being characterized by a high accuracy tool for closed and open die forging process simulation [33,34,35]. The strokes start in the central part of the piece and proceed until the 4th stroke as shown in Figure 1.
In order to have accurate predictions from the model it is important to adopt proper material models to describe the flow stress. For this reason, laboratory compression tests are usually conducted at the Gleeble on cylindrical specimens with different temperatures, strains, strains rates, post deformation holding times to characterize the flow stress, static recrystallization and grain size evolution during forging. The rheology has been modelled following the model in [36].
At a first stage, some forging relevant parameters have been chosen in order to simulate the deformation process, such as: ingot diameter D, on contact die length Sb0, forged piece temperature, percentage reduction. The chosen die has a flat shape, and the numerical values of the parameters adopted to implement the FEM model are shown in Table 1, which corresponds to about 600 simulations after Design of Experiment (DOE).
In Figure 2 it is possible to notice that the total equivalent plastic strain reaches the maximum value below the right side of the flat die. This effect is mainly due to the presence of the manipulator that, blocking the ingot as shown in Figure 1, causes a peak of plastic strain of about 1.02 (the amount of the deformation depends on forging conditions). This effect is in common for every simulated case.
An example of FEM 3D map results in terms of total equivalent plastic strain at the core of the piece is reported in Figure 3. The model was implemented considering a double symmetry in longitudinal and radial directions and a constraint as in Figure 1 in order to consider the presence of the manipulator during the forging process. From a thermic point of view, the calculation was carried out considering isothermal condition, without exchange between ingot and external environment and tools in order to separate the thermal effect from the mechanical one on the plastic strain at the core of the ingot.
Figure 2 and Figure 3 show the typical distribution of plastic deformation through the ingot radius and longitudinal direction with the maximum value of deformation reached in the contact area between tools and ingot closest to the manipulator. In the thickness, the deformation distribution takes on the classic v-shape with the relative maximum on the core fiber [37] for the considered ratio between contact die length and ingot diameters (Sb0/D).

2.2. Analytical Model for Open Die Process Simulation

A prior analysis of FEM results in terms of plastic strain at the core of the forged piece (Figure 4) has been carried out in order to represent the plastic strain at the center of the piece.
An example of output of the FEM thermo-mechanical simulation follows the evolution reported in Figure 5 concerning the evolution of plastic strain as a function of length at 1200 °C, Sb0 = 300 mm, reduction = 25%. As shown in Figure 5, the simulated forging process is characterized by a first stroke characterized by a major contact zone due to the fact that during the first stroke the material is not yet deformed. The last three strokes follow the same evolution.
In this work a separation of the strokes was performed in order to distinguish each one and apply the analytical model and the neural network separately. Moreover, because the strokes following the first follow similar behavior in terms of maximum plastic strain, only the first and the second strokes could be considered in the analysis.
According to [37] the distance between the growth and decay phase of plastic strain on ingot core fiber increases while the ratio Sb0/D decreases. This effect is showed in Figure 5: comparing the first stroke (Sb0/D = 1.0) and the subsequent (Sb0/D = 0.9), it is possible to note that, with a pitch equal to 90%, the Sb0 is reduced to 270 mm. A double sigmoidal function has been chosen to represent the evolution of the core fiber plastic strain of a single stroke [38,39]. The sum of two hyperbolic tangents (Equation (1)) has been implemented in order to better reproduce the plastic strain evolution at the core of the forged piece along the ingot axis. The growth phase and decay phase of plastic strain are represented by Equations (2) and (3). Equation (1) varies from 0 to 2 and is continuously derivable and defined throughout the Real numbers domain, therefore it can be used without problems in an optimization system.
ε t o t p   =   M * (   tan h ( x   C 1 D 1 )   +   tan h ( x   C 2 D 2 ) )
ε 1 p   =   tan h ( x   C 1 D 1 )
ε 2 p   = tan h ( x   C 2 D 2 )
Coefficients in Equations (1)–(3) are respectively:
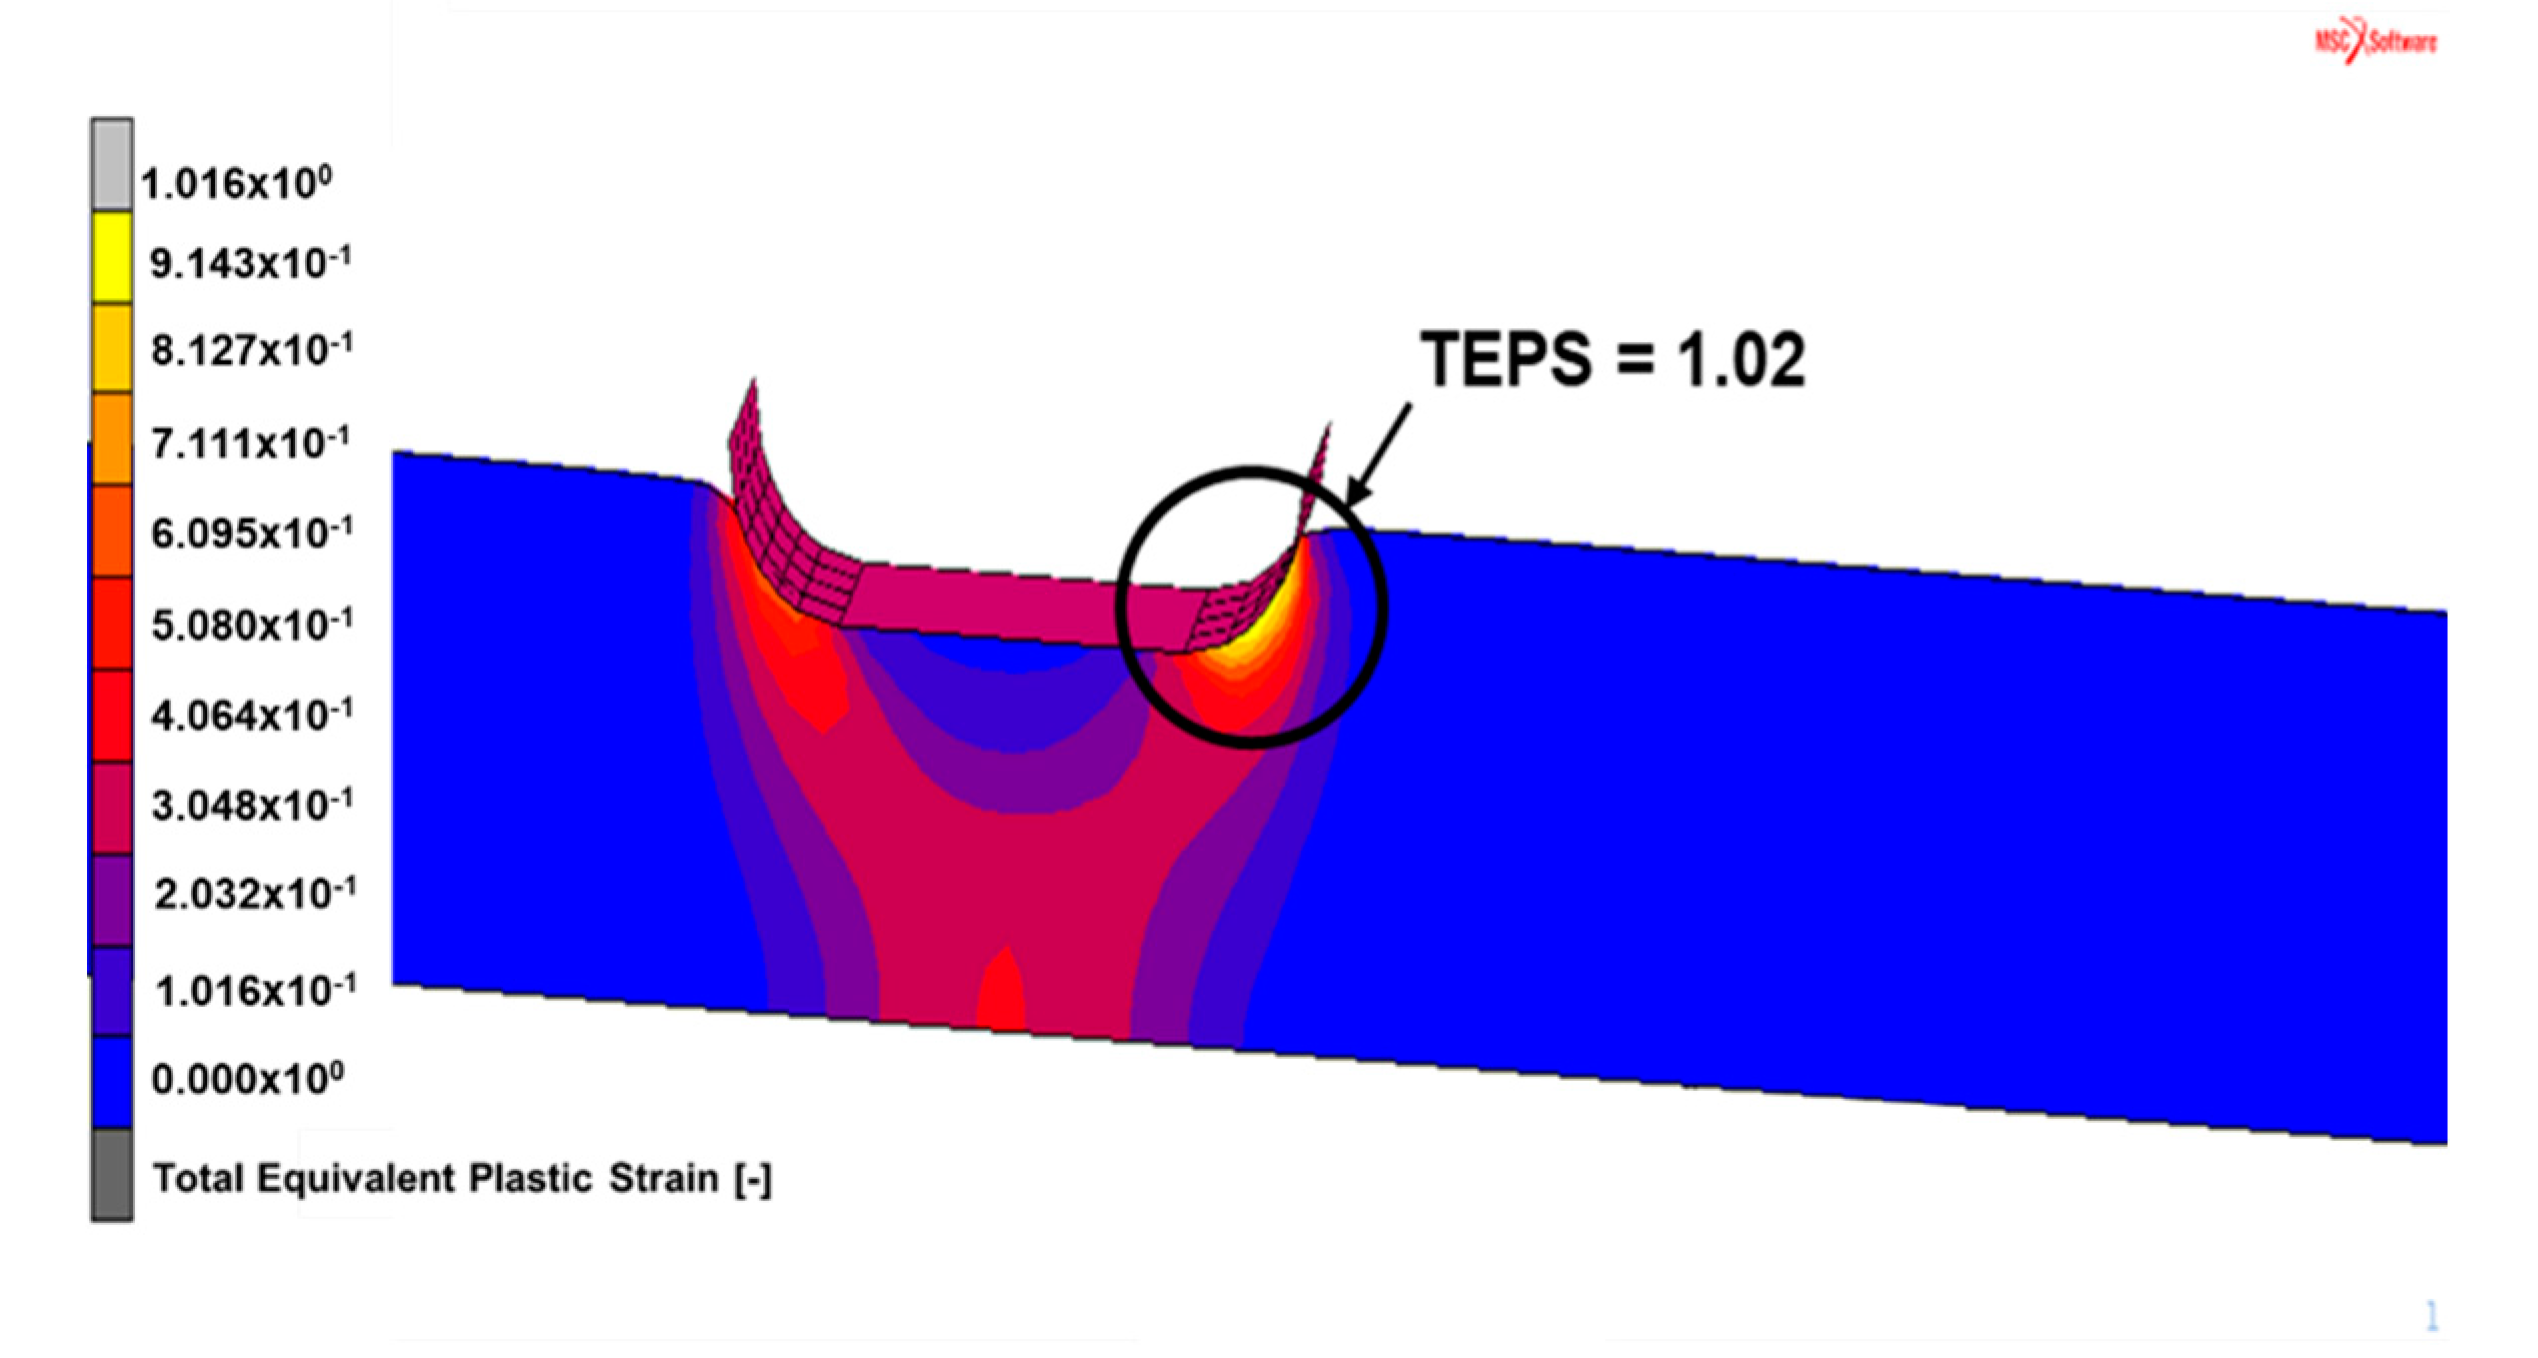
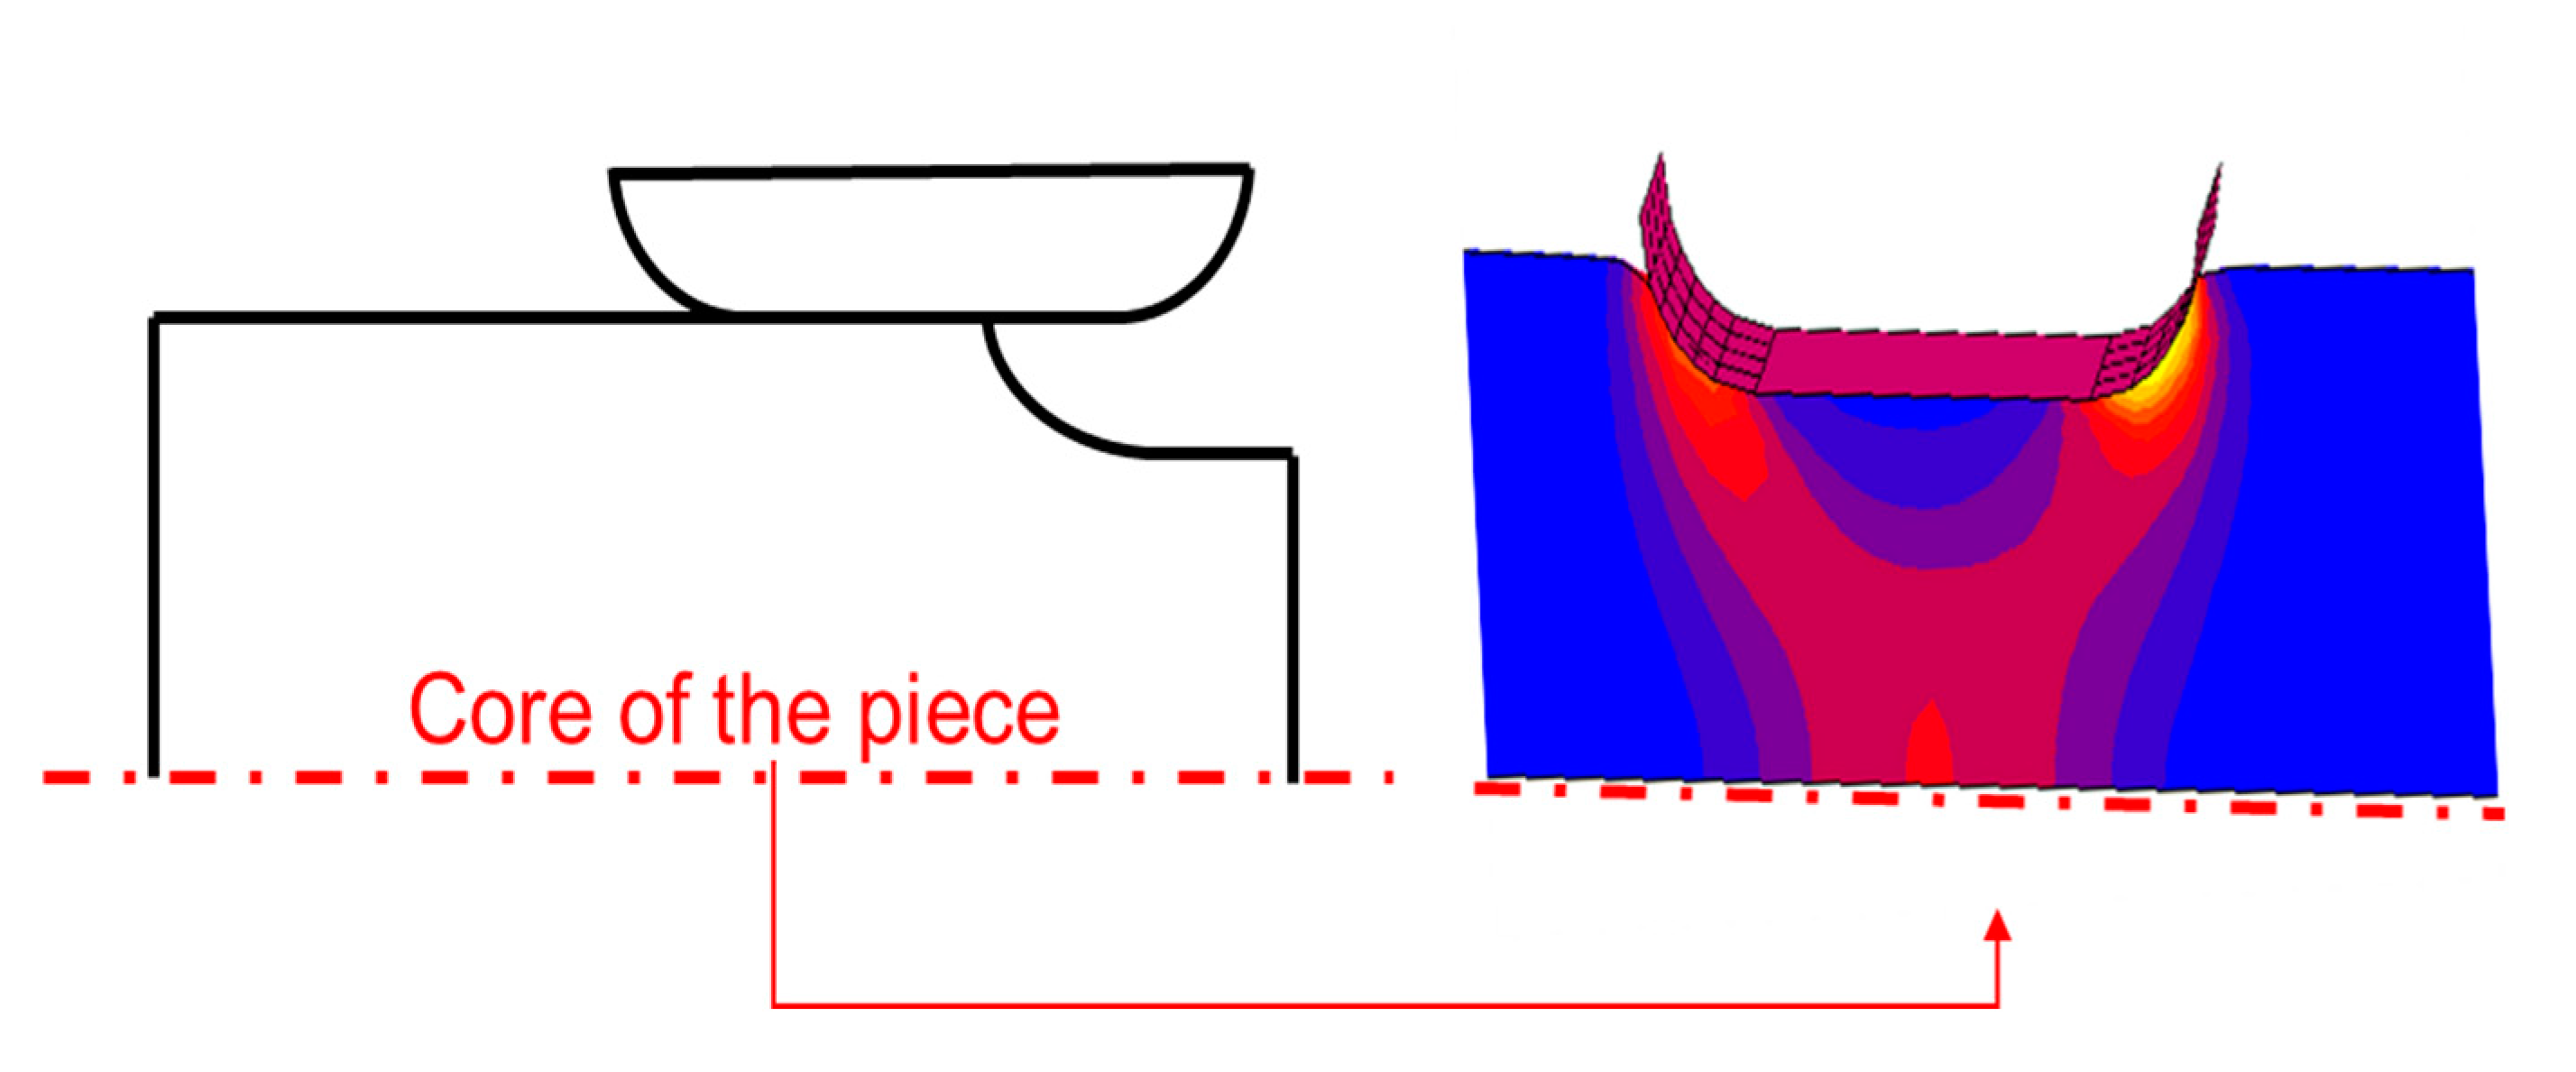
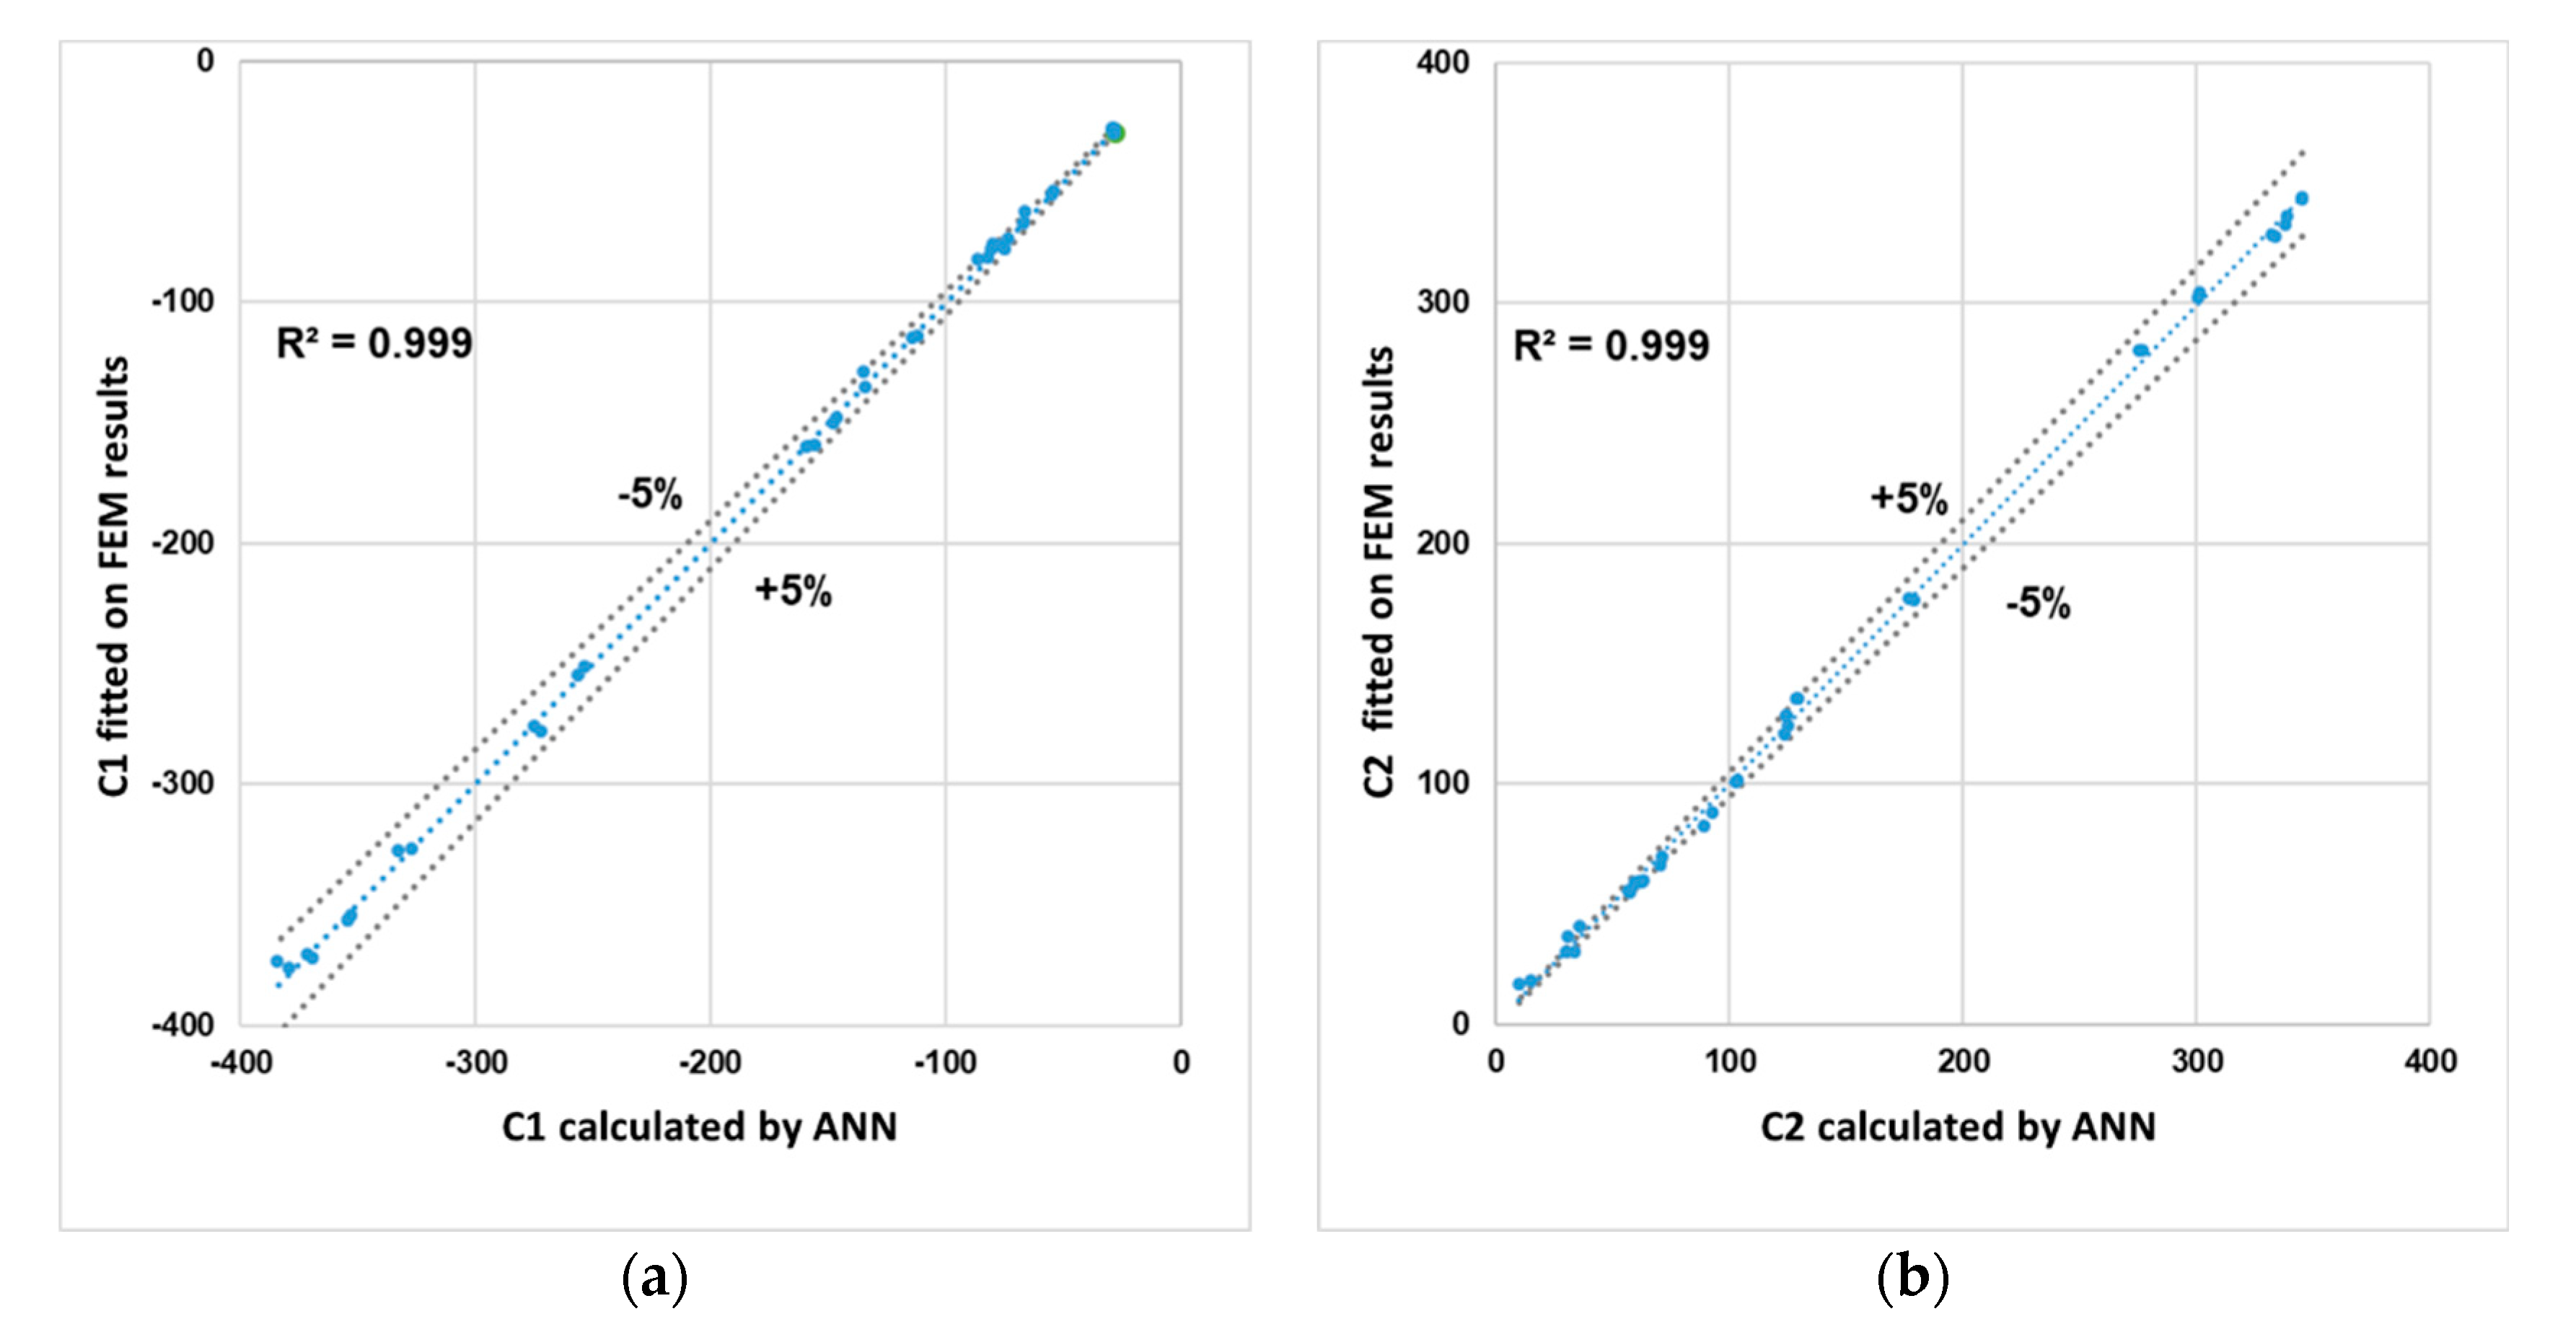
  • C1 and C2 represent the middle points of growth and decay phase respectively. In order to identify the inflection point for each sigmoidal branch, an analysis has been carried out on FEM results, identifying the point with the 50% of the maximum plastic strain at the core fiber.
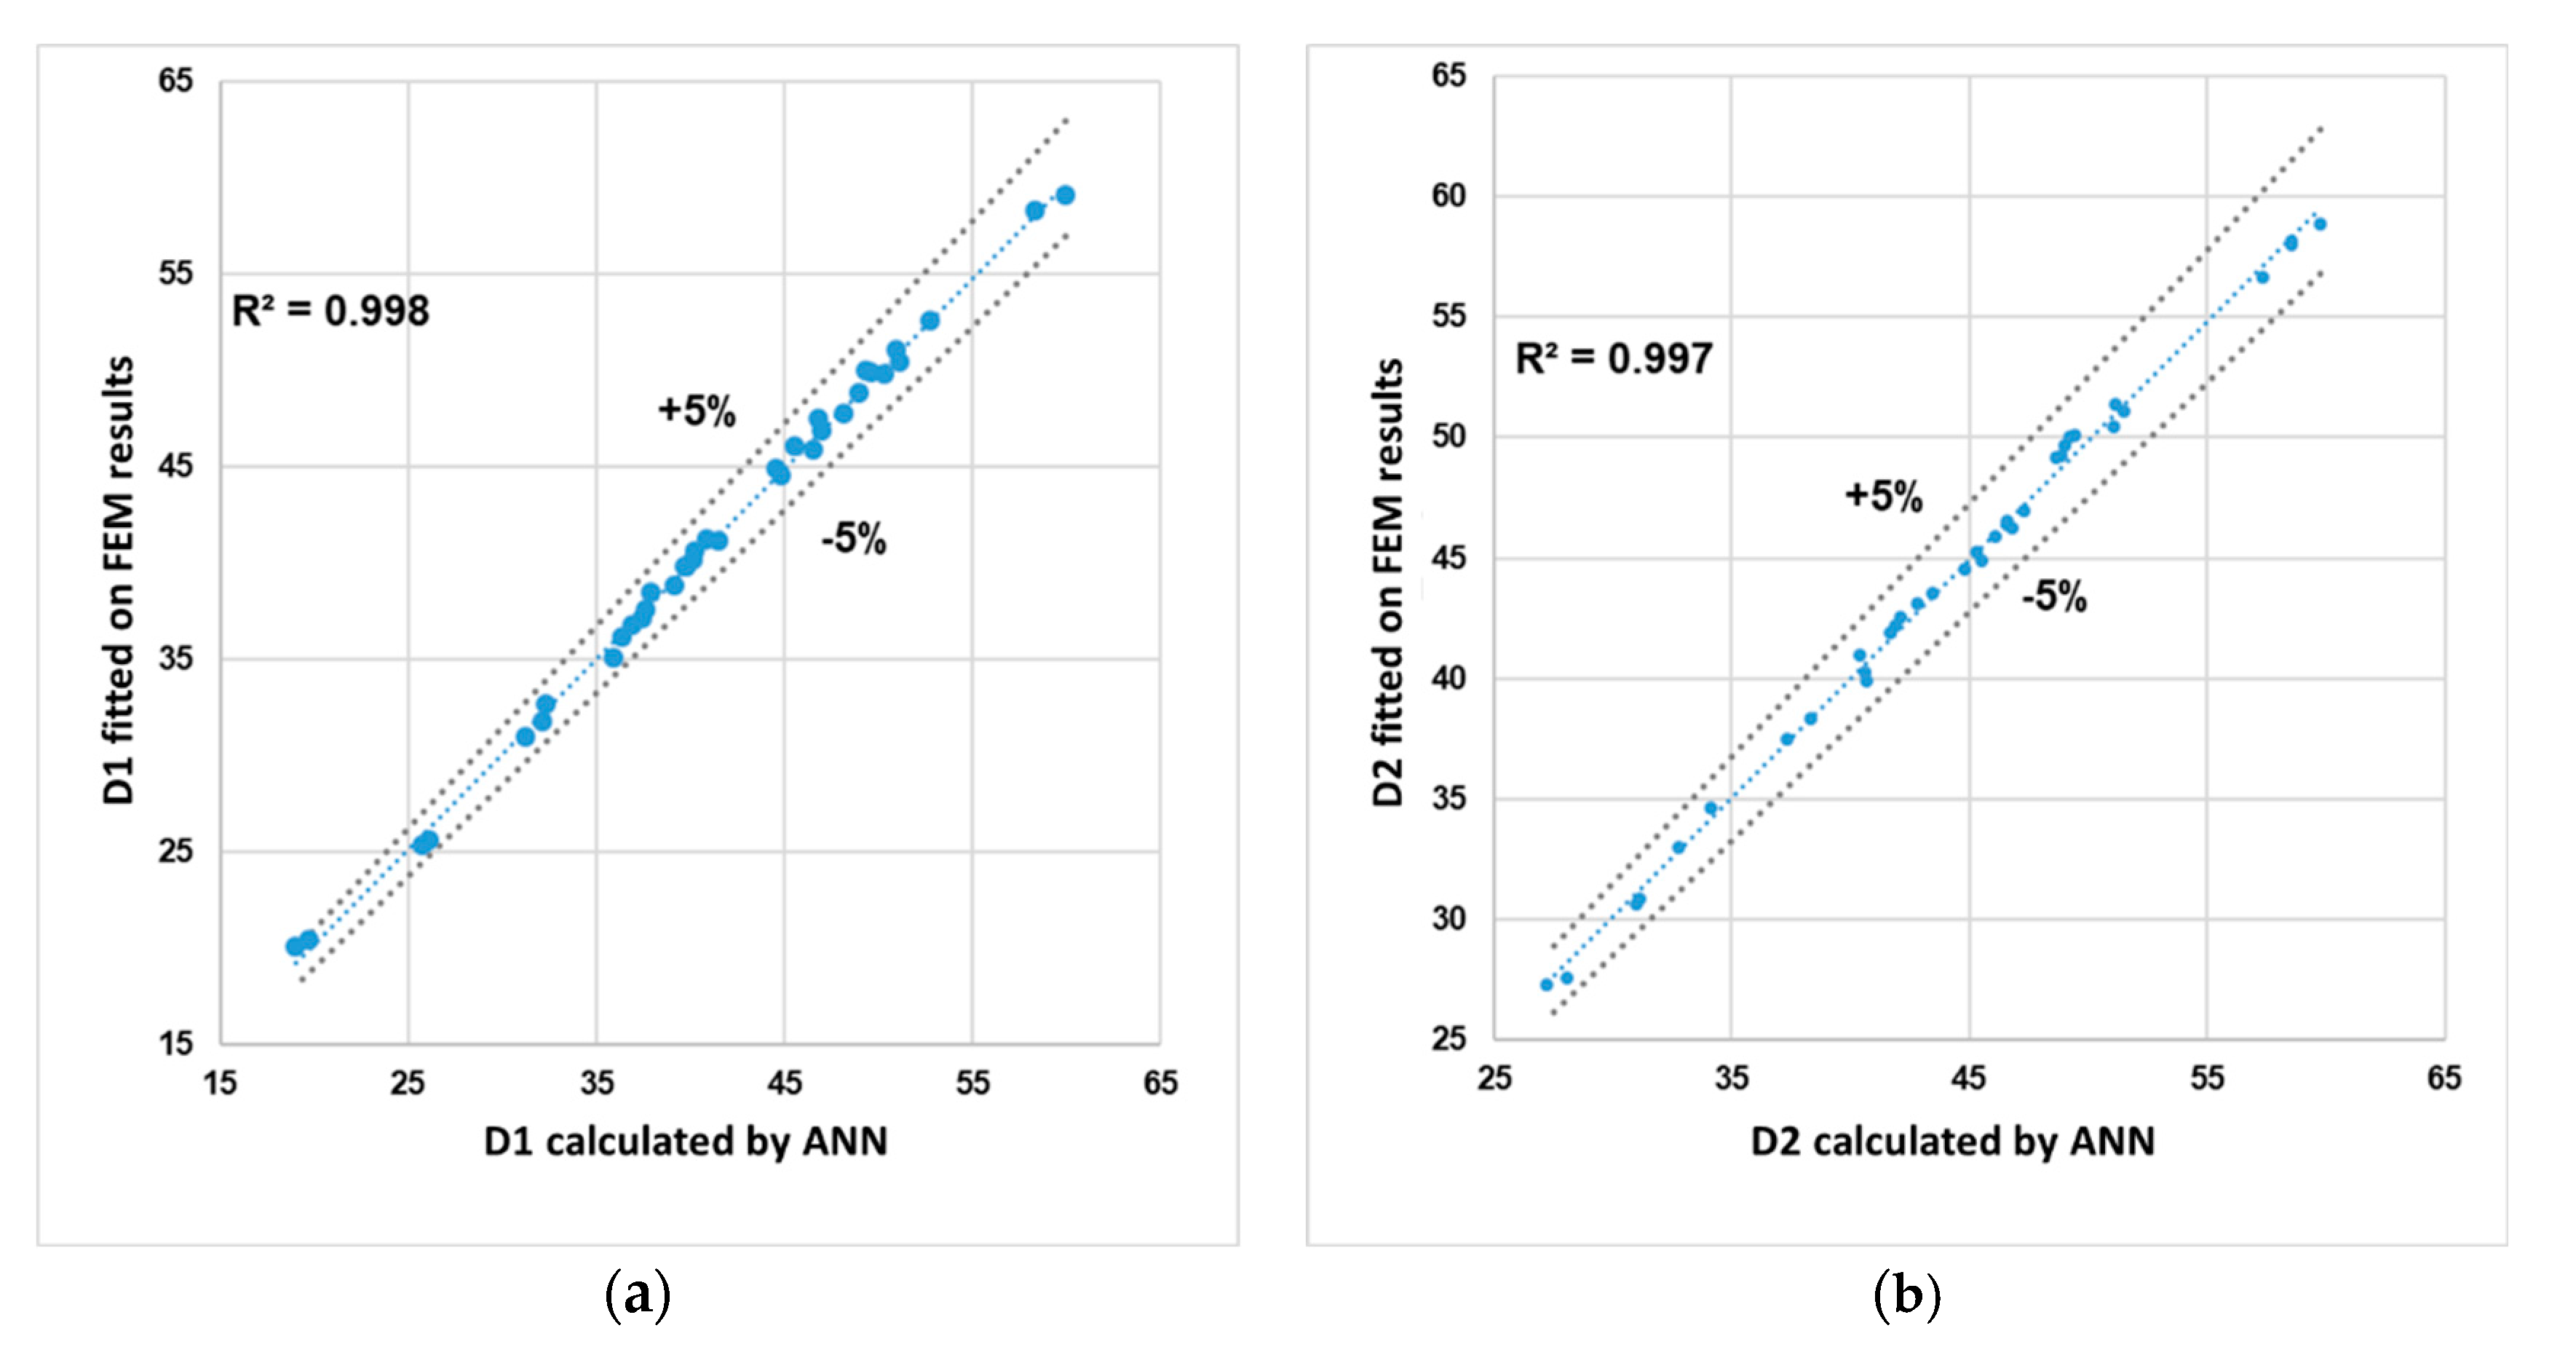
  • D1 and D2 represent the slopes of the growth and decay branches of the function.
  • M is a multiplier coefficient. The Equation (1) varies in a range between 0 and 2, thus the coefficients M brings the maximum of double-sigmoidal curve to the maximum of plastic strain.
The coefficients C1, C2, D1, D2 and M have been obtained by fitting of double-sigmoidal model on the FEM results in terms of total equivalent plastic strain along the core fiber for each forging configuration considered in this analysis. The obtained coefficients do not have an identified mathematical dependence by forging parameters. The fitting of mathematical model described by Equation (1) to the individual conditions of the forging process could be carried out using a fragmented, look-up table-based approach. This approach has disadvantages due to the required size for the look-up tables and the lack of interpolation capability. The application of neural networks within the control strategy, setup model, and optimization tool has significantly reduced such kind of problems [40]. The obtained coefficients were used to train the proposed neural network.

2.3. Forecasting Models Based on Artificial Neural Networks (ANNs)

The artificial neural networks (ANNs) can be considered nonlinear regressive models, realizing the correlation between a set of independent variables and a set of dependent variables.
Neural networks are mathematical models able to learn from empirical data collected in some problem domain by approximating sample of it in a data set, without any assumption about the physical laws, systems inspired by biological neural networks that constitute brains of animals. This correlation between variables is achieved through a training process during which a data set containing both independent and dependent variables is used to iteratively adapt the internal structure of the neural model to its purpose [41].
Because the functional relationship between causes and effect of the physical phenomena is extracted from the samples, the performance provided by the ANN model is related to the range of variability and accuracy of the data set. Such models are completely different from a Deterministic Model that requires a priori knowledge of the relationships of a system, based on First Principles typically derived from physical, chemical or biological principles. For this reason, high complexity of a problem or the unsatisfactory performance of other techniques (e.g., deterministic model, Linear and Not-Linear multiple regression) are condition for a suitable application of an ANN model. For this reason, artificial neural network models are considered a sort of Black Boxes which do not account the mathematical expression describing the physical phenomenon once the training procedure is finished. The ANN performances are comparable to the correspondent Deterministic model, and are chosen for a fast development of models due to the flexibility to codify relationships between any set of physical variables (real, discrete and Boolean), and an easy integration with resident control system and SW. The Requirement for a stochastic ANN model is mainly the Input/Output (I/O) functional relationship between causes and effect and a set of process observation covering a wide enough range of variability of the variables [31].
Artificial neural networks can be collected in families according to the learning and recall algorithms. The network adopted in this work belongs to the multi-layer perceptron (MLP) family whose learning algorithm is back propagation (BP) [42]. The back-propagation learning algorithm provides the optimal configuration of the weights by calculating the error between the target and the network response. The root mean squared (RMS) error has been adopted as index of performance both for each single output variable and for the output as a whole.
Since these mathematical models are based on data observation, their performance is strongly conditioned by the quality of the data itself. Because the data are provided by the calculation of a FE model and simulations are defined by means of a DOE, no data duplication (similarities) or scattering are present in the data. In this condition, no correction (elimination of similarities) or filtering action are required [41,42]. Clustering analysis was carried out in order to define and identify the cluster, and then for the definition of best neural network topology and number of neural networks. The independent variables of ANN are the forging parameters in terms of workpiece temperature and diameter, Sb0, fitch, reduction and stroke number while the output is in terms of the coefficients of double-sigmoidal function that models total equivalent plastic strain. Input and output data have been normalized within the range 0 and 1 with a linear function between the minimum and maximum value of each quantities, Table 2.
Each node in ANN is fully connected to the nodes of the following layer (hidden or not) through a sigmoidal transferring function and weights whose value is adapted during the learning phase to encode on them the knowledge of the forging process described by the used dataset [42].
The implemented ANN is composed of 1 bias node and a single hidden layer characterized by 13 hidden nodes.
The initial data, that consisted in about 600 examples, has been divided into three groups:
  • Training: about 400 examples;
  • Validation: about 150 examples;
  • Test: about 50 examples.
The examples have been subdivided considering the three main clusters identified during the data analysis.

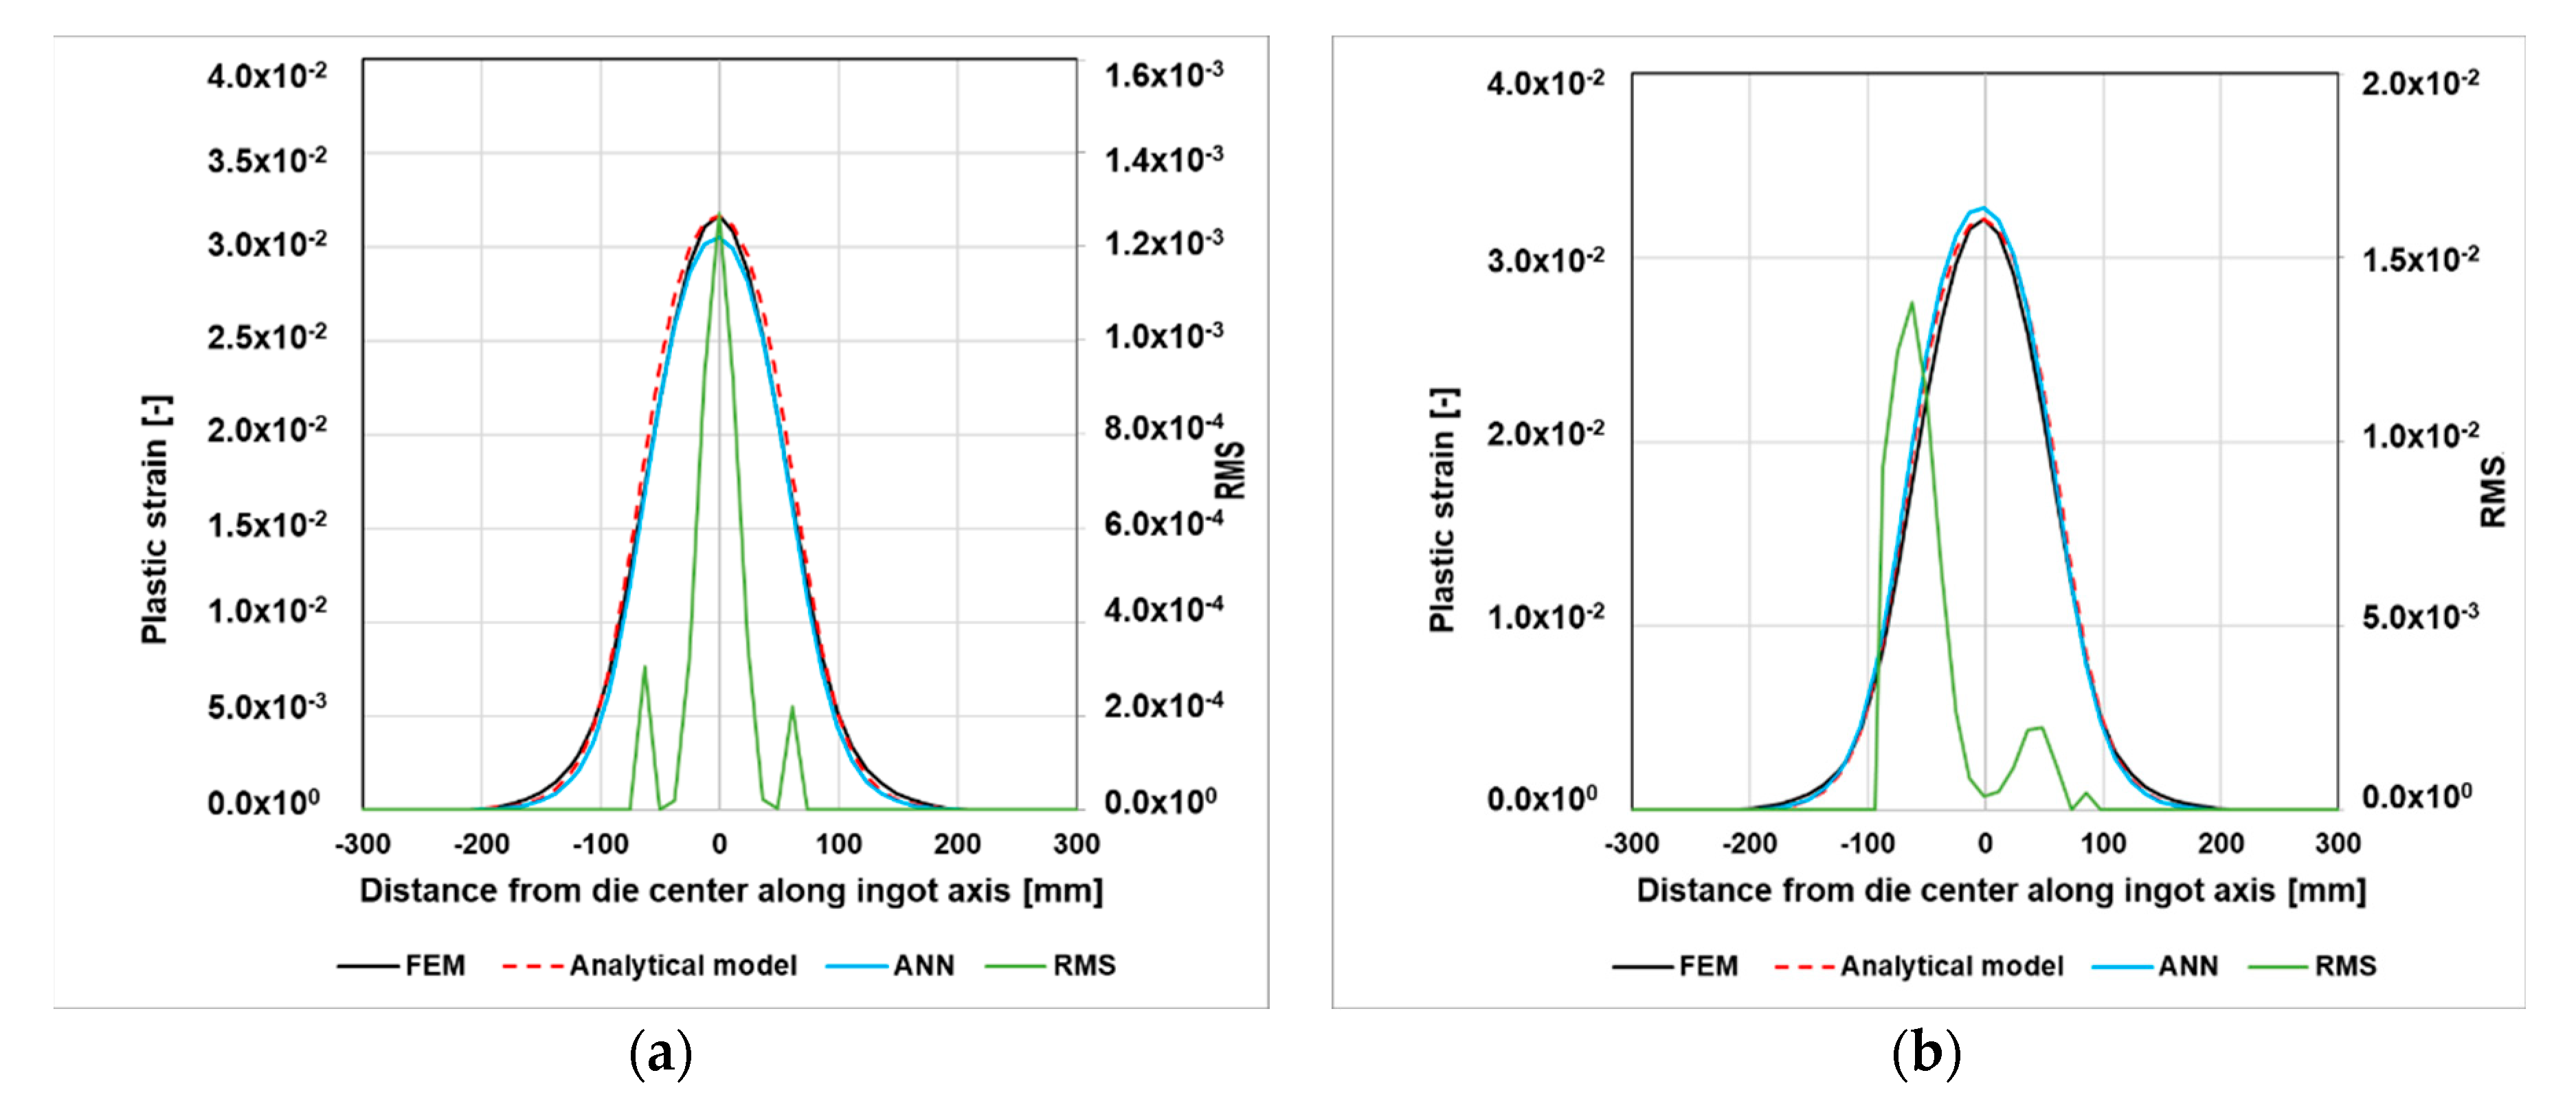
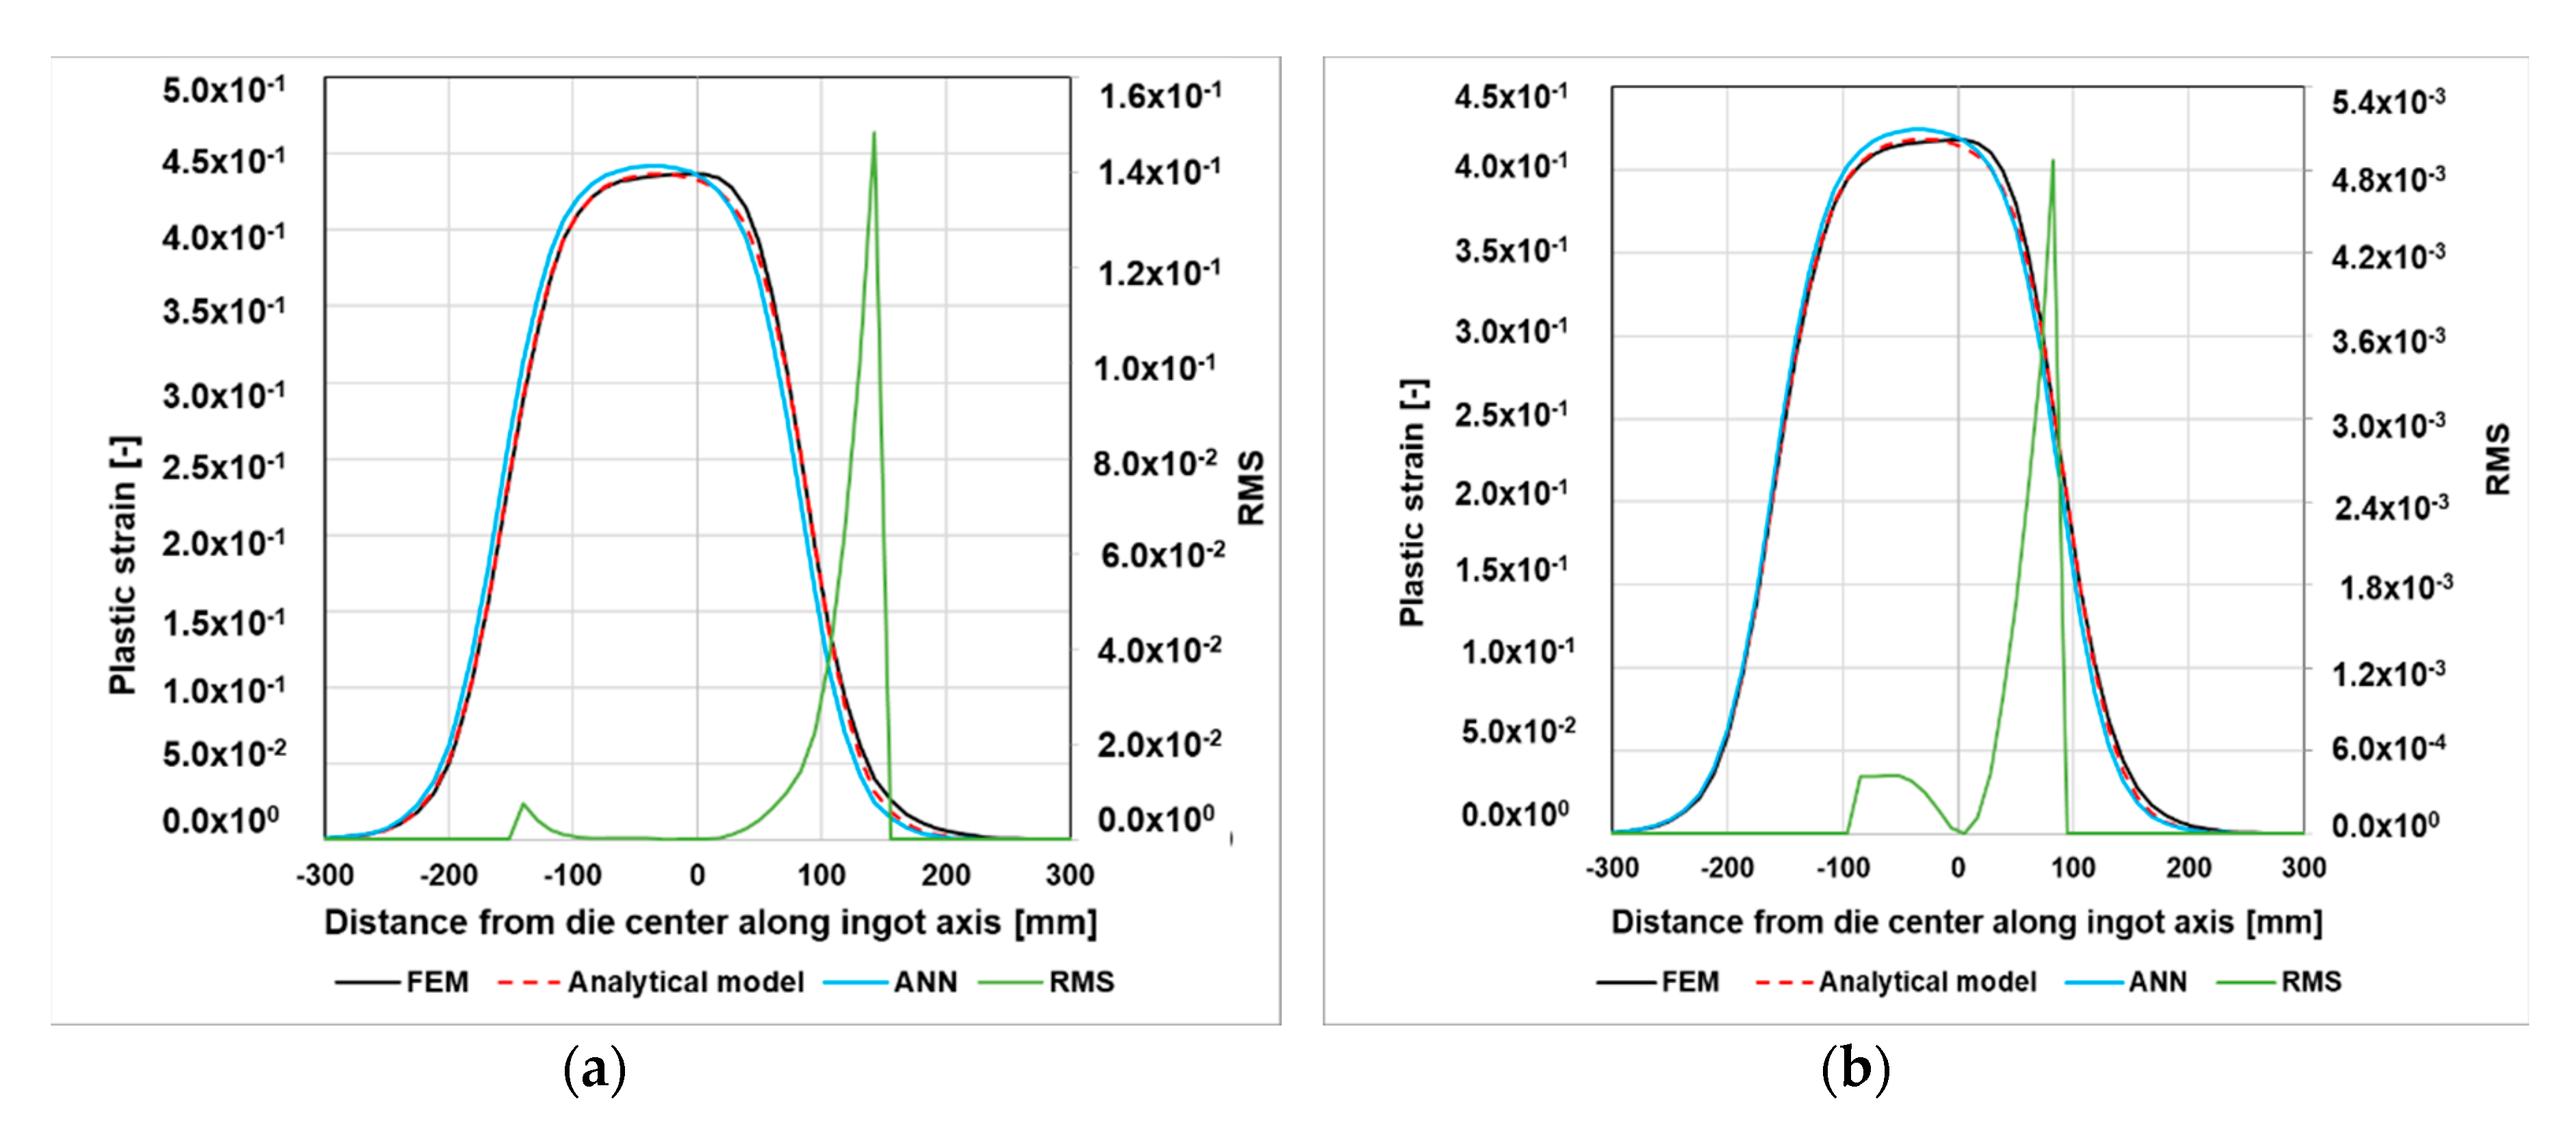
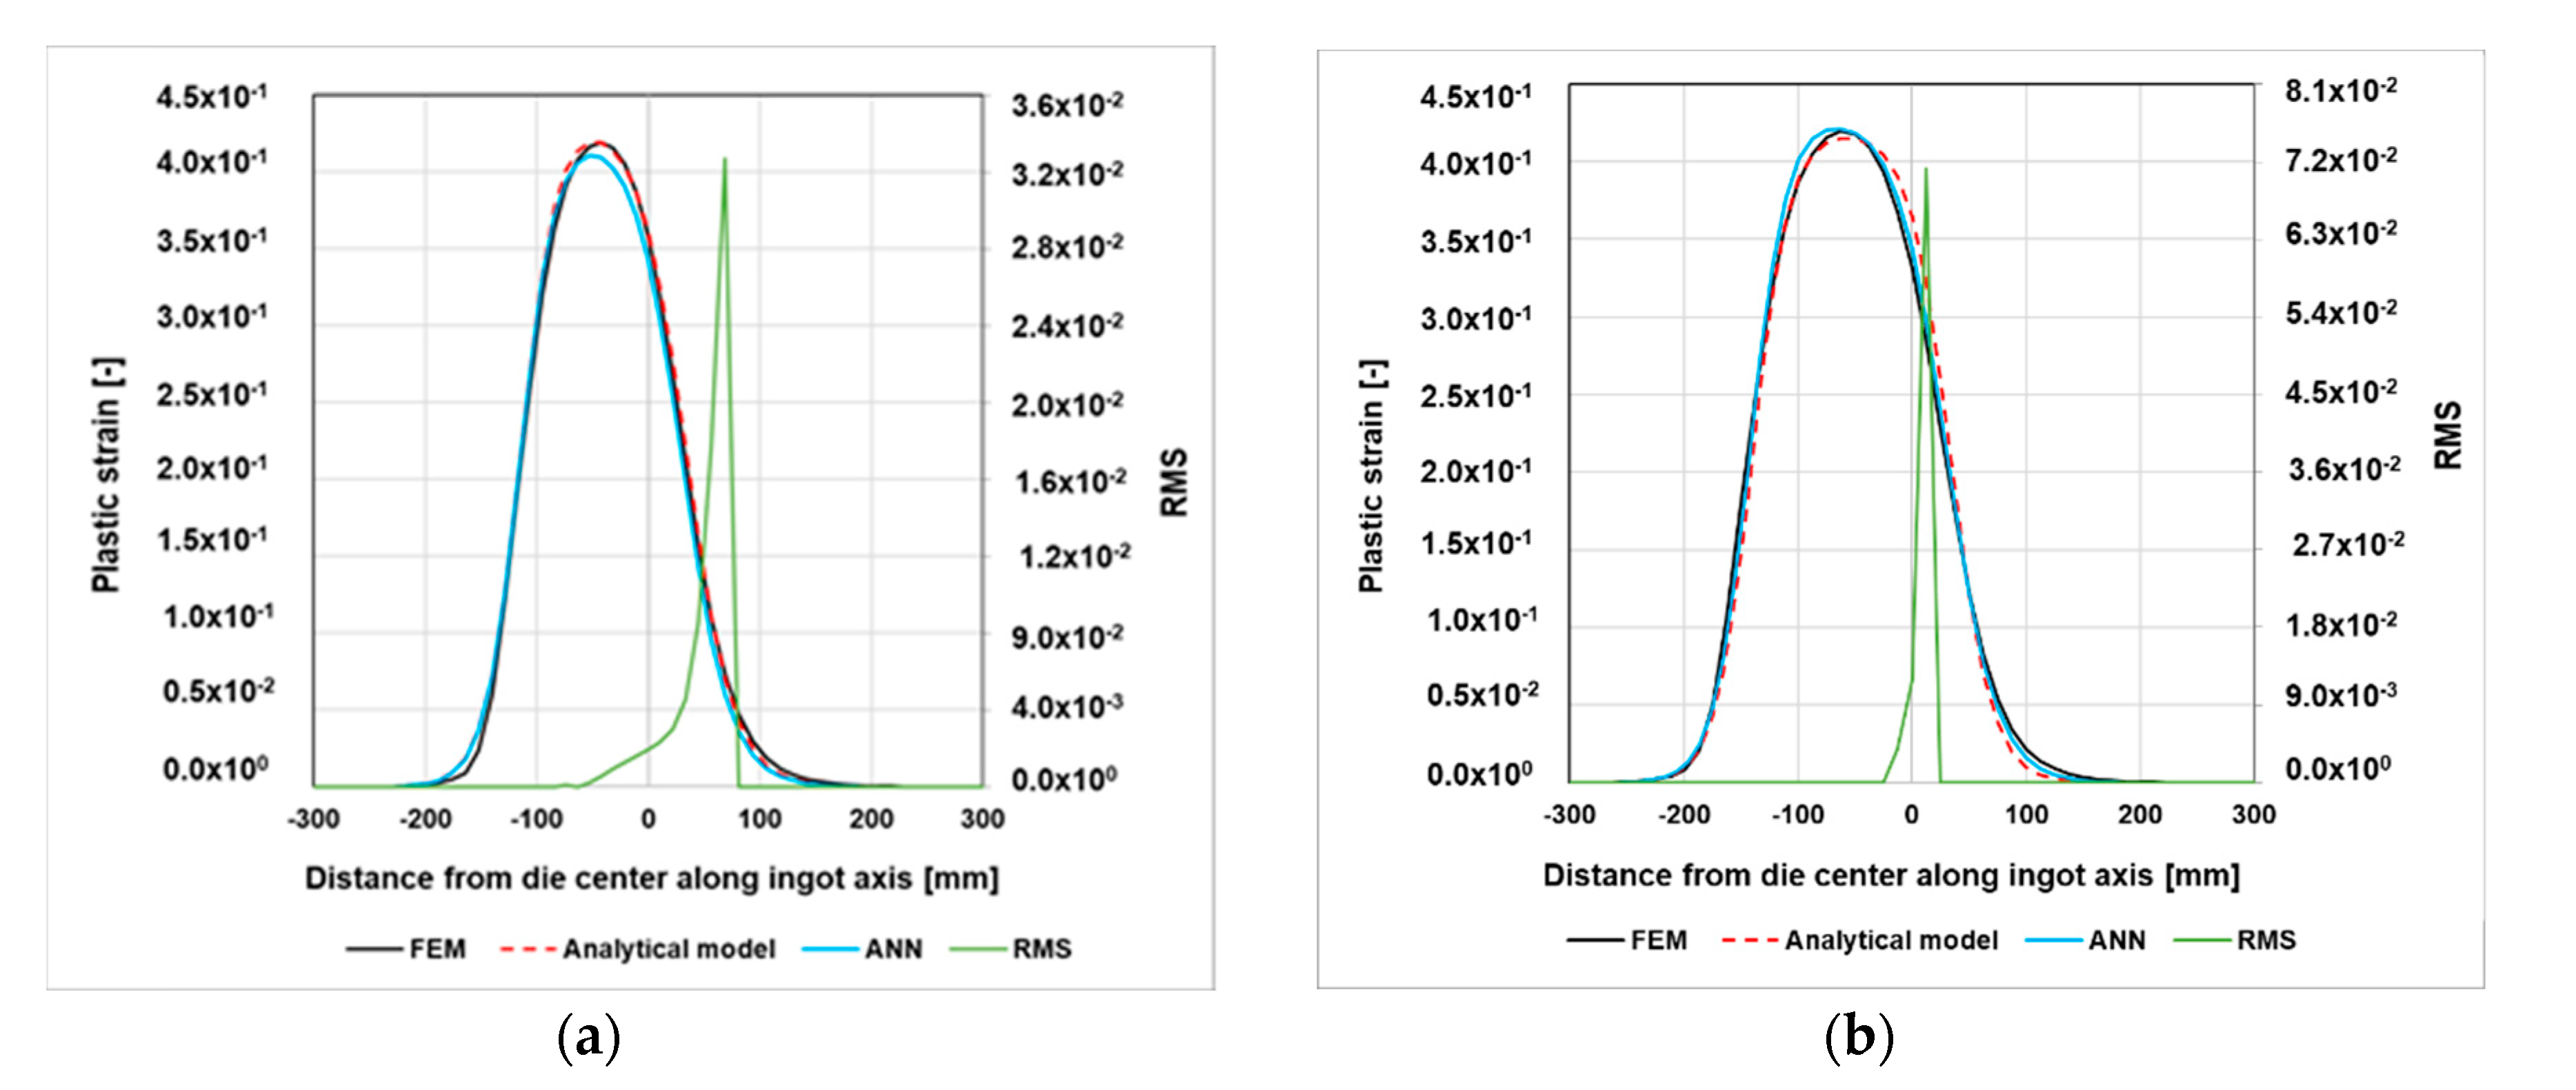
3. Results and Discussion

Figure 6, Figure 7 and Figure 8 report the comparison between the coefficient of Equation (1) fitted on FE results and calculated by ANN concerning the 50 examples used for the tests. The figures show that the data groups into the three identified cluster. The scatter plot related to the C1 and C2 coefficients used to train the ANN coefficients, and the coefficients trained by ANN is reported in Figure 6a,b. Furthermore, R2 is reported in such figures. Results are characterized by little dispersion and the good agreement between the coefficient forecasted by ANN and fitting on FE results is confirmed. In fact, concerning C1, the R2 is approximately 1. Looking at Figure 7 and Figure 8, it is possible to notice that the R2 always remains high, never falling below 0.997.
In the following figures there is a comparison between FEM (black line), analytical model (as obtained by fitting of FEM data, red dot line) and analytical model with coeffects predicted by ANN (blue line) is reported in Figure 9, Figure 10, Figure 11, Figure 12, Figure 13 and Figure 14 in terms of plastic strain dependence on arch length. The RMS deviation (green line) between the neural network and the analytical model results is also reported.
The above comparison for the case corresponding to initial ingot diameter equal to 300 mm, Sb0 = 150 mm, reduction = 5% at 800 °C and 1200 °C is reported in Figure 9a,b, respectively. The proposed modeling approach provides the possibility to have two different slopes of the growth and decay phase of plastic strain (e.g., different D1 and D2 coefficients). This allows to consider the effect of the manipulator nevertheless it is possible to notice that the error peak is in correspondence of the presence of the manipulator, therefore in the decay branch of the double-sigmoid model. This is expected considering that the manipulator induces a small variation from the chosen sigmoidal shape, shifting the inflection point towards 60–70% of the maximum strain value. However, the hybrid approach prosed ANN plus analytic model is able to reproduce the FEM curve with a good accuracy both temperature, 800 °C and 1200 °C (maximum RMS value = 0.07).
A similar trend is shown in Figure 10, concerning the same initial ingot diameter and Sb0 = 150 mm, but with higher reductions (equal to 25%). Also, in this case 800 °C and 1200 °C temperatures are compared. Figure 9 and Figure 10 show that for Sb0 equal to 150 mm temperature variation little affect the maximum of plastic strain and shape of plastic strain on core fiber. Differences on maximum value of plastic strain are equal to 1.4% and 4.4% for the reduction equal to 5% and 25%, respectively, with a material softening from 800 °C to 1200 °C equal to 70% at strain = 0.3 and strain rate = 1 s−1 from 205 MPa to 62 MPa respectively, Figure 11 [43]. his so low influence of rheological behavior is certainly due to of isothermal FE modeling of forging but leads to the conclusion that the proposed approach can be considered independent of the material in the first approximation.
The same is shown in Figure 12 and Figure 13, where plastic strain for first stroke of forging of ingot with 300 mm of initial diameter of the higher reduction considered in this analysis is compared for temperature of 800 °C and 1200 °C considering and Sb0 = 300 mm and 750 mm, respectively. Increasing Sb0 the maximum plastic deformation value on core fiber increases. Moreover, a strong shift away from the growth and decay branches of plastic strain is observed increasing the Sb0/D ratio, as described before. Also, in this case of even larger size of the die, the ANN approach appears to be in good agreement with FEM results, with minimal error.
For the stroke subsequent the first the fitch, and the resulting overlapping of strokes, affects directly the actual Sb0 reducing it. The comparison in Figure 14 shows as the stroke subsequent to the first could be considered, in first approximation, equal to a first stroke with a lower value of Sb0. However, the developed model has been differentiated for the first stroke and the subsequent ones in order to take into account that in the stroke subsequent to the first there are parts of die initially not in contact with the ingot. These will touch parts of ingot already deformed or partially deformed, e.g., deformed by die fillet radius in the previous stroke, upsetting it. This results in an improvement in the performance of the model, e.g., a better agreement between the FEM results and the analytical model with coefficients calculated with the ANN.

4. Conclusions

In this paper a hybrid approach is proposed, able to describe the plastic strain behavior at the core fiber of an open die forged round shape component. Such a method takes into account the following parameters: ingot diameter, die length Sb0, reduction for each stroke and forging temperature. The aim of this approach is to provide a rapid tool faster than the commonly used FEM method but with the same accuracy class, making therefore it suitable for the rapid design of online forging processes. This was accomplished by means of a thermo-mechanical FEM model implemented in the MSC.Marc commercial code in order to simulate the open die forging process.
Starting from the results obtained through FEM simulations, a set of equations describing the plastic strain at the core fiber of the piece have been identified depending on forging parameters. An artificial neural network has been trained to provide the double-sigmoid coefficients as function of forging parameters. The maximum error by proposed model prediction is found at the peak deformation and on the decay branch due to the presence of the manipulator. The results analysis showed the low dependence of strain on core fiber on the material rheology. In the first approximation, therefore, the material properties could be neglected, but this becomes fundamental when microstructural and metallurgical effects are also considered in the optimization model of forging.
The described approach proposes therefore a rapid method aimed to design and optimize a forging open die process, favoring its adoption in industrial applications.

Author Contributions

Conceptualization, S.M. and L.L.; methodology, S.M. and L.L.; software, S.M. and L.L.; validation, S.M. and L.L.; formal analysis, S.M. and R.M.; investigation, S.M. and L.L.; resources, L.L.; data curation, S.M. and R.M; writing—original draft preparation, S.M.; writing—review and editing, S.M., A.D.S., L.L., G.Z. and R.M.; visualization, A.D.S., L.L.; supervision, A.D.S. All authors have read and agreed to the published version of the manuscript.

Funding

This research received no external funding.

Conflicts of Interest

The authors declare no conflict of interest.

References

  1. Di Schino, A. Manufacturing and application of stainless steels. Metals 2020, 10, 327. [Google Scholar] [CrossRef] [Green Version]
  2. Pezzato, L.; Gennari, C.; Chukin, D.; Toldo, M.; Sella, F.; Toniolo, M.; Zambon, A.; Brunelli, K.; Dabalà, M. Study of the effect of multiple tempering in the impact toughness of forged S690 structural steel. Metals 2020, 10, 507. [Google Scholar] [CrossRef] [Green Version]
  3. Di Schino, A.; Di Nunzio, P.E.; Lopez Turconi, G. Microstructure Evolution during Tempering of Martensite in a Medium-C Steel. Mater. Sci. Forum 2007, 558, 1435–1441. [Google Scholar] [CrossRef]
  4. Di Schino, A. Analysis of phase transformation in high strength low alloyed steels. Metalurgija 2017, 56, 349–352. [Google Scholar]
  5. Di Schino, A.; Alleva, L.; Guagnelli, M. Microstructure evolution during quenching and tempering of martensite in a medium C steel. Mater. Sci. Forum 2012, 715–716, 860–865. [Google Scholar] [CrossRef]
  6. Di Schino, A.; Kenny, J.M.; Abbruzzese, G. Analysis pf the recrystallization and grain growth processes in AISI 316 stainless steel. J. Mat. Sci. 2002, 37, 5291–5298. [Google Scholar] [CrossRef]
  7. Rufini, R.; Di Pietro, O.; Di Schino, A. Predictive simulation of plastic processing of welded stainless steel pipes. Metals 2018, 8, 519. [Google Scholar] [CrossRef] [Green Version]
  8. Di Schino, A.; Testani, C. Corrosion behavior and mechanical properties of AISI 316 stainless steel clad Q235 plate. Metals 2020, 10, 552. [Google Scholar] [CrossRef]
  9. Gloria, A.; Montanari, R.; Richetta, M.; Varone, A. Alloys for Aeronautic Applications: State of the Art and Perspectives. Metals 2019, 9, 662. [Google Scholar] [CrossRef] [Green Version]
  10. Di Schino, A.; Gaggiotti, M.; Testani, C. Heat treatment effect on microstructure evolution in 7% Cr steel for forging. Metals 2020, 10, 808. [Google Scholar] [CrossRef]
  11. Schafrik, R.E.; Walsson, S. Challenges for high temperature materials in the new millennium. In Proceedings of the Eleventh International Symposium on Superalloys, Champion, PA, USA, 14–18 September 2008; p. 3. [Google Scholar]
  12. Di Schino, A.; Valentini, L.; Kenny, J.M.; Gerbig, Y.; Ahmed, I.; Haefke, H. Wear resistance of a high-nitrogen austenitic stainless steel coated with nitrogenated amorphous carbon films. Surf. Coat. Technol. 2002, 161, 224–231. [Google Scholar] [CrossRef]
  13. Dindorf, R.; Wos, P. Energy-Saving Hot Open Die Forging Process of Heavy Steel Forgings on an Industrial Hydraulic Forging Press. Energies 2020, 13, 1620. [Google Scholar] [CrossRef] [Green Version]
  14. Technovio. Global Forging Market 2018–2022; Technovio: Toronto, ON, Canada, 2019. [Google Scholar]
  15. Zitelli, C.; Folgarait, P.; Di Schino, A. Laser powder bed fusion of stainless-steel grades: A review. Metals 2019, 9, 731. [Google Scholar] [CrossRef] [Green Version]
  16. Mancini, S.; Langellotto, L.; Di Nunzio, P.E.; Zitelli, C.; Di Schino, A. Defect reduction and quality optimisation by modelling plastic deformation and metallurgical evolution in ferritic stainless steels. Metals 2020, 10, 186. [Google Scholar] [CrossRef] [Green Version]
  17. Qiu, Y.; Park, S.C.; Cho, H.Y. Prediction of forming limits in cold open-die extrusion process. Trans. Korean Soc. Mech. Eng. A 2020, 44, 435–441. [Google Scholar] [CrossRef]
  18. Harris, N.; Shahriari, D.; Jahazi, M. Analysis of Void Closure during Open Die Forging Process of Large Size Steel Ingots. Key Eng. Mater. 2016, 716, 579–585. [Google Scholar] [CrossRef] [Green Version]
  19. Di Schino, A.; Di Nunzio, P.E. Metallurgical aspects related to contact fatigue phenomena in steels for back up rolling. Acta Metall. Slovaca 2017, 23, 62–71. [Google Scholar] [CrossRef] [Green Version]
  20. Sharma, D.K.; Filipponi, M.; Di Schino, A.; Rossi, F.; Castaldi, J. Corrosion behavior of high temperature fuel cells: Issues for materials selection. Metalurgija 2019, 58, 347–351. [Google Scholar]
  21. Wolfgarten, M.; Rosenstock, D.; Schaeffer, L.; Hirt, G. Implementation of an open-die forging process for large hollow shafts for wind power plants with respect to an optimized microstructure. AIM 2015, 107, 43–49. [Google Scholar]
  22. Choi, S.K.; Chun, M.S.; Van Tyne, C.J.; Moon, Y.H. Optimization of open die forging of round shapes using FEM analysis. J. Mater. Process. Technol. 2006, 172, 88–95. [Google Scholar] [CrossRef]
  23. Obiko, J.; Mwema, F.M. Stress and Strain Distribution in the upsetting process. In Handbook of Research on Advancements in Manufacturing, Materials, and Mechanical Engineering; IGI Global: Hershey, PA, USA, 2020; pp. 288–301. [Google Scholar]
  24. Rosenstoc, D.; Recker, D.; Hirt, G.; Steingießer, K.; Rech, R.; Gehrmann, B.; Lamm, R. Application of a Fast Calculation Model for the Process Monitoring of Open Die Forging Processes. Key Eng. Mater. 2013, 554, 248–263. [Google Scholar] [CrossRef]
  25. Siemer, E.; Nieschwitz, P.; Kopp, R. Quality-optimized process control in open-die forging. Stahl Eisen 1986, 106, 383–387. [Google Scholar]
  26. Napoli, G.; Di Schino, A.; Paura, M.; Vela, T. Colouring titanium alloys by anodic oxidation. Metalurgija 2018, 57, 111–113. [Google Scholar]
  27. Kim, P.H.; Chun, M.S.; Yi, J.J.; Moon, Y.H. Pass schedule algorithms for hot open die forging. J. Mater. Process. Technol. 2002, 130, 516–523. [Google Scholar] [CrossRef]
  28. Jarl, M. FEM simulation of drawing out in open die forging. Steel Res. Int. 2004, 75, 812–817. [Google Scholar]
  29. Recker, D.; Franzke, M.; Hirt, G. Fast models for online optimization during open die forging. CIRP Ann. Manuf. Technol. 2011, 60, 295–298. [Google Scholar] [CrossRef]
  30. Franzke, M.; Recker, D.; Hirt, G. Development of a Process Model for Online optimization of Open Die Forging of Large Workpieces. Steel Res. Int. 2008, 79, 753–757. [Google Scholar] [CrossRef]
  31. Haykin, S. Neural Networks: A Comprehensive Foundation, 2nd ed.; McMaster University: Hamilton, ON, Canada, 1994. [Google Scholar]
  32. Russell, S.; Norvig, P. Artificial Intelligence: A Modern Approach, 2nd ed.; Pearson Education: Upper Saddle River, NJ, USA, 2003. [Google Scholar]
  33. Hung, C.; Kobayashi, S. Three-dimensional finite element analysis on open-die block forging design. J. Eng. Ind. 1992, 114, 459–464. [Google Scholar] [CrossRef]
  34. Skunca, M.; Skakun, P.; Keran, Z.; Sidjanin, L.; Math, M.D. Relations between numerical simulation and experiment in closed die forging of a gear. J. Mater. Process. Technol. 2006, 177, 256–260. [Google Scholar] [CrossRef]
  35. Zhang, Z.; Xie, J. A numerical simulation of super-plastic die forging process for Zr-based bulk metallic glass spur gear. Mater. Sci. Eng. A 2006, 433, 323–328. [Google Scholar] [CrossRef]
  36. Hensel, A.; Spittel, T. Kraft und Hitsbedarf Bildsamer Formgebungsverfahren; VEB Deutscher Verlag für Grundstoffindustrie: Leipzig, Germany, 1978. [Google Scholar]
  37. Shah, K.N.; Kiefer, B.V.; Gavigan, J.J. Finite Element Simulation of Internal Void Closure in Open-Die Press Forging. Mater. Manuf. Process 1986, 1, 501–516. [Google Scholar] [CrossRef]
  38. Matsumoto, Y.P.; Chiba, A. Correcting the stress strain curve in the stroke-rate controlling forging process. Metall. Mater. Trans. A 2009, 40, 1203–1209. [Google Scholar]
  39. Caglar, M.U.; Teufel, A.I.; Wilke, C.O. Sicegar: R package for sigmoidal and double-sigmoidal curve fitting. PeerJ 2018, 6, e4251. [Google Scholar] [CrossRef] [PubMed] [Green Version]
  40. Schlang, M.; Feldkeller, B.; Lang, B.; Poppe, T.; Runkler, T. Neural computation in steel industry. In Proceedings of the 1999 European Control Conference (ECC), Karlsruhe, Germany, 31 August–3 September 1999; pp. 2922–2927. [Google Scholar]
  41. Bishop, C.M. Neural Networks for Pattern Recognition, 2nd ed.; Oxford University Press: New York, NY, USA, 1995. [Google Scholar]
  42. Wasserman, P.D. Advanced Methods in Neural Computing; John Wiley & Sons Inc.: New York, NY, USA, 1993. [Google Scholar]
  43. Mehta, S.B.; Gohil, D.B. Computer Simulation of Forging Using the Slab Method Analysis. Int. J. Sci. Eng. Res. 2011, 2, 1–5. [Google Scholar]
  44. Spittel, M.; Spittel, T. Landolt-Börnstein–Numerical Data and Functional Relationships in Science and Technology, Group VIII: Advanced Materials and Technologies Volume 2, Materials–Subvolume C Metal Forming Data, Ferrous Alloys; Springer: Berlin/Heidelberg, Germany, 2009. [Google Scholar]
Figure 1. Schematic representation of the simulated forging process.
Metals 10 01397 g001
Figure 2. Effect of the presence of manipulator during forging process for a Sb0 of 300 mm.
Metals 10 01397 g002
Figure 3. Total equivalent plastic strain at the core of the piece for an ingot with a diameter of 300 mm, 25% reduction, for Sb0 of 300 mm and a ΔSb0 of 10% at T = 1200 °C for the first series of strokes.
Metals 10 01397 g003
Figure 4. Schematic representation of forged piece simulated; results have been token at the core of the piece in terms of plastic strain as a function of the length.
Metals 10 01397 g004
Figure 5. Evolution of plastic strain as a function of length at 1200 °C, Sb0 = 300 mm, reduction = 25%, ingot diameter equal to 300 mm, pitch 90%.
Metals 10 01397 g005
Figure 6. Plot of C1 from the analytical model C1 (target) versus the ANN trained C1 in blue with error bands at +5% and −5% in grey (a) and the analytical model C2 (target) versus the ANN trained C2 in blue with error bands at +5% and −5% in grey (b).
Metals 10 01397 g006
Figure 7. Plot of D1 from the analytical model D1 (target) versus the ANN trained D1 in blue with error bands at +5% and −5% in grey (a) and the analytical model D2 (target) versus the ANN trained D2 in blue with error bands at +5% and −5% in grey (b).
Metals 10 01397 g007
Figure 8. Plot of M from the analytical model M (target) versus the ANN trained M in blue with error bands at +5% and −5% in grey.
Metals 10 01397 g008
Figure 9. Total equivalent plastic strain as a function of length for Sb0 = 150 mm, reduction of 5%, first stroke at (a) 800 °C, (b) 1200 °C.
Metals 10 01397 g009
Figure 10. Total equivalent plastic strain as a function of length for Sb0 = 150 mm, reduction of 25%, first stroke at (a) 800 °C, (b) 1200 °C.
Metals 10 01397 g010
Figure 11. 42CrMo4. Flow stress curves by hot forming. Figure 5.309 in [44].
Metals 10 01397 g011
Figure 12. Total equivalent plastic strain as a function of length for Sb0 = 300 mm, reduction of 25% for first stroke at (a) 800 °C, (b) 1200 °C.
Metals 10 01397 g012
Figure 13. Total equivalent plastic strain as a function of length for Sb0 = 750 mm, reduction of 25% for first stroke at (a) 800 °C, (b) 1200 °C.
Metals 10 01397 g013
Figure 14. Total equivalent plastic strain as a function of length for Sb0 = 300 mm, reduction of 25% at 1200 °C for second (a) and third stroke (b).
Metals 10 01397 g014
Table 1. Parameters of FEM simulation for stretching forging process for round ingot.
Forging ParameterMinimum ValueMaximum ValueStep
Temperature [°C]8001200100
Sb0 [mm]150750150
Reduction [%]5.025.02.5
ΔSb0 [%] (Pitch [%] respect Sb0)10 (90%)50 (50%)(20%)
Ingot initial diameter [mm]3001500300
Table 2. Normalized values for artificial neural network.
VariableMin ValueMax ValueMin Normalized ValueMax Normalized Value
Sb0757500.10.9
Temperature80012000.10.9
Reduction [%]5250.10.9
C1−384−280.10.9
D119600.10.9
C29.53500.10.9
D227600.10.9
M00.240.10.9
Publisher’s Note: MDPI stays neutral with regard to jurisdictional claims in published maps and institutional affiliations.

