Coupling Finite Element Analysis and the Theory of Critical Distances to Estimate Critical Loads in Al6060-T66 Tubular Beams Containing Notches


Abstract
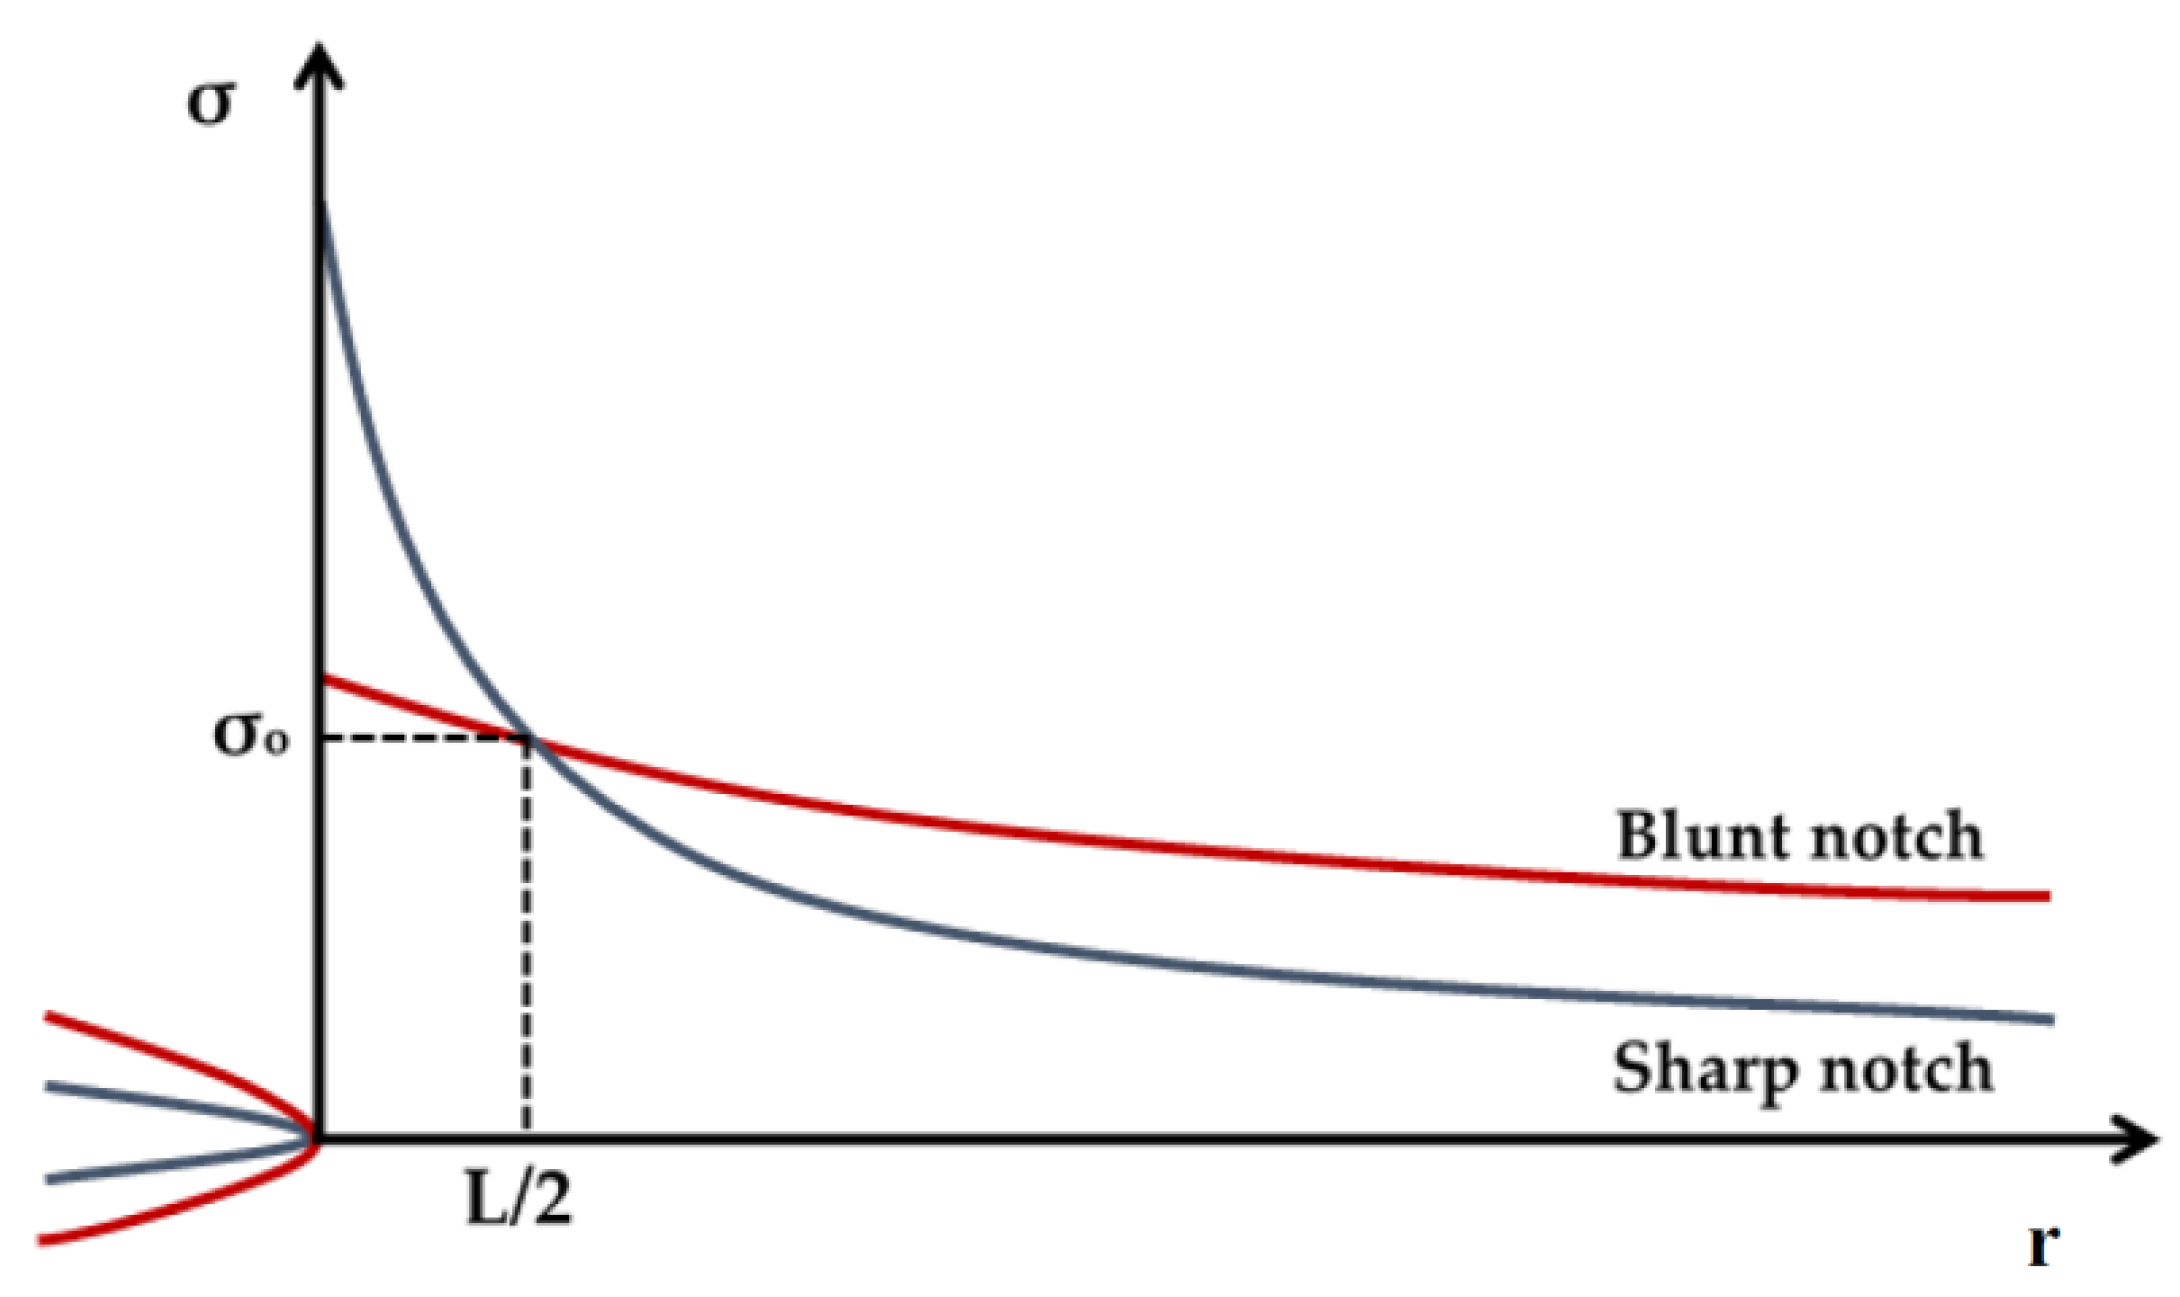
1. Introduction
2. Materials and Methods
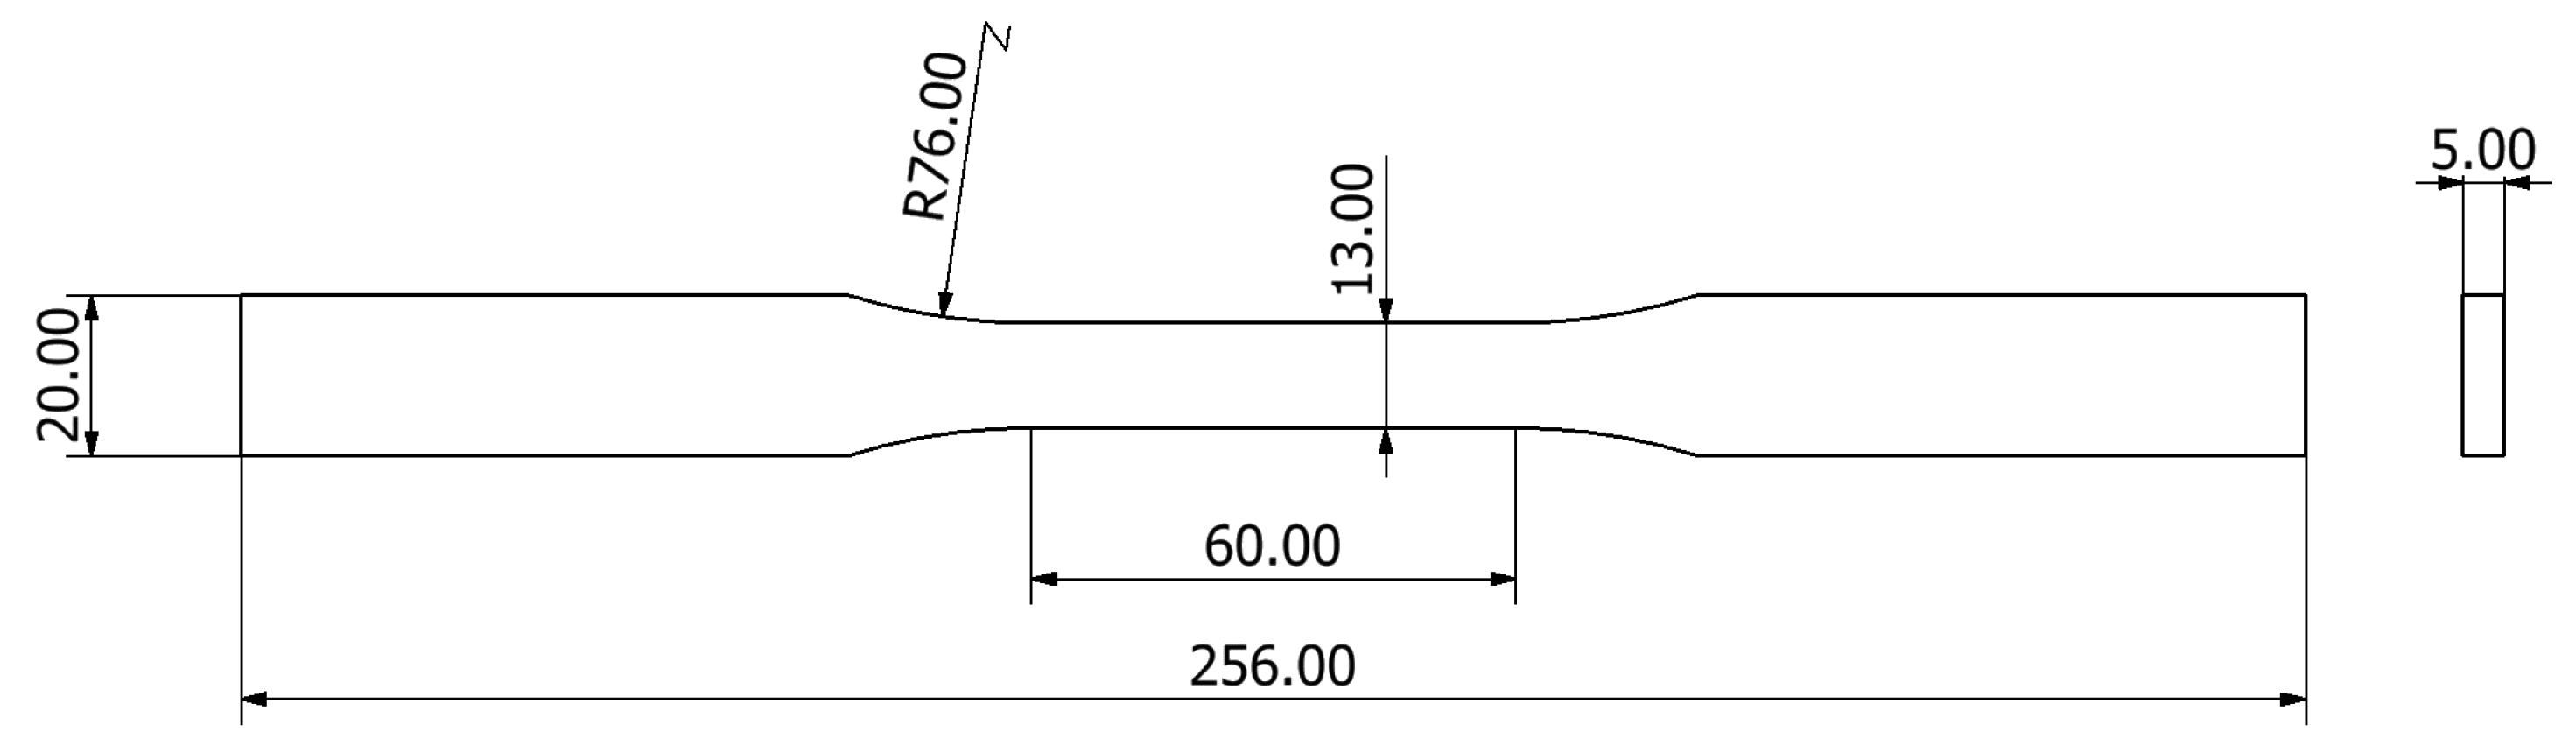
2.1. Materials
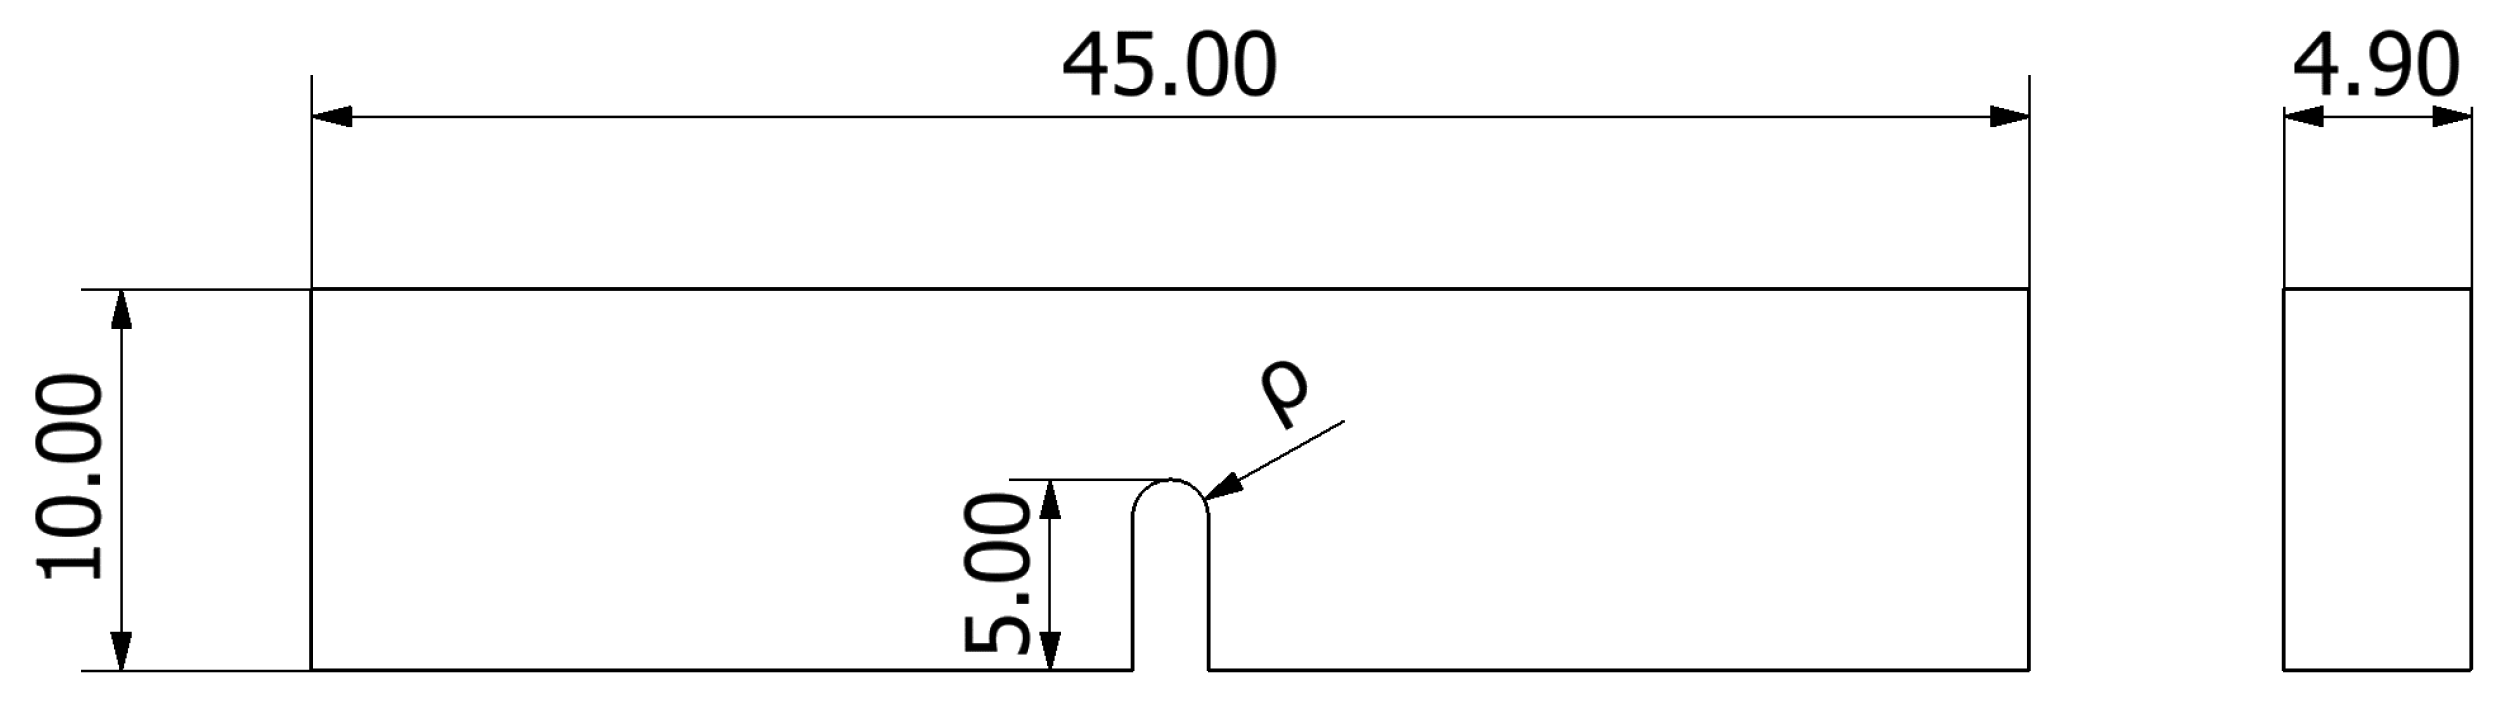
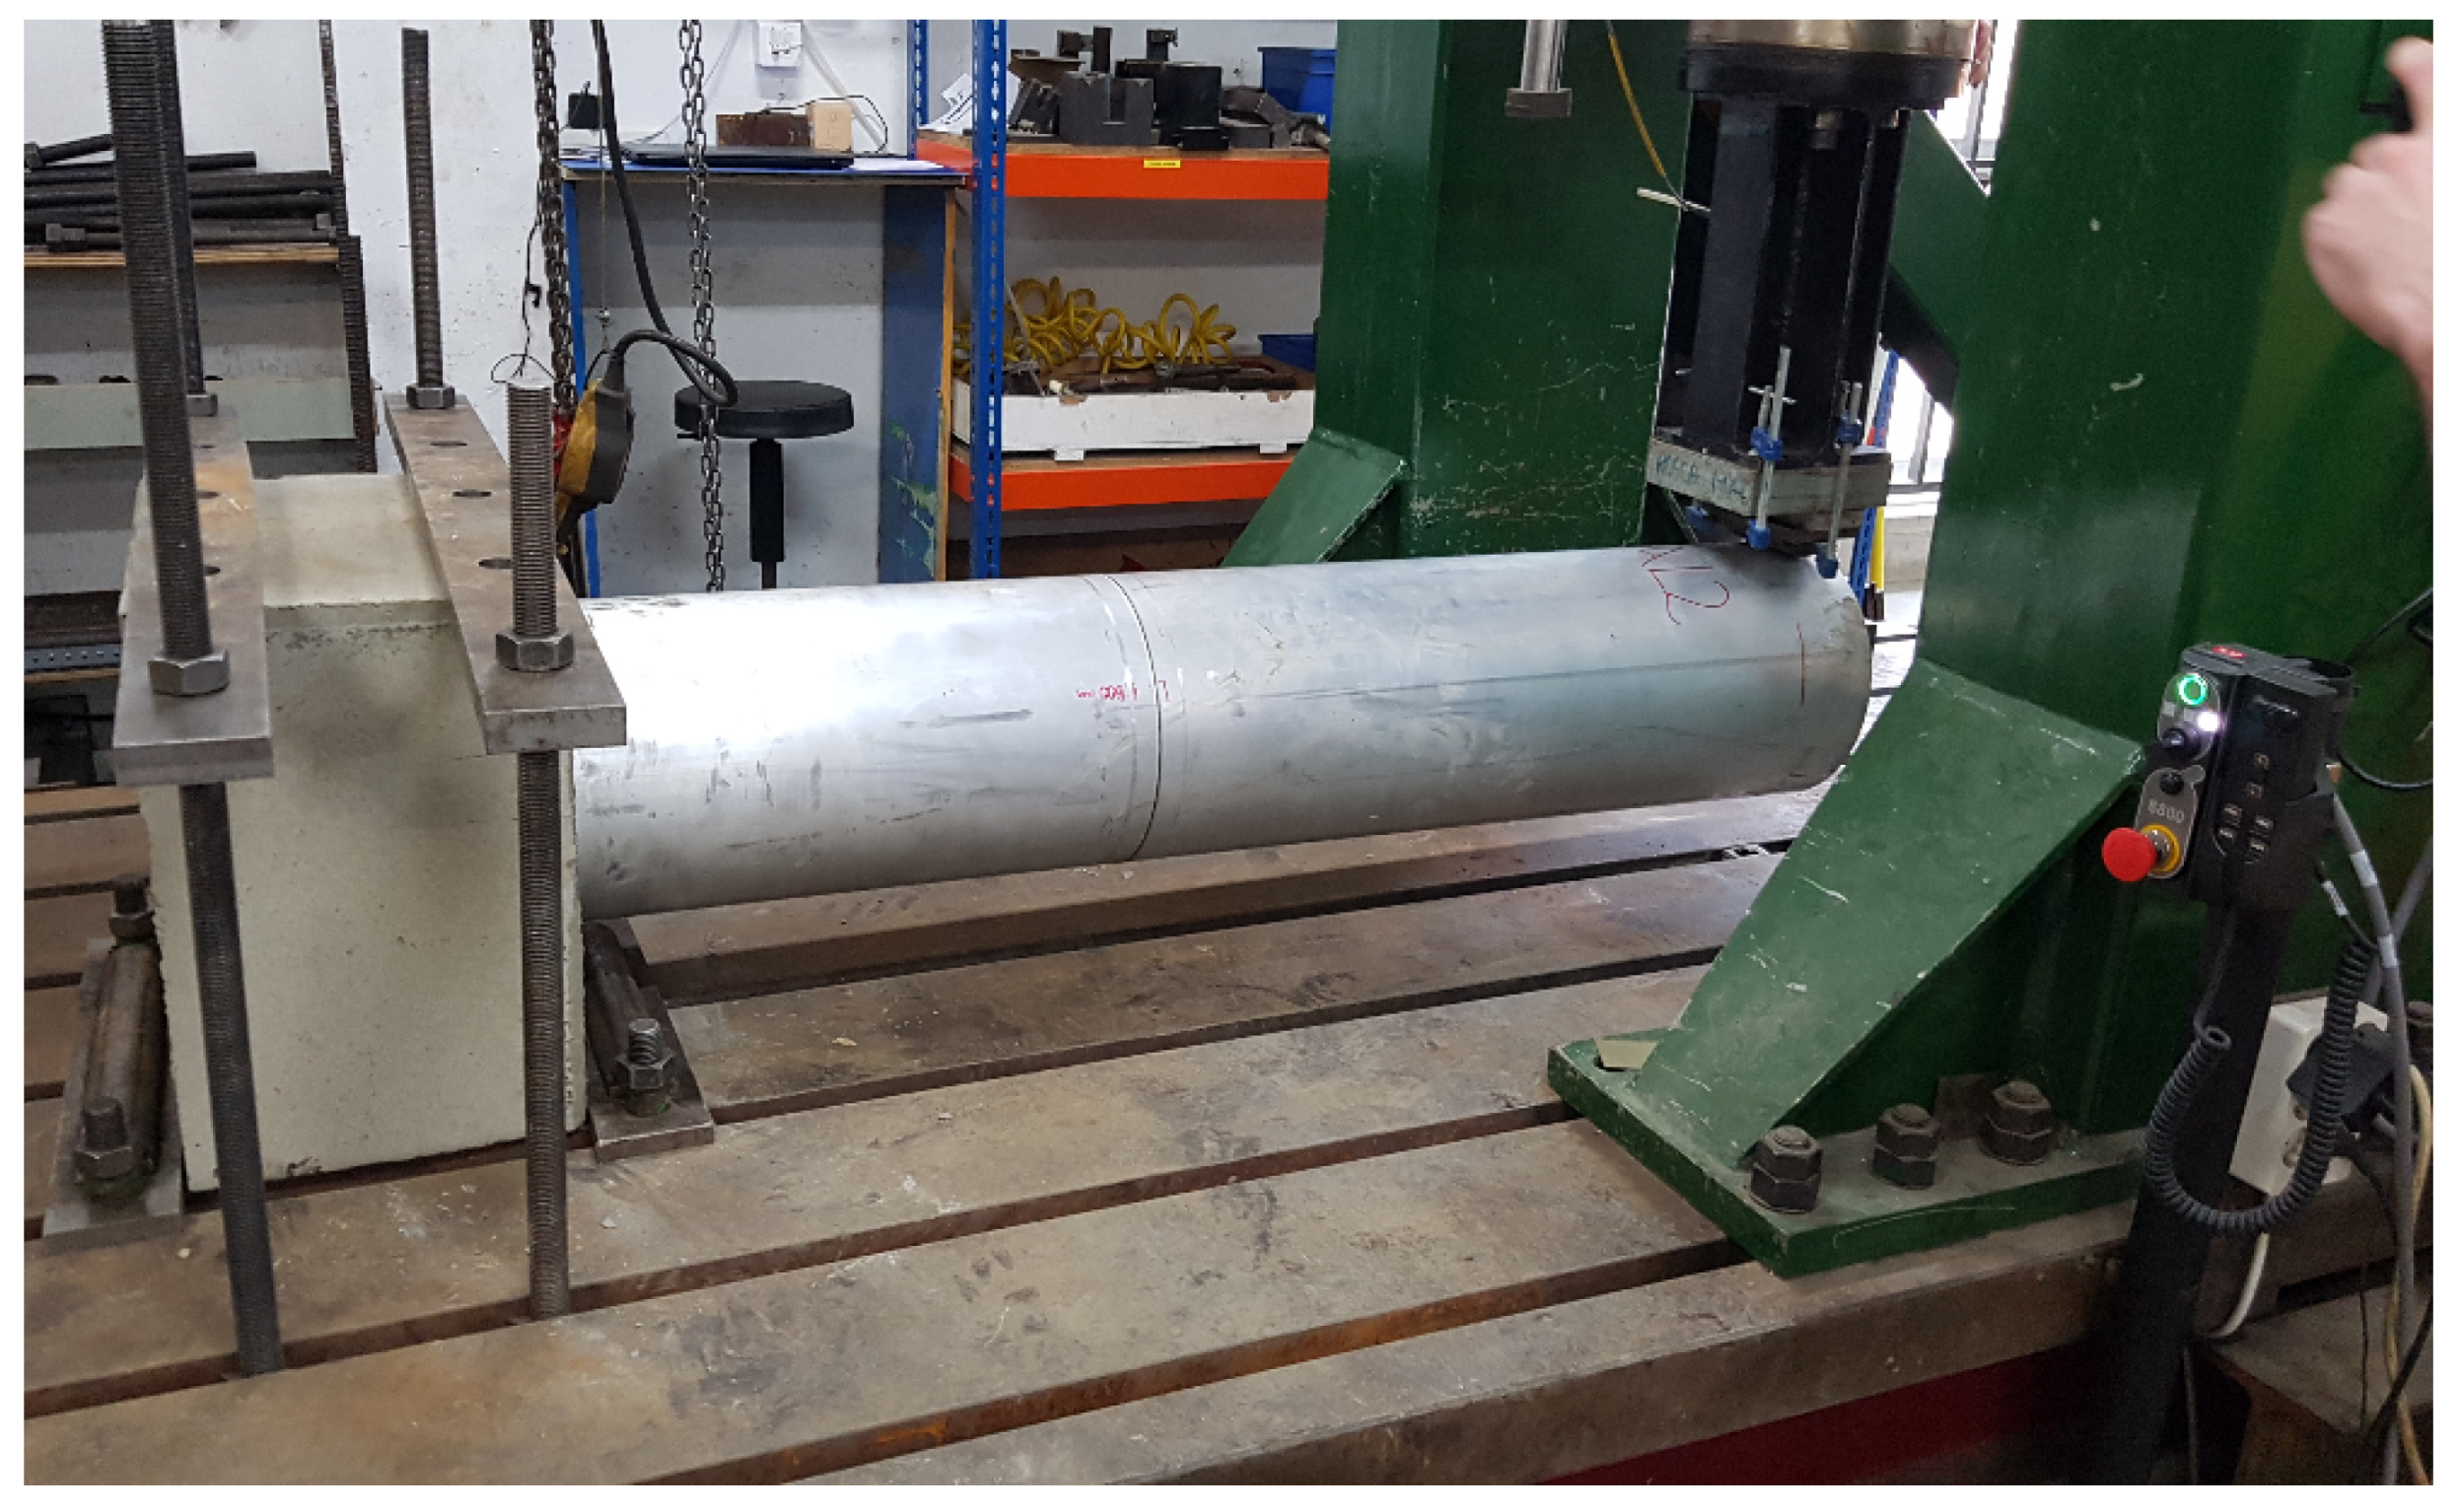
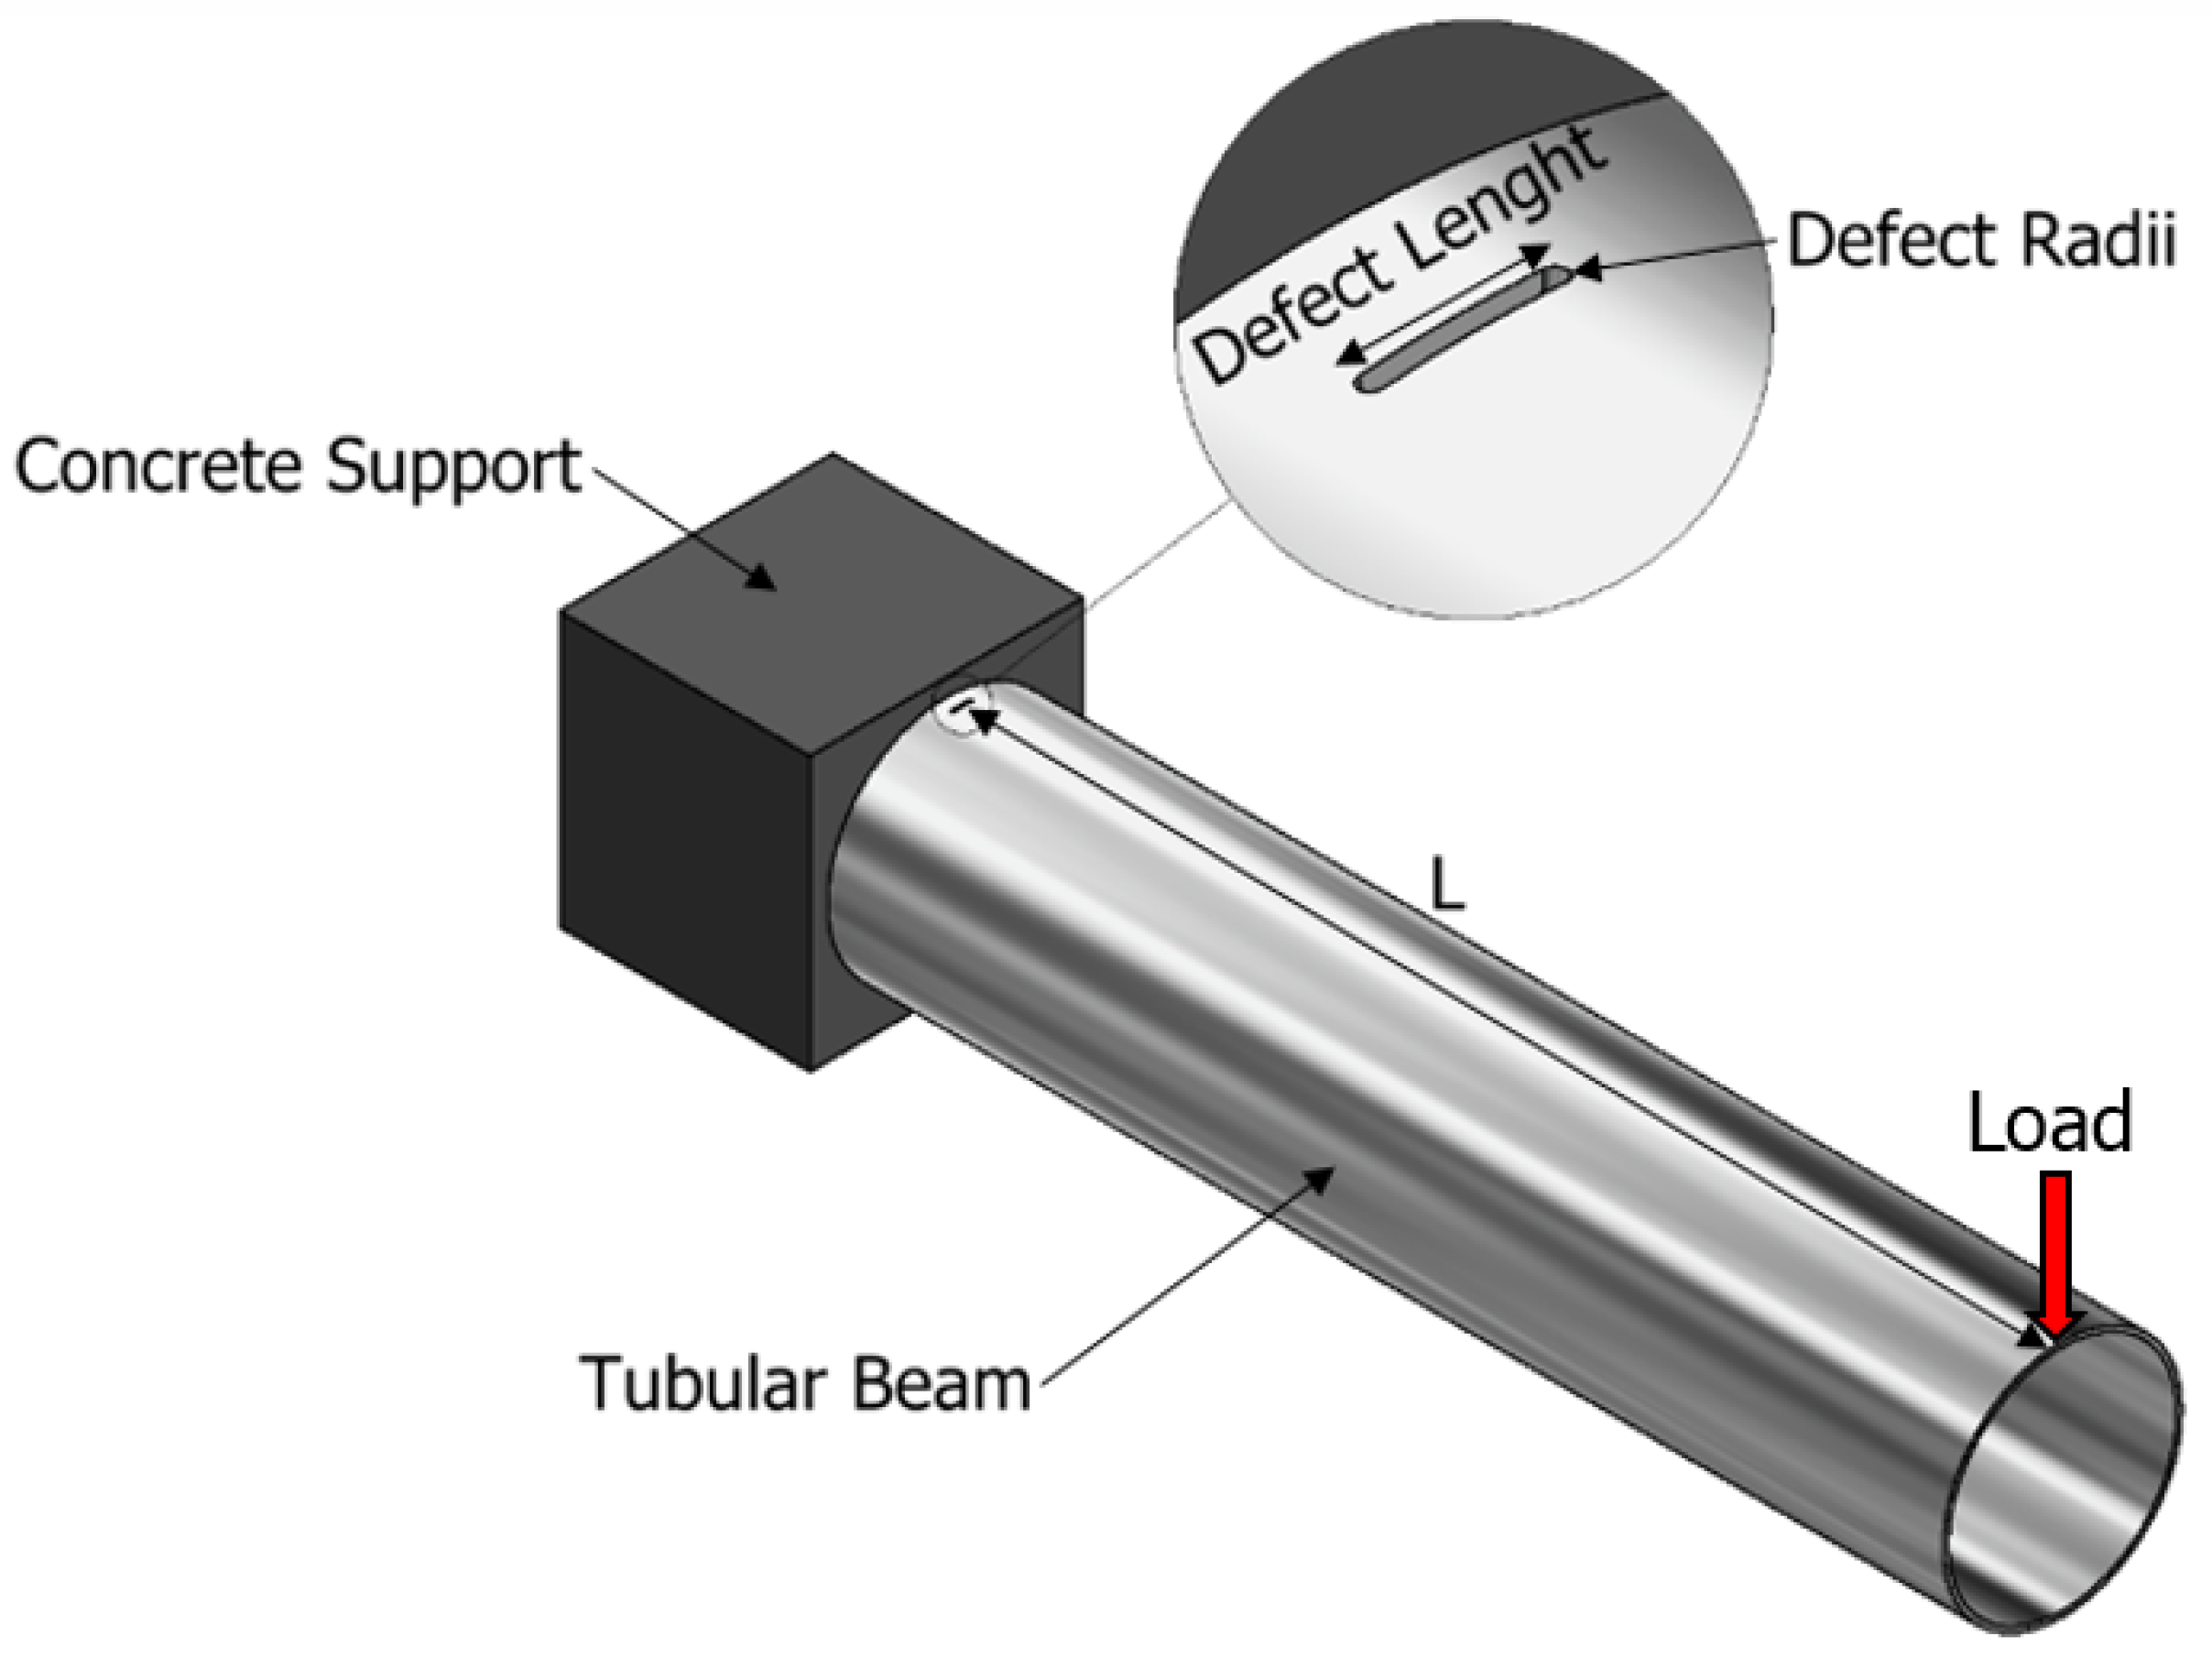
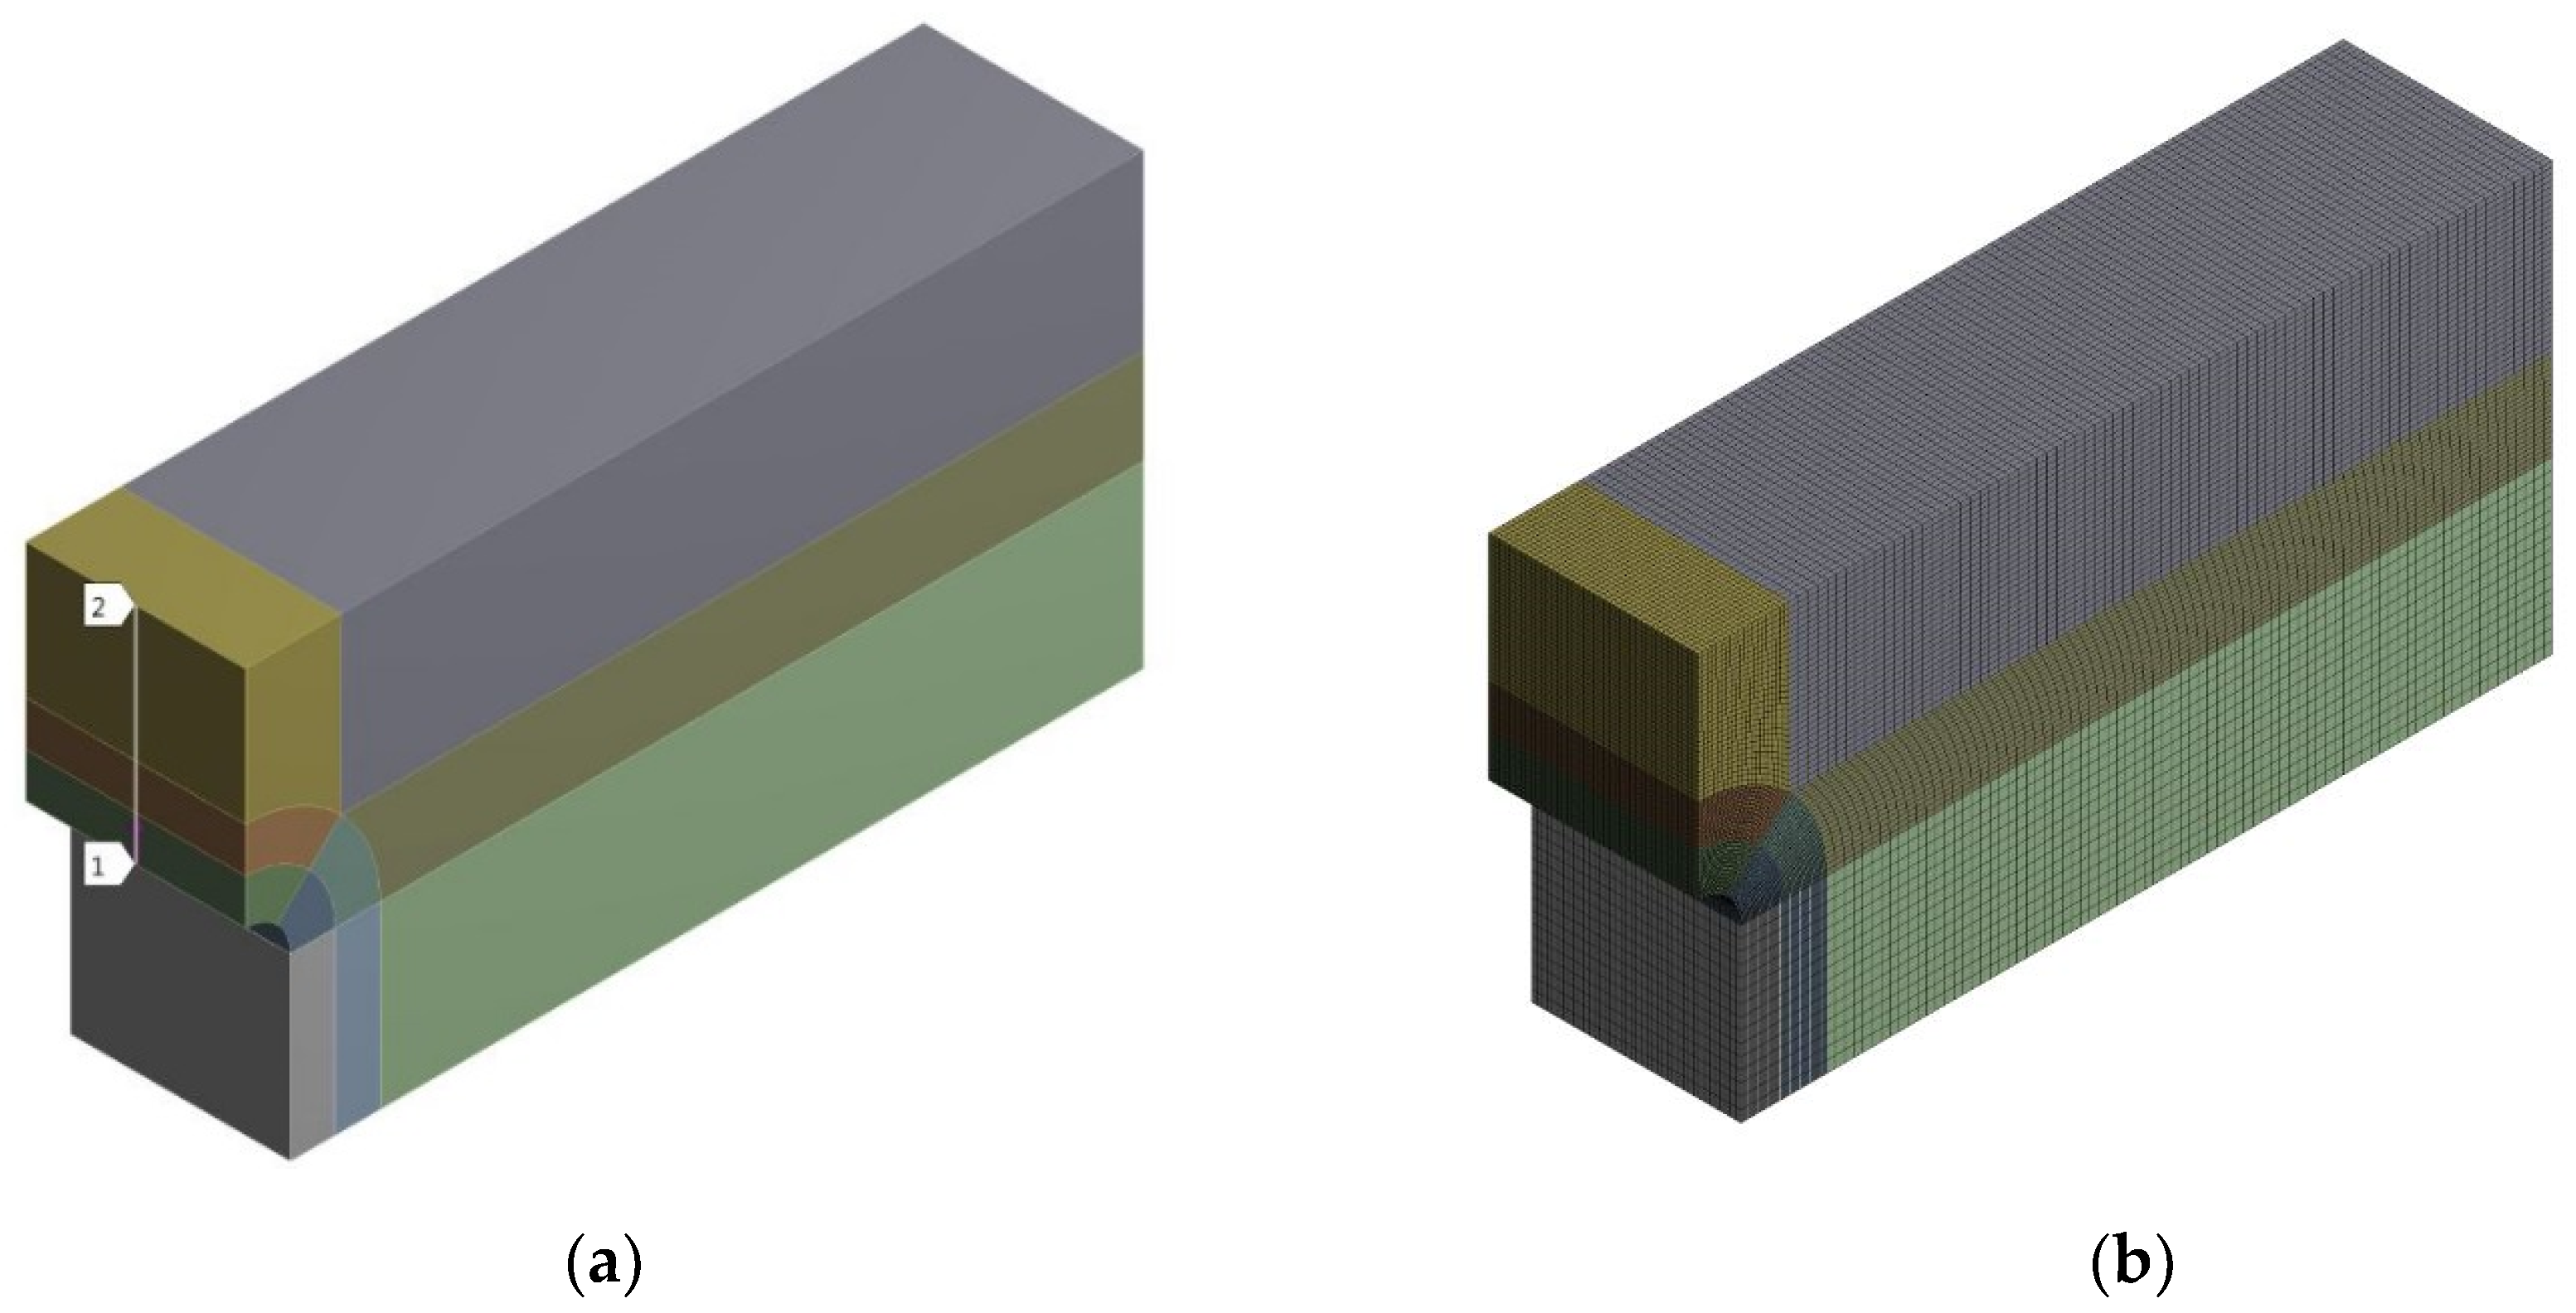
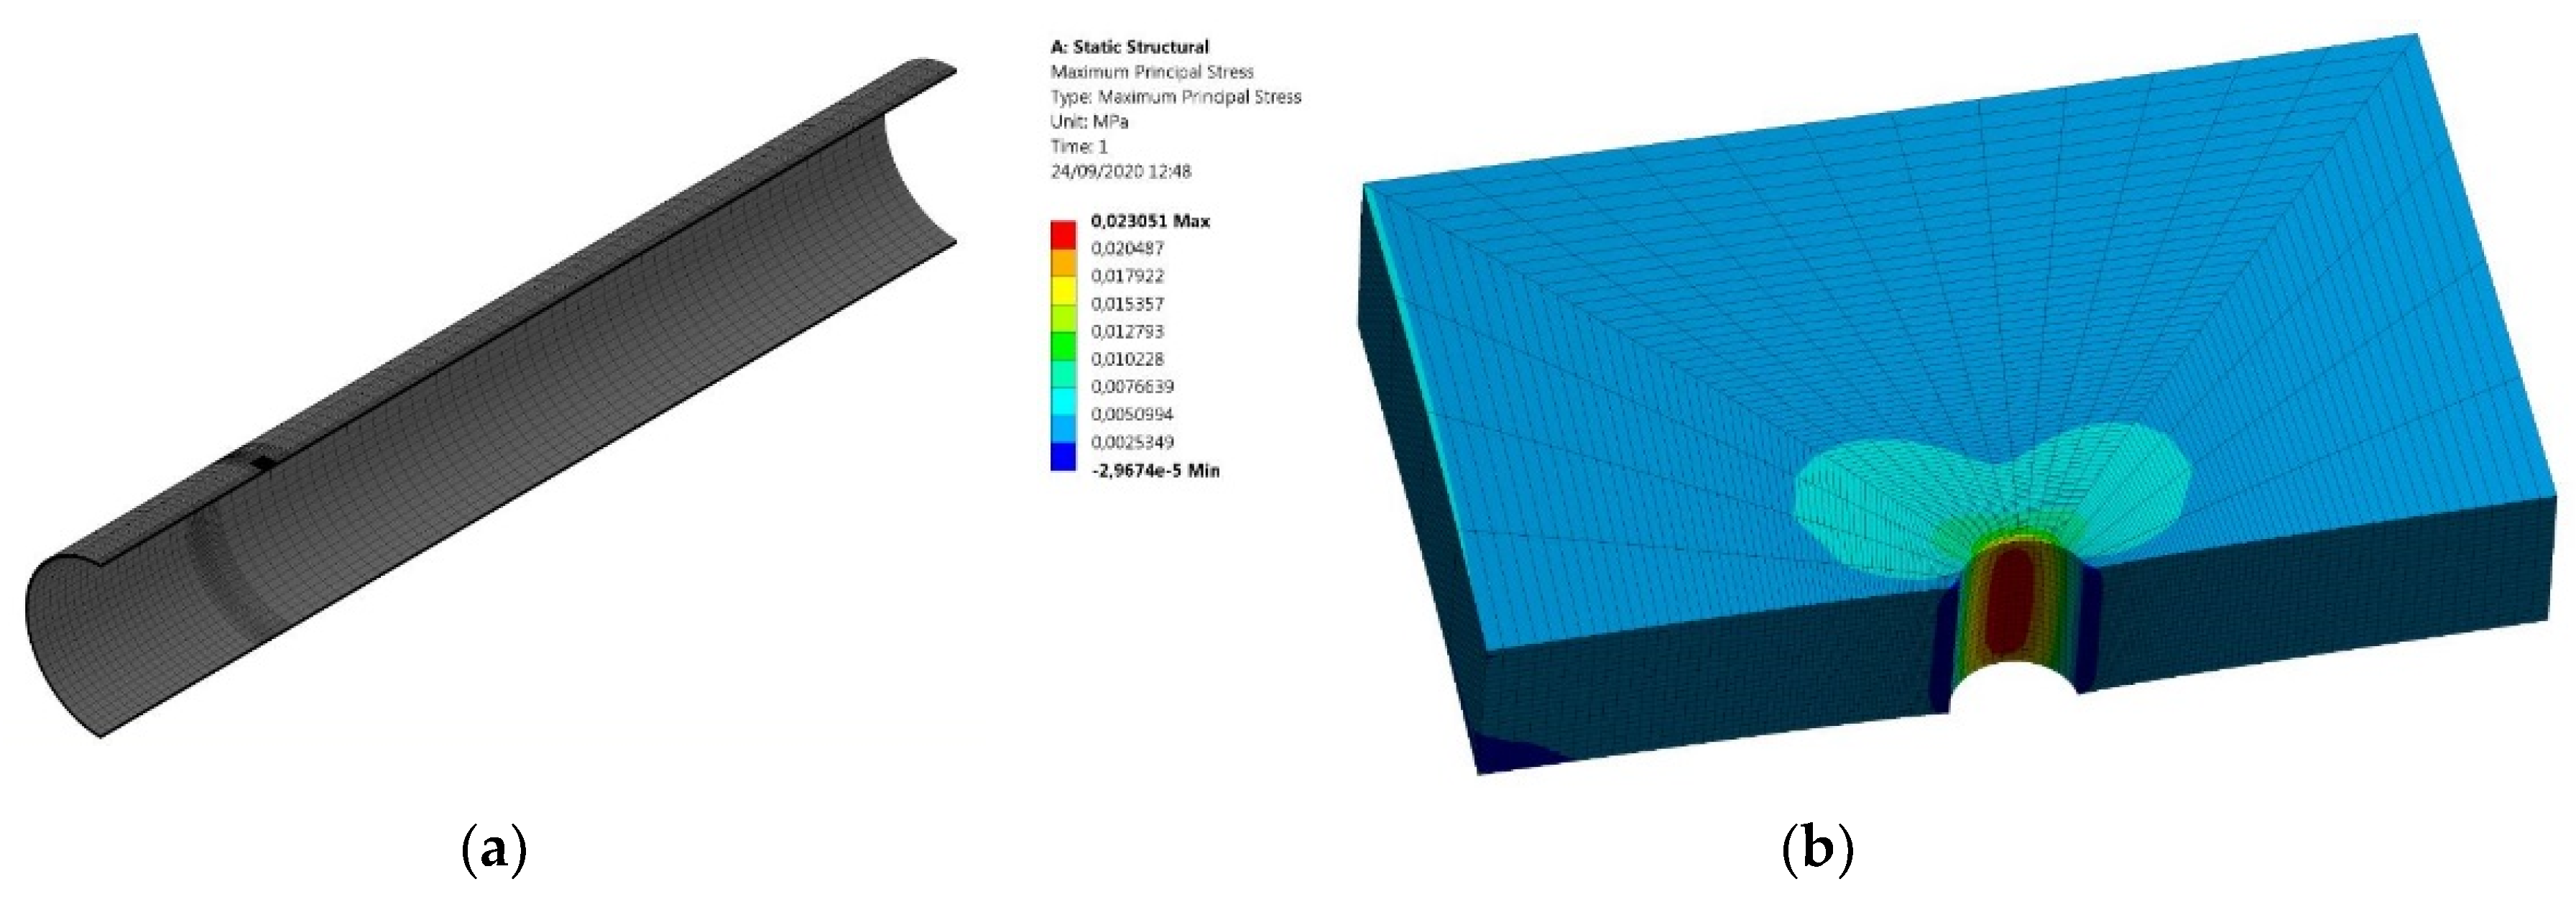
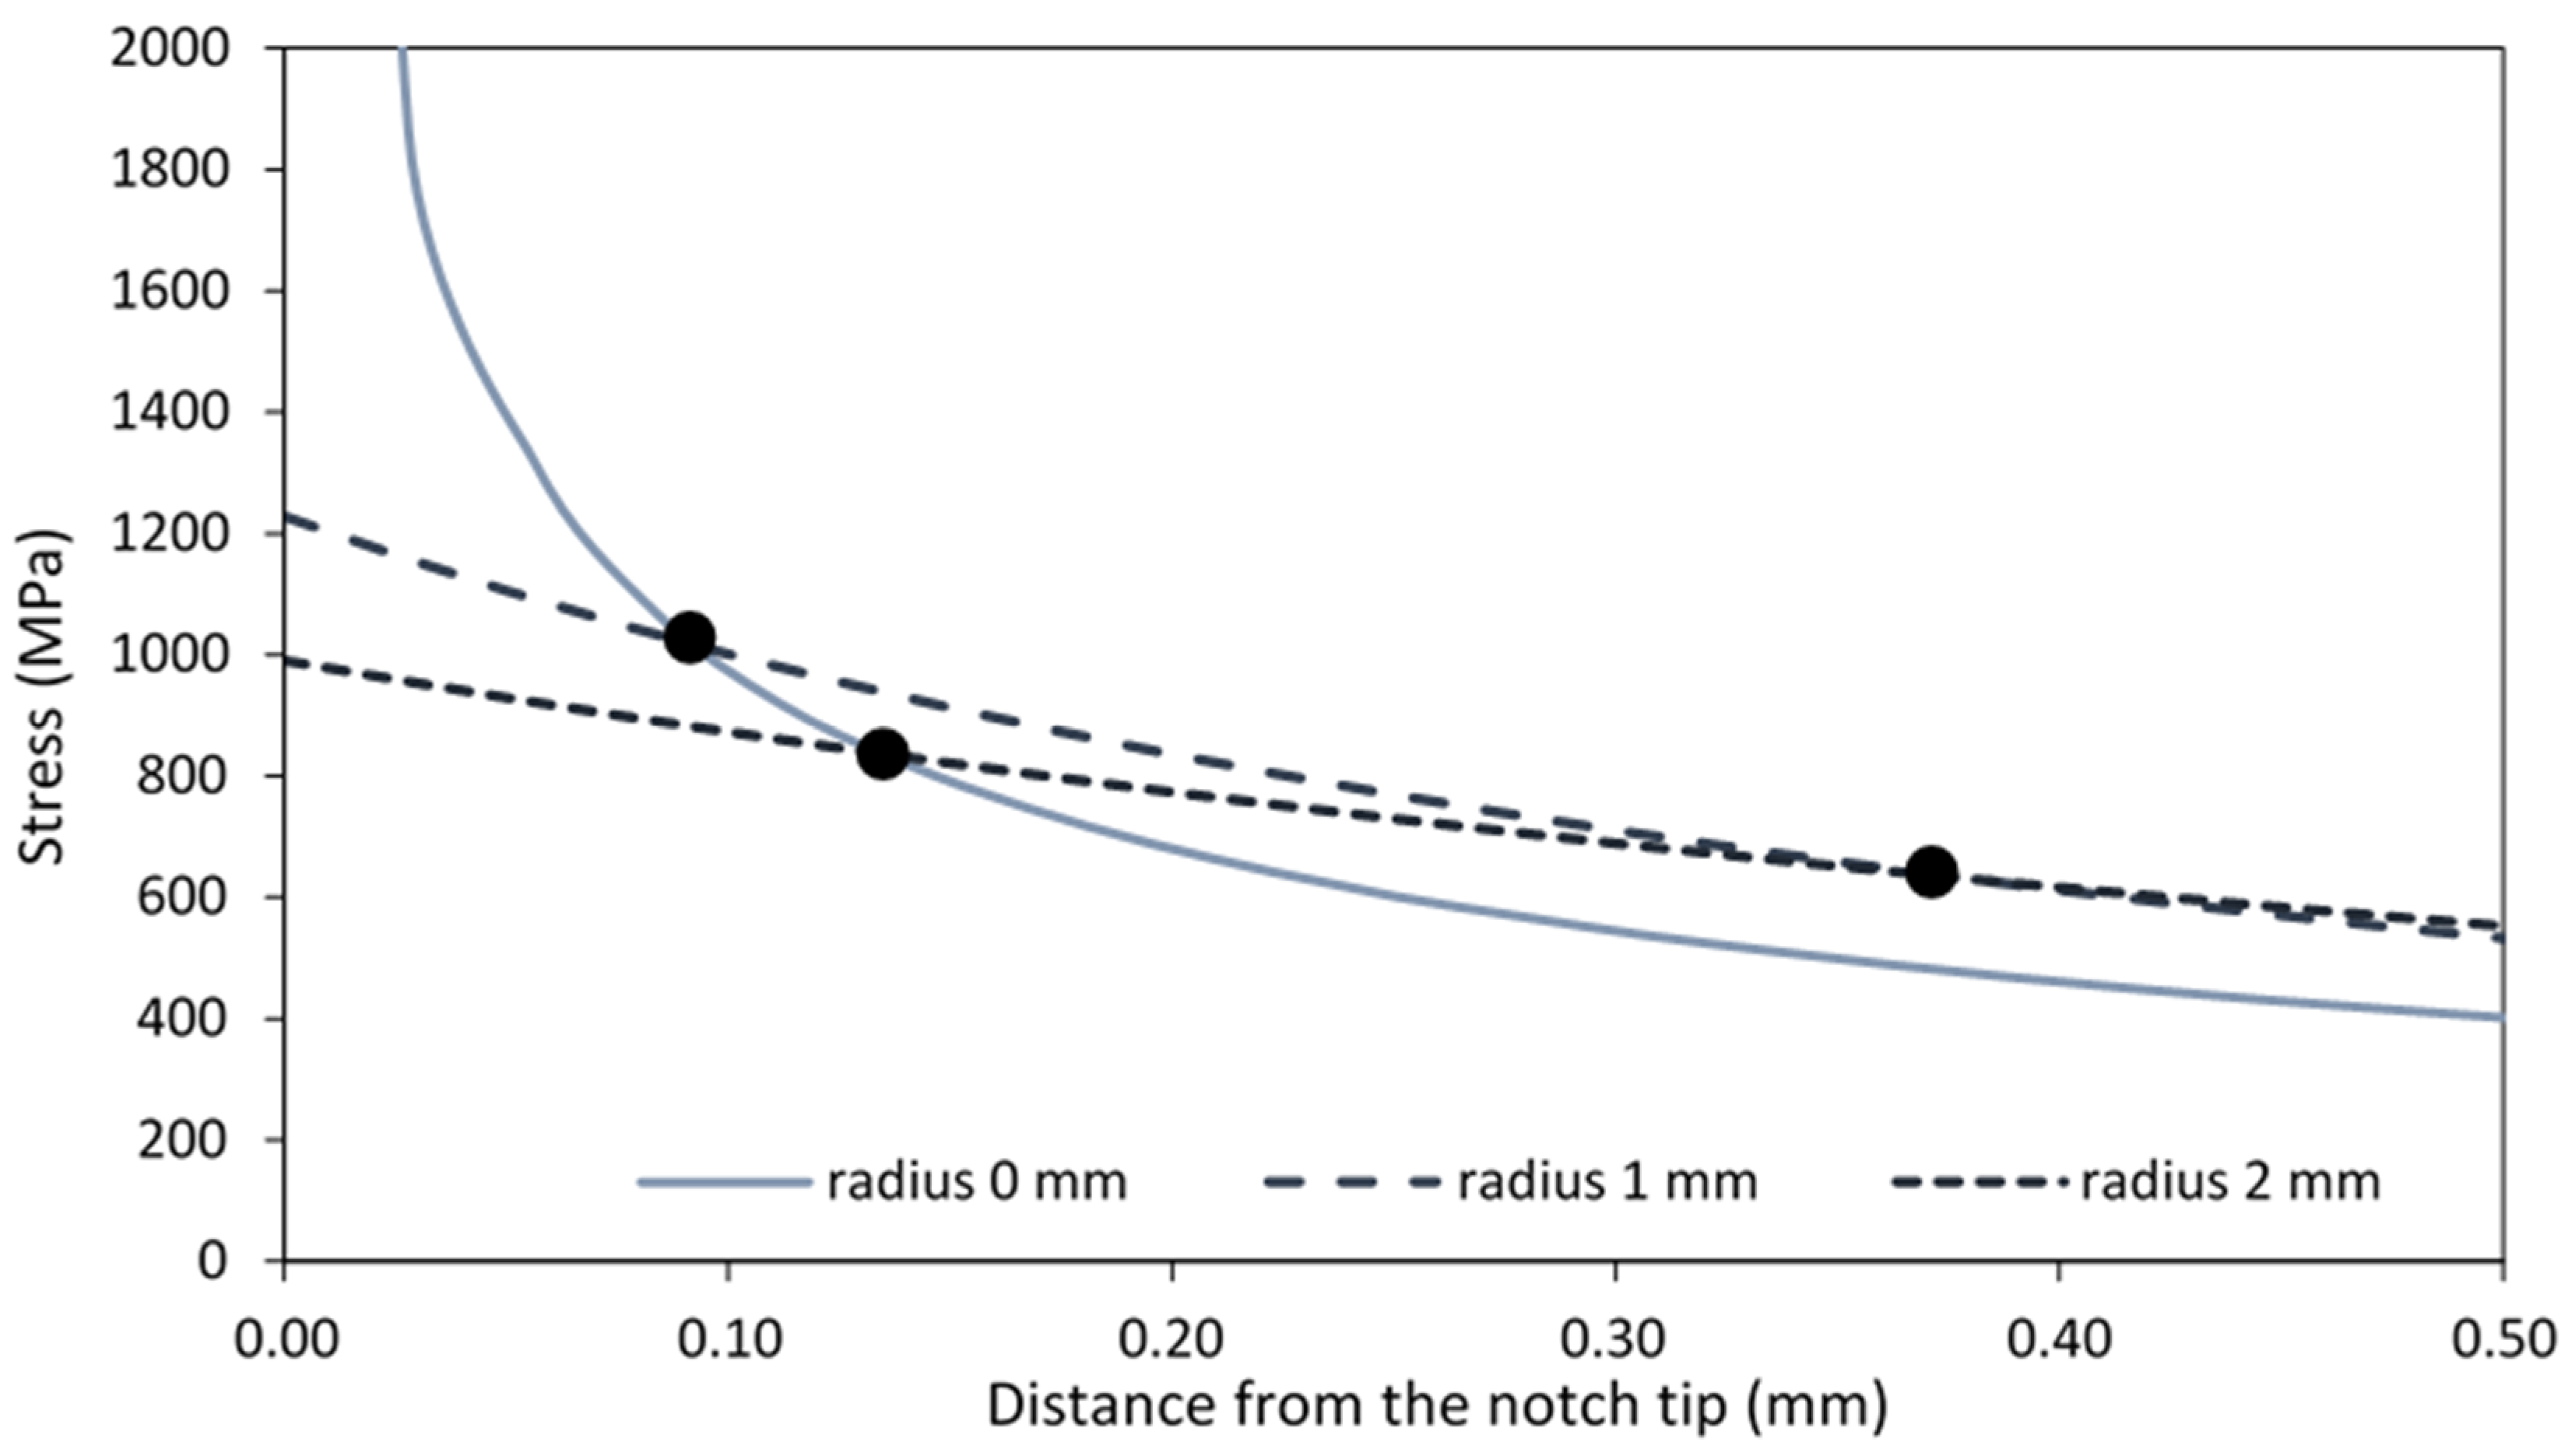
2.2. Methods
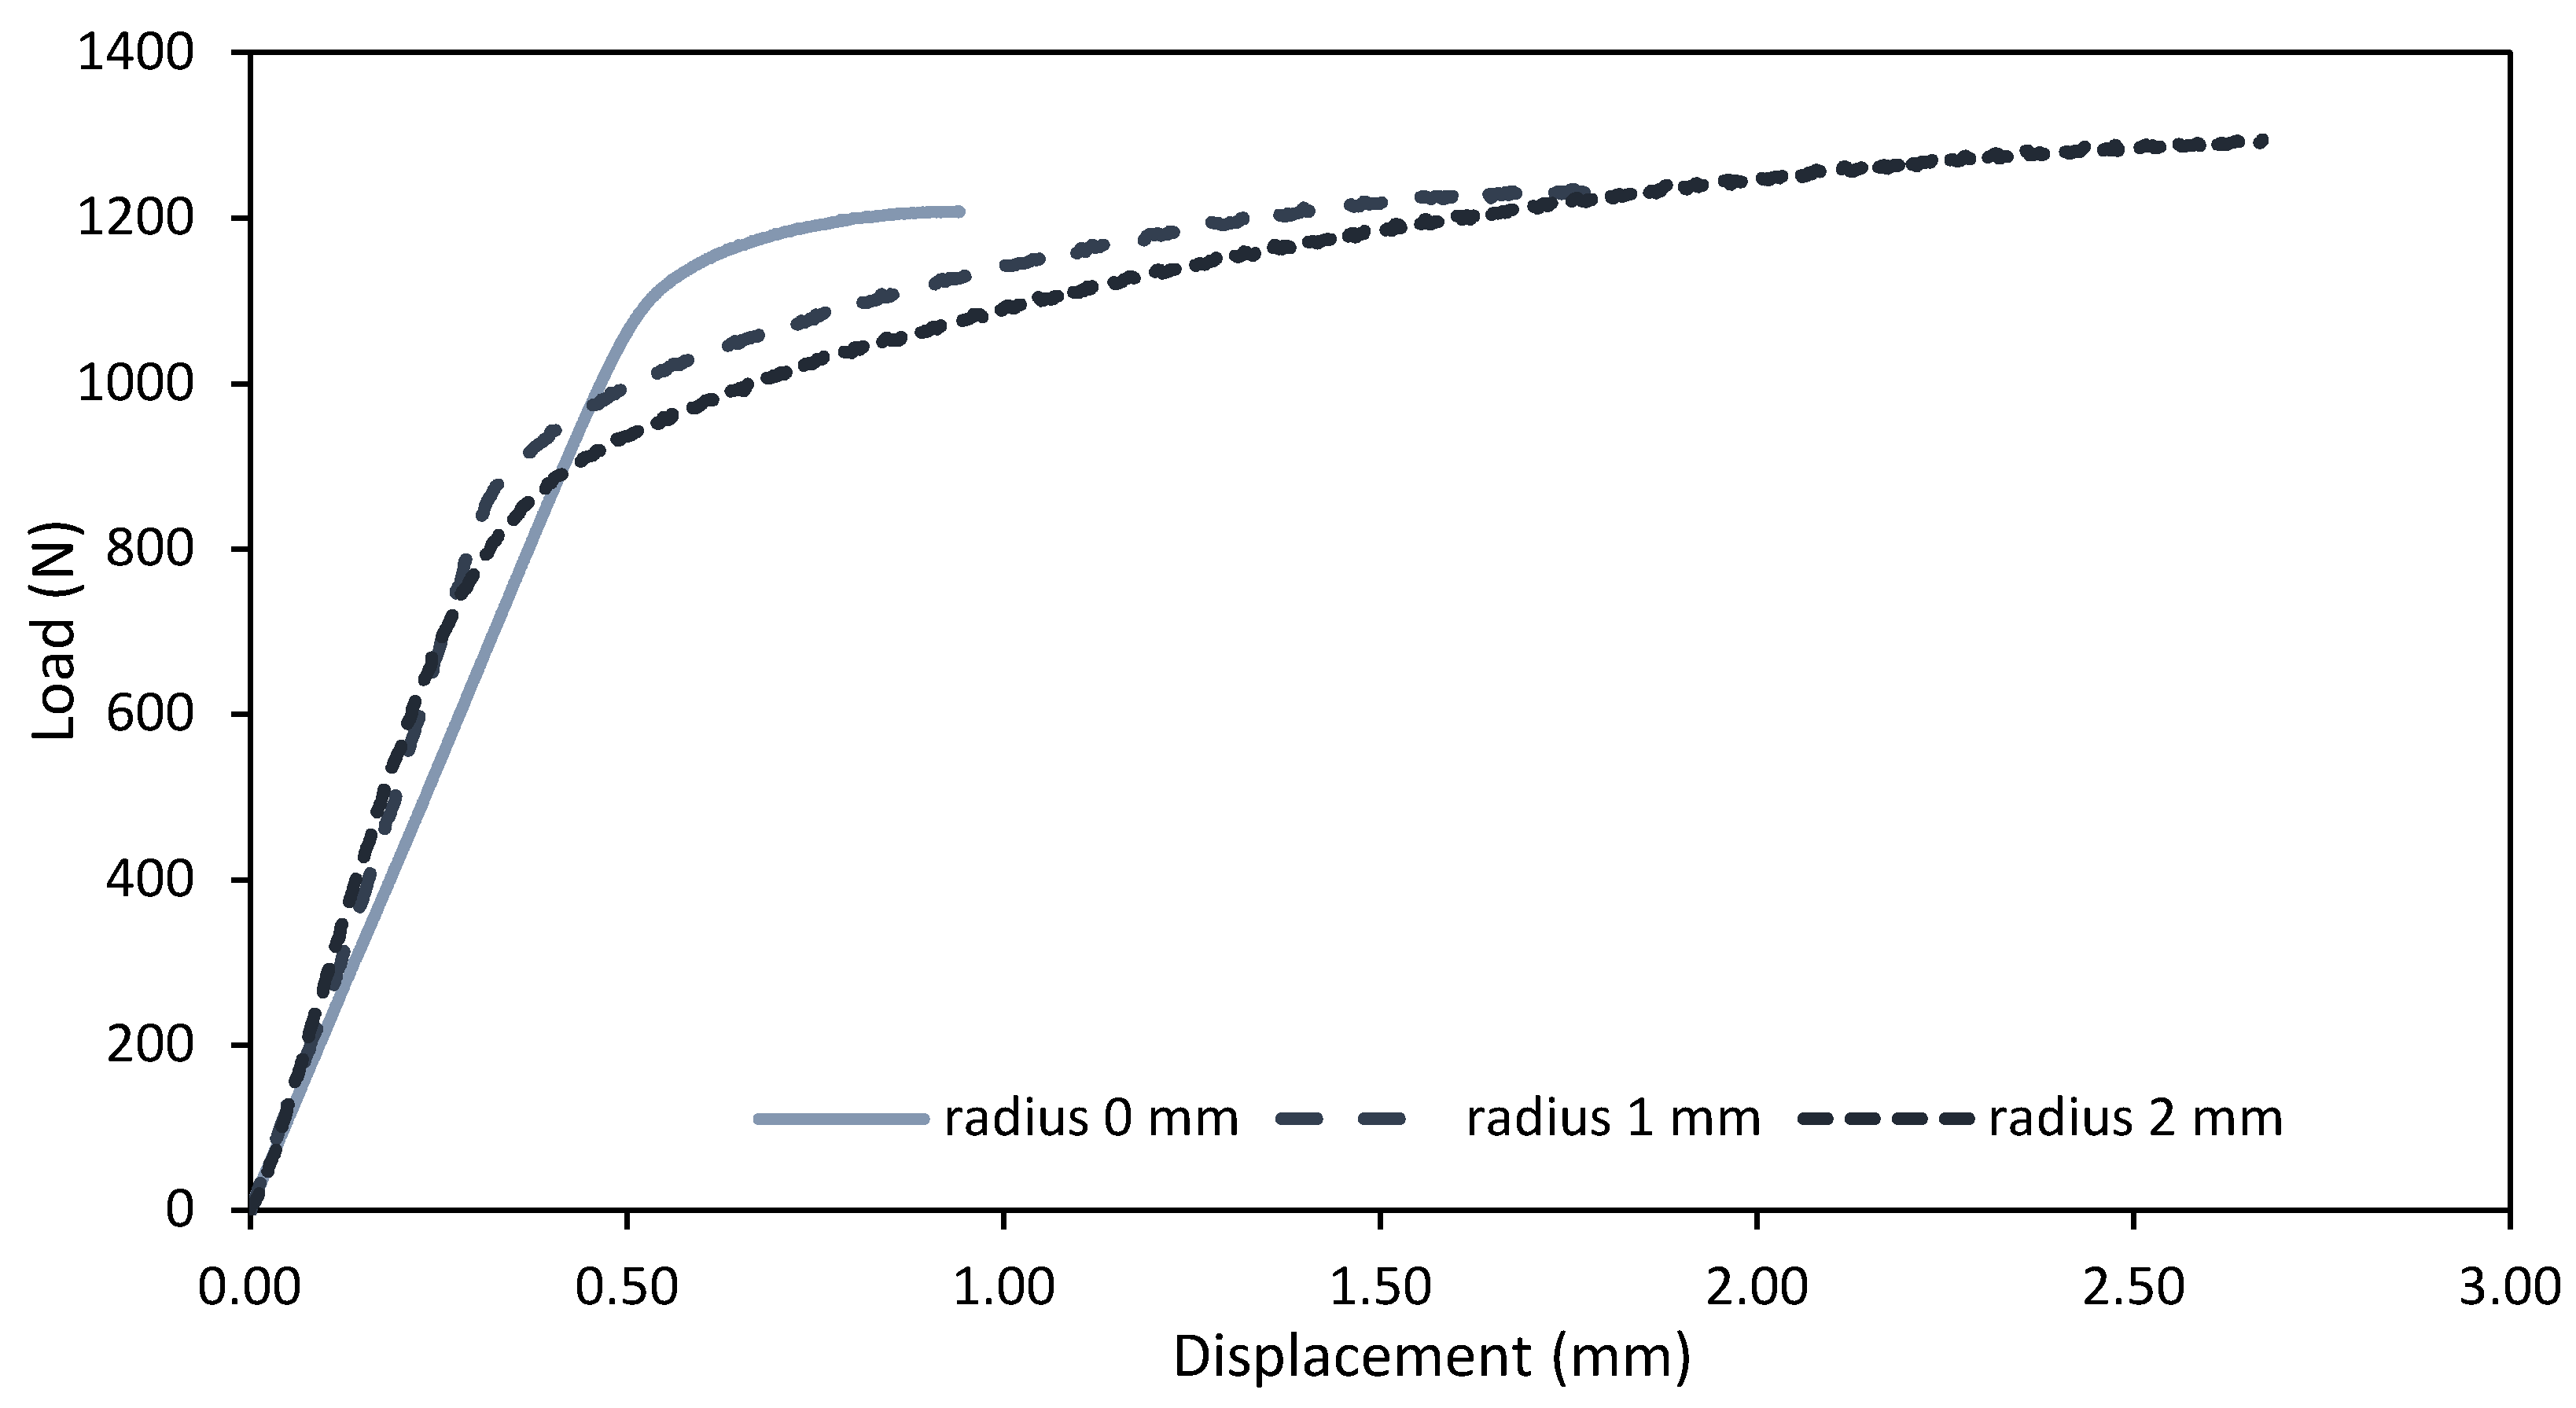
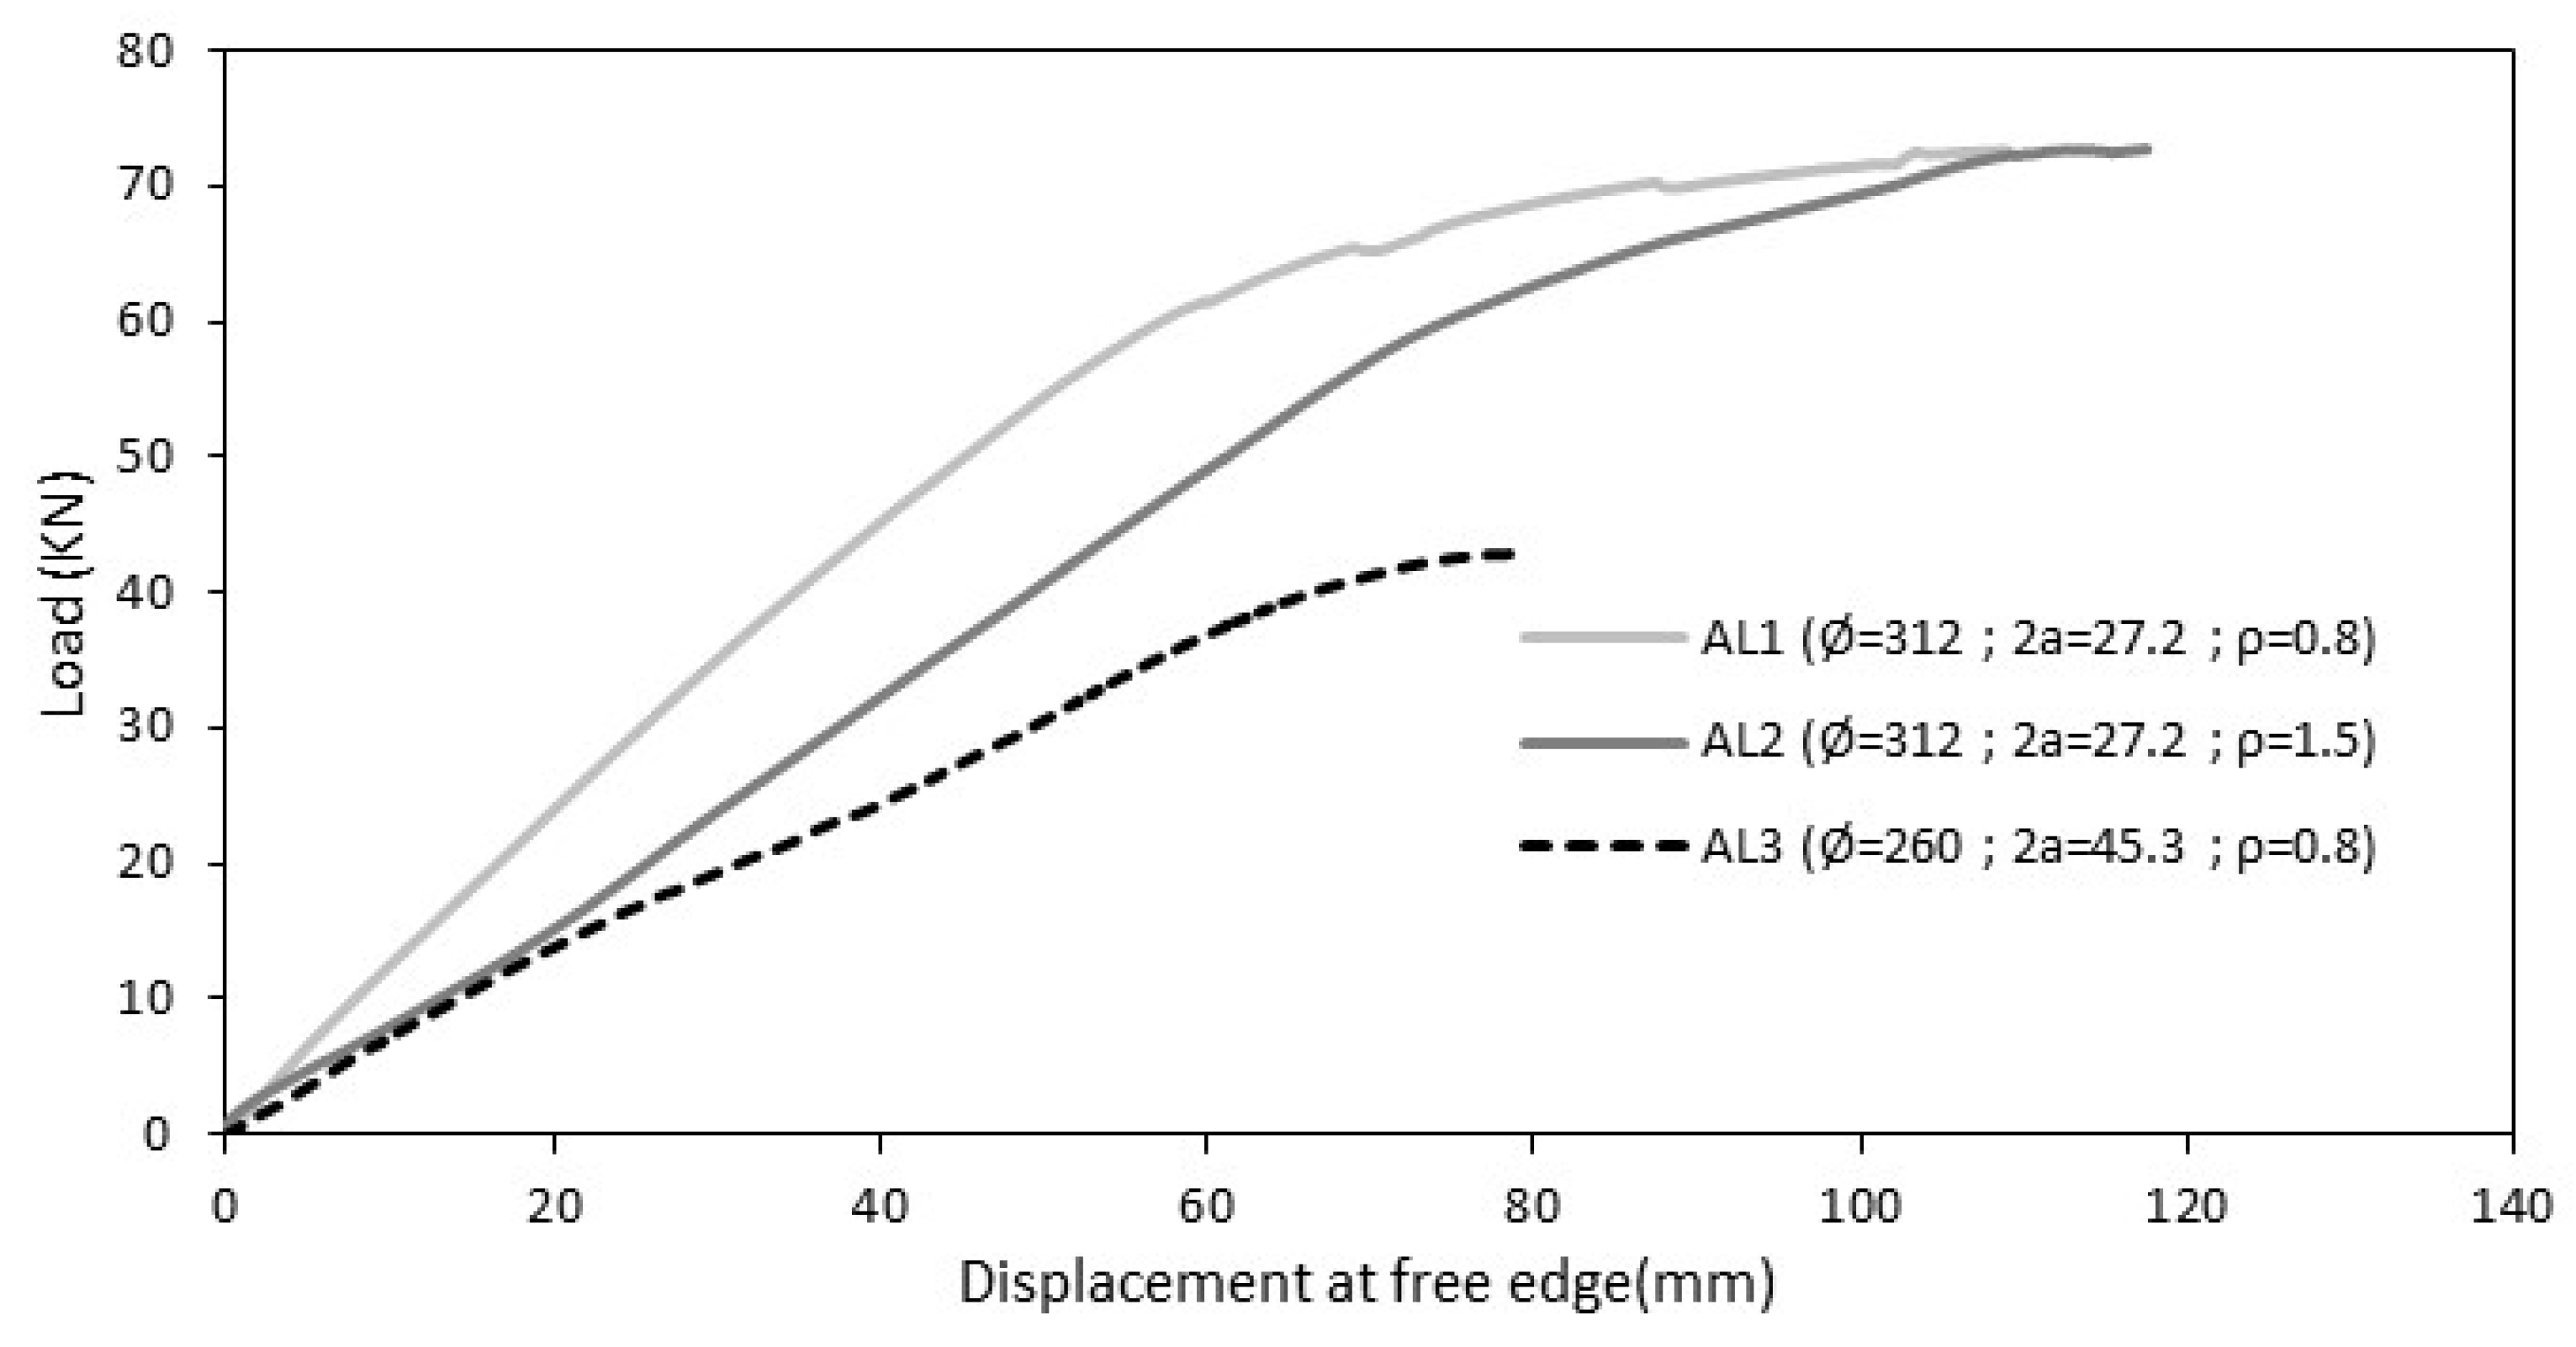
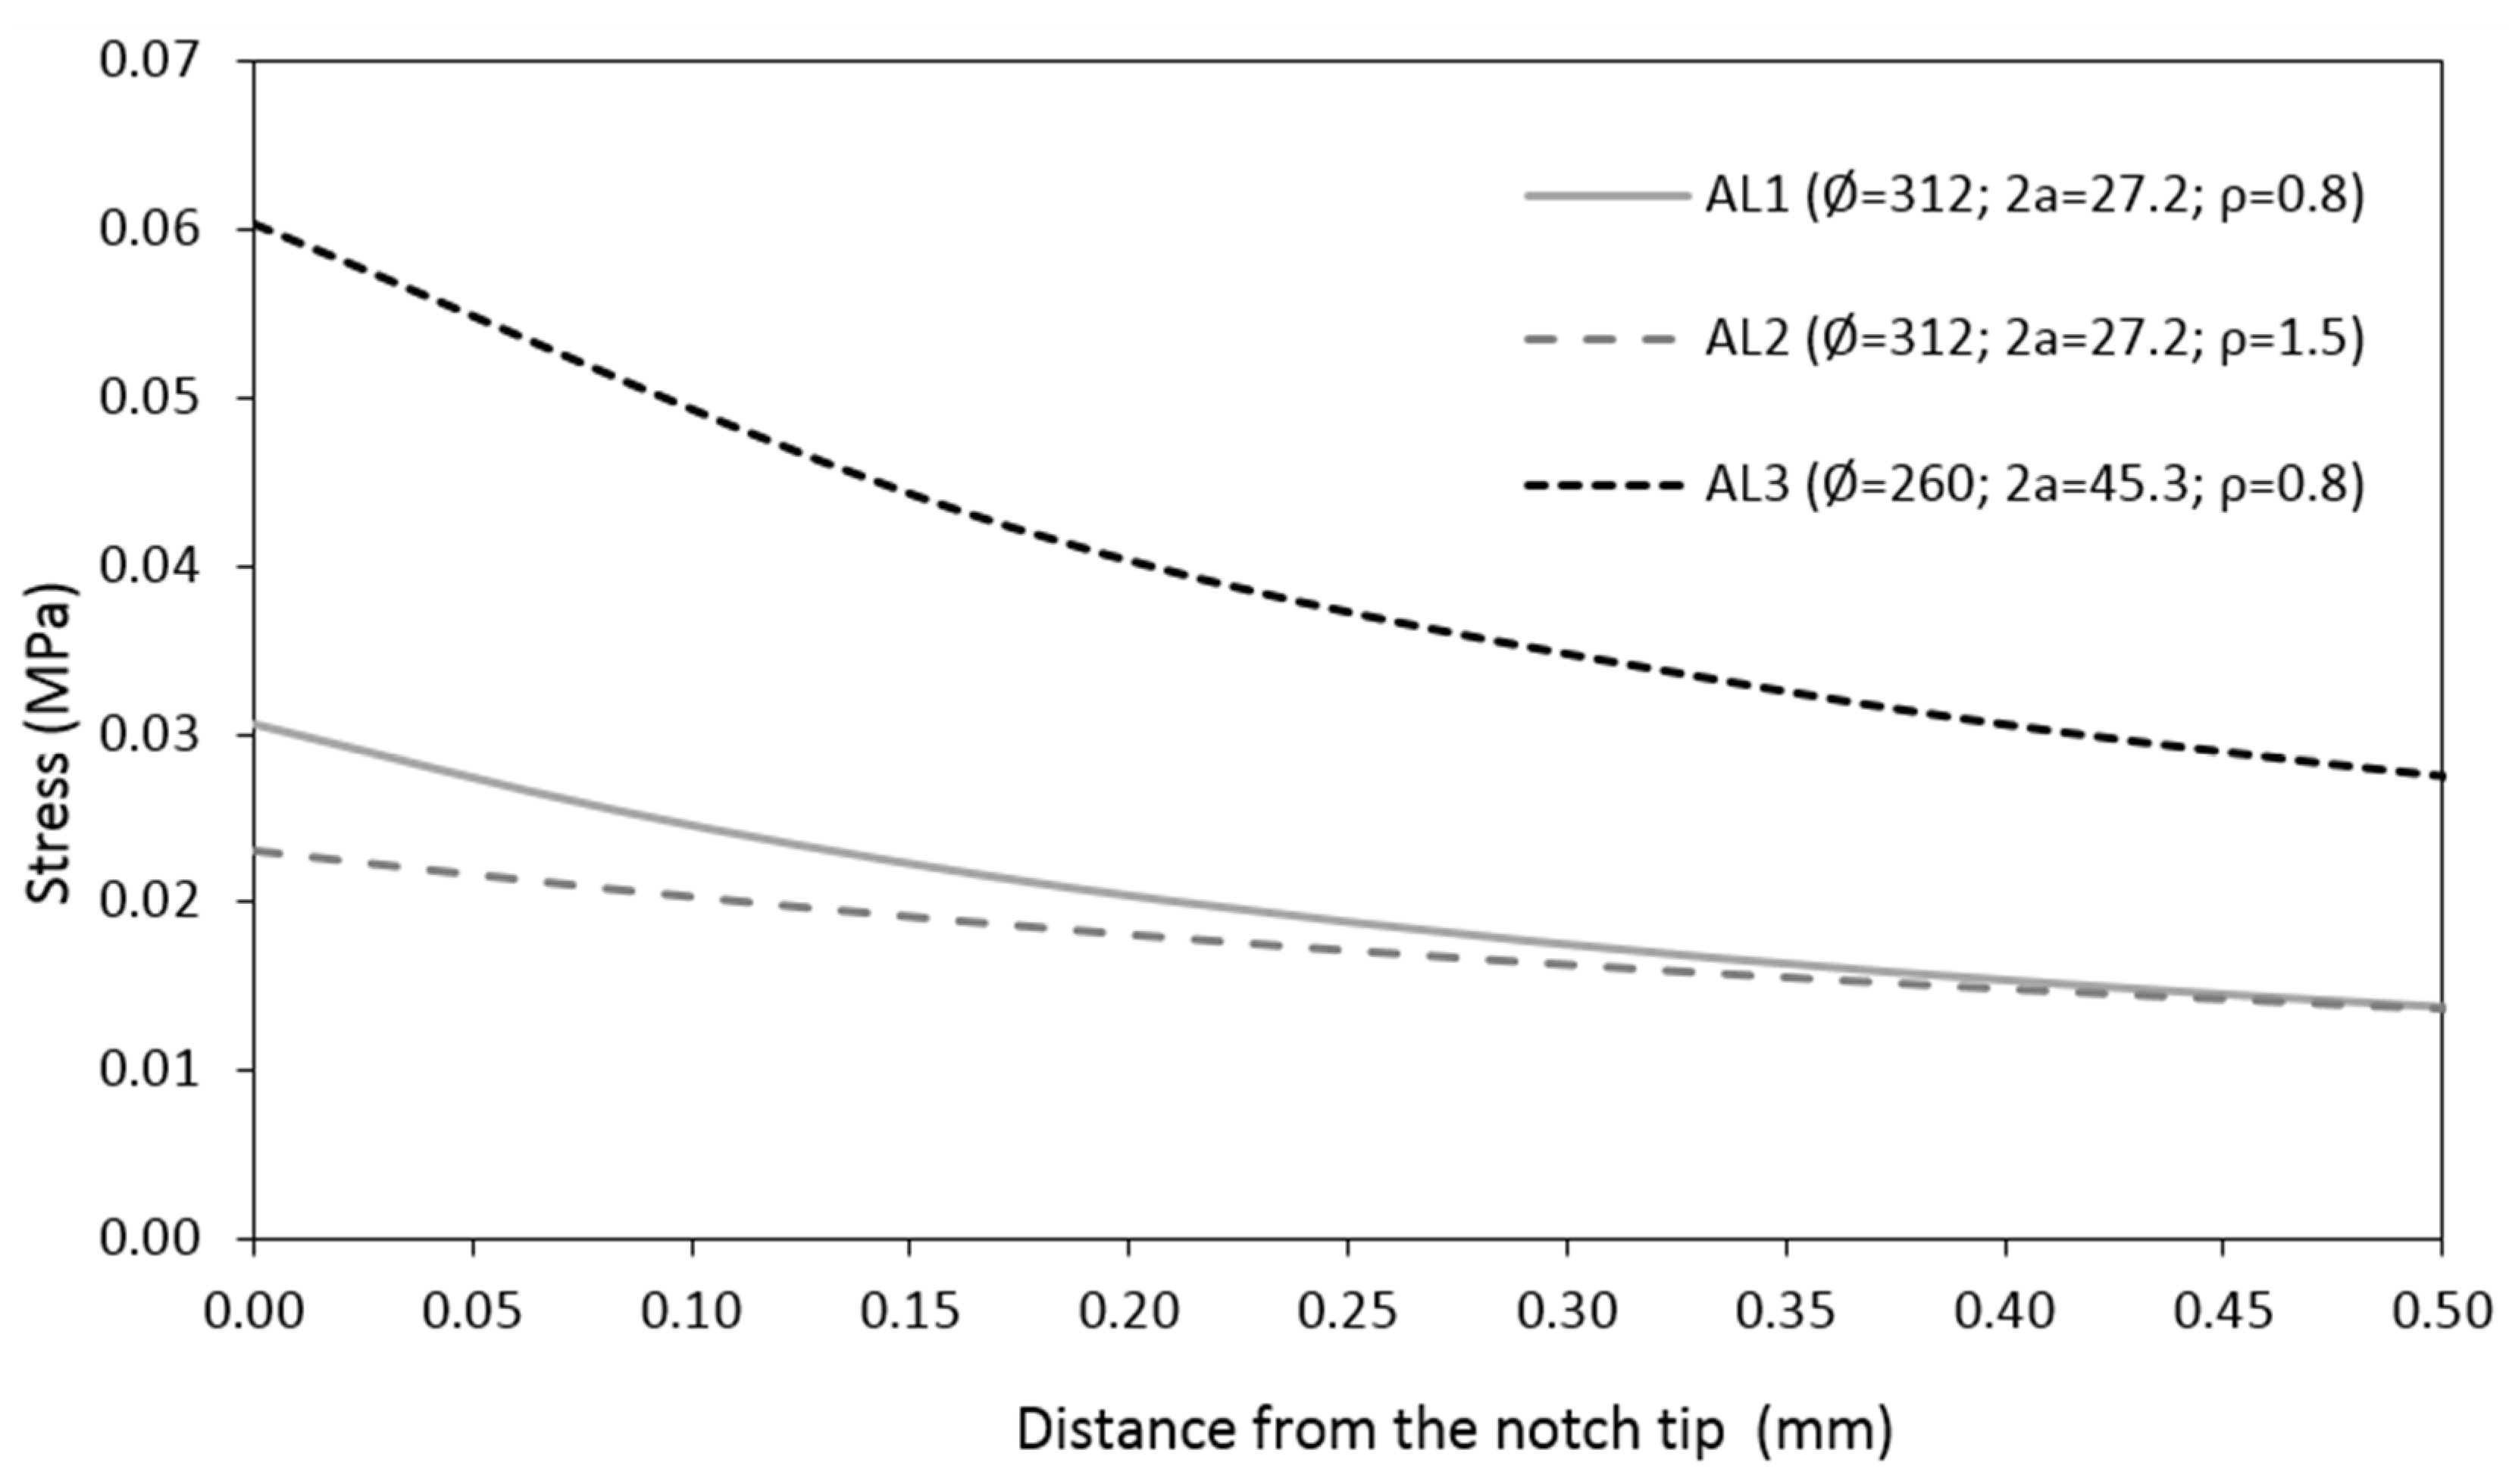
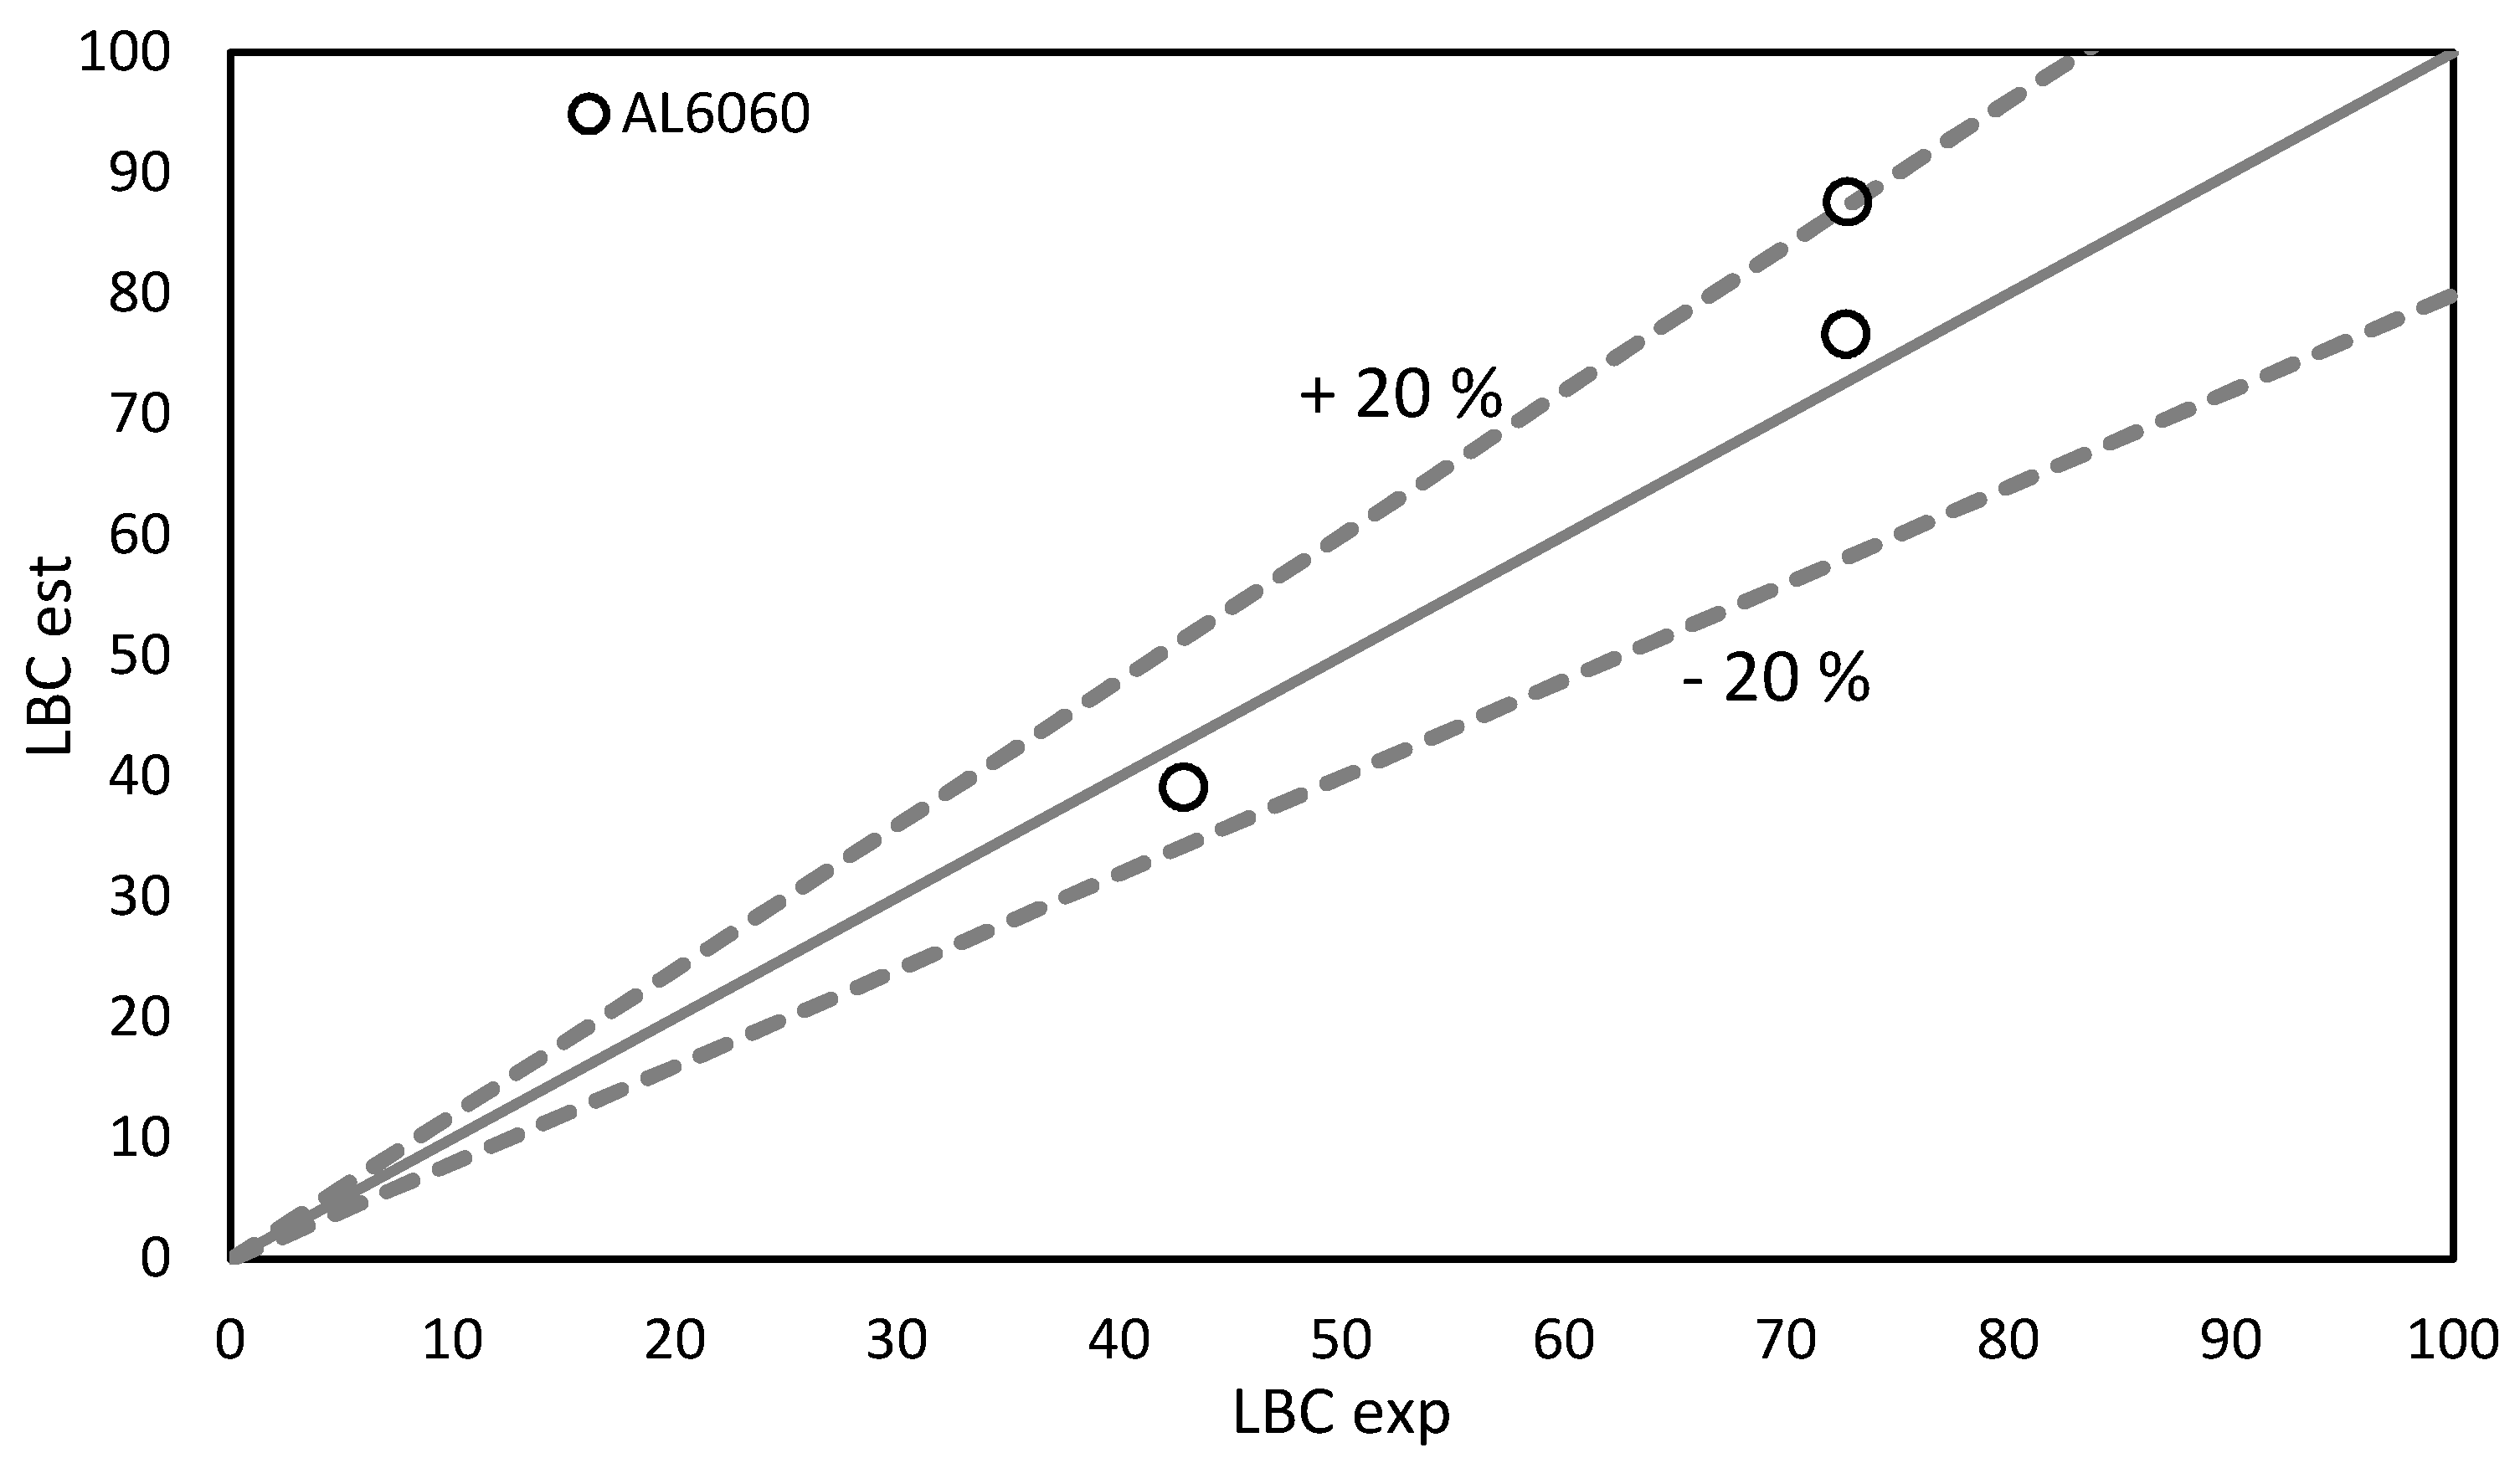
3. Results
4. Conclusions
Author Contributions
Funding
Conflicts of Interest
References
- Kocak, M.; Webster, S.; Janosch, J.J.; Ainsworth, R.A.; Koers, R. FITNET Fitness-for-Service (FFS) Procedure; GKSS: Hamburg, Germany, 2008; Volume 1. [Google Scholar]
- BS7910, Guide to Methods for Assessing the Acceptability of Flaws in Metallic Structures; British Standards Institution: London, UK, 2019.
- R6: Assessment of the Integrity of Structures Containing Defects, Rev. 4; EDF Energy: Gloucester, UK, 2015.
- Anderson, T.L. Fracture Mechanics: Fundamentals and Applications, 4th ed.; CRC Press—Taylor and Francis Group: Boca Raton, FL, USA, 2005. [Google Scholar]
- Broek, D. Elementary Engineering Fracture Mechanics, 4th ed.; Martinus Nijhoff: Dordrecht, The Netherlands, 2012. [Google Scholar]
- Stasiewicz, P. Analytical and Experimental Studies of Stability of Cylindrical Shells with a Cut-Out. Mech. Mech. Eng. 2013, 17, 167–176. [Google Scholar]
- Staat, M. Local and global collapse pressure of longitudinally flawed pipes and cylindrical vessels. Int. J. Press. Vessel. Pip. 2005, 82, 217–225. [Google Scholar] [CrossRef]
- Ahn, S.-H.; Nam, K.W.; Takahashi, K.; Ando, K. Comparison of experimental and finite element analytical results for the strength and the deformation of pipes with local wall thinning subjected to bending moment. Nucl. Eng. Des. 2006, 236, 140–155. [Google Scholar] [CrossRef]
- Schenk, C.A.; Schuëller, G.I. Buckling analysis of cylindrical shells with cutouts including random boundary and geometric imperfections. Comput. Methods Appl. Mech. Eng. 2007, 196, 3424–3434. [Google Scholar] [CrossRef]
- Yeh, M.-K.; Lin, M.-C.; Wu, W.-T. Bending buckling of an elastoplastic cylindrical shell with a cutout. Eng. Struct. 1999, 21, 996–1005. [Google Scholar] [CrossRef]
- Alashti, R.A.; Rahimi, G.H.; Poursaeidi, E. Plastic limit load of cylindrical shells with cutouts subject to pure bending moment. Int. J. Press. Vessel. Pip. 2008, 85, 498–506. [Google Scholar] [CrossRef]
- Cicero, S.; Madrazo, V.; Carrascal, I.A. Analysis of notch effect in PMMA using the Theory of Critical Distances. Eng. Fract. Mech. 2012, 86, 56–72. [Google Scholar] [CrossRef]
- Taylor, D.; Merlo, M.; Pegley, R.; Cavatorta, M.P. The effect of stress concentrations on the fracture strength of polymethylmethacrylate. Mater. Sci. Eng. A 2004, 382, 288–294. [Google Scholar] [CrossRef]
- Taylor, D. The theory of critical distances applied to the prediction of brittle fracture in metallic materials. Struct. Durab. Health Monit. 2005, 1, 145. [Google Scholar] [CrossRef]
- Madrazo, V.; Cicero, S.; Carrascal, I.A. On the Point Method and the Line Method notch effect predictions in Al7075-T651. Eng. Fract. Mech. 2012, 79, 363–379. [Google Scholar] [CrossRef]
- Ibáñez-Gutiérrez, F.T.; Cicero, S. Fracture assessment of notched short glass fibre reinforced polyamide 6: An approach from failure assessment diagrams and the theory of critical distances. Compos. Part B Eng. 2017, 111, 124–133. [Google Scholar] [CrossRef]
- Cicero, S.; García, T.; Castro, J.; Madrazo, V.; Andrés, D. Analysis of notch effect on the fracture behaviour of granite and limestone: An approach from the Theory of Critical Distances. Eng. Geol. 2014, 177, 1–9. [Google Scholar] [CrossRef]
- Castro, J.; Cicero, S.; Sagaseta, C. A Criterion for Brittle Failure of Rocks Using the Theory of Critical Distances. Rock Mech. Rock Eng. 2015, 49, 63–77. [Google Scholar] [CrossRef]
- Taylor, D. The Theory of Critical Distances: A New Perspective in Fracture Mechanics; Elsevier: London, UK, 2007. [Google Scholar]
- Gutiérrez, P.; Cicero, S.; Martínez, B.; Álvarez, J.A. A Theory of Critical Distances based methodology for the analysis of environmentally assisted cracking in steels. Eng. Fract. Mech. 2019, 214, 134–148. [Google Scholar]
- Gallo, P.; Yan, Y.; Sumigawa, T.; Kitamura, T. Fracture Behavior of Nanoscale Notched Silicon Beams Investigated by the Theory of Critical Distances. Adv. Theory Simul. 2017, 1, 1700006. [Google Scholar] [CrossRef]
- Gallo, P.; Sapora, A. Brittle Failure of Nanoscale Notched Silicon Cantilevers: A Finite Fracture Mechanics Approach. Appl. Sci. 2020, 10, 1640. [Google Scholar] [CrossRef]
- Neuber, H. Theorie der technischen Formzahl. Forsch. Auf. Dem. Geb. Des. Ing. A 1936, 7, 271–274. [Google Scholar] [CrossRef]
- Peterson, R.E. Notch Sensitivity, Metal Fatigue; Sines, G., Lwaisman, J., Eds.; McGrawrHill: New York, NY, USA, 1959. [Google Scholar]
- EN 573-1:2005, Aluminium and Aluminium Alloys—Chemical Composition and Form of Wrought Products; European Committee for Standardization: Brussels, Belgium, 2015.
- ASTM E8/E8M-16ae1, Standard Test Methods for Tension Testing of Metallic Materials; ASTM International: West Conshohocken, PA, USA, 2016.
- ASTM E1820-20, Standard Test Method for Measurement of Fracture Toughness; ASTM International: West Conshohocken, PA, USA, 2020.
- Cicero, S.; Madrazo, V.; García, T.; Cuervo, J.; Ruiz, E. On the notch effect in load bearing capacity, apparent fracture toughness and fracture mechanisms of polymer PMMA, aluminium alloy Al7075-T651 and structural steels S275JR and S355J2. Eng. Fail. Anal. 2013, 29, 108–121. [Google Scholar] [CrossRef]
- Cicero, S.; Madrazo, V.; García, T. On the assessment of U-shaped notches using Failure Assessment Diagrams and the Line Method: Experimental overview and validation. Theor. Appl. Fract. Mech. 2015, 80, 235–241. [Google Scholar] [CrossRef]
- Berto, F.; Lazzarin, P. Recent developments in brittle and quasi-brittle failure assessment of engineering materials by means of local approaches. Mater. Sci. Eng. R Rep. 2014, 75, 1–48. [Google Scholar] [CrossRef]


| Si | Fe | Cu | Mn | Mg | Cr | Zn | Ti | Al |
|---|---|---|---|---|---|---|---|---|
| 0.30–0.60 | 0.10–0.30 | ≤0.10 | ≤0.10 | 0.35–0.60 | ≤0.05 | ≤0.15 | ≤0.10 | balance |
| Tube | Material | Ø | B | D | L | 2a | ρ |
|---|---|---|---|---|---|---|---|
| AL1 | AL6060-T66 | 312 | 6.0 | 30.4 | 1451 | 27.2 | 0.8 |
| AL2 | AL6060-T66 | 312 | 6.0 | 27.0 | 1448 | 27.2 | 1.5 |
| AL3 | AL6060-T66 | 260 | 5.0 | 21. | 1452 | 45.3 | 0.8 |
| Material | E (MPa) | σ0.2 (MPa) | σu (MPa) | εmax (%) |
|---|---|---|---|---|
| AL 6060 | 70,750 ± 554 | 215.0 ± 1.7 | 264.4 ± 1.8 | 11.60 ± 0.31 |
| Material | Specimen | ρ (mm) | Defect Length (mm) | Critical Load (N) | KNmat (MPa∙m1/2) |
|---|---|---|---|---|---|
| AL6060-T66 | 0-1 | 0 | 4.23 | 1208.8 | 51.89 |
| 0-2 | 4.62 | 1341.6 | 59.42 | ||
| 1-1 | 1 | 5.00 | 1235.8 | 96.53 | |
| 1-2 | 5.00 | 1236.2 | 92.62 | ||
| 1-3 | 5.00 | 1226.7 | 103.56 | ||
| 2-1 | 2 | 5.00 | 1296.1 | 125.49 | |
| 2-2 | 5.00 | 1259.2 | 116.47 | ||
| 2-3 | 5.00 | 1259.2 | 130.03 |
| Tube | L (mm) | σo (MPa) | LBCexp (kN) | LBCest (kN) |
|---|---|---|---|---|
| AL1 | 0.22 | 920 | 72.65 | 76.67 |
| AL2 | 72.75 | 87.62 | ||
| AL3 | 42.86 | 39.15 |
Publisher’s Note: MDPI stays neutral with regard to jurisdictional claims in published maps and institutional affiliations. |
© 2020 by the authors. Licensee MDPI, Basel, Switzerland. This article is an open access article distributed under the terms and conditions of the Creative Commons Attribution (CC BY) license (http://creativecommons.org/licenses/by/4.0/).
Share and Cite
Sánchez, M.; Cicero, S.; Arroyo, B.; Álvarez, J.A. Coupling Finite Element Analysis and the Theory of Critical Distances to Estimate Critical Loads in Al6060-T66 Tubular Beams Containing Notches. Metals 2020, 10, 1395. https://doi.org/10.3390/met10101395
Sánchez M, Cicero S, Arroyo B, Álvarez JA. Coupling Finite Element Analysis and the Theory of Critical Distances to Estimate Critical Loads in Al6060-T66 Tubular Beams Containing Notches. Metals. 2020; 10(10):1395. https://doi.org/10.3390/met10101395
Chicago/Turabian StyleSánchez, Marcos, Sergio Cicero, Borja Arroyo, and José Alberto Álvarez. 2020. "Coupling Finite Element Analysis and the Theory of Critical Distances to Estimate Critical Loads in Al6060-T66 Tubular Beams Containing Notches" Metals 10, no. 10: 1395. https://doi.org/10.3390/met10101395
APA StyleSánchez, M., Cicero, S., Arroyo, B., & Álvarez, J. A. (2020). Coupling Finite Element Analysis and the Theory of Critical Distances to Estimate Critical Loads in Al6060-T66 Tubular Beams Containing Notches. Metals, 10(10), 1395. https://doi.org/10.3390/met10101395