A Study on the Stability Fields of Arc Plasma in the HPSR Process


Abstract
1. Introduction
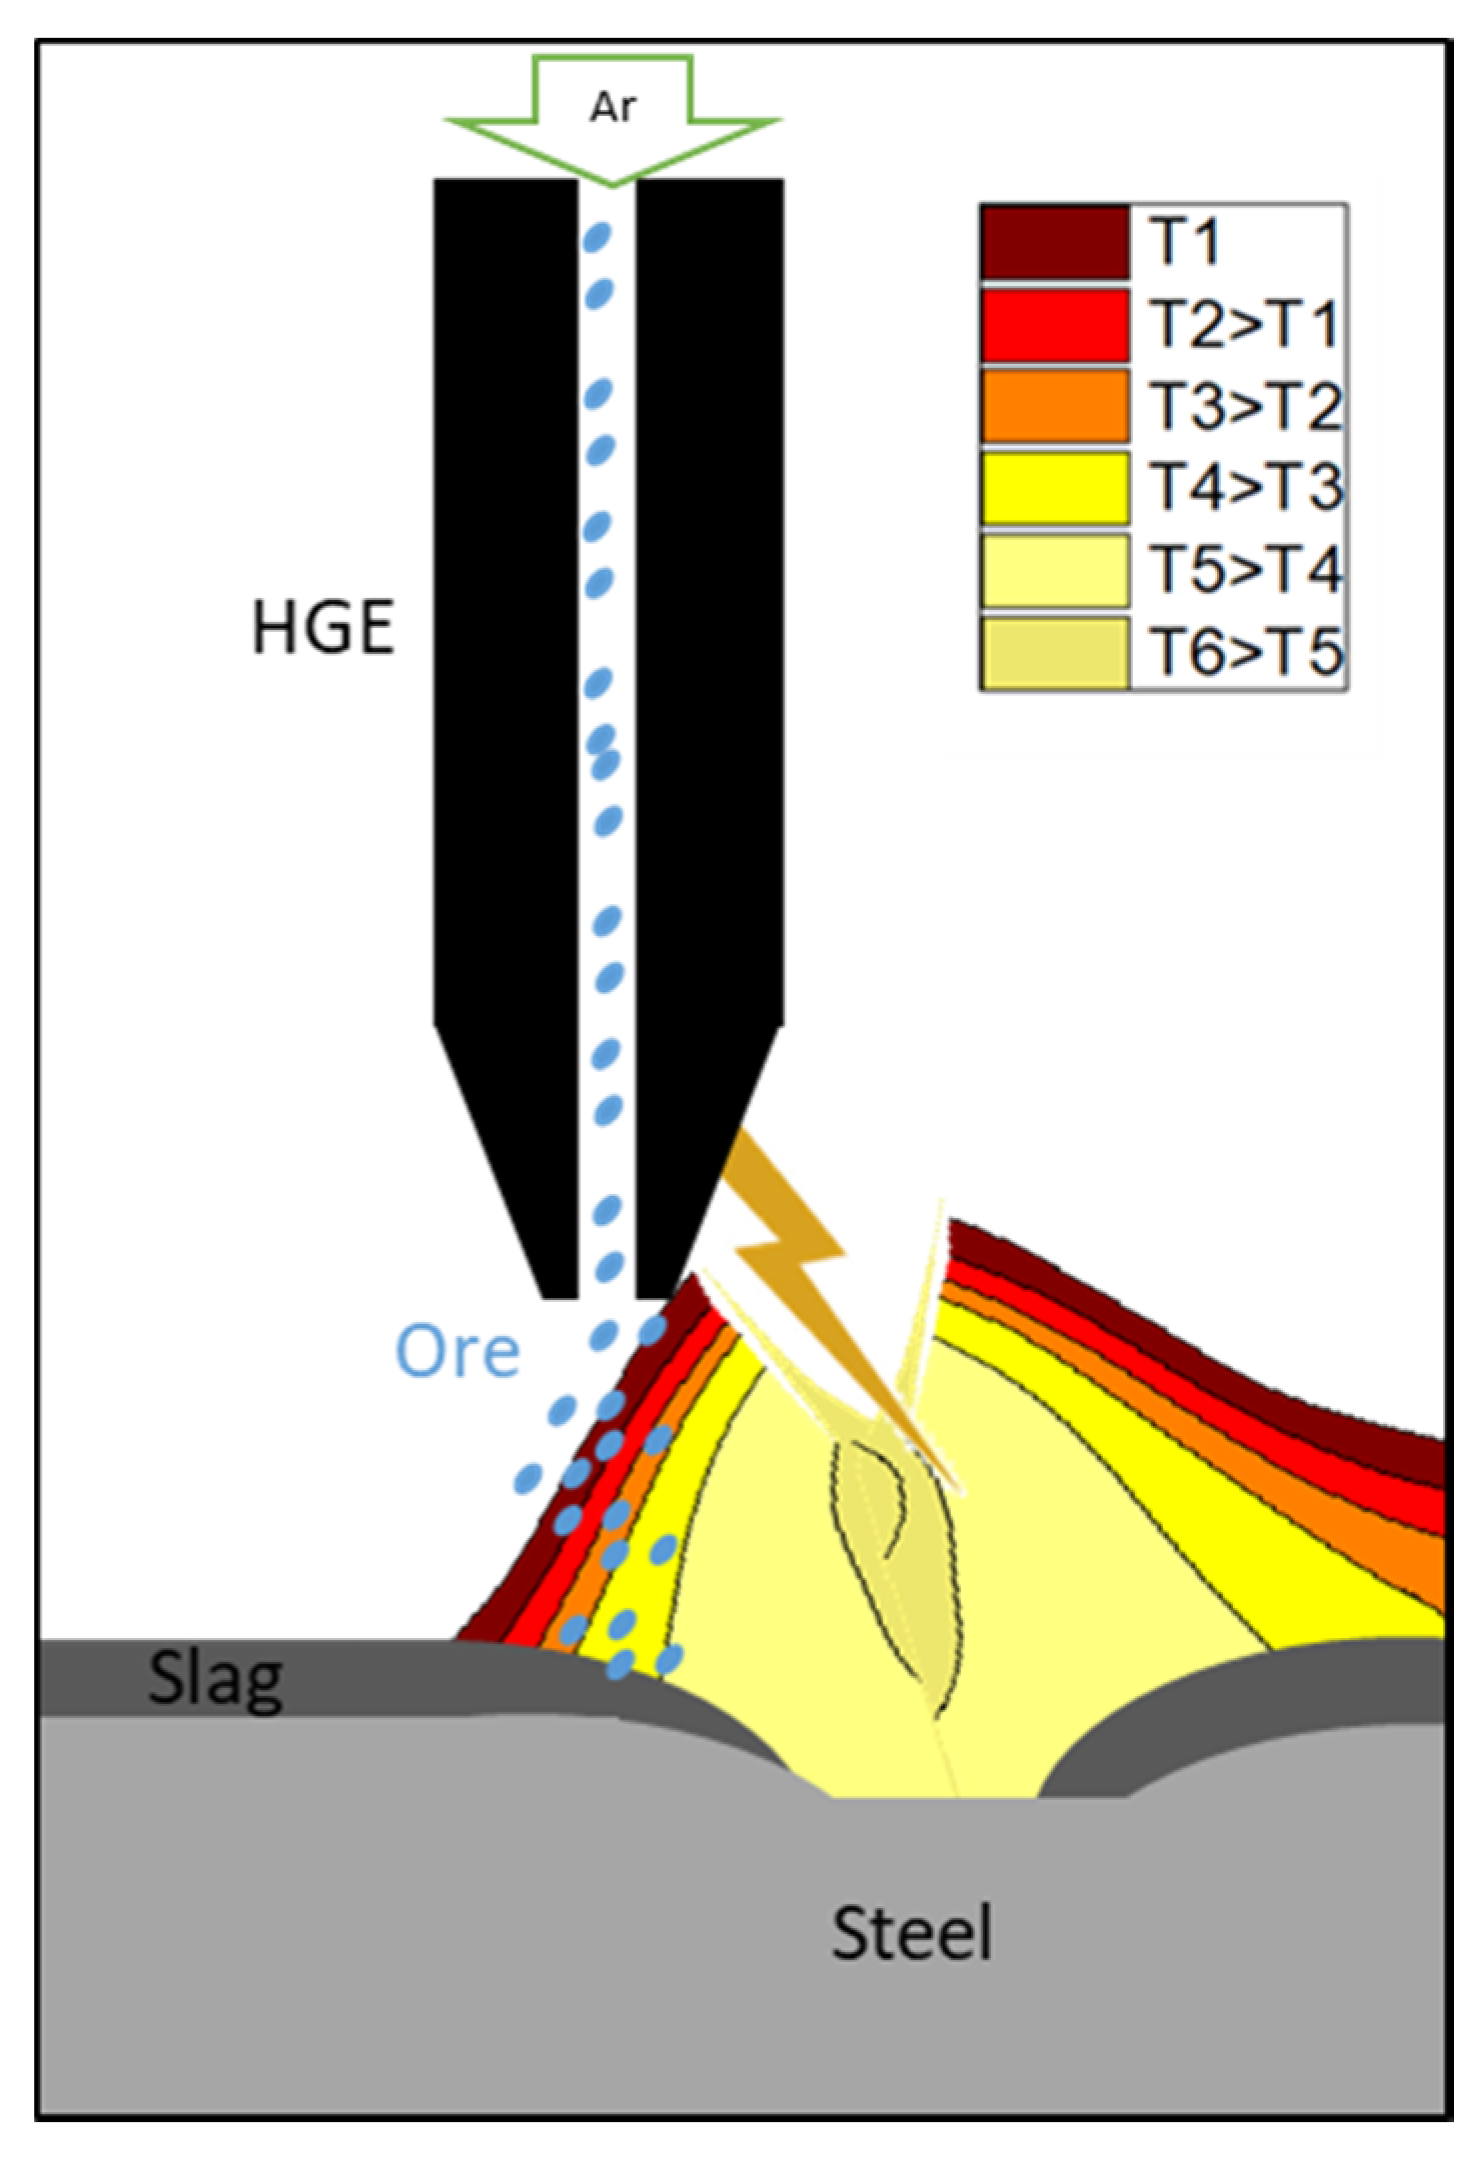
2. Arc Plasma Basics for the HPSR Process
- •
- Free ions and electrons;
- •
- Electrical conductivity;
- •
- Magnetic force;
- •
- Light and photon emission.
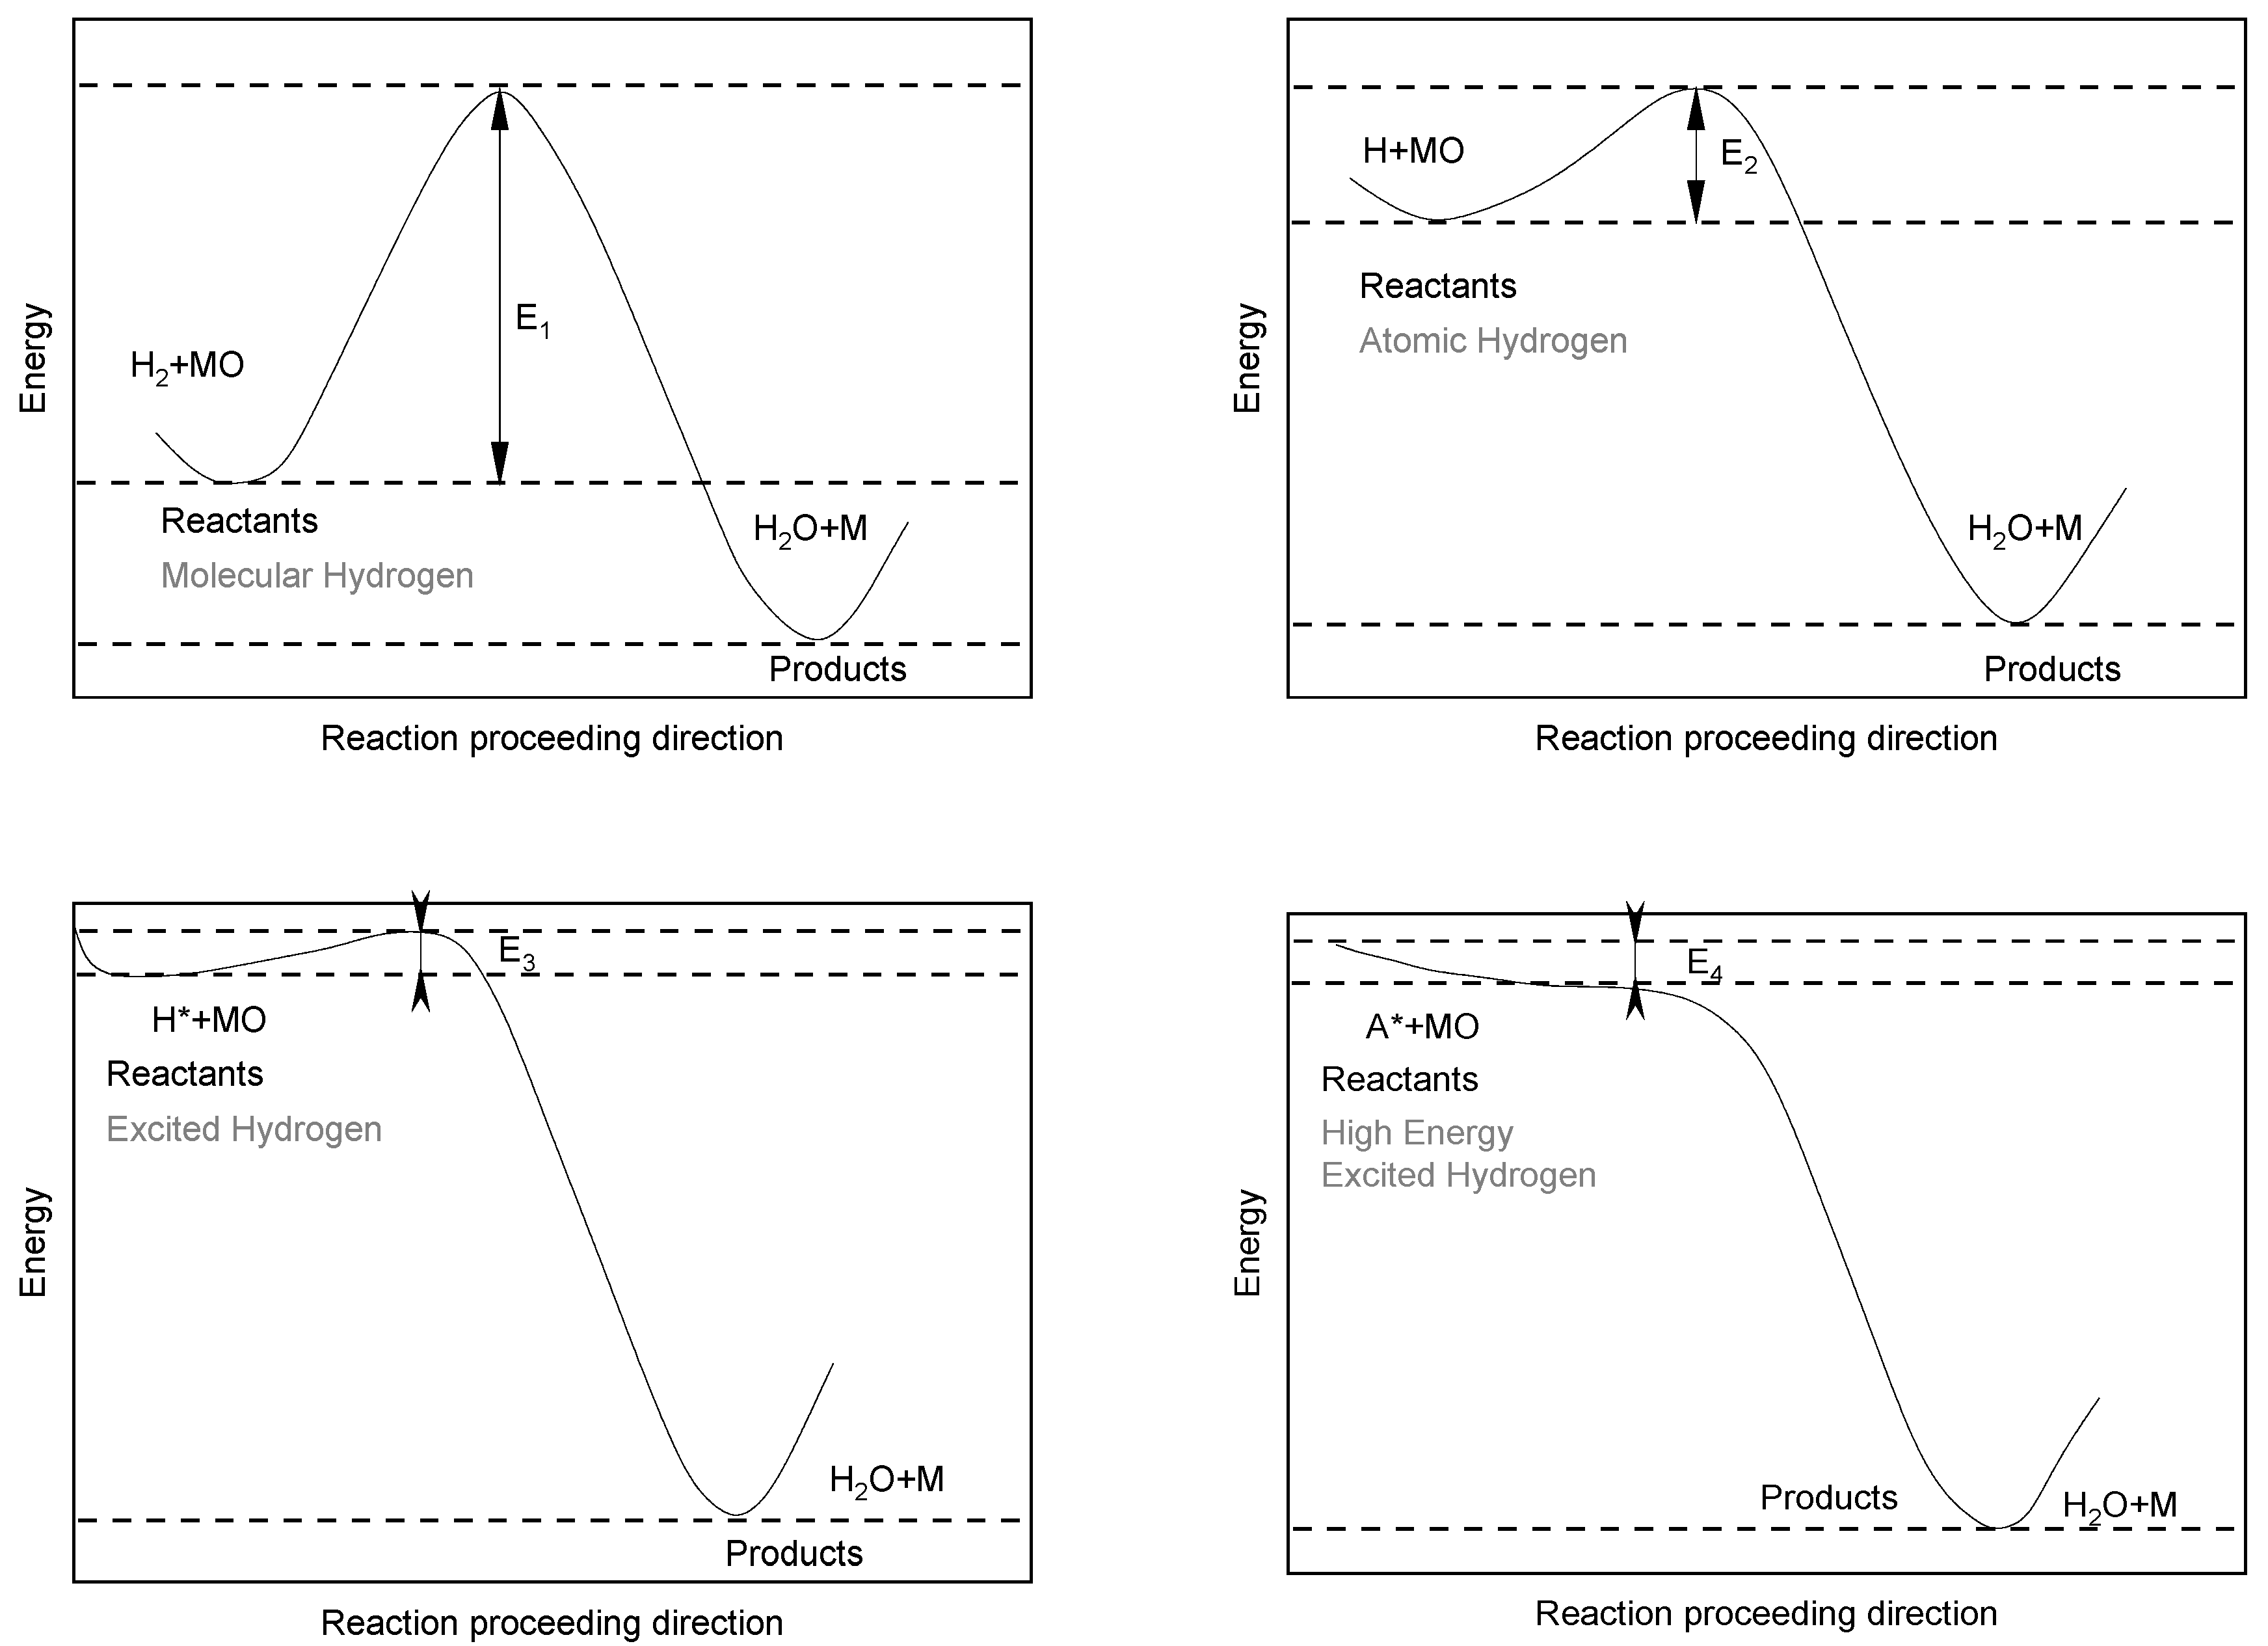
2.1. HPSR Basics of Thermodynamics and Kinetics
2.2. The Importance of Arc Stability in the HPSR Process
2.3. Aim of the Work Shown
- •
- The arc is burning for a timeframe of 10 s without any signs of instability;
- •
- The arc has a minimum length of 20 mm;
- •
- The arc is centered all the time (mainly important for longer arcs).

- Lmax: Maximum valid arc length [mm]
- harc: Minimum arc length under perfect conditions [mm]
- dcruc: Diameter of the crucible [mm]
- dHGE: Diameter of the HE [mm]
- fabs: Absolute error [mm]
- frel: Relative error [%]
3. Materials and Methods
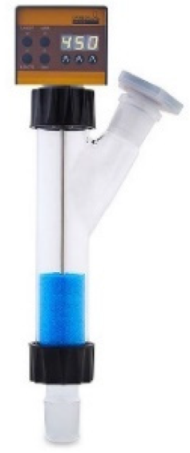
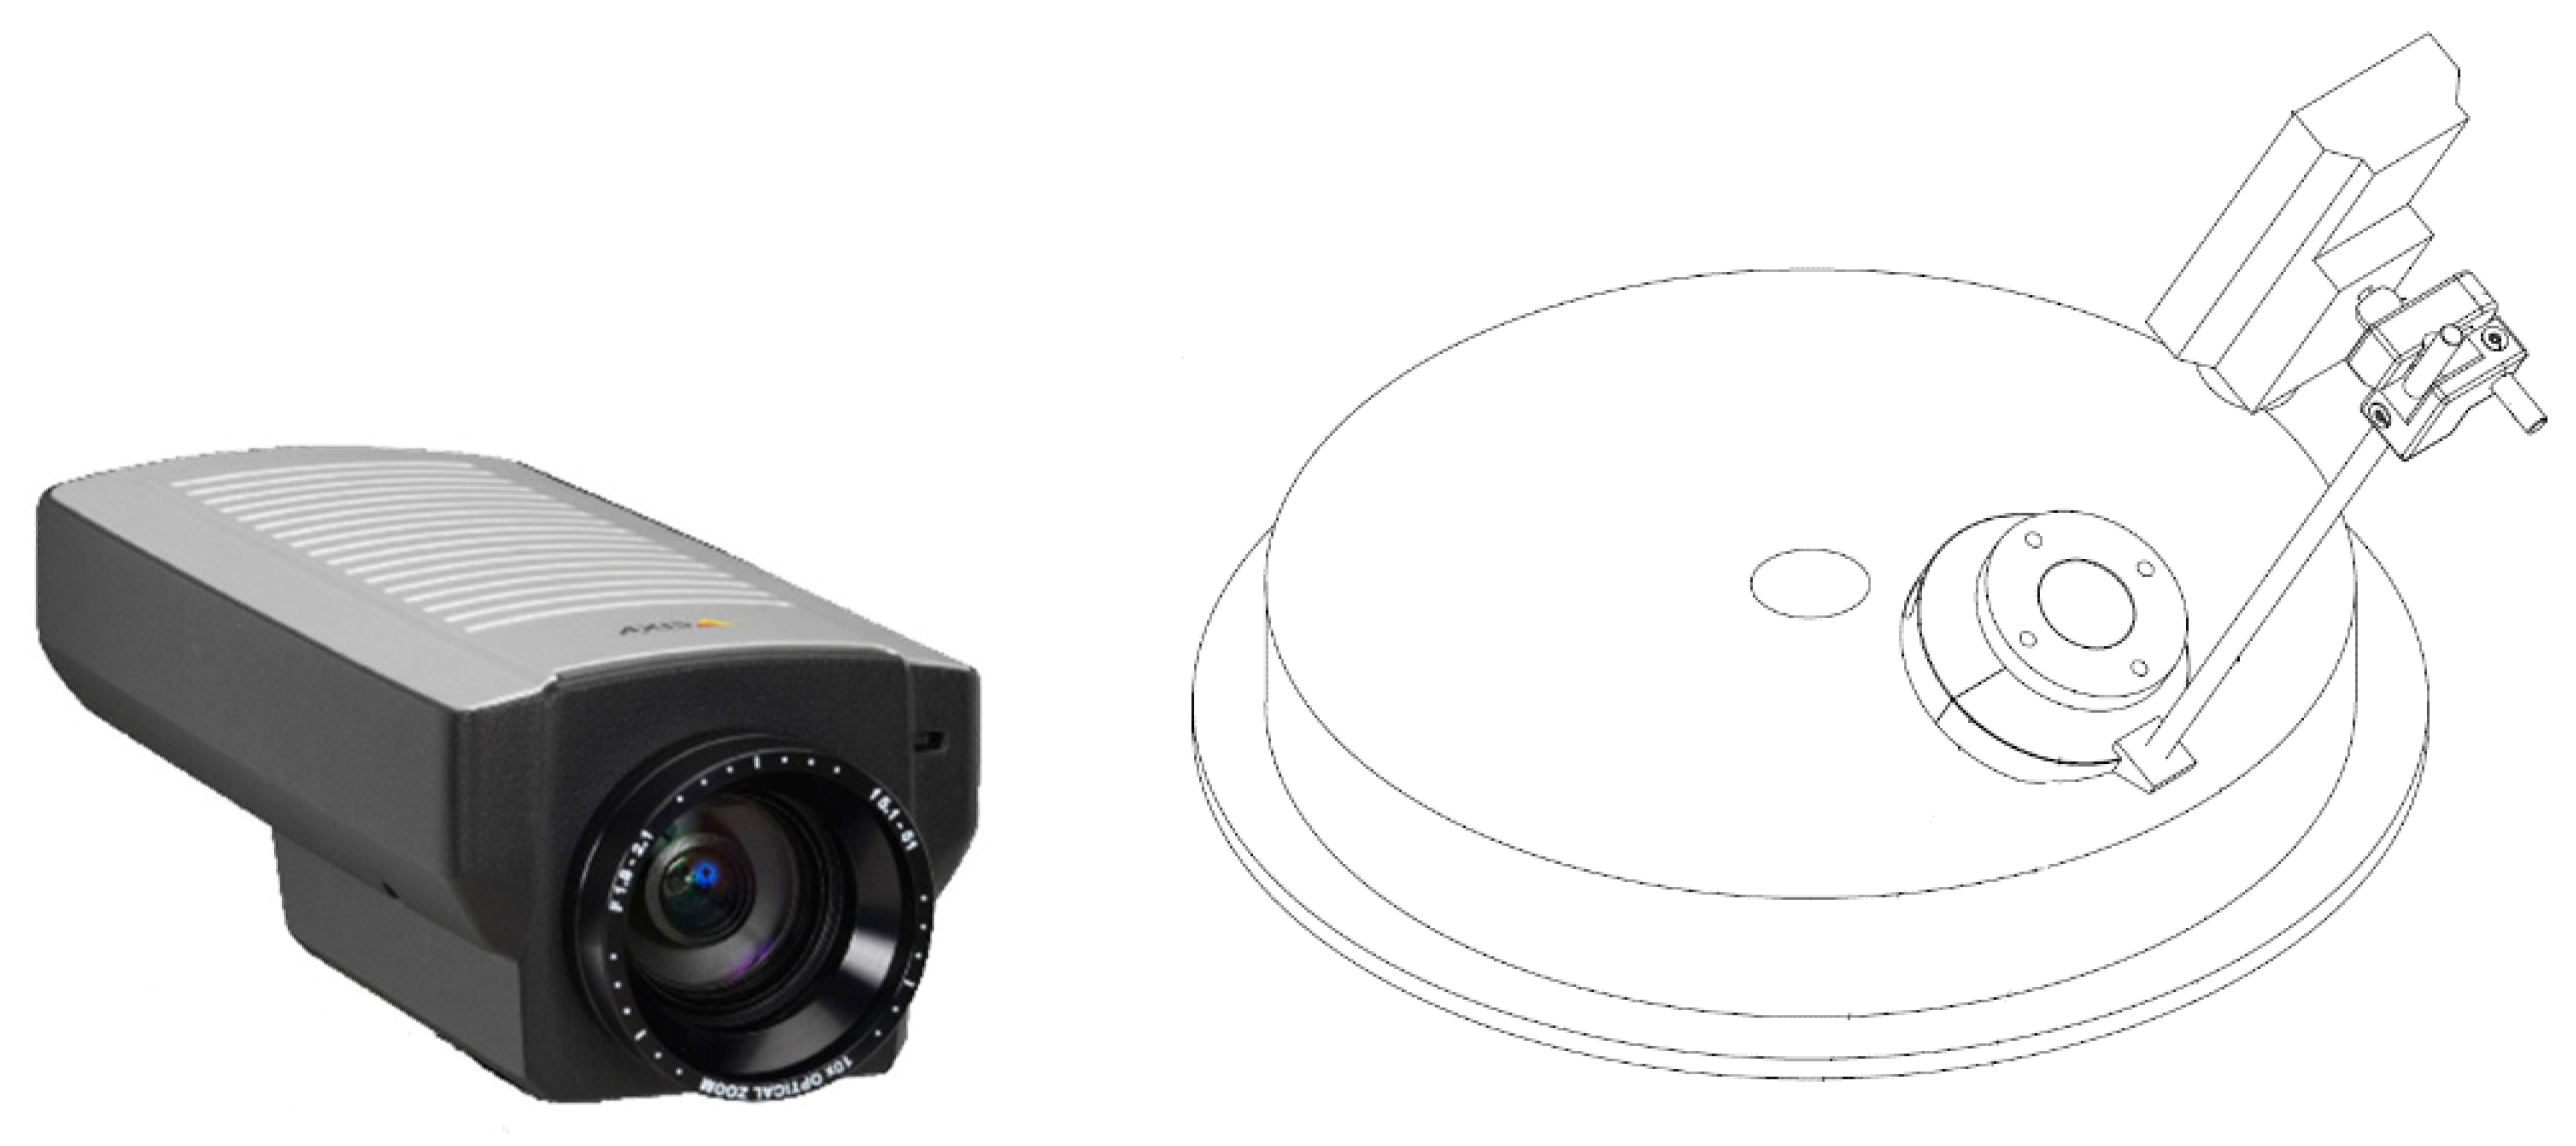
3.1. HPSR Laboratory Equipment
3.2. Experimental Program and Materials
- Set Grp 1.
- Single gases and mixtures of argon and hydrogen;
- Set Grp 2.
- Single gases and mixtures of argon and nitrogen;
- Set Grp 3.
- Single gases and mixtures of nitrogen and hydrogen.

| Number of Exp. Set Grp 1 | Power Level(1/2) | Hydrogen in Argon (%) | Variation of Current (% of Imax) | Variation of Arc Length (mm) | Charging of 3 g/min Iron Ore |
| 1 | 1 | 0 | 60–100 | 20–45 | steel |
| 2 | 1 | 10 | 70–100 | 20–45 | steel |
| 3 | 1 | 20 | 70–100 | 20–45 | steel |
| 4 | 1 | 30 | 80–100 | 20–45 | steel |
| 5 | 1 | 40 | 80–100 | 20–45 | steel |
| 6 | 1 | 40 | 85–100 | 20–45 | continuous |
| 7 | 2 | 0 | 60–100 | 20–45 | steel |
| 8 | 2 | 10 | 70–100 | 20–45 | steel |
| 9 | 2 | 20 | 70–100 | 20–45 | steel |
| 10 | 2 | 30 | 75–100 | 20–45 | steel |
| 11 | 2 | 40 | 75–100 | 20–45 | steel |
| 12 | 2 | 40 | 80–100 | 20–45 | continuous |
| Number of Exp. Set Grp 2 | Power Level (1/2) | Nitrogen in Argon (%) | Variation of Current (% of Imax) | Variation of Arc Length (mm) | Charging of 3 g/min Iron Ore |
| 13 | 1 | 0% | 60–100% | 20–45 | steel |
| 14 | 1 | 50% | 70–100% | 20–45 | steel |
| 15 | 1 | 100% | 75–100% | 20–45 | steel |
| 16 | 2 | 0% | 60–100% | 20–45 | steel |
| 17 | 2 | 50% | 70–100% | 20–45 | steel |
| 18 | 2 | 100% | 75–100% | 20–45 | steel |
| Number of Exp. Set Grp 3 | Power Level(1/2) | Hydrogen in Nitrogen (%) | Variation of Current (% of Imax) | Variation of Arc Length (mm) | Charging of 3 g/min Iron Ore |
| 19 | 1 | 0% | 75–100% | 20–45 | steel |
| 20 | 1 | 40% | 85–100% | 20–45 | steel |
| 21 | 2 | 0% | 75–100% | 20–45 | steel |
| 22 | 2 | 40% | 80–100% | 20–45 | steel |
3.3. Description of the Operation
Example of the Operation in the Case of Group 1 Set 2 (10% Hydrogen in Argon at Variations of Arc Length and Supplied Current)
3.4. Methods for the Evaluation
- Arc stability maps;
- Fields of stability.
3.4.1. Arc Stability Maps
- Green: clearly stable;
- Petrol: showed stable behavior, but can be unstable under certain circumstances;
- Orange: showed unstable behavior, but can be stable under certain circumstances;
- Red: clearly unstable or extinguished.
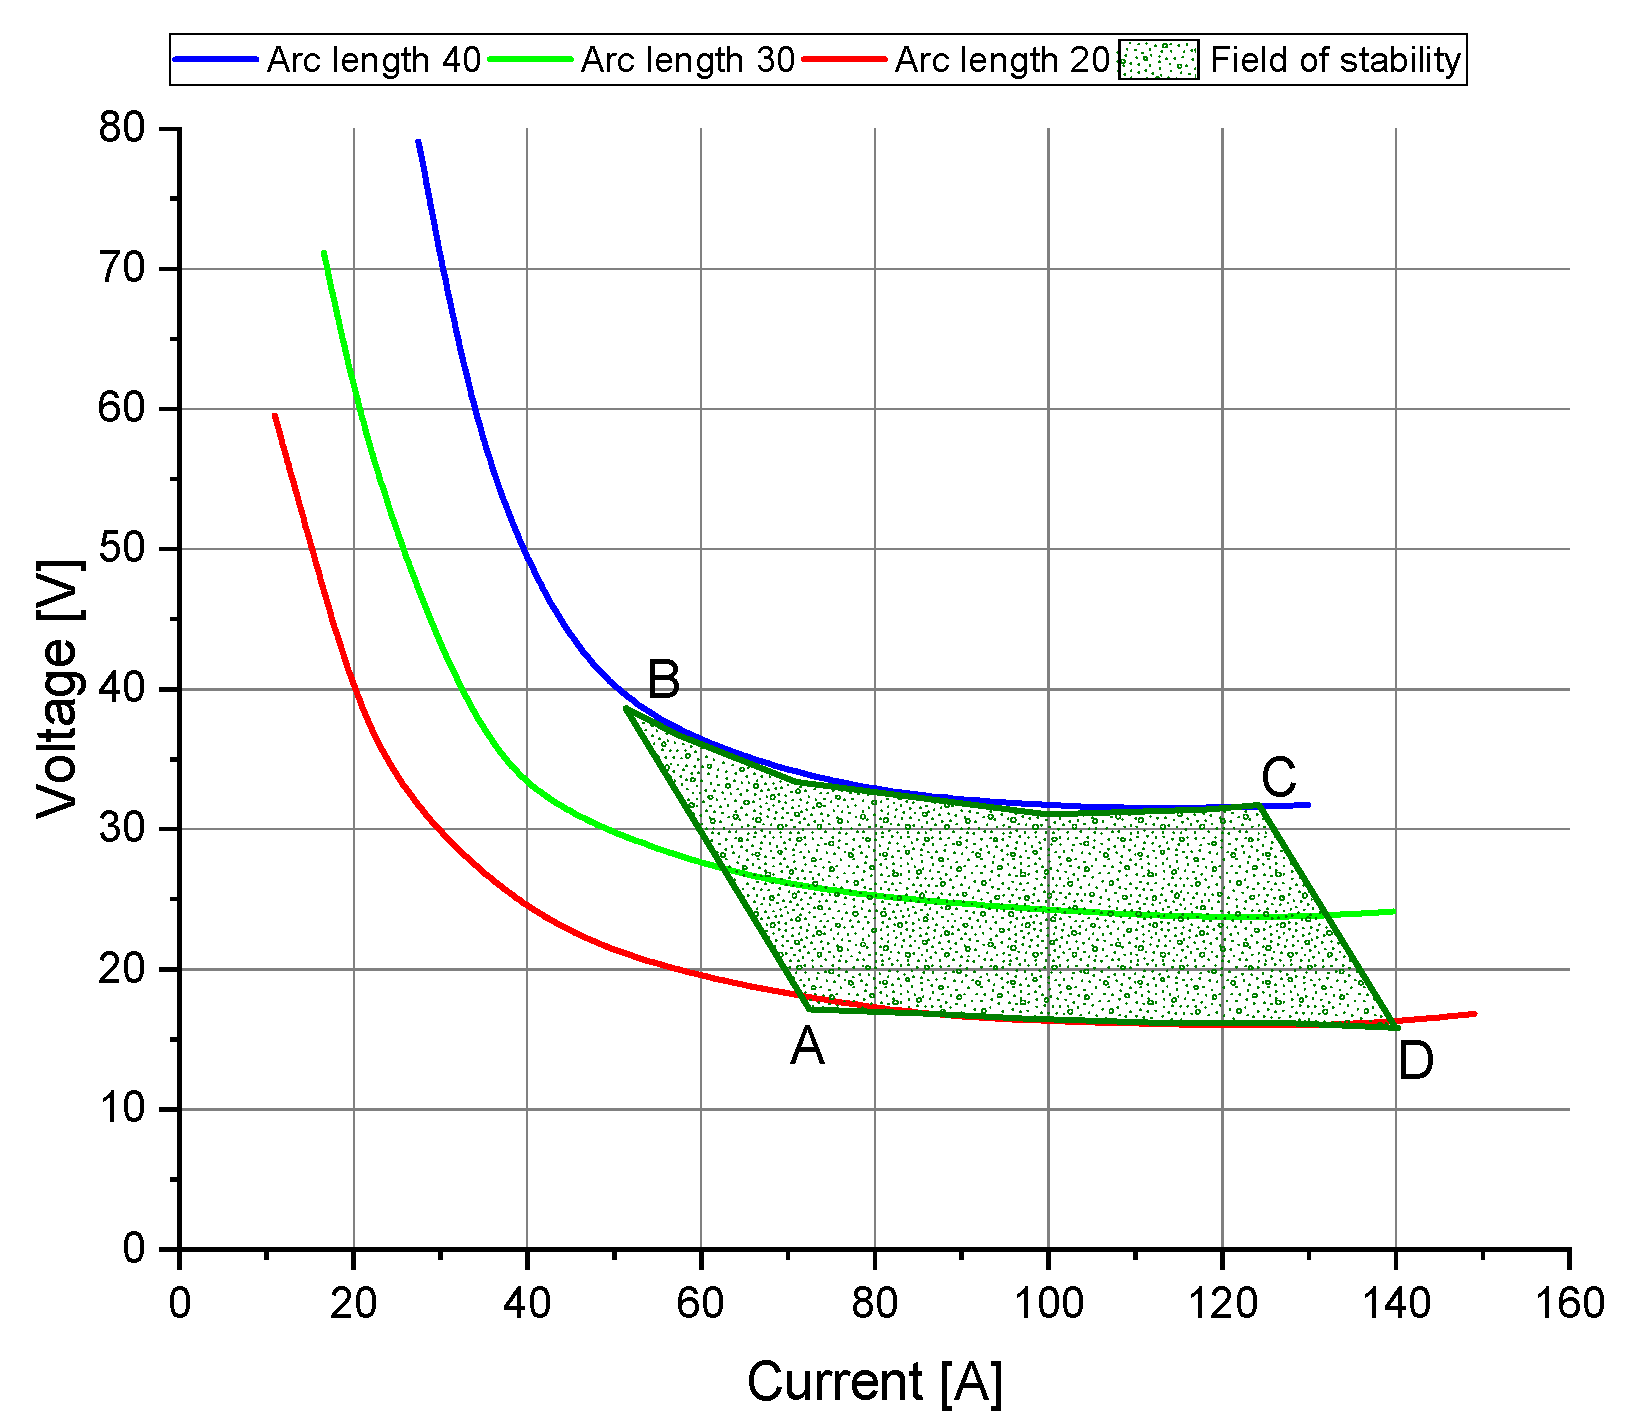
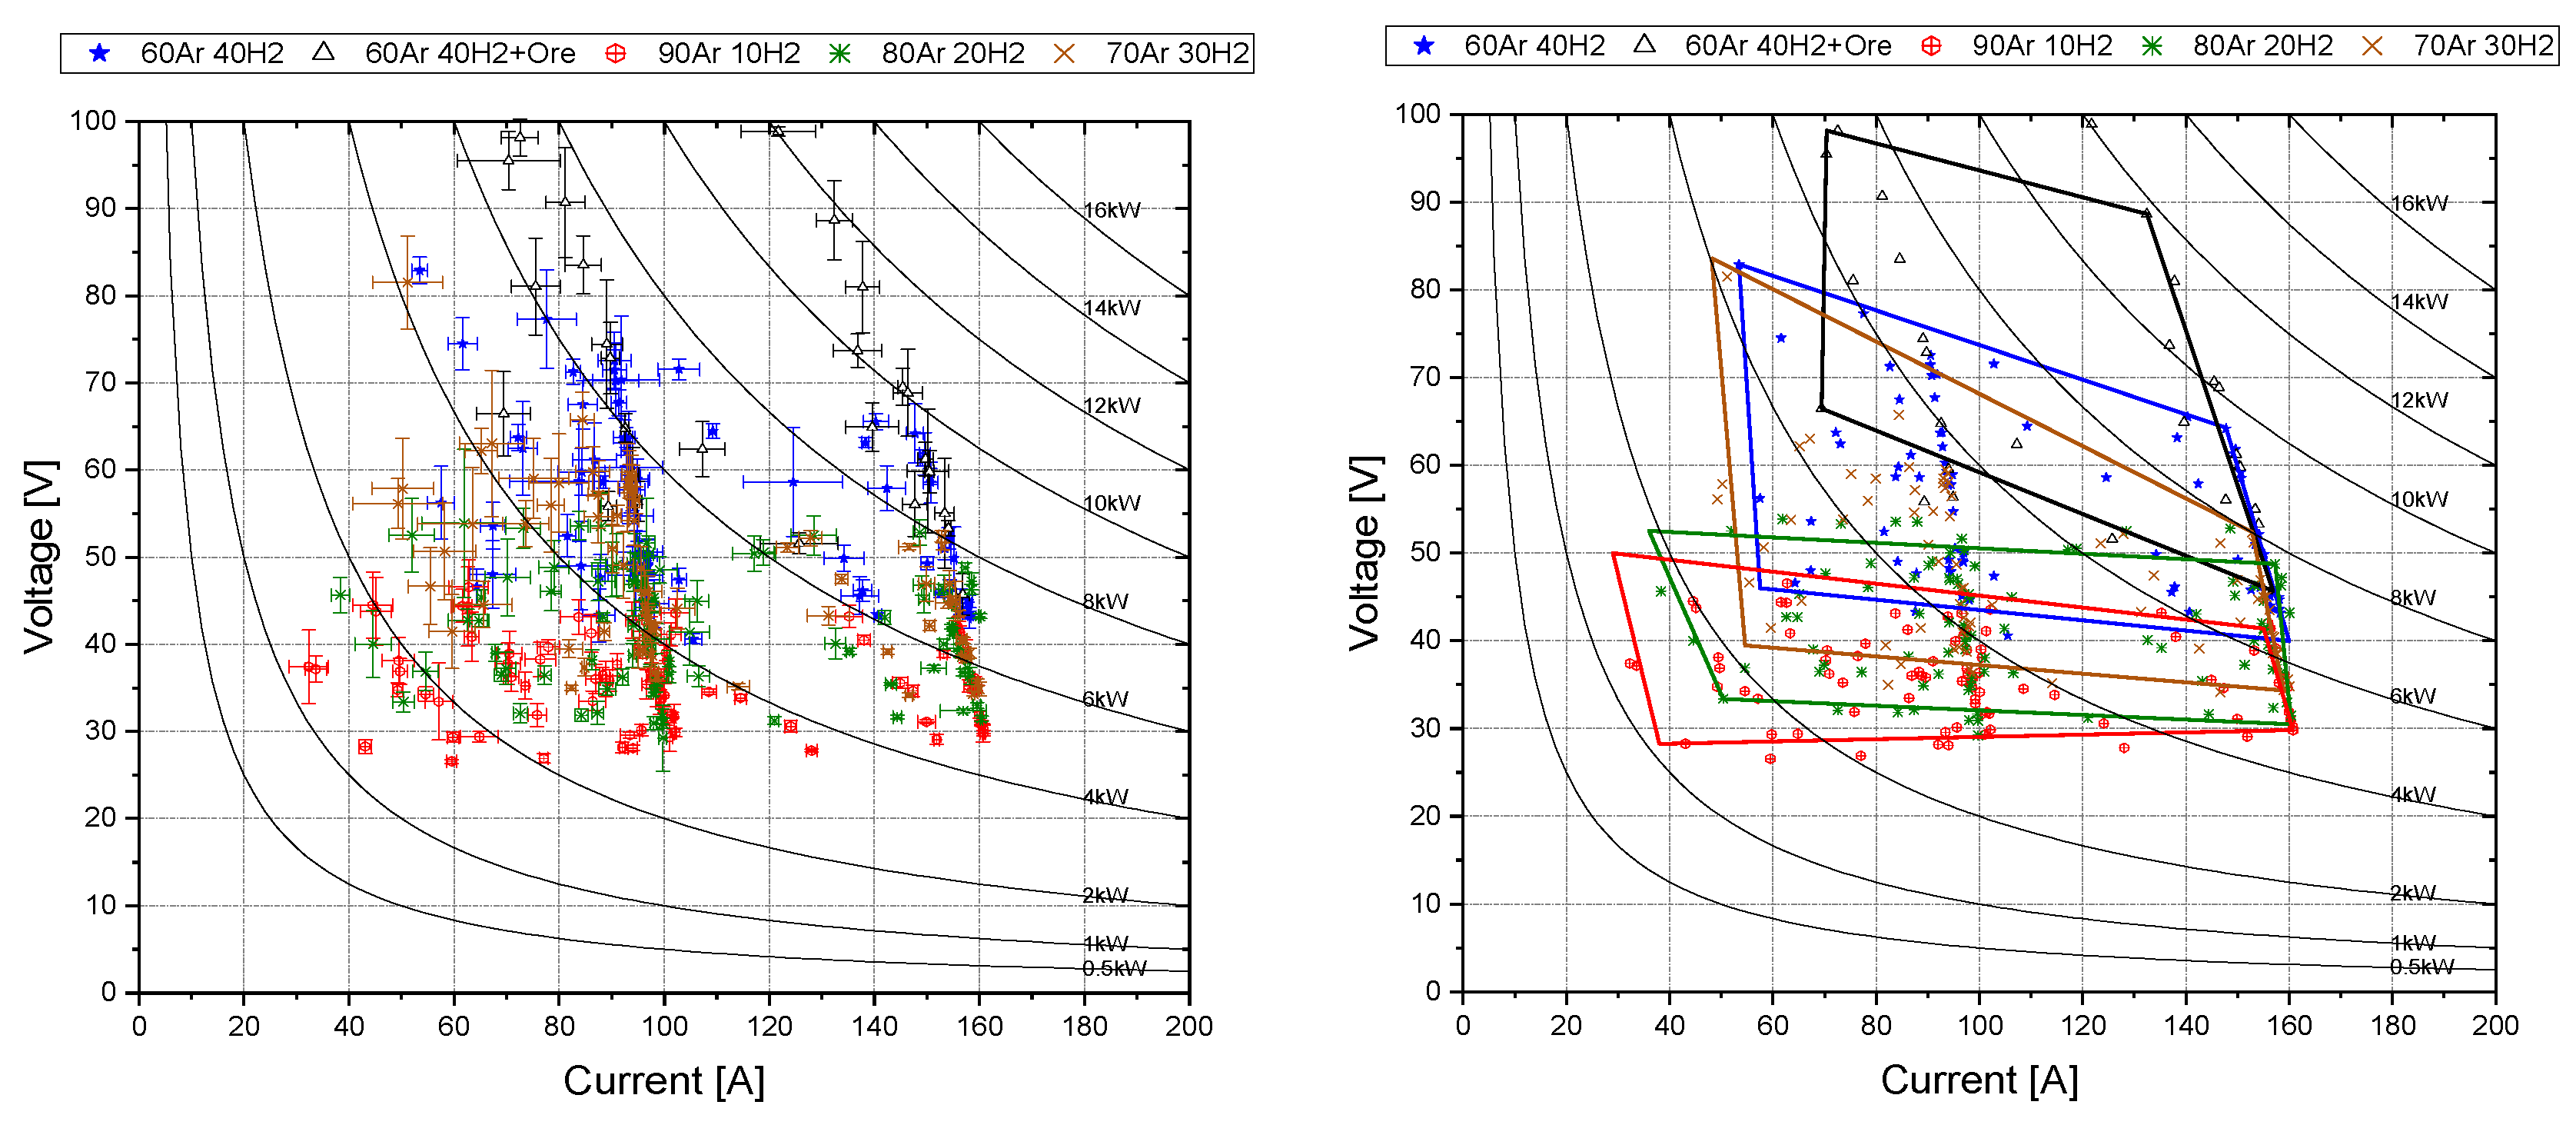
3.4.2. Fields of Stability
4. Results and Discussion
4.1. Arc Stability Maps
4.2. Fields of Stability
5. Conclusions and Outlook
5.1. Conclusions
- •
- The comparison of the different fields shows that the maximum realizable power input is also limited by the gas composition;
- •
- Argon is the most stable gas and acts as a stabilizer in gas mixtures, but with the addition of argon, the maximum transferrable power is also limited;
- •
- With increasing hydrogen, the field shifts towards higher levels of minimum voltage (shift of the frame towards the top right);
- •
- With increasing hydrogen, the fields tend to increase in voltage per mm of arch length (higher y axis spread of the frame);
- •
- Lower levels of amperage are not reachable at higher levels of voltage (shift of the low current border of the frame towards the top right of the diagram);
- •
- Mixtures of gases position themselves in the middle of the surrounding pure gas stability fields;
- •
- If this assumption is true for all mixtures, pure hydrogen would have its baseline at around 150 V–200 V and need a minimum amperage of around 100 A;
- •
- The charging of ore decreases the stability drastically (harsh shift towards the upper right corner of the frame);
- •
- The limits for charging and the amount of hydrogen in argon need to be adjusted to find the perfect ratio for the available hydrogen and the oxygen input through the iron ore;
- •
- The error bars for the results produced increase with increasing instability of the arc;
- •
- The error bars also tend to increase their value the closer the system gets to its maximum power level;
- •
- The increasing amount of hydrogen in the mixture with argon leads to an increase in the supplied power by the factor of 8 in the investigated range of 0–40% hydrogen;
- •
- The voltage drop in the arc zone increases with a raising hydrogen content in the mixture with argon. Therefore, a higher voltage level from the electrical power supply was needed at higher hydrogen content.
5.2. Outlook
Author Contributions
Funding
Acknowledgments
Conflicts of Interest
References
- World Steel Association. Steel’s Contribution to a Low Carbon Future and Climate Resilient Societies. Worldsteel Position Paper. 2020. Available online: https://www.worldsteel.org/en/dam/jcr:7ec64bc1-c51c-439b-84b8-94496686b8c6/Position_paper_climate_2020_vfinal.pdf (accessed on 9 October 2020).
- Le Quéré, C.; Jackson, R.B.; Jones, M.W.; Smith, A.J.P.; Abernethy, S.; Andrew, R.M.; De-Gol, A.J.; Willis, D.R.; Shan, Y.; Canadell, J.G.; et al. Temporary reduction in daily global CO2 emissions during the COVID-19 forced confinement. Nat. Clim. Chang. 2020, 10, 647–653. [Google Scholar] [CrossRef]
- Eurofer European Steel Association. Low Carbon Roadmap: Pathways to a CO2- Neutral European Steel Industry; Final Report; EUROFER: Brussels, Belgium, 2019; pp. 1–18. [Google Scholar]
- Energy Transitions Commission. Reaching Zero Carbon Emissions from Steel. Available online: http://energy-transitions.org/sites/default/files/ETC_Consultation_Paper_-_Steel.pdf (accessed on 15 July 2020).
- Bäck, E.; Schenk, J.; Badr, K.; Sormann, A.; Plaul, J.F. Wasserstoff als Reduktionsmittel für die Eisen- und Rohstahlerzeugung–Ist-Situation, Potentiale und Herausforderungen. BHM Berg- und Hüttenmännische Mon. 2015, 160, 96–102. [Google Scholar]
- Sormann, A. Untersuchung zur Schmelzreduktion von Eisenoxiden mit Wasserstoff als Reduktionsmittel. Ph.D. Thesis, Montanuniversität Leoben, Leoben, Austria, 1992. [Google Scholar]
- Bäck, E. Schmelzreduktion von Eisenoxiden mit Argon-Wasserstoff-Plasma. Ph.D. Thesis, Montanuniversität Leoben, Leoben, Austria, 1998. [Google Scholar]
- Plaul, J.F. Schmelzreduktion von Hämatitischen Feinerzen im Wasserstoff-Argon-Plasma. Ph.D. Thesis, Montanuniversität Leoben, Leoben, Austria, 2005. [Google Scholar]
- Badr, K. Smelting of Iron Oxides Using Hydrogen Based Plasmas. Ph.D Thesis, Montanuniversität Leoben, Leoben, Austria, 2007. [Google Scholar]
- Goldston, R.J.; Rutherford, P.H. Introduction to Plasma Physics, 1st ed.; Institute of Physics Publishing: Bristol, UK, 1995. [Google Scholar]
- Naseri Seftejani, M.; Schenk, J. Reaction kinetics of molten iron oxides reduction using hydrogen. La Met. Ital. 2018, 7/8, 5–14. [Google Scholar]
- Naseri Seftejani, M.; Schenk, J. Thermodynamic Aspects of Hydrogen Plasma Smelting Reduction of Iron Oxides; ICSTI: Vienna, Austria, 2018. [Google Scholar]
- Naseri Seftejani, M.; Schenk, J. Thermodynamic of Liquid Iron Ore Reduction by Hydrogen Thermal Plasma. Metals 2018, 8, 1051. [Google Scholar] [CrossRef]
- Naseri Seftejani, M.; Schenk, J. Transport Properties of HPSR Gases; The Chinese Society for Metals (CSM): Beijing, China, 2018. [Google Scholar]
- Naseri Seftejani, M.; Schenk, J.; Zarl, M. Reduction of Haematite Using Hydrogen Thermal Plasma. Materials 2019, 12, 1608. [Google Scholar] [CrossRef] [PubMed]
- Naseri Seftejani, M.; Schenk, J. Fundamentals of Hydrogen Plasma Smelting Reduction (HPSR) of Iron Oxides, A New Generation of Steelmaking Processes. In Proceedings of the 7th Asia Steel International Conference 2018, Odisha, India, 6–9 February 2018. [Google Scholar]
- Sabat, K.C.; Murphy, A.B. Hydrogen Plasma Processing of Iron Ore. Metall. Mater. Trans. B 2017, 48, 1561–1594. [Google Scholar] [CrossRef]
- Sabat, K.; Rajput, P.; Paramguru, R.; Bhoi, B.; Mishra, B. Reduction of Oxide Minerals by Hydrogen Plasma: An Overview. Plasma Chem. Plasma Process. 2014, 34, 1–23. [Google Scholar] [CrossRef]
- Tanaka, M.; Ushio, M.; Lowke, J.J. Numerical study of gas tungsten arc plasma with anode melting. Vacuum 2004, 73, 381–389. [Google Scholar] [CrossRef]
- Jones, R.; Reynolds, Q.; Curr, T.R.; Sager, D. Some myths about DC arc furnaces. J. S. Afr. Inst. Min. Metall. 2011, 111, 665–674. [Google Scholar]
- Sormann, A.; Schenk, J.; Naseri Seftejani, M.; Spreitzer, D.; Zarl, M. The Way to A Carbon Free Steelmaking. In Proceedings of the 3rd ADMET 2018, Lviv, Ukraine, 10–13 June 2018. [Google Scholar]
- Bäck, E.; Badr, K.; Plaul, J.F.; Sormann, A. Überblick über die Entwicklung der Wasserstoff-Schmelzreduktion am Lehrstuhl für Metallurgie. BHM Berg-und Hüttenmännische Mon. 2009, 154, 6–9. [Google Scholar] [CrossRef]
- Naseri Seftejani, M.; Schenk, J.; Spreitzer, D.; Andreas Zarl, M. Slag Formation during Reduction of Iron Oxide Using Hydrogen Plasma Smelting Reduction. Materials 2020, 13, 935. [Google Scholar] [CrossRef] [PubMed]


| Minimum arc Length at Perfect Conditions (mm) | Maximum Valid Arc Length (mm) | Absolute Error (mm) | Relative Error (%) |
|---|---|---|---|
| 20 | 25.0 | 5.0 | 25.0 |
| 25 | 29.2 | 4.2 | 16.6 |
| 30 | 33.5 | 3.5 | 11.8 |
| 35 | 38.1 | 3.1 | 8.8 |
| 40 | 42.7 | 2.7 | 6.8 |
| 45 | 47.4 | 2.4 | 5.4 |
| Type | Range (Nl/min) | |
|---|---|---|
| H2 | F-201C-FAC-22-E | 0–10 |
| Ar | F-201CV-10K-AAD-33-V | 0–10 |
| N2 | F-201CV-20K-AAD-33-V | 0–20 |
| Gas | Purity | Remarks |
|---|---|---|
| H2 | 5.0 | – |
| Ar | 5.0 | O2, N2, H2O ≤ 5 ppm |
| N2 | 5.0 | O2, H2O ≤ 5 ppm |
| No | Element | (wt.%) |
|---|---|---|
| 1 | Fe2O3 1 | 92.83 |
| 2 | FeO | 1.07 |
| 3 | Total Fe | 65.81 |
| 4 | Silica | 1.694 |
| 5 | Aluminum oxide | 1.01 |
| 6 | Manganese | 0.17 |
| 7 | Phosphorus | 0.057 |
| 8 | Total sulfur | 0.014 |
| 9 | LOI 2 | 2.79 |
| Mesh Size (μm) | Fraction (wt.%) | Cum (wt.%) |
|---|---|---|
| 63–125 | 50 | 50 |
| 25–63 | 50 | 100 |
| Element | Unit | C | Si | Mn | P | S | Cr | Mo | Ni | Al | Cu |
|---|---|---|---|---|---|---|---|---|---|---|---|
| Steel crucible | (wt.%) | 0.178 | 0.261 | 1.325 | 0.009 | 0.005 | 0.083 | 0.031 | 0.168 | 0.027 | 0.179 |
| Ignition pin | (wt.%) | 0.441 | 0.217 | 0.85 | 0.008 | 0.028 | 0.985 | 0.162 | 0.085 | 0.021 | 0.116 |
| SET 1 100% Ar PL 1 | SCR Level of Potentiometer [%] | |||||||||
| 100 | 95 | 90 | 85 | 80 | 75 | 70 | 65 | 60 | ||
| Larc [mm] | 20 | |||||||||
| 25 | ||||||||||
| 30 | ||||||||||
| 35 | ||||||||||
| 40 | ||||||||||
| 45 | ||||||||||
| SET 1 100% Ar PL 1 | SCR Level of Potentiometer (%) | SET 7 100% Ar PL 2 | SCR Level of Potentiometer (%) | |||||||||||||||||||
| 100 | 95 | 90 | 85 | 80 | 75 | 70 | 65 | 60 | 100 | 95 | 90 | 85 | 80 | 75 | 70 | 65 | 60 | |||||
| Larc (mm) | 20 | Larc (mm) | 20 | |||||||||||||||||||
| 25 | 25 | |||||||||||||||||||||
| 30 | 30 | |||||||||||||||||||||
| 35 | 35 | |||||||||||||||||||||
| 40 | 40 | |||||||||||||||||||||
| 45 | 45 | |||||||||||||||||||||
| SET 2 90%/10% Ar/ H2 PL 1 | SCR Level of Potentiometer (%) | SET 8 90%/10% Ar/ H2 PL 2 | SCR Level of Potentiometer (%) | |||||||||||||||||||
| 100 | 95 | 90 | 85 | 80 | 75 | 70 | 65 | 60 | 100 | 95 | 90 | 85 | 80 | 75 | 70 | 65 | 60 | |||||
| Larc (mm) | 20 | Larc (mm) | 20 | |||||||||||||||||||
| 25 | 25 | |||||||||||||||||||||
| 30 | 30 | |||||||||||||||||||||
| 35 | 35 | |||||||||||||||||||||
| 40 | 40 | |||||||||||||||||||||
| 45 | 45 | |||||||||||||||||||||
| SET 5 60%/40% Ar/ H2 PL 1 | SCR Level of Potentiometer (%) | SET 11 60%/40% Ar/ H2 PL 2 | SCR Level of Potentiometer (%) | |||||||||||||||||||
| 100 | 95 | 90 | 85 | 80 | 75 | 70 | 65 | 60 | 100 | 95 | 90 | 85 | 80 | 75 | 70 | 65 | 60 | |||||
| Larc (mm) | 20 | Larc (mm) | 20 | |||||||||||||||||||
| 25 | 25 | |||||||||||||||||||||
| 30 | 30 | |||||||||||||||||||||
| 35 | 35 | |||||||||||||||||||||
| 40 | 40 | |||||||||||||||||||||
| 45 | 45 | |||||||||||||||||||||
| SET 6 60%/40% Ar/ H2 PL 1 +Ore | SCR Level of Potentiometer (%) | SET 12 60%/40% Ar/ H2 PL 2 +Ore | SCR Level of Potentiometer (%) | |||||||||||||||||||
| 100 | 95 | 90 | 85 | 80 | 75 | 70 | 65 | 60 | 100 | 95 | 90 | 85 | 80 | 75 | 70 | 65 | 60 | |||||
| Larc (mm) | 20 | Larc (mm) | 20 | |||||||||||||||||||
| 25 | 25 | |||||||||||||||||||||
| 30 | 30 | |||||||||||||||||||||
| 35 | 35 | |||||||||||||||||||||
| 40 | 40 | |||||||||||||||||||||
| 45 | 45 | |||||||||||||||||||||

| 100% Ar | 90% Ar 10% H2 | 80 %Ar 20% H2 | 70% Ar 30% H2 | 60% Ar 40% H2 | |
|---|---|---|---|---|---|
| ΔU (V/cm) | 1.0–6.0 | 2.1–5.2 | 4.2–8.6 | 4.5–10.5 | 6.2–10.3 |
Publisher’s Note: MDPI stays neutral with regard to jurisdictional claims in published maps and institutional affiliations. |
© 2020 by the authors. Licensee MDPI, Basel, Switzerland. This article is an open access article distributed under the terms and conditions of the Creative Commons Attribution (CC BY) license (http://creativecommons.org/licenses/by/4.0/).
Share and Cite
Zarl, M.A.; Farkas, M.A.; Schenk, J. A Study on the Stability Fields of Arc Plasma in the HPSR Process. Metals 2020, 10, 1394. https://doi.org/10.3390/met10101394
Zarl MA, Farkas MA, Schenk J. A Study on the Stability Fields of Arc Plasma in the HPSR Process. Metals. 2020; 10(10):1394. https://doi.org/10.3390/met10101394
Chicago/Turabian StyleZarl, Michael Andreas, Manuel Andreas Farkas, and Johannes Schenk. 2020. "A Study on the Stability Fields of Arc Plasma in the HPSR Process" Metals 10, no. 10: 1394. https://doi.org/10.3390/met10101394
APA StyleZarl, M. A., Farkas, M. A., & Schenk, J. (2020). A Study on the Stability Fields of Arc Plasma in the HPSR Process. Metals, 10(10), 1394. https://doi.org/10.3390/met10101394