Article

Effect of Processing Conditions on the Microstructure, Mechanical Properties, and Corrosion Behavior of Two Austenitic Stainless Steels for Bioimplant Applications

by
Mariana-Beatriz R. Silva
1,
Virgine Roche
2,
Telma M. Blanco
2,
Nguyen Hoang Viet
3,
Oscar Balancin
1,
José-María Cabrera
4,5,* and
Alberto Moreira Jorge, Jr.
1,2,*
1
Department of Materials Engineering, Universidade Federal de São Carlos UFSCar, Via Washington Luis, Km 235, São Carlos 13565-905, São Paulo, Brazil
2
University Grenoble Alpes, University Savoie Mont Blanc, CNRS, Grenoble INP, LEPMI, 38000 Grenoble, France
3
School of Materials Science and Engineering, Hanoi University of Science and Technology, Hanoi 100000, Vietnam
4
Department of Materials Science and Engineering, Universitat Politècnica de Catalunya UPC, Eduard Maristany 10-14, 08019 Barcelona, Spain
5
Institute of Research in Metallurgy and Materials, Universidad Michoacana de San Nicolás de Hidalgo UMSNH, Av. Francisco Múgica s/n, CU, Morelia 58230, Michoacán, Mexico
*
Authors to whom correspondence should be addressed.
Metals 2020, 10(10), 1311; https://doi.org/10.3390/met10101311
Submission received: 19 August 2020 / Revised: 26 September 2020 / Accepted: 28 September 2020 / Published: 30 September 2020
(This article belongs to the Special Issue Advances in Stainless Steel)

Abstract

:
Hot torsion tests were carried out to simulate the industrial thermomechanical processing of two austenitic steels for bioimplant applications, namely ISO 5832-9 and ASTM F138. The former has Ti, Nb, and V in the composition, being N-rich. However, the latter is Ni-richer and without extra alloying element additions. Special attention was paid to the effect of interpass times, particularly to the soaking temperature, which was reduced to decrease processing times and costs. Optical and electron microscopy, corrosion tests, and hardness measurements were used to characterize the effect of the above processing parameters on both alloys. No significant increase in processing loads was noticed after the reduction of the reheating temperature. This was explained in terms of the balance between partial particles dissolution and the increment in the solute drag effect provided by the elements put into solution. Such an increment in solid solution favored the dynamic recovery process, delaying the dynamic recrystallization one. However, strain-induced precipitation took place at lower temperatures, by using the extra N and Cr delivered to the matrix, and limiting the recrystallization softening. The rolling schedule promoted abundant grain refinement. The final grain size ranged from 2.5 to 11 µm, depending on reheating temperature, interpass time, presence of alloying elements, and N. In general terms, the corrosion resistance of the ISO steel soaked at the lowest temperature (1200 °C) was better than when reheated to the highest one (1250 °C). On the contrary, the F138 steel had worse corrosion behavior.

1. Introduction

Microstructure evolution during thermomechanical processing (TMP) of steels is a complex phenomenon depending on several factors, such as chemical composition, temperature, strain, strain rates, interpass times, and cooling rates [1]. Events that occur during thermomechanical processing such as recrystallization, precipitation, solid solution, and dislocation substructure contribute to the final properties. Controlled TMP promotes grain refinement, which is a well-known fact that can provide up to 70% to the yield strength (in microalloyed steels, for example). Furthermore, this mechanism is the only one that increases both strength and toughness [2,3,4,5,6,7]. The scientific fundamentals required for microstructural control during hot processing of low carbon steels with Nb additions, which displays phase transformation (γ→α) during cooling, are better established than in austenitic stainless steel in which this transformation is absent [8,9]. Thus, more care must be taken with austenitic stainless steels to avoid a partially recrystallized microstructure with no uniform grains, which may be detrimental for mechanical properties and corrosion resistance [10,11,12].
So far, the most widely used metallic materials in orthopedic implants are austenitic stainless steels, especially ASTM F138 and ISO 5832-9 [13]. Their chemical composition is listed in Table 1. The first steel presents relatively low strength and susceptibility to localized corrosion in the annealed condition. For this reason, the ISO 5832-9 is used as an alternative to F138 [14]. The main difference between them is the larger content of Nb and N in the ISO steel. Corrosion studies [15] have indicated that the ISO 5832-9 steel is more resistant than the F138. The critical pitting potential of the ISO 5832-9 steel has not been observed up to its transpassive potential, and scratch tests have validated the advantage of this steel over the F-138 one. It has been concluded that such corrosion superiority is associated with the enhanced stability of the passive film and the high tendency to repassivation promoted by the existence of N in interstitial solid solution.
On the one hand, TiNbN, Z-phase (CrNbN), and NbN particles can precipitate during high-temperature processing of the ISO 5832-9 steel [16,17]. Such precipitation, in turn, can favor the grain refinement [16,17,18] and higher strength than in the F-138 steel. However, Nb-based coarse primary particles may serve as potential sites for fatigue crack initiation [14]. Besides consuming a considerable Cr amount from the matrix and causing sensitization, these large particles require N (taken from the solid solution). Moreover, Cr is the main element in increasing the localized corrosion resistance of this steel.
On the other hand, the ISO 5832-9 steel has revealed additional difficulties in microstructural control. A microstructural evolution study [10] indicated that, even after large deformations like those reached during the steady-state stresses, a substructure (characterized by large strained grains) is coupled with recrystallized grains. In other words, there is an enormous delay in the dynamic recrystallization phenomena, a consequence of the intermediate level of stacking fault energy (SFE) of this steel due to the presence of high amounts of elements in solid solution [10]. A calculation by the JMatPro software indicates that the SFE in the ISO steel is 85 mJ m−2, while in the F1389 steel is 50 mJ m−2. This fact promotes a heterogeneous microstructure formed by large recrystallized grains surrounded by a necklace of small grains, even after considerable deformation.
In the manufacture of orthopedic implants, microstructural control during forging at high temperatures is essential to ensure the strict requirements of mechanical and physicochemical properties. The choice of the temperature, the quality, and efficiency of the reheating process for steels with microalloying elements is crucial. The reheating temperature determines the initial grain size, the uniformity of the grains, and the contents of microalloying elements in solid solution at the beginning of the hot deformation schedule. This is particularly important because microstructures constituted by extremely coarse or nonuniform grains produced during the reheating stage are difficult to refine by subsequent thermomechanical processing [19]. Therefore, the type and volume of microalloying elements precipitated or in solid solution during processing are decisive factors determining the microstructure [20]. These factors determine the conditions under which the suppression or delay of recrystallization due to precipitation occurs. Thus, optimizing the solubilization of microalloying elements ensures more reliability in thermomechanical processing leading to the manufacture of products with less dispersion in their mechanical properties, being a vital point in today’s competitive market [21].
If one considers the final product, economic factors are also essential, and therefore reheating conditions must be optimized. It has been demonstrated by industrial experimentation [22] that a decrease of 20 to 35 °C in the operational temperatures of furnaces can diminish the specific energy consumption by about 15 to 30 kWh ton−1. Moreover, by reducing temperatures, it is expected that pollutants’ emissions decrease and, as processing times are reduced, likewise, an improvement in production efficiency occurs [22].
However, the reheating temperature and pass schedule in the manufacturing of austenitic stainless steels have received little attention in evaluating product quality and performance of mechanical properties. As stated above, by reducing the temperature, undissolved nitride-based coarse primary particles may serve as nucleation sites for fatigue crack initiation [15] and may also induce sensitization. Furthermore, processing loads could increase when reducing reheating temperatures. Such load increasing could lead to existing equipment and tools to be useless, thus needing a substitution, or periodical maintenance, increasing the prices of final products.
In a previous work [16], it was shown that not all the coarse particles are dissolved, even at the highest industrial solubilization temperatures. However, during the rolling schedule, they are broken and mechanically partially dissolved by thermomechanical processing, serving as matrix reinforcement, accelerating the dynamic recrystallization kinetics in some conditions, without increasing the load too much, thus indicating the possibility of reducing the reheating temperature.
In the present study, the influence of interpass time and the soaking temperature in the two above austenitic stainless steels were analyzed. The reheating temperature was reduced to 1200 °C, typical for the F138 steel, instead of 1250 °C that is the usual one for the ISO 5832-9 steel, which was also studied for comparison purposes.

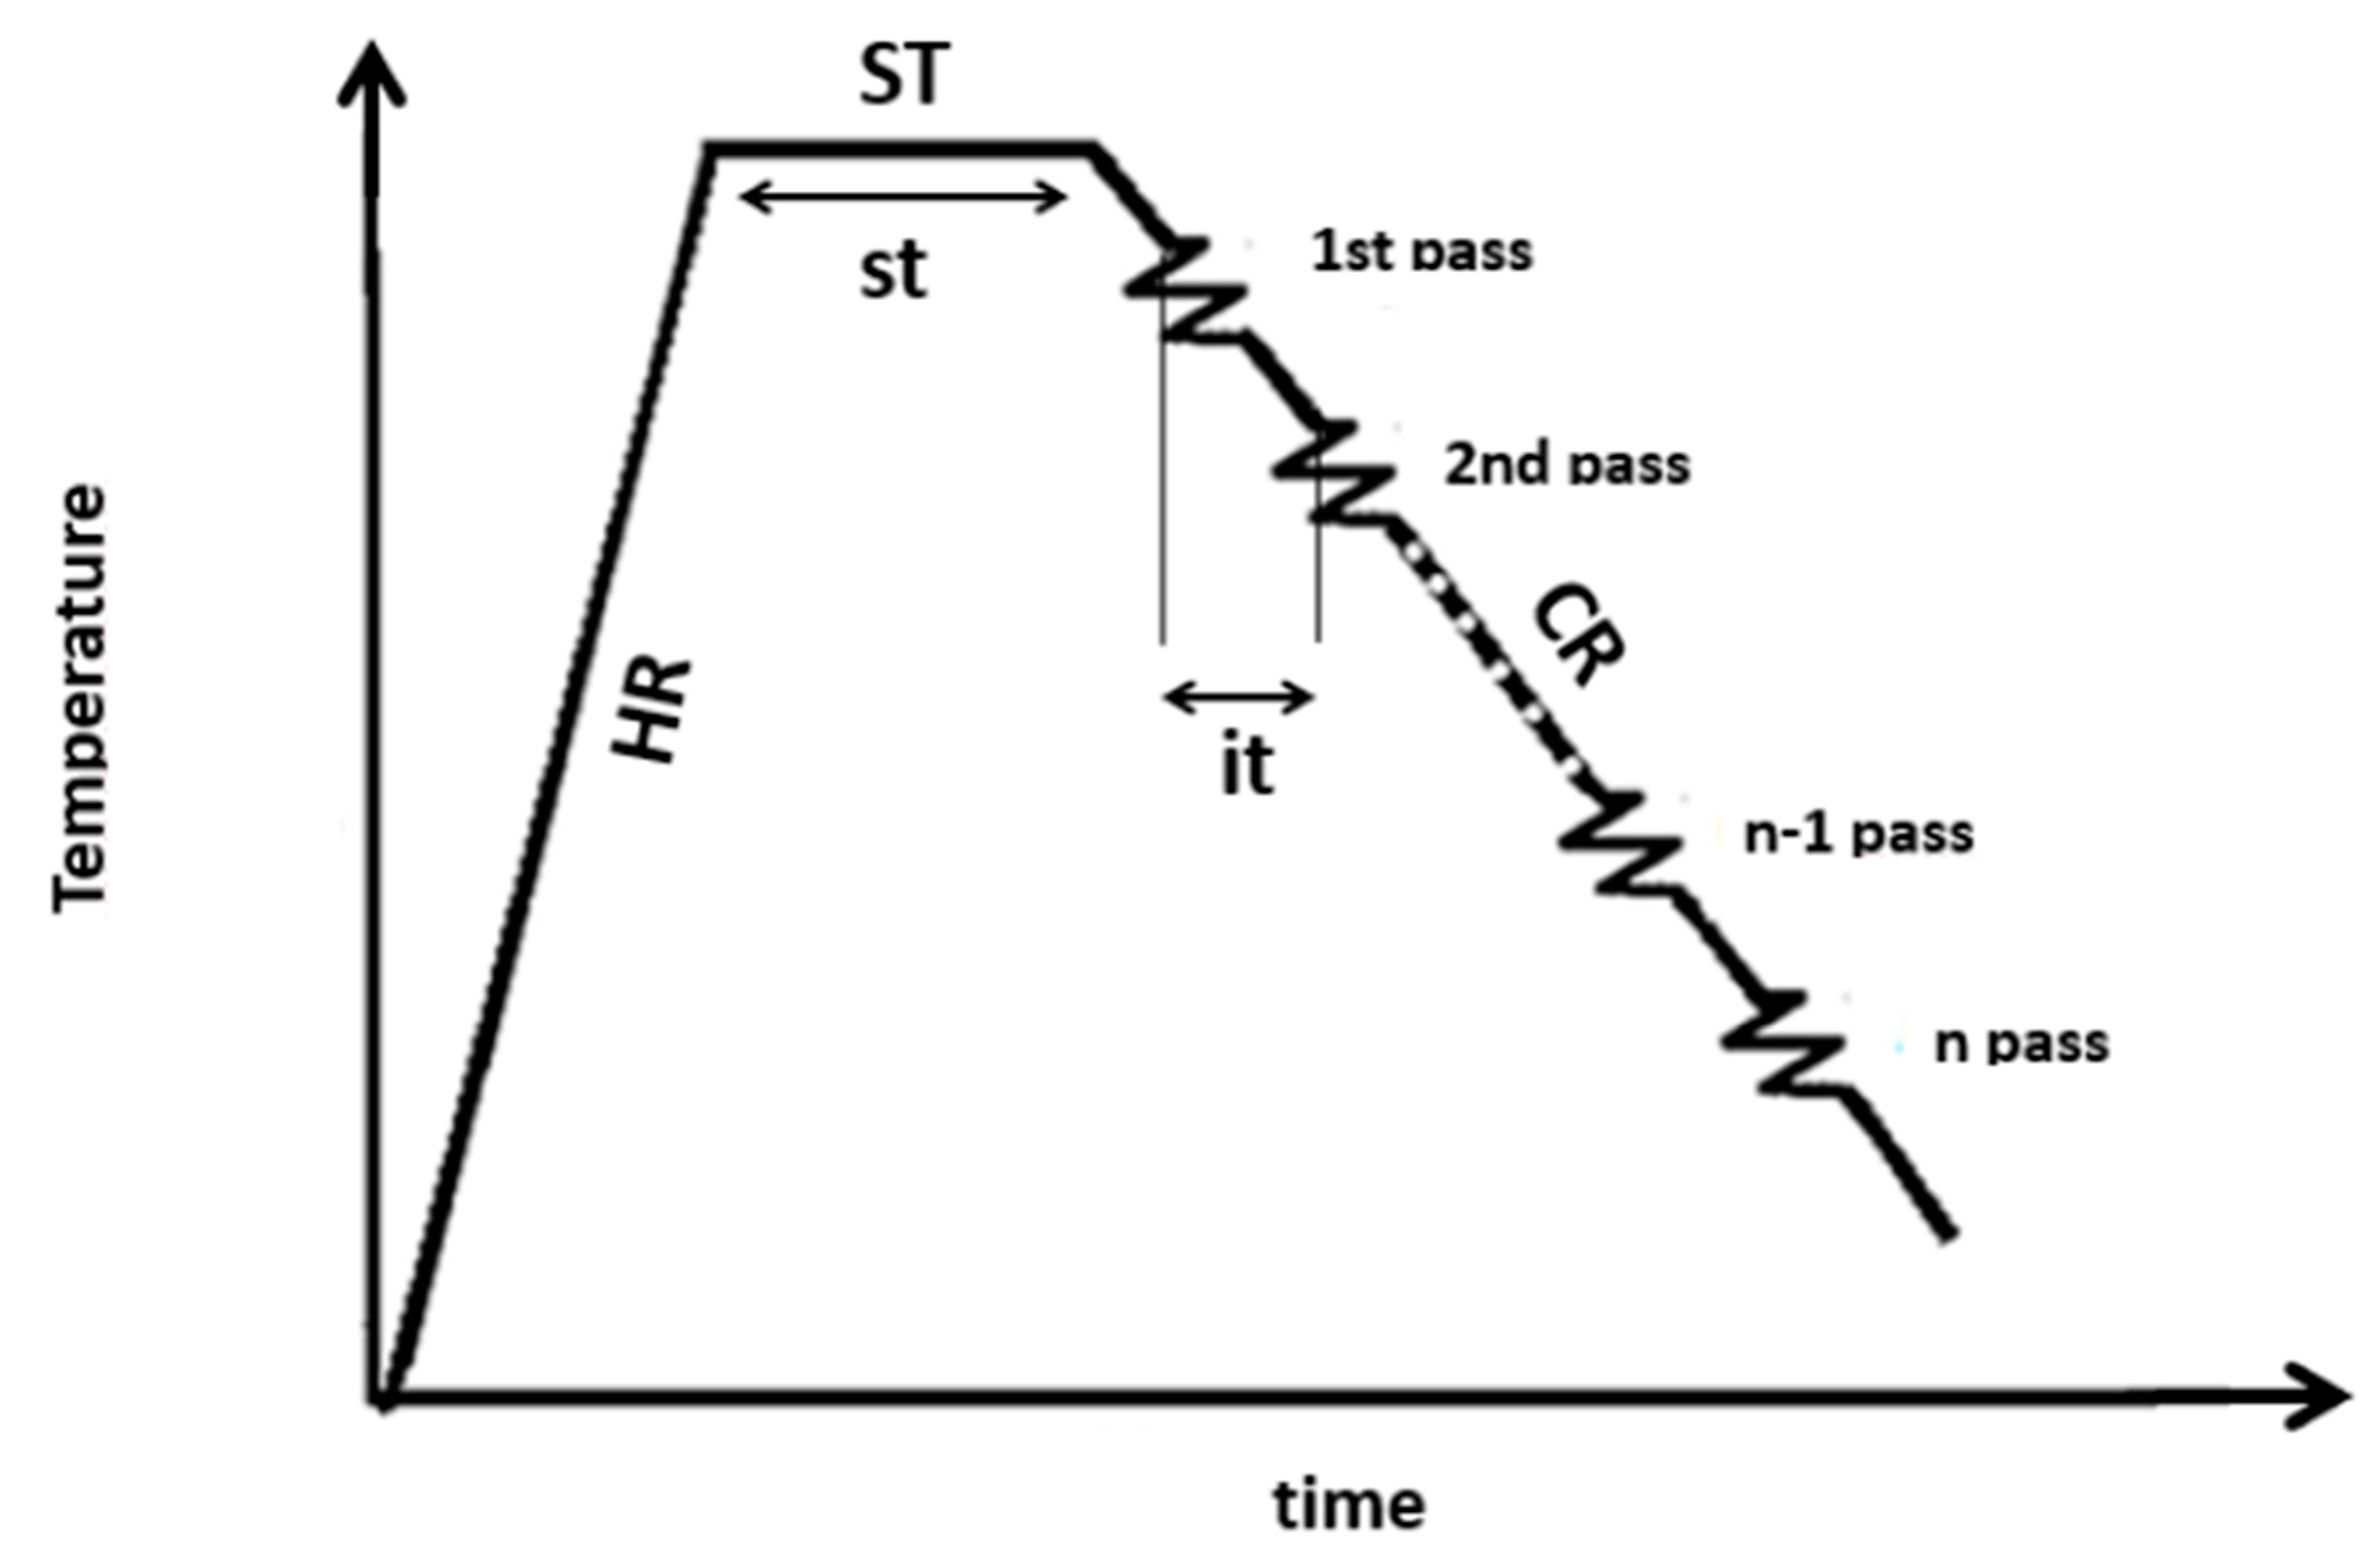
2. Materials and Methods

As already stated, the steels used in this investigation were the austenitic stainless steels ISO 5832-9 and ASTM F138 (ISO 5832-1), supplied by Villares Metals, São Paulo, Brazil. Their chemical compositions are displayed in Table 1. To simplify, henceforth, the ASTM F138 steel will be named as F138 and the ISO 5832-9 steel as ISO.
Torsion specimens with 5 mm of effective radius and 10 mm in length in the reduced central gage section were machined out from bars with a 20 mm diameter. Mechanical tests were performed on a digital hot torsion machine (home made, DEMa-UFSCar, São Carlos, Brazil). The samples were heated in an infrared furnace (home made, DEMa-UFSCar, São Carlos, Brazil) directly coupled to the machine. The temperature was measured using a chromel-alumel thermocouple. Data were processed using software that controls temperature, holding time, strain, strain rate, and interpass times. Water was injected into a quartz tube surrounding the sample immediately after attaining the imposed strain or at a given time after straining to retain microstructures after testing.
Hot torsion tests with multipass schedules under continuous cooling conditions simulating industrial processing were carried out. Specimens were soaked for 300 s at 1200 °C (usual for the F138 steel) or 1250 °C (typical for the ISO alloy) at a heating rate of 2.0 °C s−1. Then, they were subjected to successive deformations with a true strain (ε) of 0.3, using a constant strain rate of 1.0 s−1 and interpass times of 50, 20, or 5 s. The sketch of this thermomechanical process is illustrated in Figure 1. For the sake of maintaining the same temperature at each pass, regardless of the interpass time, different cooling rates were established: 24, 60, and 240 °C min−1, respectively. The experiments were interrupted after the second, sixth, and thirteenth passes, after which samples were water quenched [16].
The microstructure was characterized by optical microscopy (OM, Carl Zeiss ZEISS AXIO Imager.A1m, Carl Zeiss GmbH, Goettingen, Germany), scanning electron microscopy (SEM, FEI INSPECT S50, FEI Company, Černovice, Czech Republic) coupled to an electron backscatter diffraction (EBSD) system, (EDAX-AMETEK TM, EDAX, Tilburg, The Netherlands), and transmission electron microscopy (TEM, FEI Tecnai G2-F20 (200 kV), FEI Company, Černovice, Czech Republic), equipped with an EDS detector (EDAX, EDAX, Tilburg, The Netherlands). As the strain, strain rate, and microstructures vary along the radius of the gage section, as usual in torsion tests, metallographic observations were carried out in an axial–diametral cross-section of the sample surface. Microstructures were revealed by electrochemical etching using nitric acid (65%) under a current density of 0.5 A cm−2 during 20 to 60 s depending on the microstructure. Quantitative metallography was conducted using the image analyzer software AnalysisFive, by which the Feret diameter (the diameter of the circle having the same area of the object) was measured, counting at least 400 grains.
For TEM observations, samples were collected from the torsion specimen surface in a perpendicular plane to the transverse direction. From such a procedure, semicylindrical shapes were obtained, from which thin foils were produced by thinning them down to 100 µm by conventional grinding to get parallel surfaces using a #1000 SiC sandpaper. Then disks of 3 mm were punched and continued being thinned down to ~50 µm, using a #2000 SiC sandpaper. After, thin foils were prepared by thinning the disks by electrolytic polishing in a TENUPOL IV, using a solution of acetic acid (95%) and perchloric acid (5%), at room temperature (~25 °C) and applying a voltage of 20 V with a current limit of 5 A.
An accelerating voltage of 20 kV was used in the SEM to perform EBSD scans, and, for the sake of having detailed high-resolution images, a step size of 0.03 μm was employed. EBSD results were analyzed using the TSL OIM 7.3 software, from which maps of image quality, orientation, and distribution of boundaries were constructed. Misorientations lower than 0.5° were ignored during postprocessing of data. Boundaries having misorientations larger than 15° were defined as grain boundaries, while misorientation angles falling between 2° and 15° were considered subgrain boundaries. Specimens for EBSD analysis were electropolished in a solution of 5% of perchloric acid in acetic acid at room temperature (~25 °C), applying 35 V DC for ~20 s.
The steel microhardness (ASTM E-384-17) was determined using an automated microhardness tester (Shimadzu HMV-G.205T, Shimadzu Corporation, Kyoto, Japan), equipped with a Vickers indenter using a load of 500 g. Fifteen measurements per sample were taken, which were averaged, and the standard deviation was obtained. Additional microhardness tests were performed on larger particles + matrix, grain boundaries, and smaller particles + matrix immediately after deformation to verify the influence of such particles on the associated stress field. These microhardness tests were performed in a Future-Tech FM-800 hardness tester (Future-Tech Corporation, Kanagawa, Japan) equipment with a Vickers indenter applying a load of 25 g.
Electrochemical measurements were conducted using a potentiostat (Gamry Instruments, Reference 600, Gamry Instruments, Warminster, PA, USA). Before embedding in polyester resin, samples were treated for surface passivation in an aqueous solution of 20% of nitric acid at 35 °C for 60 min., thus preventing crevice corrosion at the metal/resin interface. The exposed transversal area of about 1 cm2 was polished down to 1 μm with diamond paste. For the sake of reproducing the body environment, the electrolyte was the simulated body fluid (SBF) [23] (pH 7.4) at 36.5 °C under a dark ambient condition. The experiments were performed in a typical three-electrode cell. Studied samples were the working electrode, a platinum plate as the counter electrode, and a saturated calomel electrode as the reference one. In all the experiments, counter and working electrodes were held almost at the same distance (~3 cm). The reference electrode was placed near the working surface. Before potentiodynamic polarization, the open circuit potential (OCP) was registered throughout 1 h of immersion within the electrolyte, after which potentiodynamic polarization curves were recorded across the range of −0.03 to 1.5 V versus the OCP, using a scan rate of 0.5 mV s−1. Electrochemical impedance spectroscopy (EIS) measurements (Gamry Instruments, Warminster, PA, USA) were also conducted in the same electrochemical cell and equipment. EIS tests were at open-circuit potential conditions in the frequency range from 100 kHz to 100 mHz with a sinusoidal perturbation signal of 10 mVrms.

3. Results

3.1. Flow Stress Curves

Figure 2a,c shows the flow stress curves of the F138 and ISO steels, respectively, both reheated to 1200 °C and strained with interpass times of 50, 20, and 5 s. Figure 2e displays a comparison between flow stress curves with an interpass time of 5 s, for samples reheated to 1200 °C (F138 and ISO) and 1250 °C (ISO).
In general terms, it is observed that the stress level increases with the progress of the deformation schedule. Furthermore, comparing Figure 2a,c,e, one may find that the ISO steel exhibits a different behavior than the F138 steel. Such a difference is more emphasized when the ISO steel is reheated to 1250 °C.
The dependence of the flow stress with the temperature can be visualized using diagrams of the mean flow stress (MFS) as a function of the inverse of the absolute temperature [24], as presented in Figure 2b,d,e. There is an evident linear growth of MFS in the whole range of temperatures for the F138 steel. The same trend is observed in the ISO steel when reheated either to 1250 °C (after the second pass) or 1200 °C (at the first pass). However, two changes in slope are observed in the ISO steel under both reheating conditions. This will be later discussed in terms of precipitation interaction.

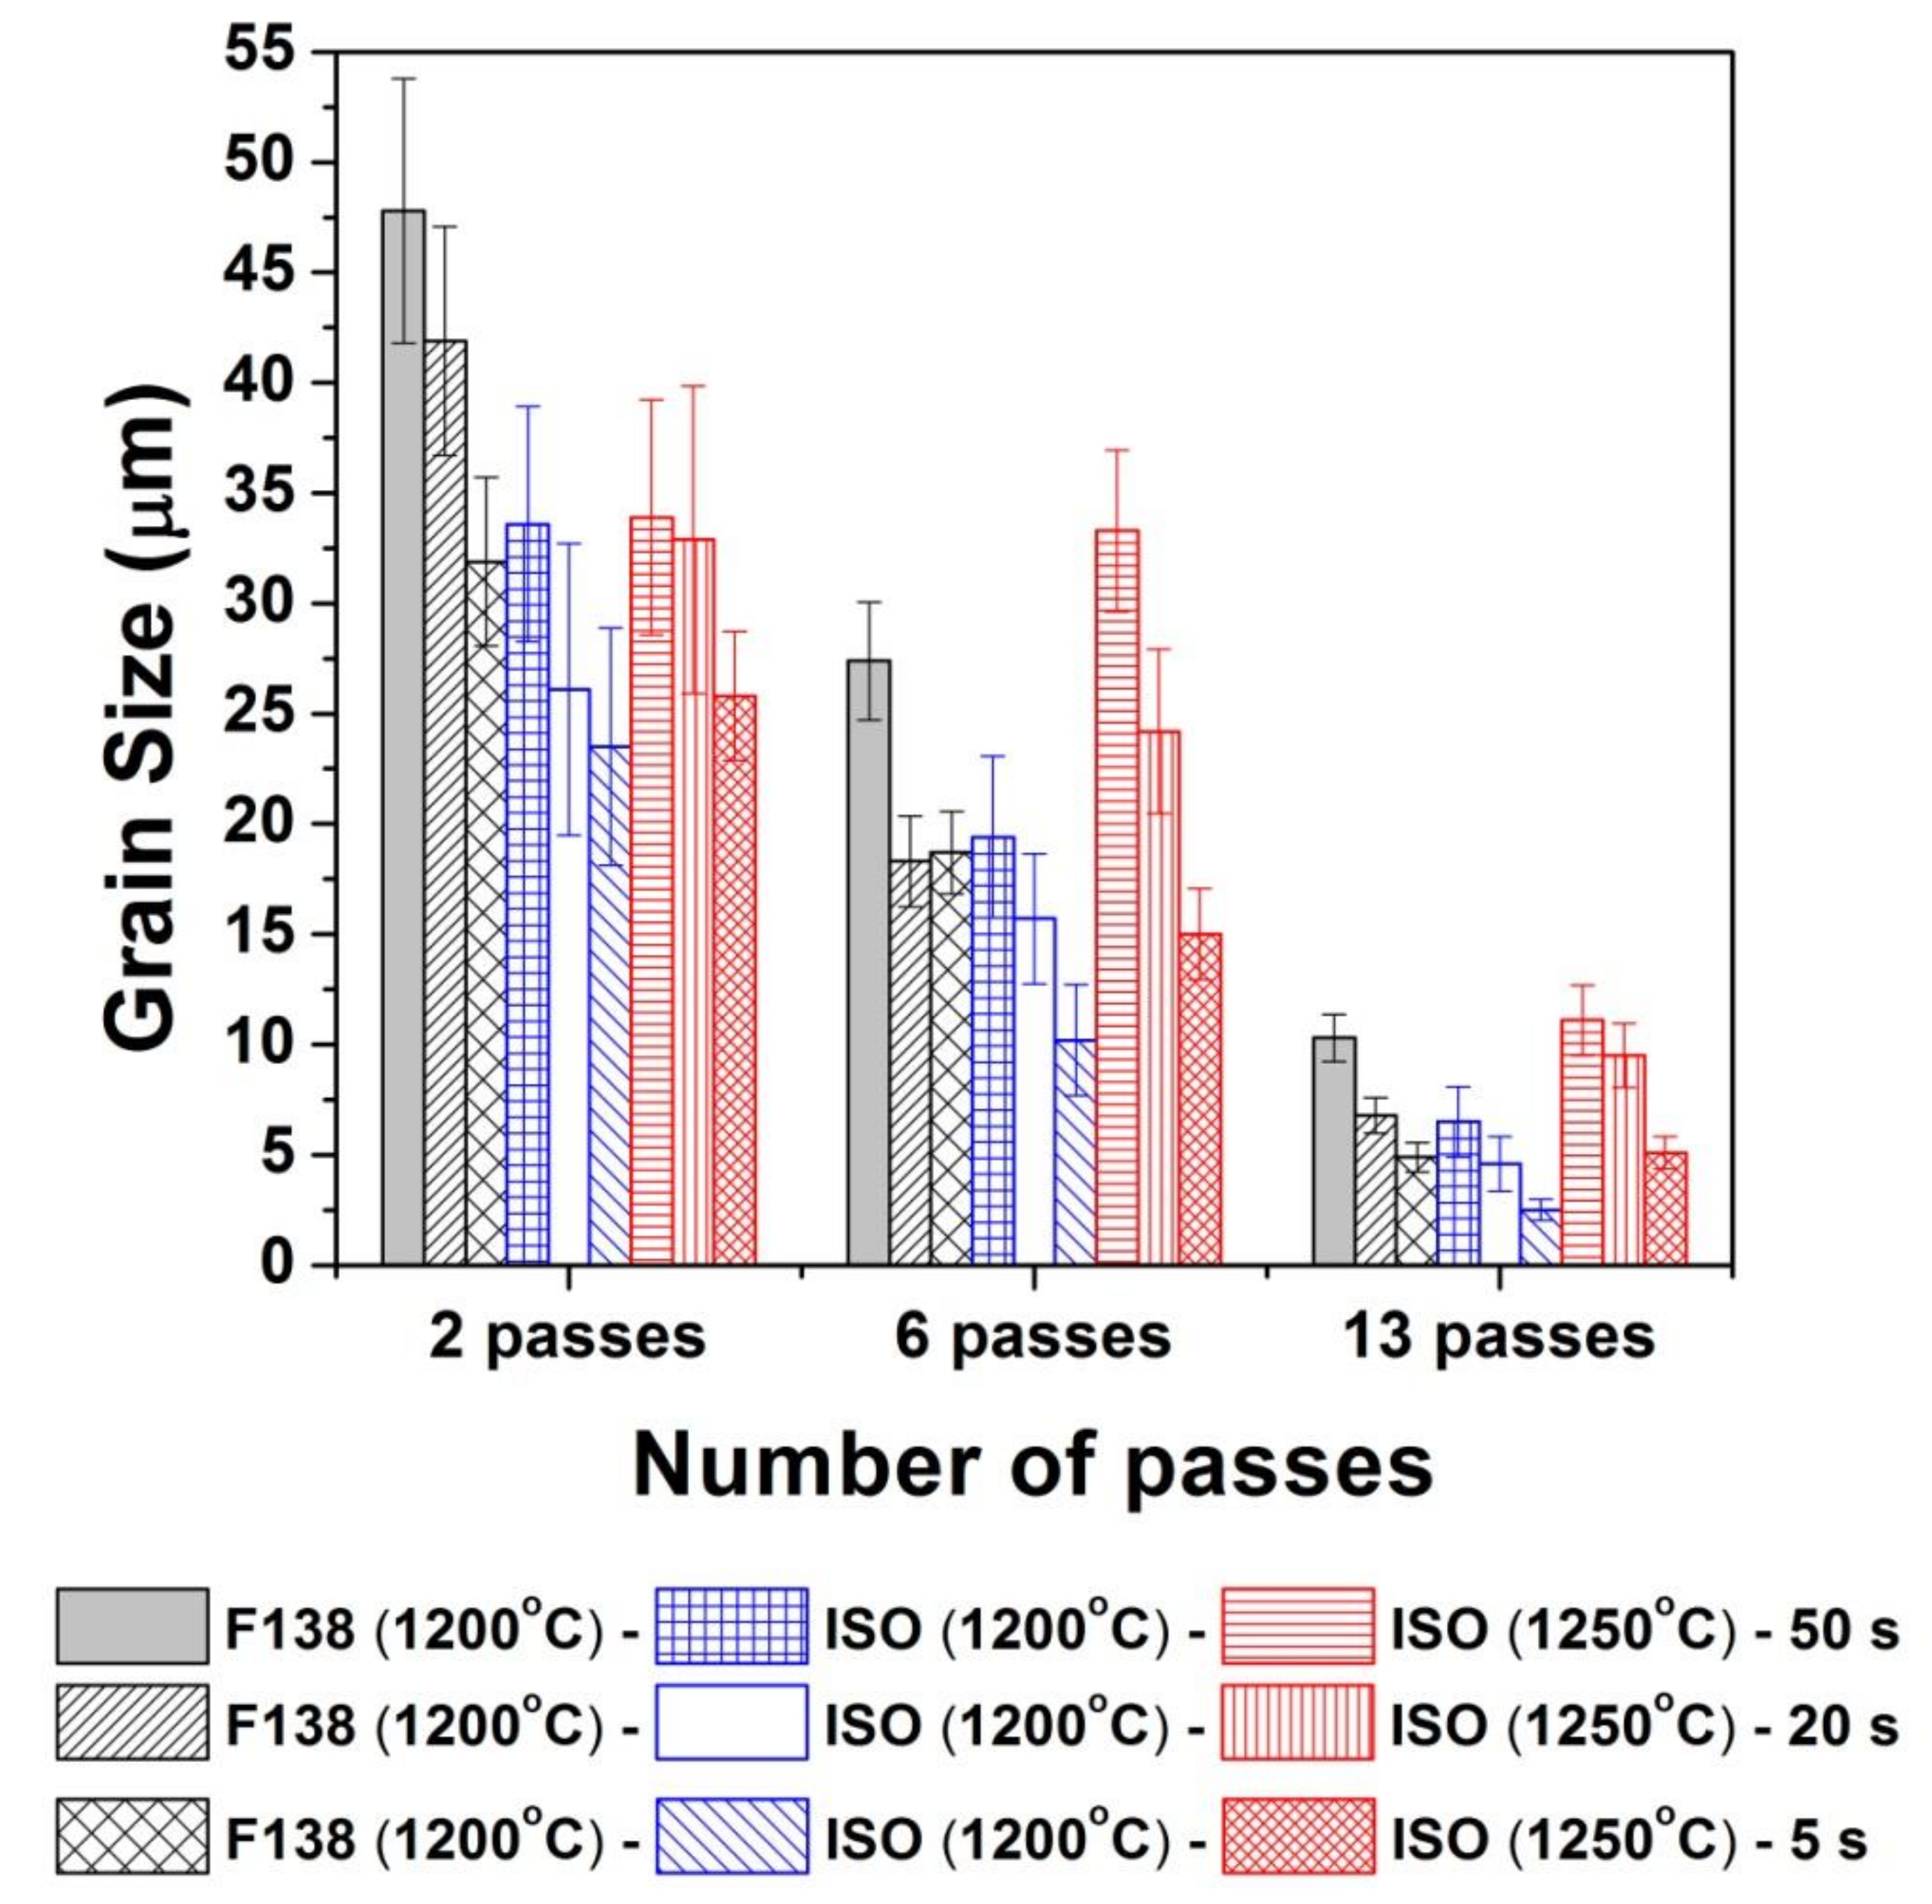
3.2. Microstructural Evolution

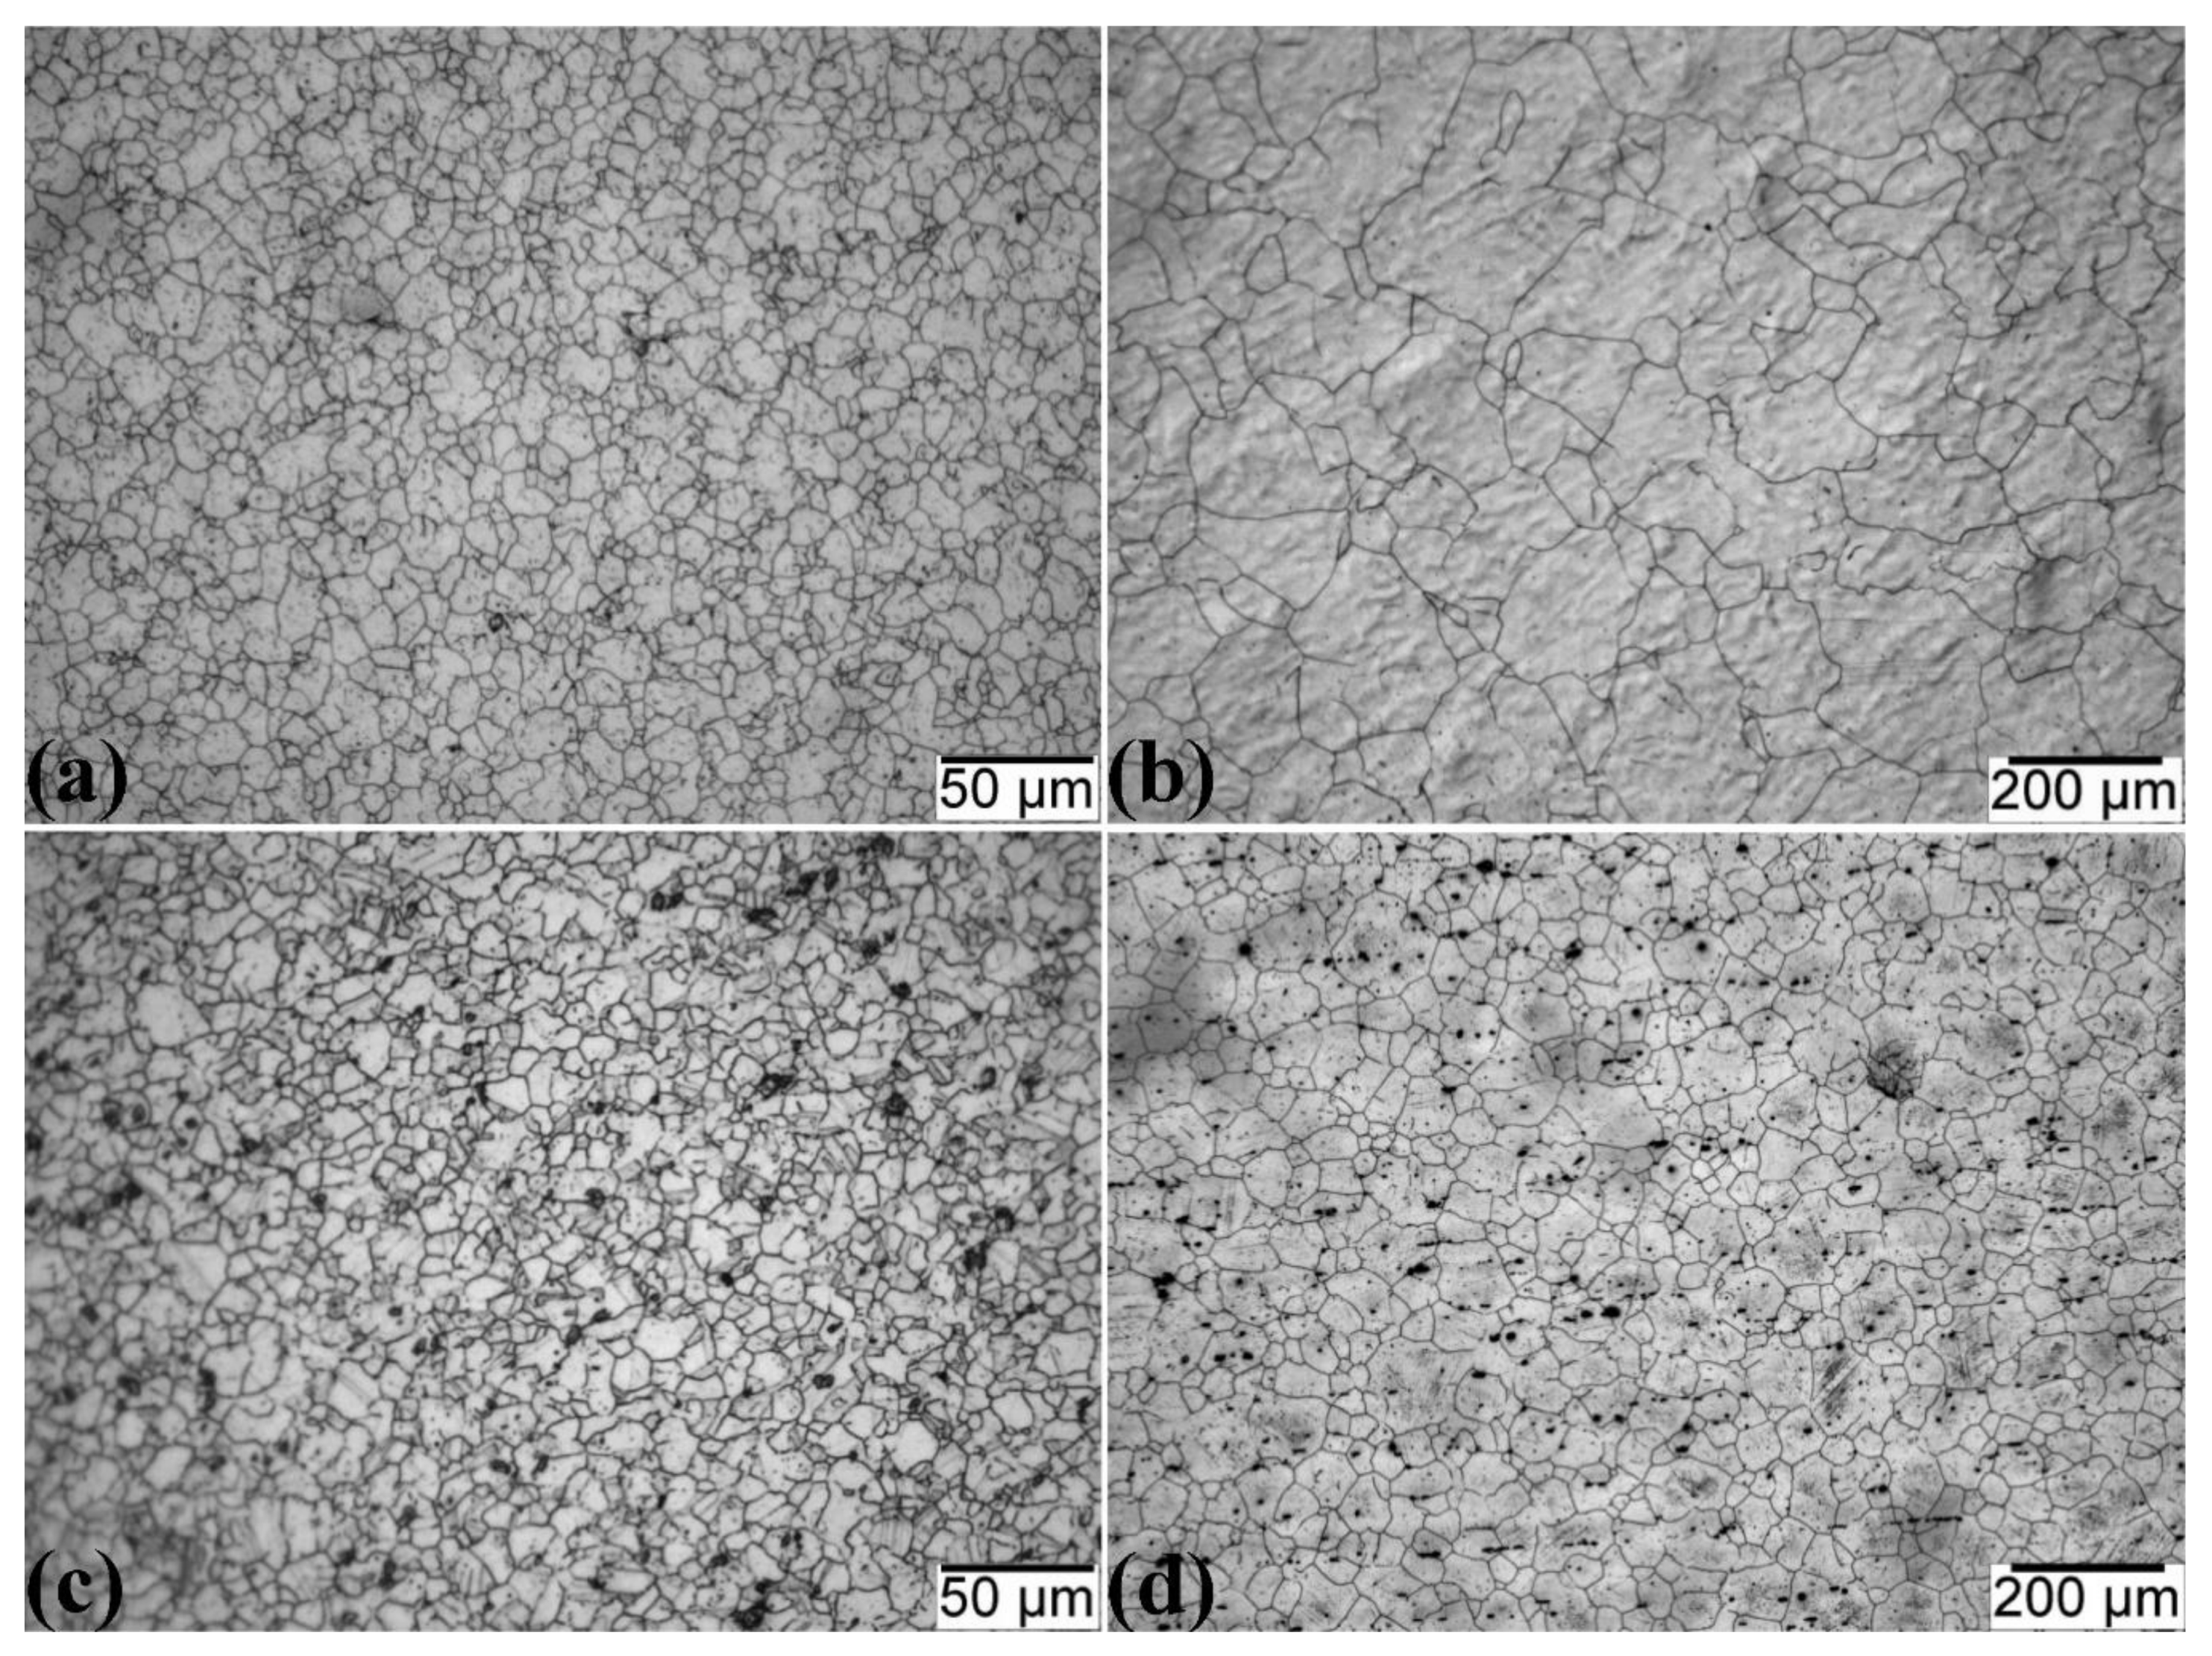
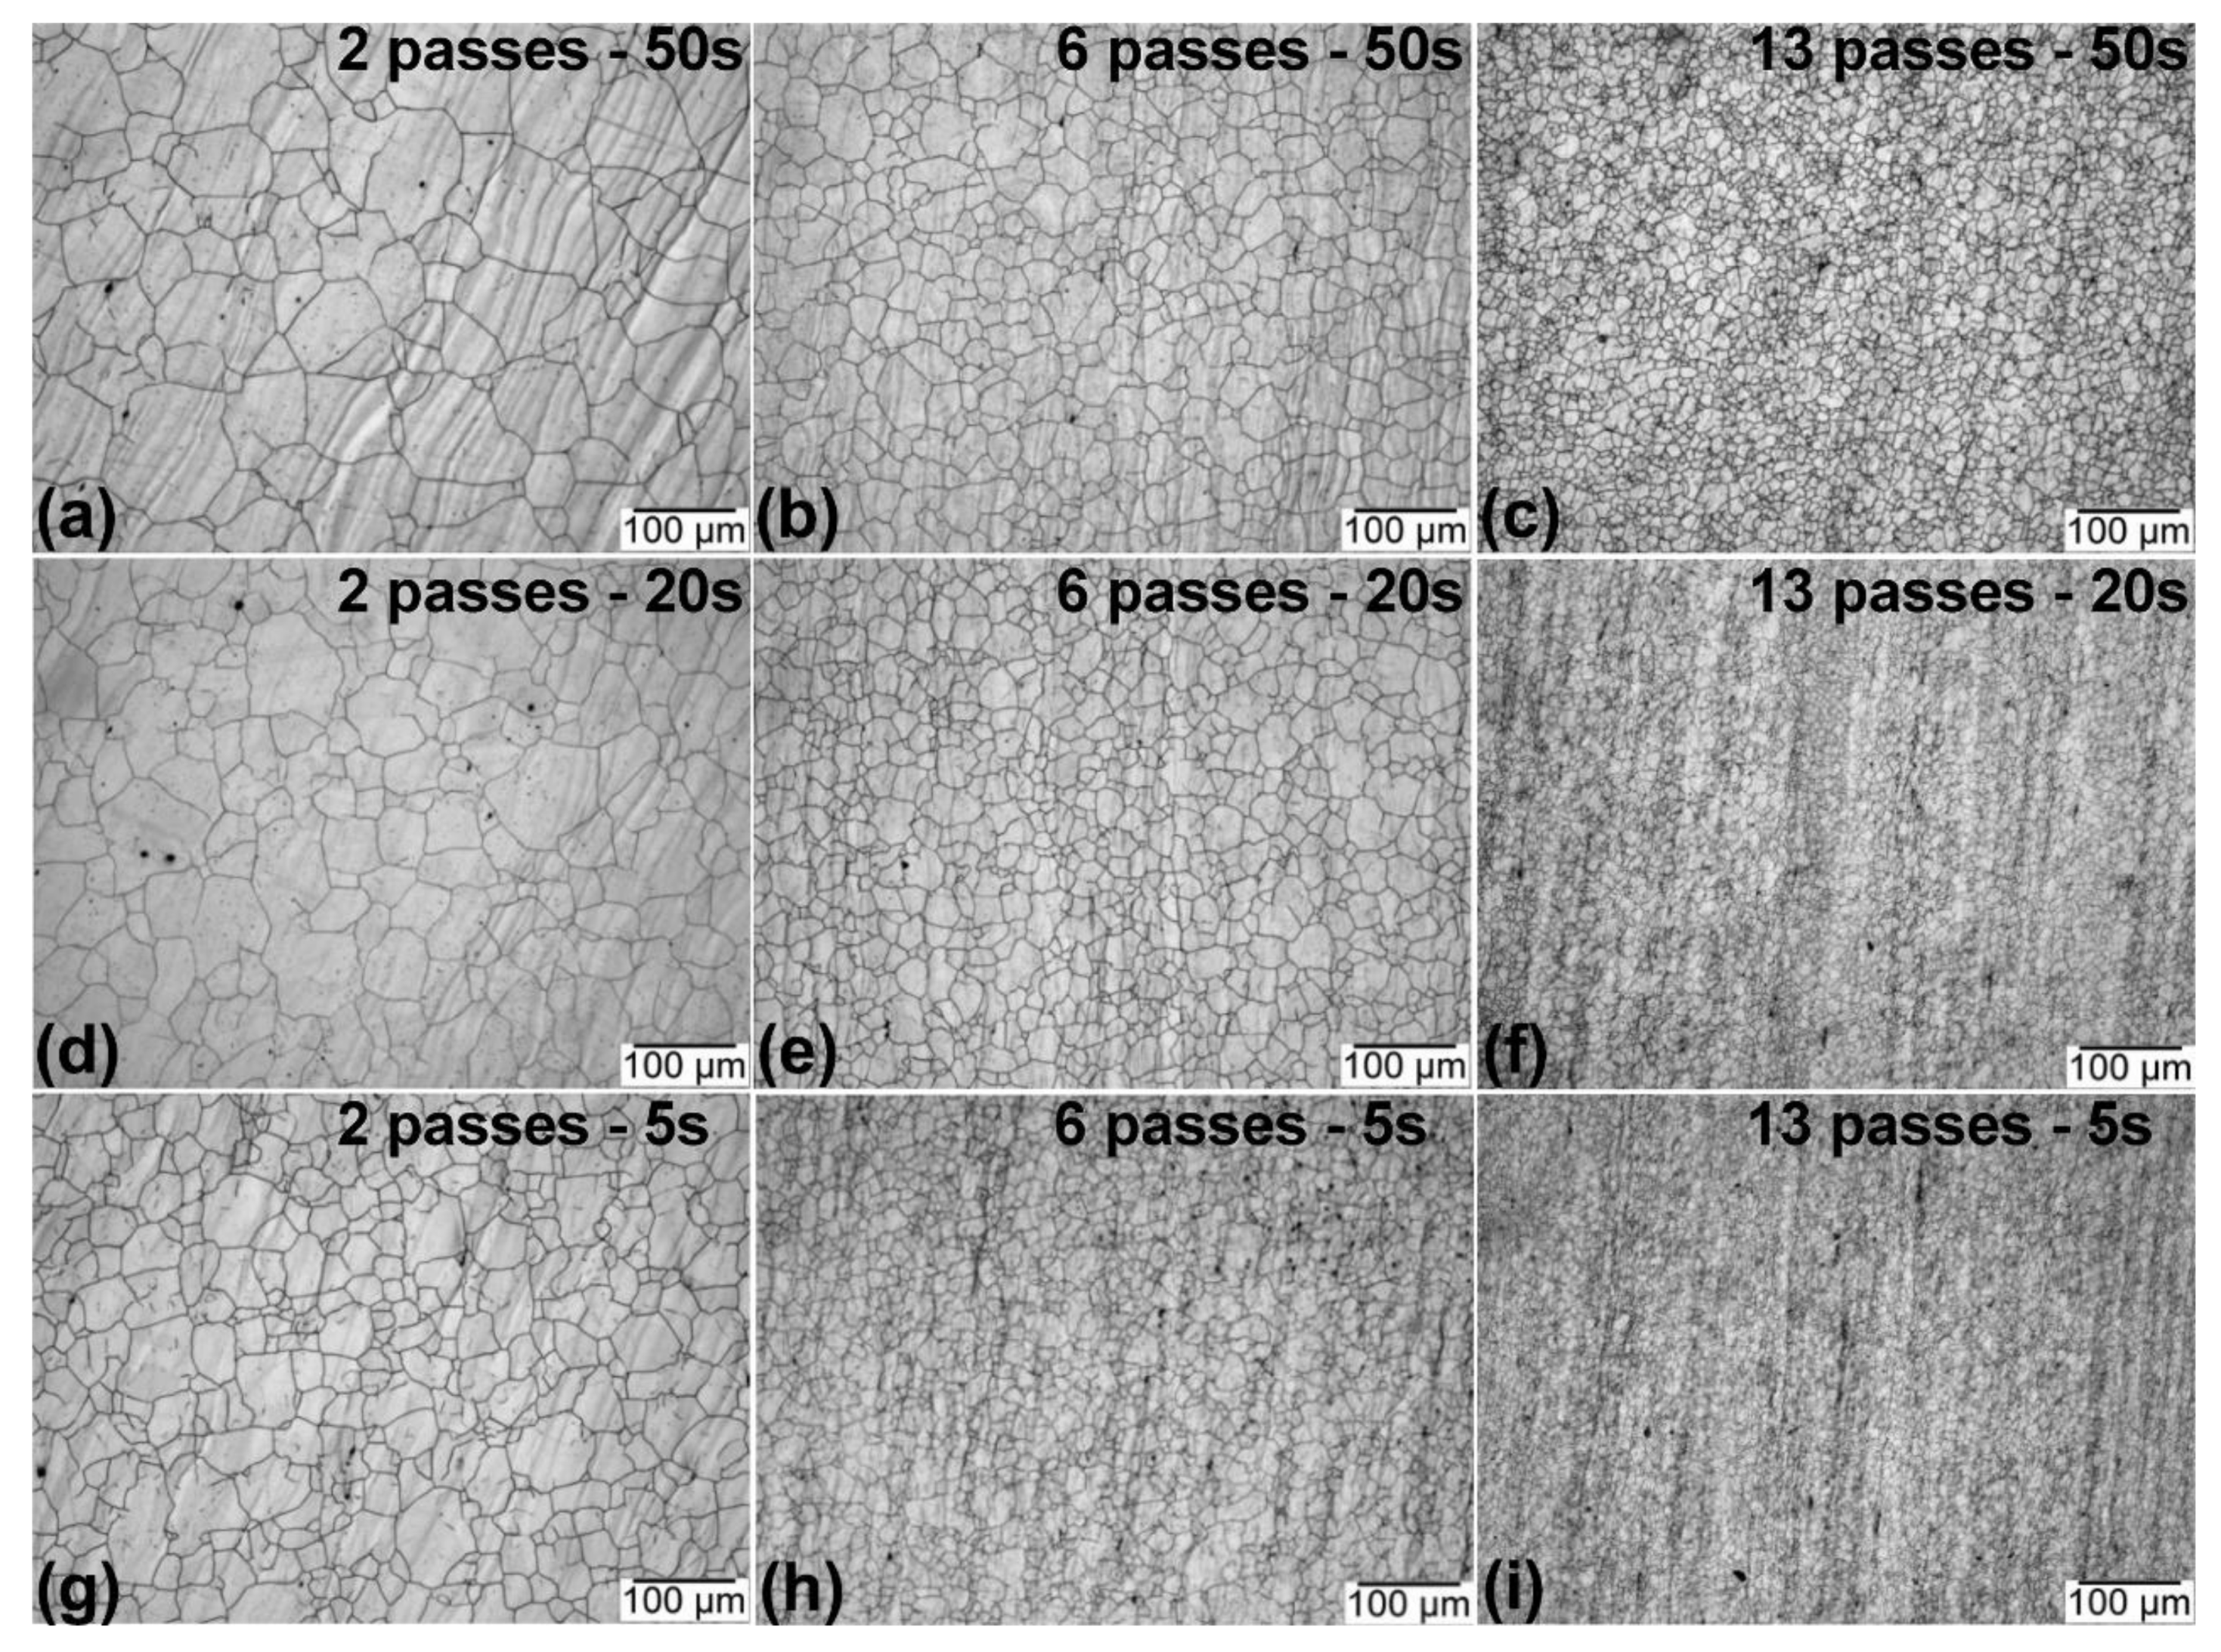
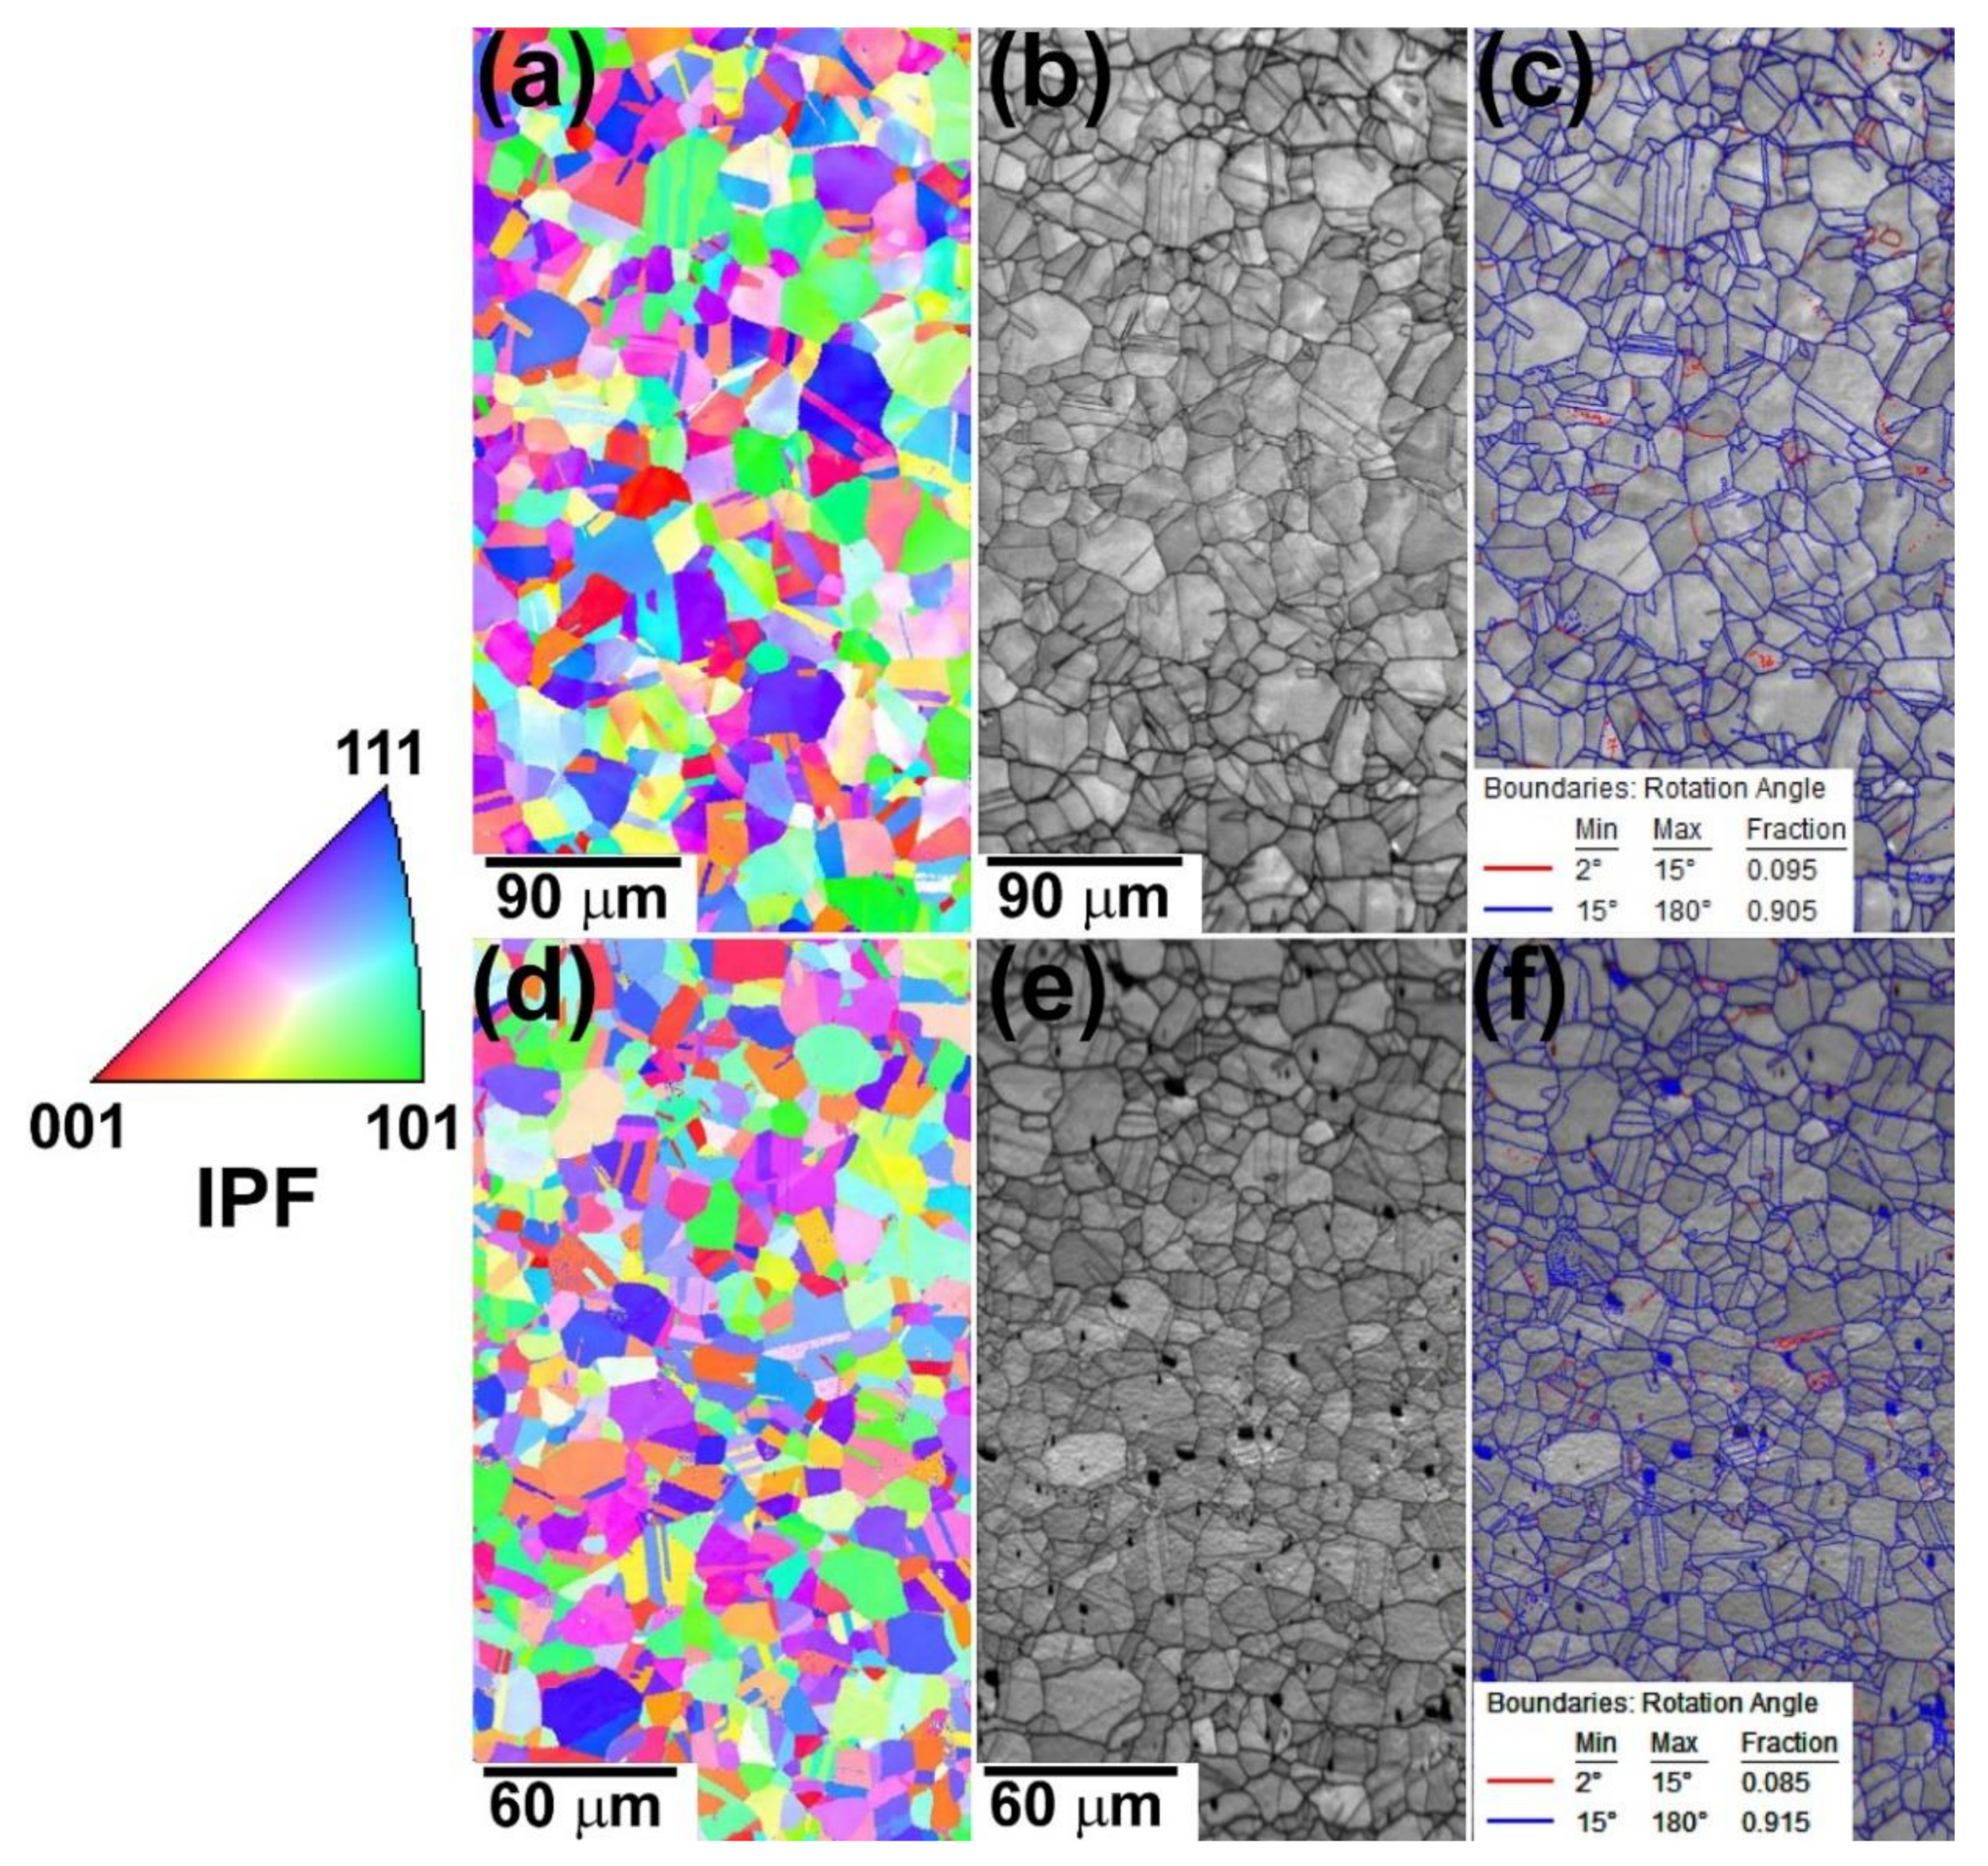
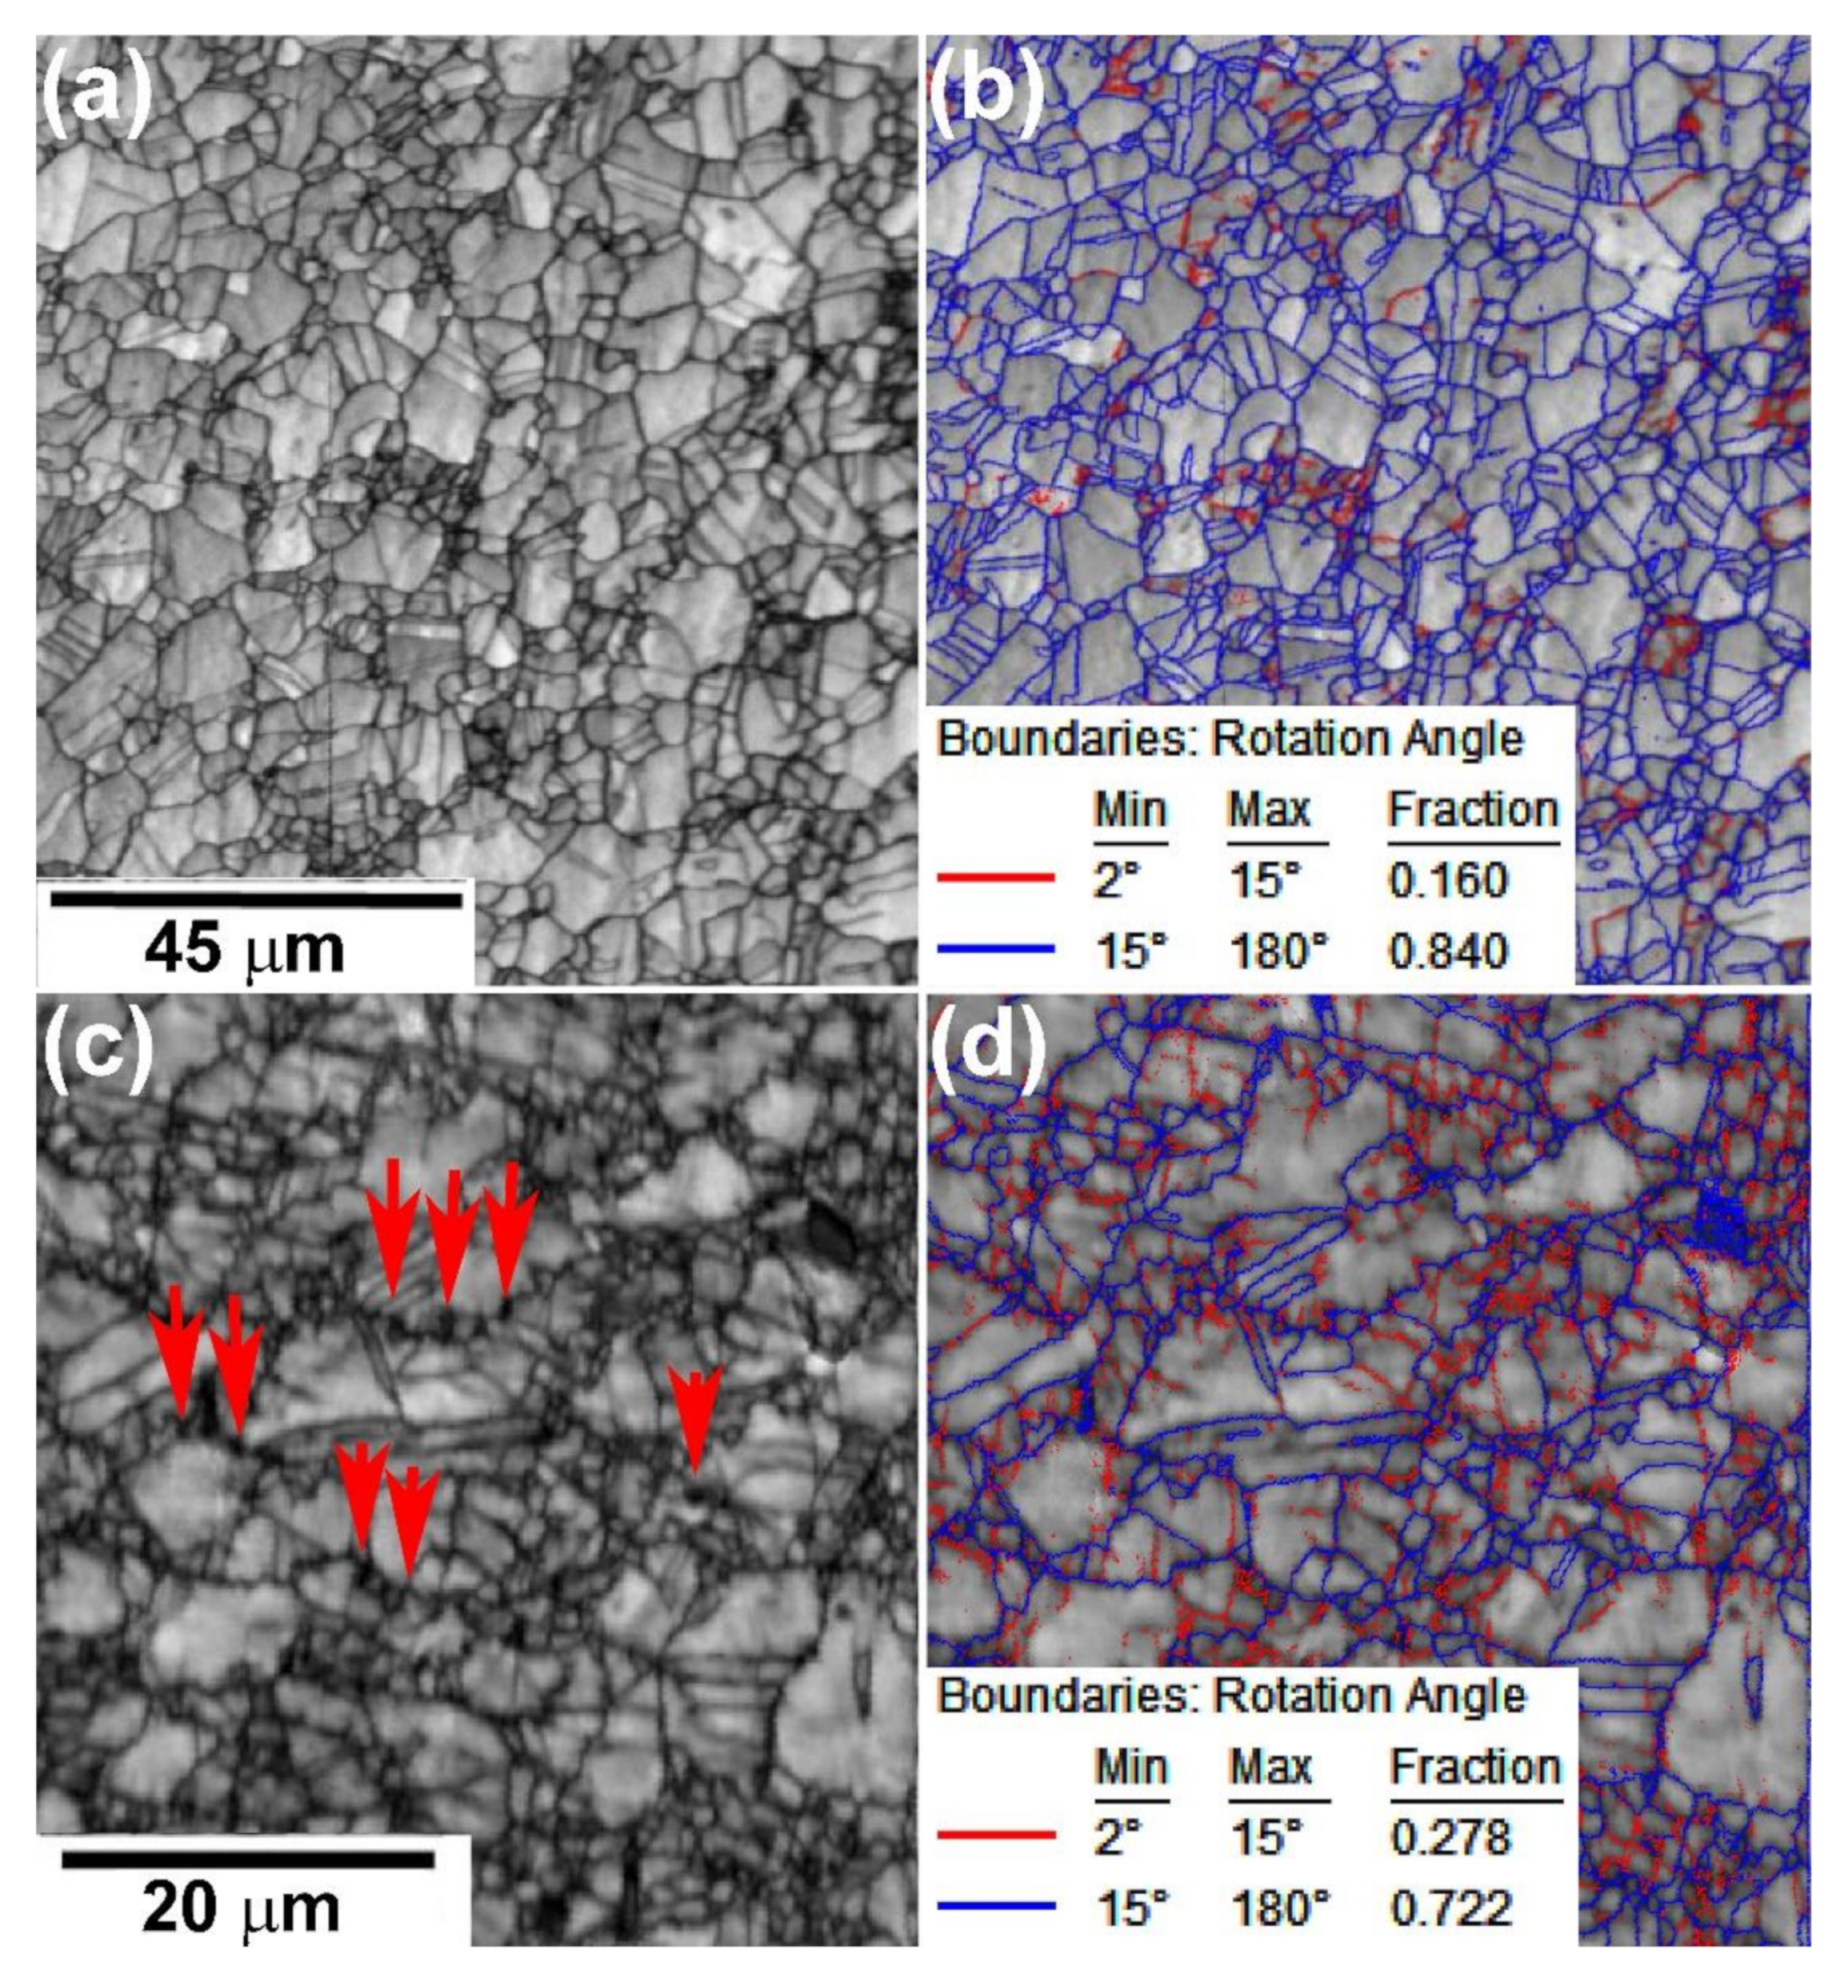
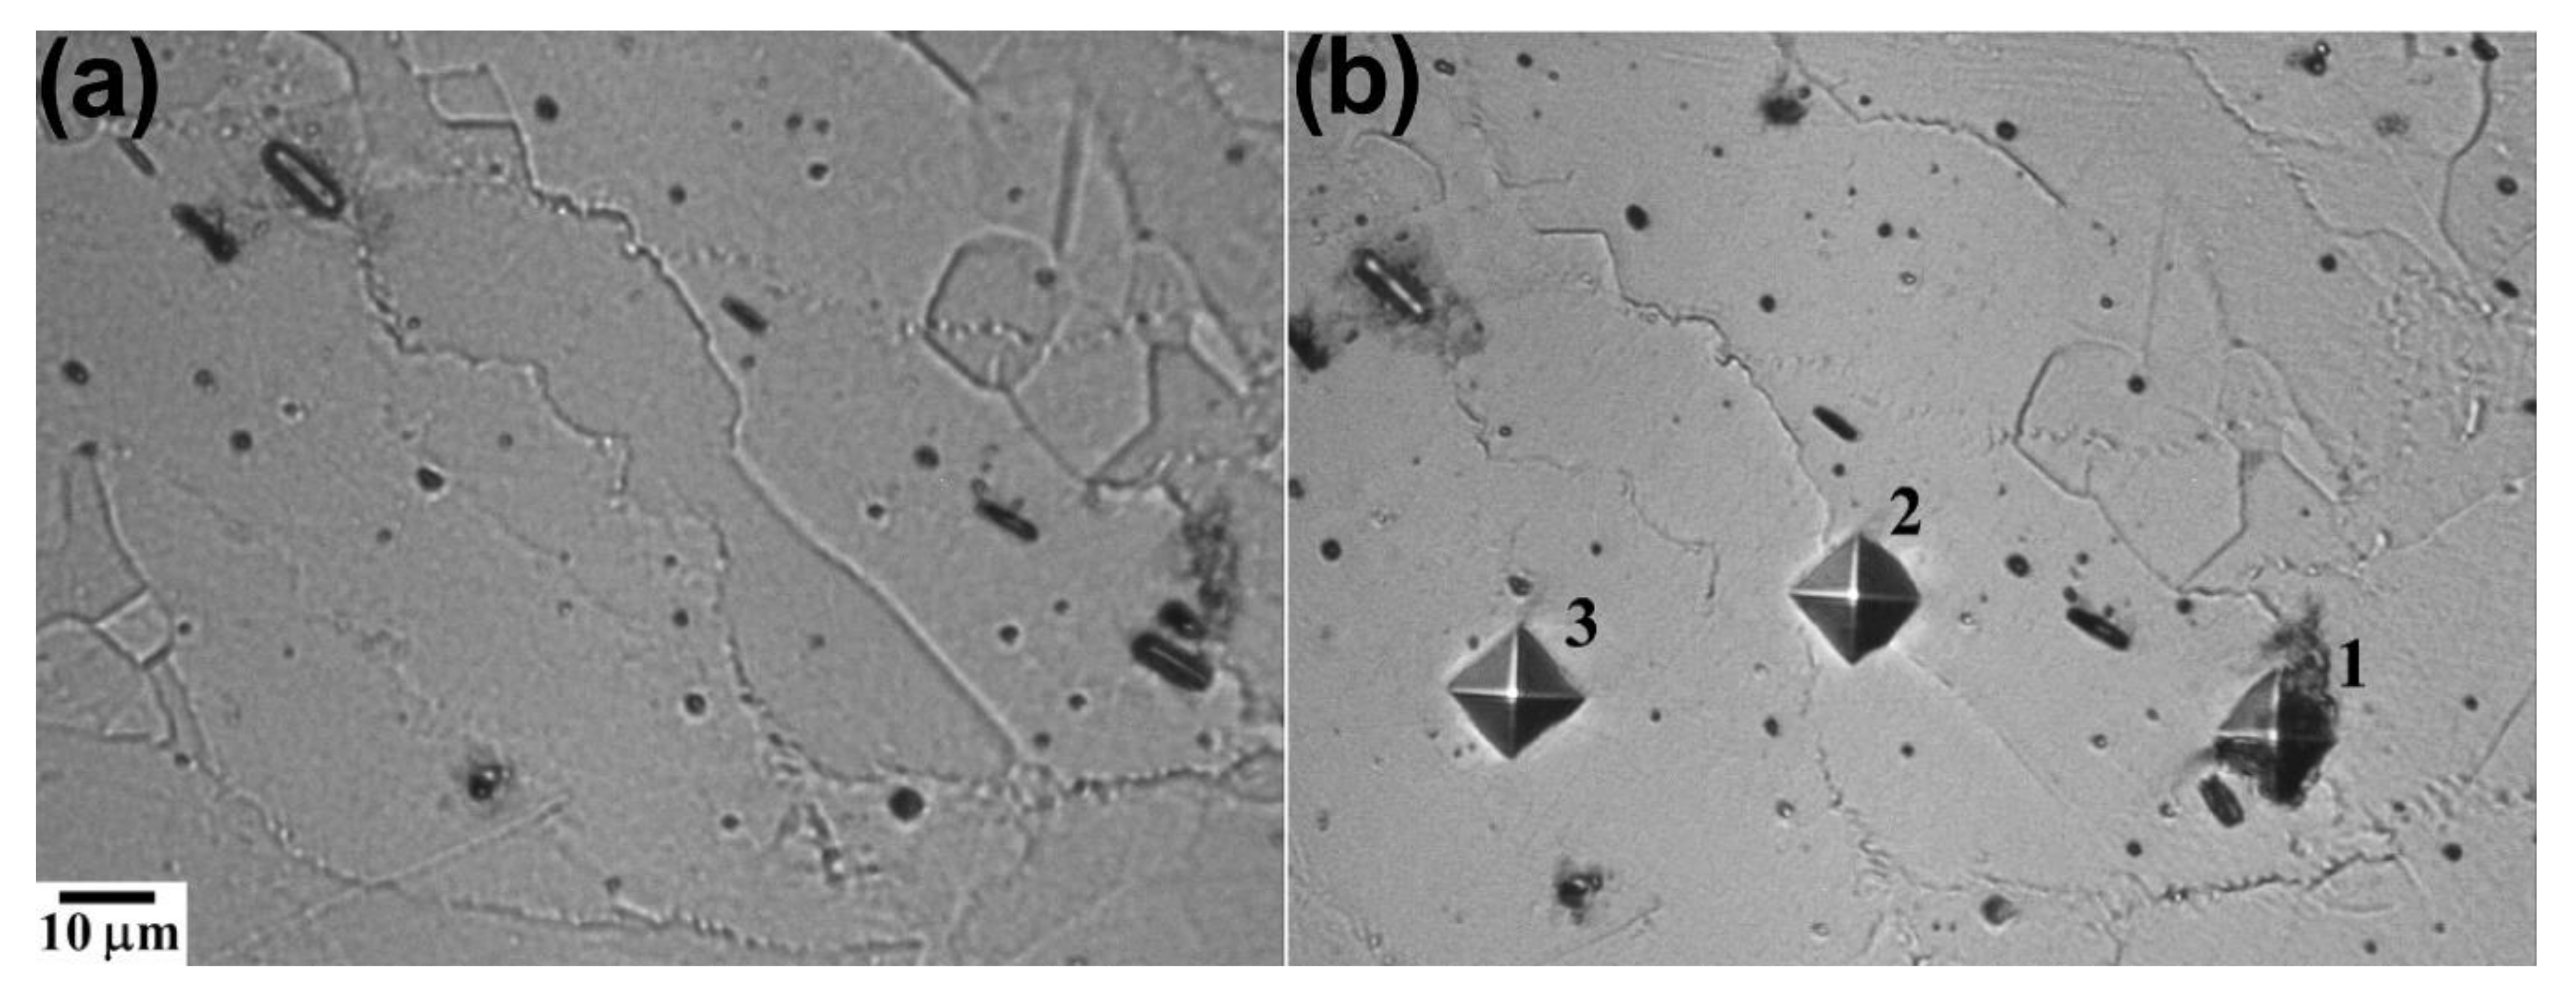
3.2.1. Optical Microscopy

Figure 3 displays the microstructures of the F138 and ISO steels in the as-received condition and after soaking at 1200 °C. In the as-received state, an average grain size of ~9.3 µm and ~14.4 µm was obtained for steels F138 (Figure 3a) and ISO (Figure 3c), respectively. Both steels presented very homogeneous equiaxed grain microstructures. However, as one may observe, undissolved large second-phase particles are present within grains and into the boundaries of the grains of the ISO steel sample. A complete characterization of second phase particles can be found in a previous work [16]. In this study, it was observed that only the TiNbN particles were present after soaking, whereas fine particles of TiNbN, Z-phase (CrNbN), and NbN precipitated during thermomechanical processing.
After soaking at 1200 °C for 300 s, microstructures became heterogeneous, with small and large equiaxed grains in both kinds of steels. Average grain size of around 90.7 µm was found for the F138 steel (Figure 3b) and about 42.7 µm for the ISO steel (Figure 3d). This steel also presents some second phase particles distributed along grain boundaries and within grains, as they were before reheating. However, it is evident that such particles (black spots in Figure 3c,d) were refined from ~7 μm to ~3.4 μm, indicating that some dissolution occurred even at 1200 °C. Figure 4 and Figure 5 display the microstructure evolution as a function of the pass number and interpass times in the F138 and ISO steels, respectively. The same magnifications were used for better comparison. However, microstructural details will be revealed later with the EBSD analysis in the following section. Aiming to allow static restoration processes in the steels, they were water quenched after waiting for the interpass time following deformation interruption.
Regarding the F138 steel, Figure 4 shows that the grain refinement was more significant with the decrease of interpass time and the increase in the number of passes. Figure 5 reveals that the ISO steel soaked at 1200 °C displays a similar behavior than the F138 steel. However, the decrease in the interpass time leads to smaller grain sizes than for the F138 steel.

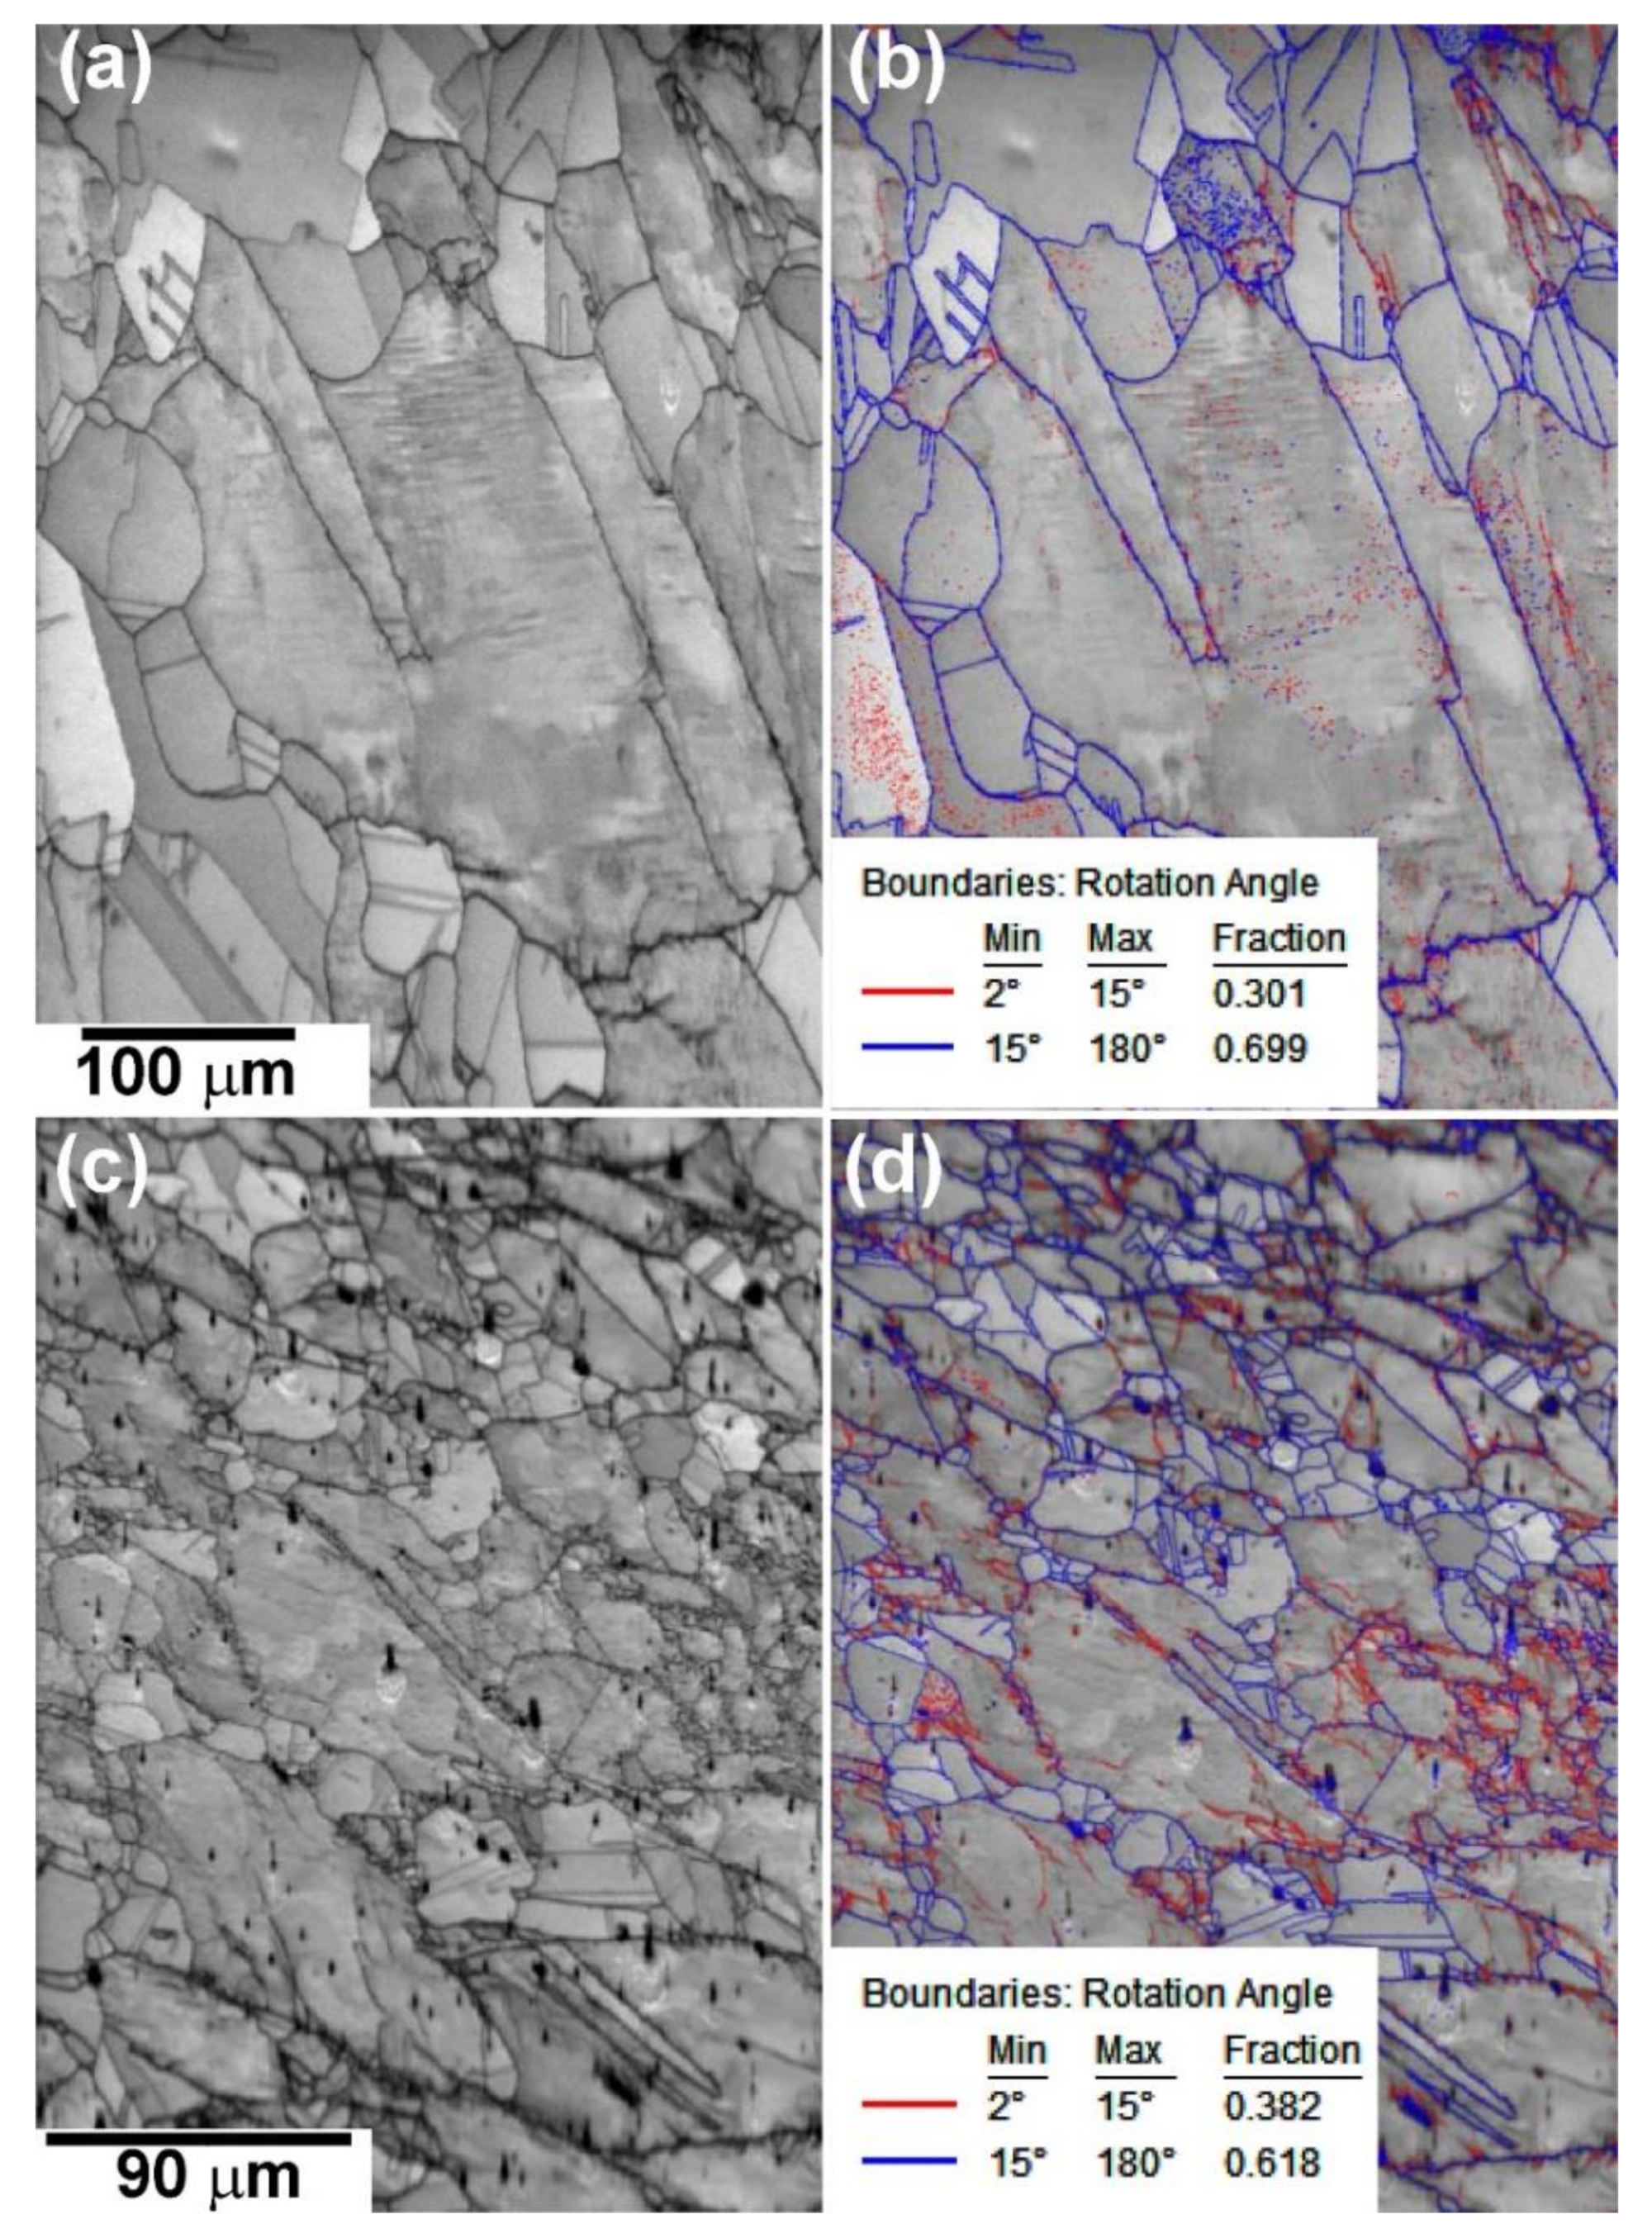
3.2.2. EBSD Analysis

EBSD images from samples reheated at 1200 °C and subjected to deformation schedules with an interpass time of 20 s are presented in Figure 6. In this case, differently from optical microscopy shown in Figure 4 and Figure 5 samples were water quenched immediately after the second pass deformation. This quenching procedure was used to avoid static restoration processes, thus analyzing dynamic ones. Image quality (IQ) maps (Figure 6a,c) reflect the high excellence of the indexation of electron backscattered patterns (EBSP). Large black spots were identified in [16] as TiNbN particles. These large particles resulted from their nondissolution after low-temperature soaking (please, refer to Figure 3 and detailed description). Maps of boundaries superimposed to IQ images are presented in Figure 5b,d, for the F138 and ISO steels respectively. In these pictures, fractions of high- (misorientations θ > 15°—blue lines) and low-angle (2° < θ < 15°—red lines) boundaries are an indirect way of measuring the recrystallized volume fraction.
Intending to analyze static processes of recovery and recrystallization between passes, Figure 7 depicts EBSD images from samples that were water quenched after waiting for the interpass time. In this case, EBSD was performed in samples strained up to the sixth pass with an interpass time of 20 s. Figure 7a,c present results for the F138 steel, while Figure 7d,f correspond to the ISO alloy, both after reheating at 1200 °C.
Orientation imaging maps (OIM) are shown in Figure 7a,d for the F138 and ISO steels, respectively. The color indexation of orientations is displayed in the inverse pole figures (IPF), also presented in Figure 7. Such maps indicate that both materials have no preferred orientation.
IQ images (Figure 7b,e) illustrate the presence of several twins in both materials and the presence of second phase particles in the ISO steel (Figure 7e). Very homogeneous microstructures are observed with a noticeable unimodal distribution of grain sizes. However, as already pointed out, the average grain size is smaller for the ISO steel than for the F138 one.
Figure 7c (corresponding to F138 steel) and Figure 7f (corresponding to ISO steel) show maps of the distribution of boundaries superimposed to their respective IQ images. As stated before, fractions of high-angle (misorientations θ > 15°—blue lines) and low-angle (2° < θ < 15°—red lines) boundaries indirectly give information regarding recrystallized volume fraction.
Figure 8 displays EBSD images of samples soaked at 1200 °C and strained up to 13 passes, using interpass times of 5 s, and quenched immediately after deformation. Figure 8a,b were obtained from a specimen of the F138 steel, and Figure 8c,d from the ISO steel. It is noted that the same remarks made for the micrographs of Figure 7 apply to these latter microstructures.
Along with different behavior of flow stress curves (Figure 2e,f) for the ISO steel when deformed after soaking at 1200 °C or 1250 °C, it was also observed differences in the microstructural evolution. Figure 9 presents EBSD analysis for the ISO steel samples after 13 deformation passes, using an interpass time of 20 s. Figure 9a,b present the results of a specimen soaked at 1200 °C, and Figure 9c,d of one soaked at 1250 °C. It is worth emphasizing that the same characteristics were also observed for interpass times of 50 and 5 s.

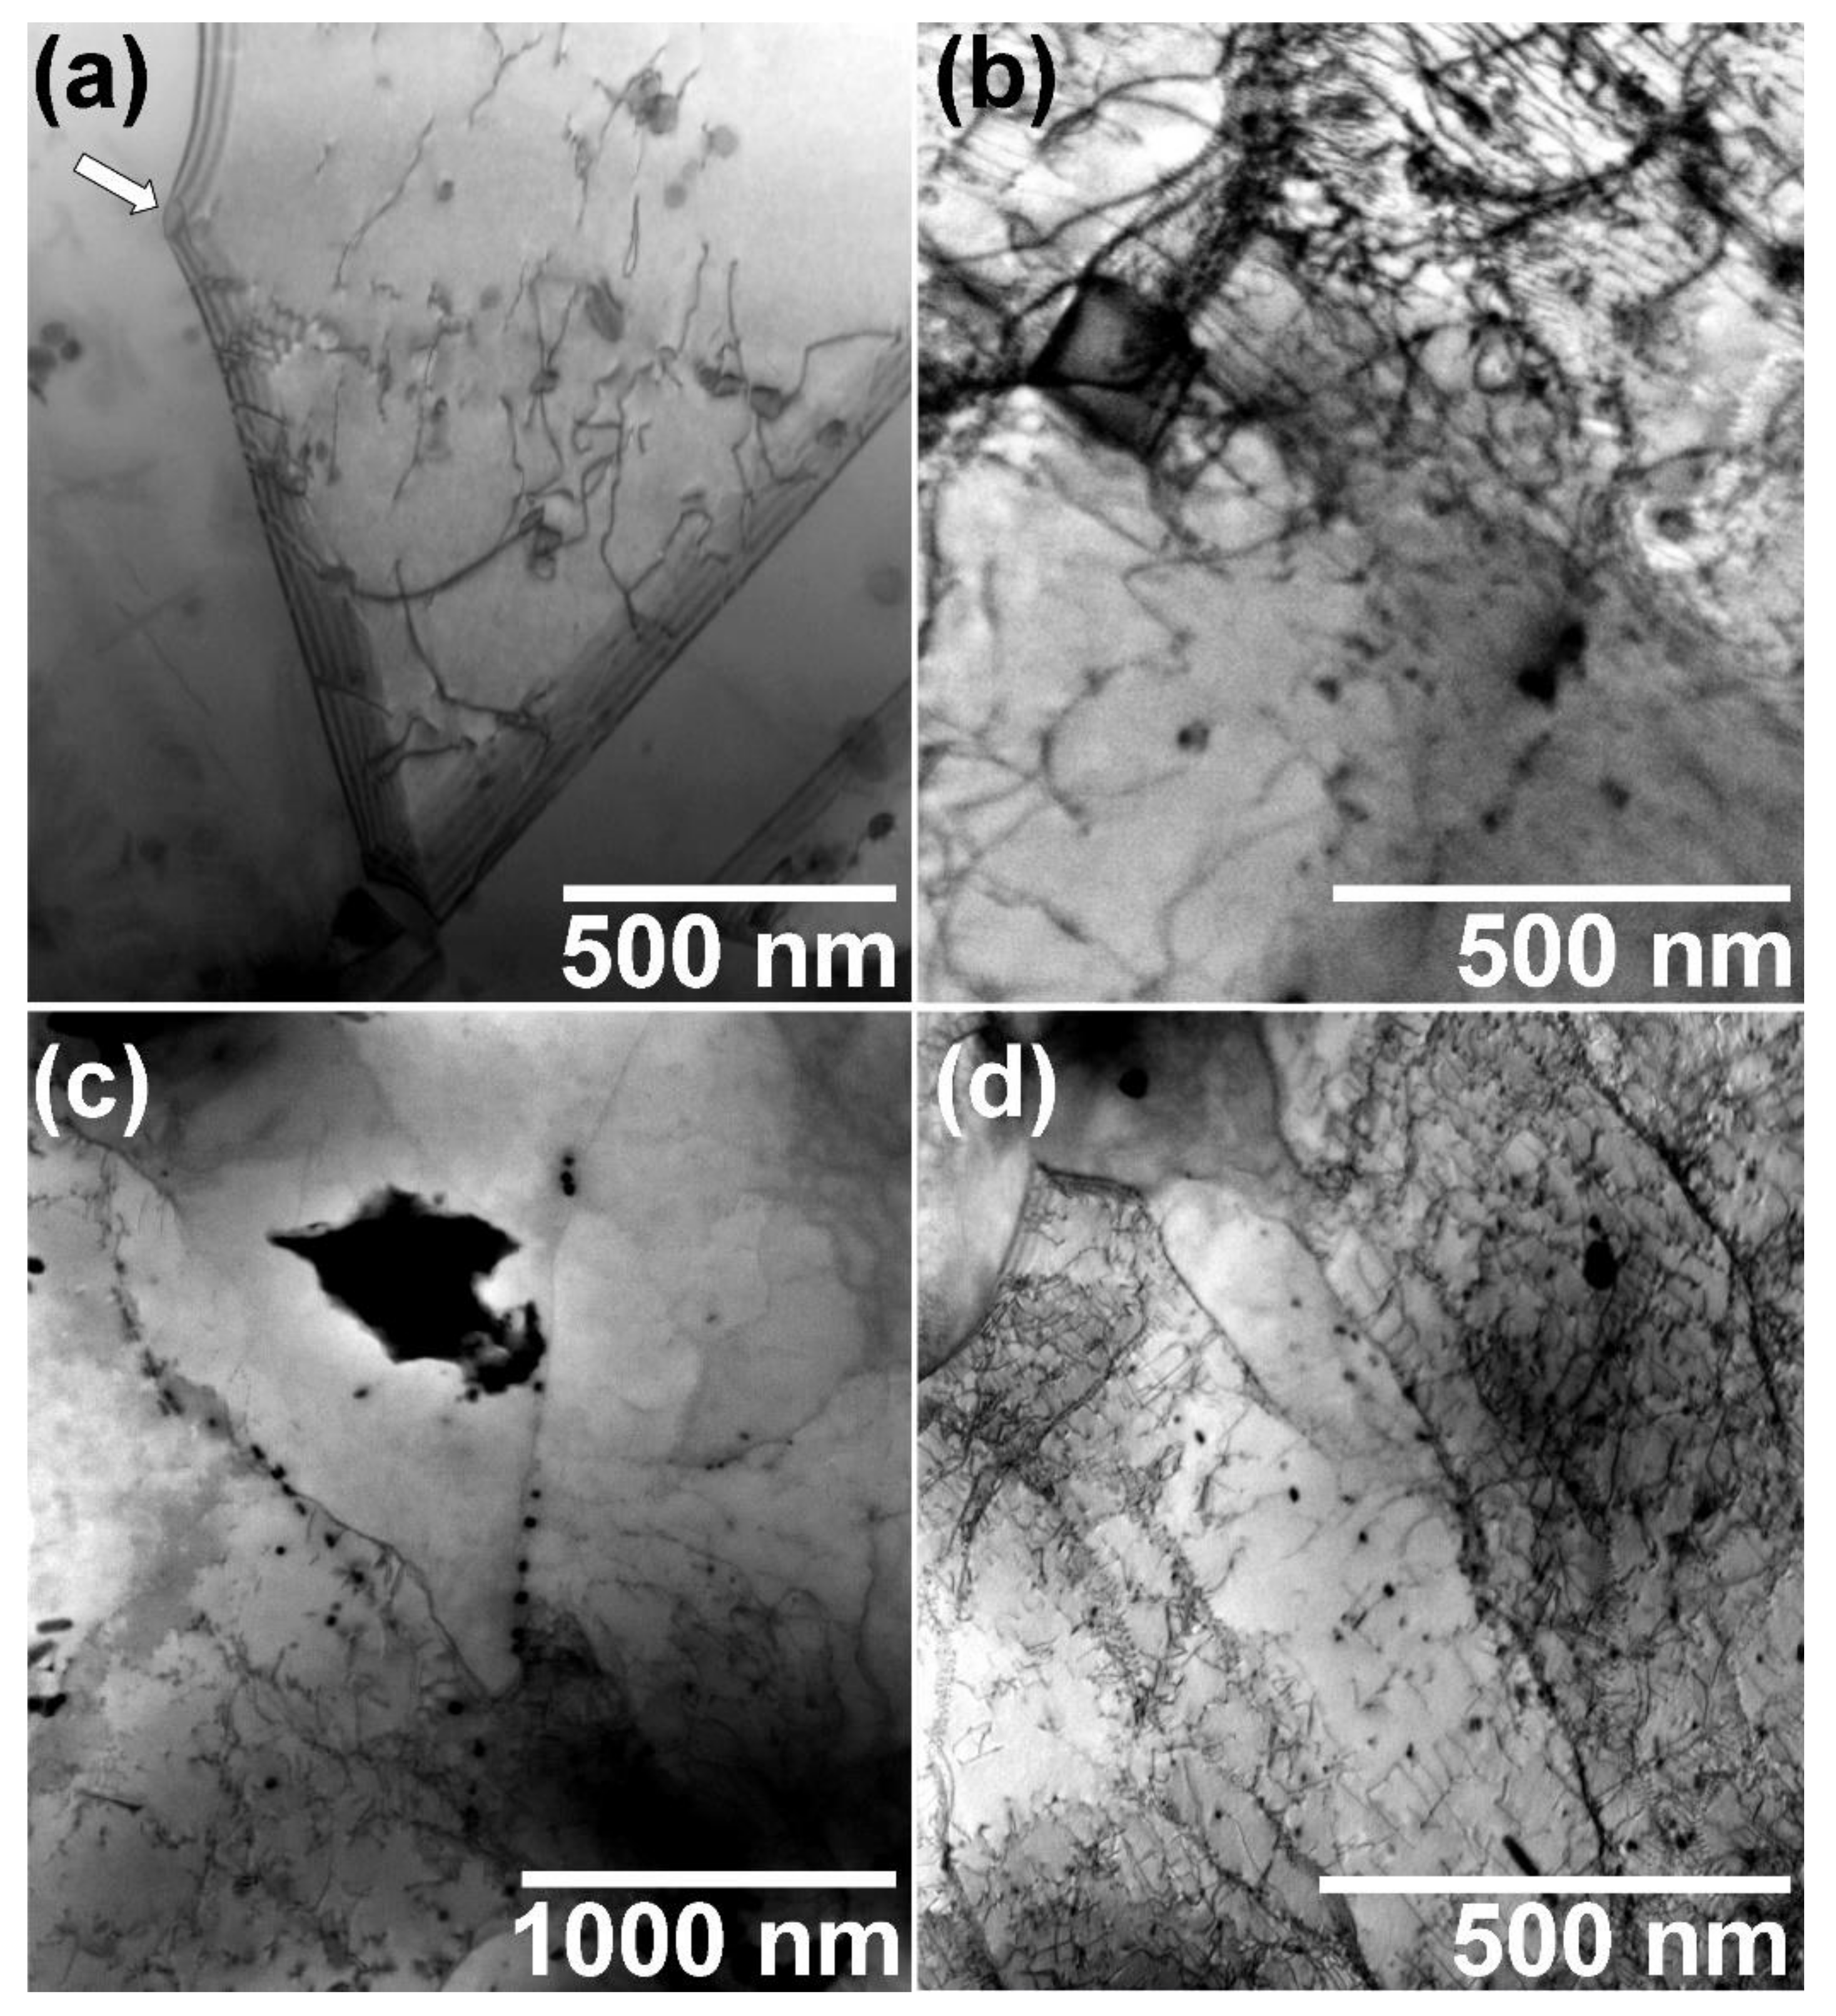
3.2.3. TEM Observations

As already commented in the introduction, the ISO steel presents a considerable delay in dynamic recrystallization due to its intermediate SFE level because of the presence of high amounts of elements in solid solution [10]. Besides this effect, the inhomogeneity noted after the 13th pass and the recrystallization delay in the ISO steel soaked at 1250 °C can additionally be explained in terms of precipitation interaction. To show this fact, transmission electron microscopy (TEM) was performed in samples with 13 passes for the ISO steel soaked at 1250 °C. Figure 10a shows a twinned region, typical of this steel, with some dislocations, precipitates, and thickness fringes. It is worth noting in this micrograph a particle of about 50 nm pinning a grain boundary which had been in motion (white arrow). Figure 10b,c displays regions with a high density of dislocations and precipitates randomly dispersed in the austenitic matrix. One can observe that the precipitates are free in some areas, and they are interacting with dislocations in others. Precipitates interacting with grain boundaries can be noticed from the center to the right-hand part of Figure 10d, where there is a grain boundary being temporarily retained by small particles with short spacing in between them. It is worth recalling that these fine particles were already previously identified as TiNbN, Z-phase (CrNbN), and NbN precipitates [16].

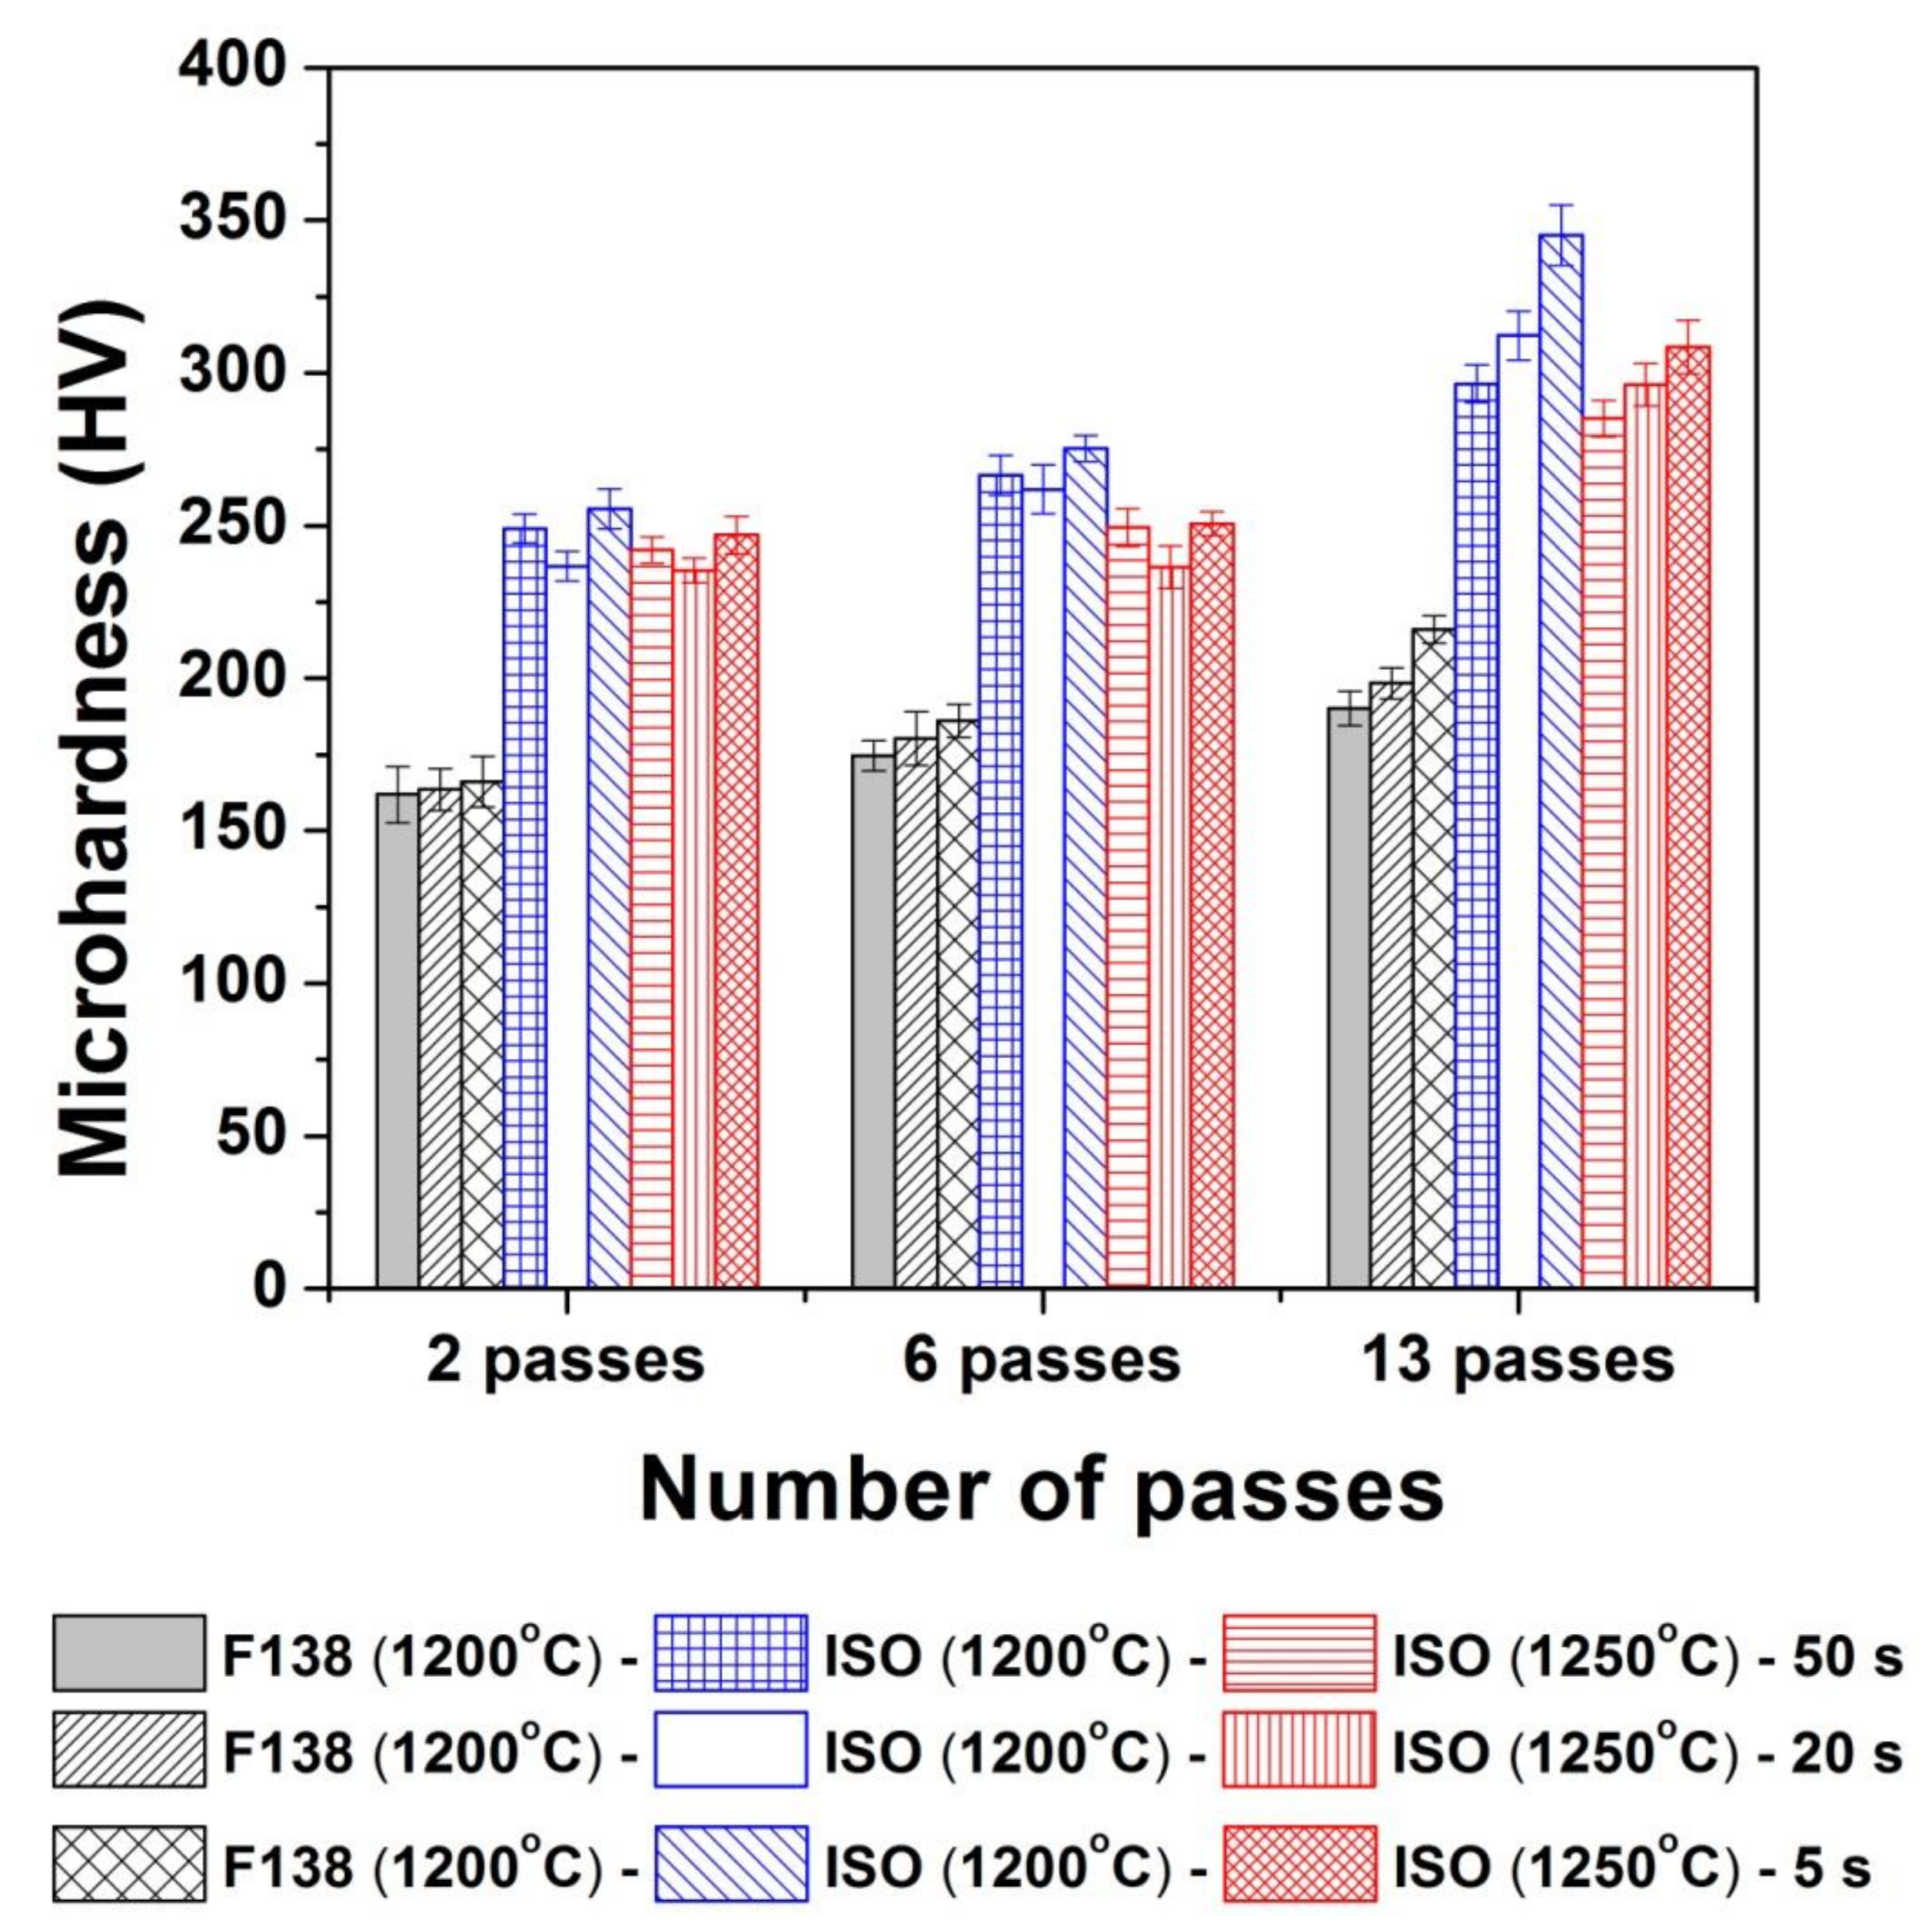
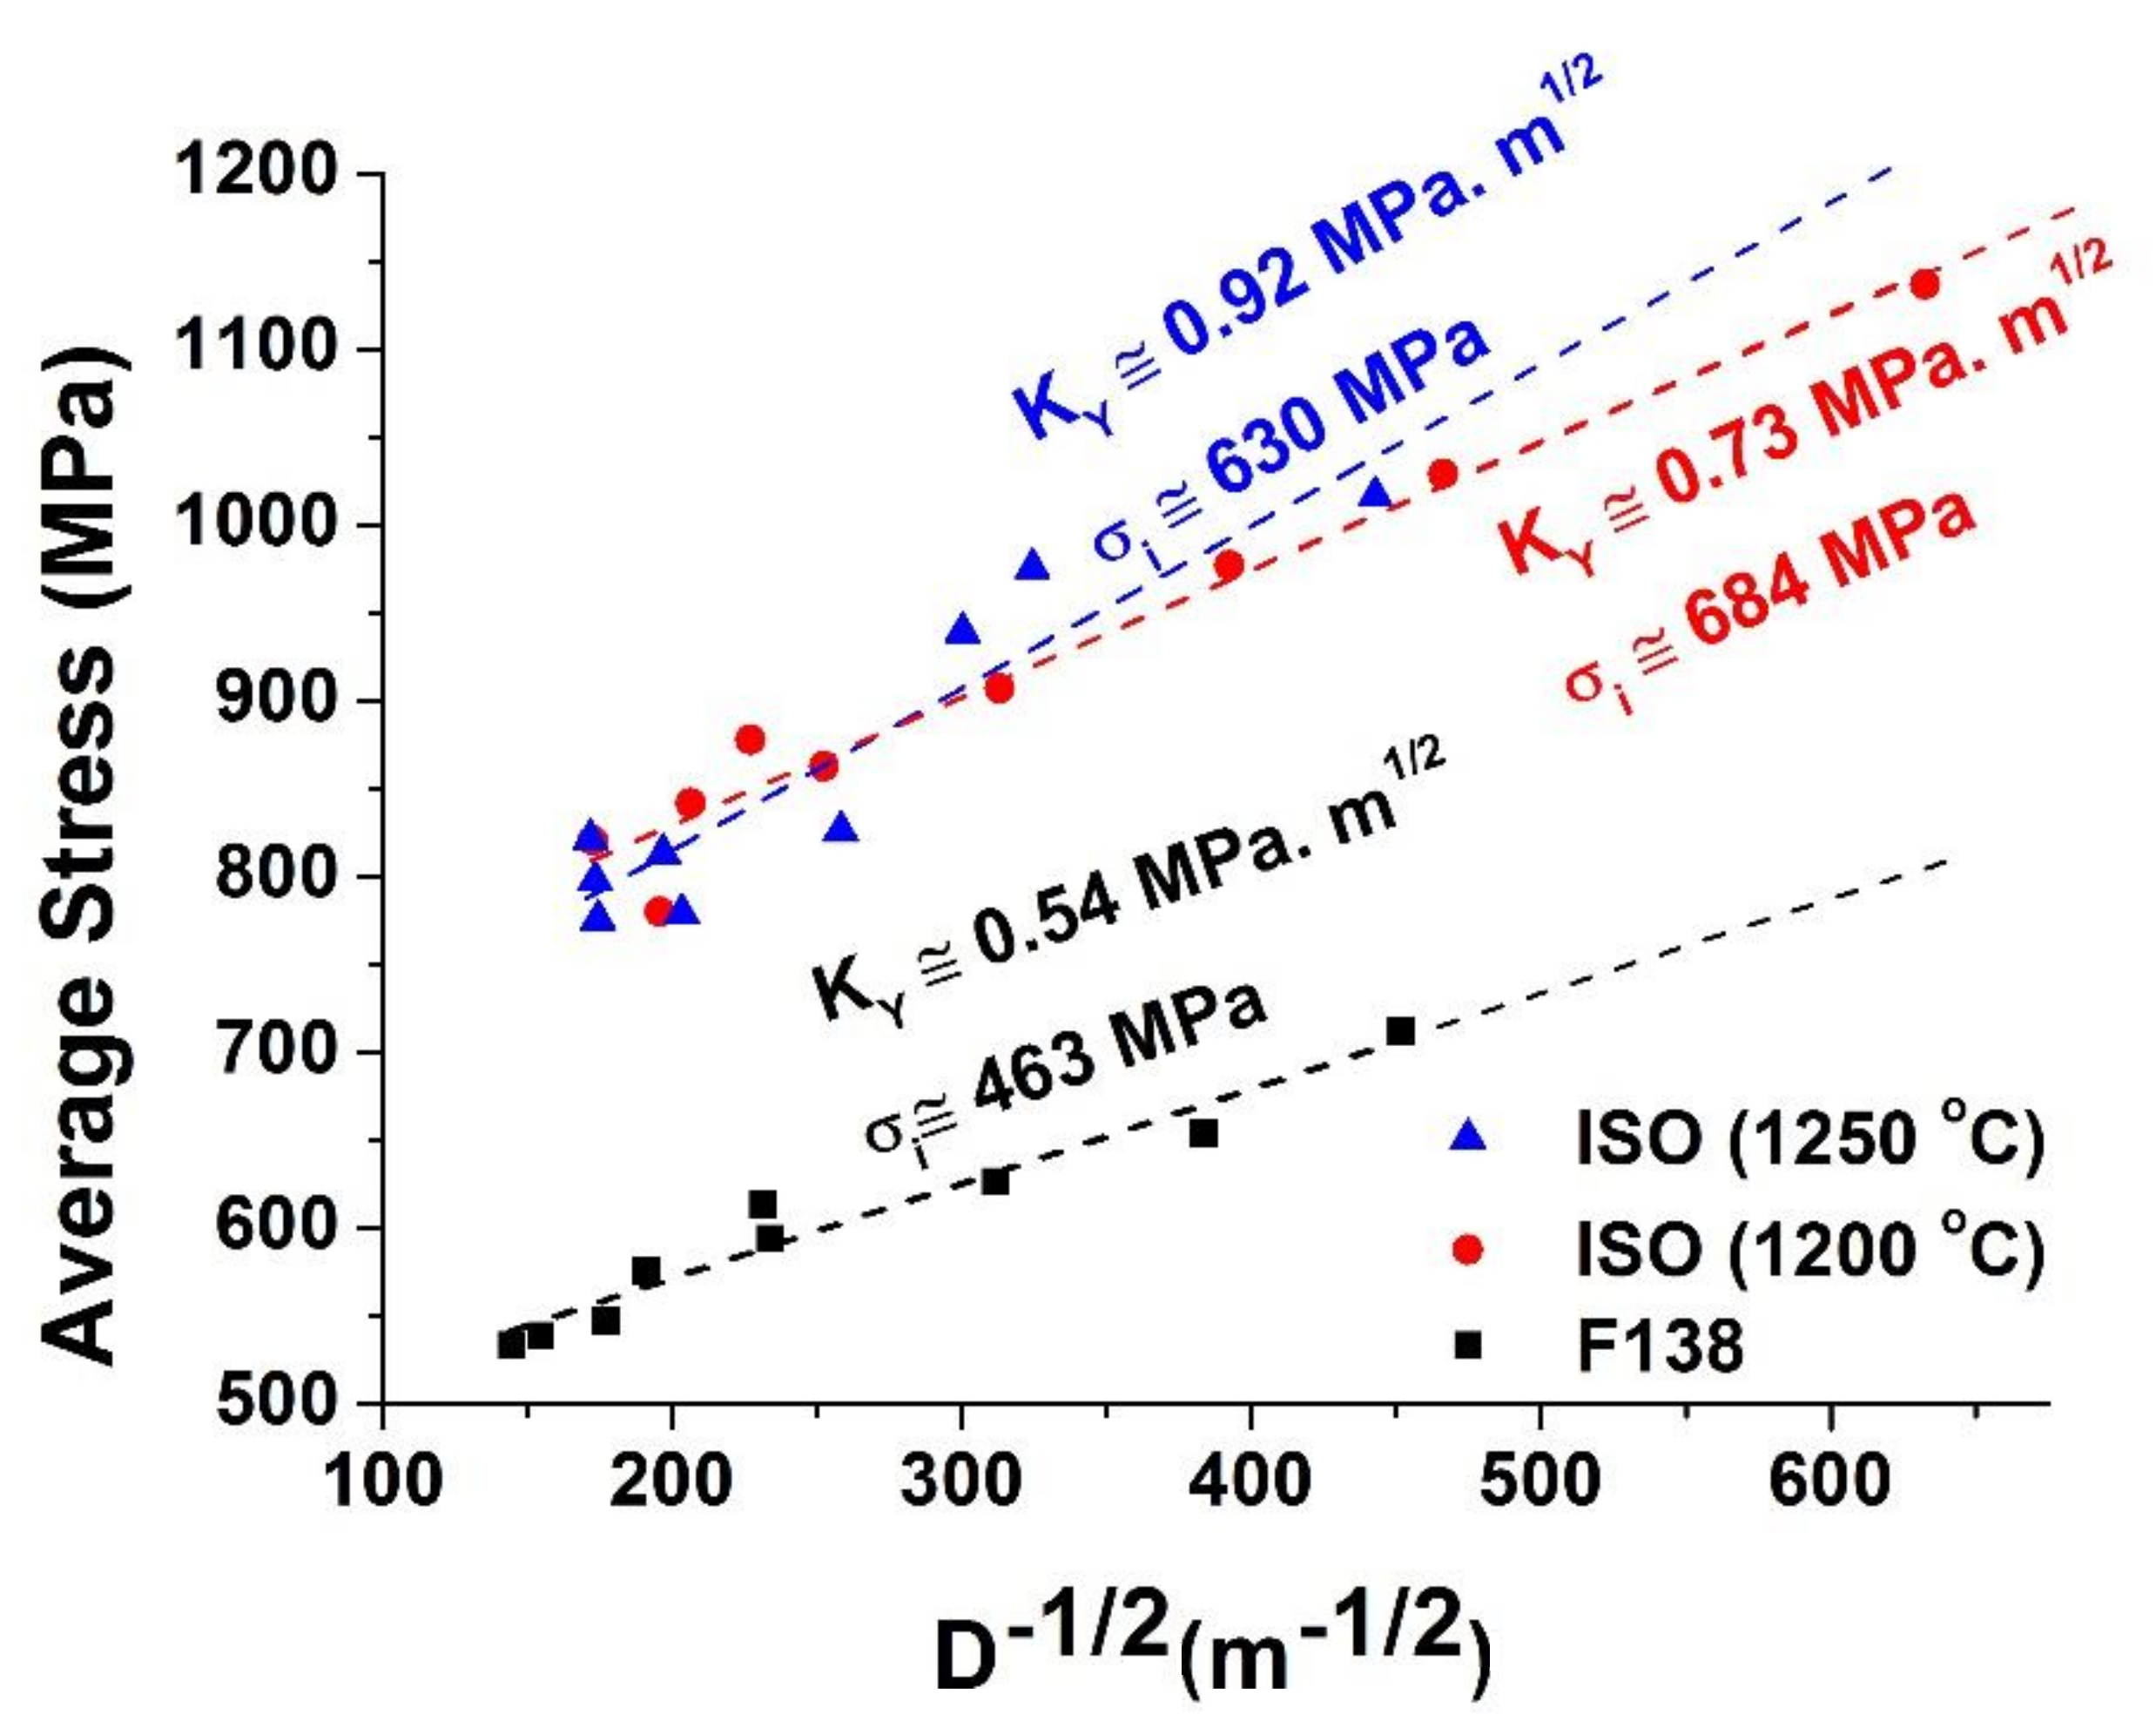
3.3. Mechanical Properties (Microhardness)

The evolution of Vickers microhardness as a function of the deformation schedules is displayed in Figure 11. The mechanical strength of both steels depends on the pass number and the interpass time. Thus, the higher the pass number and the lower the interpass time, the higher the microhardness. Nevertheless, the ISO steel shows evident higher strength (on average, 90 HV higher) than the F138 alloy. It is also noticeable that the ISO steel soaked at 1200 °C was always harder than the one soaked at 1250 °C.

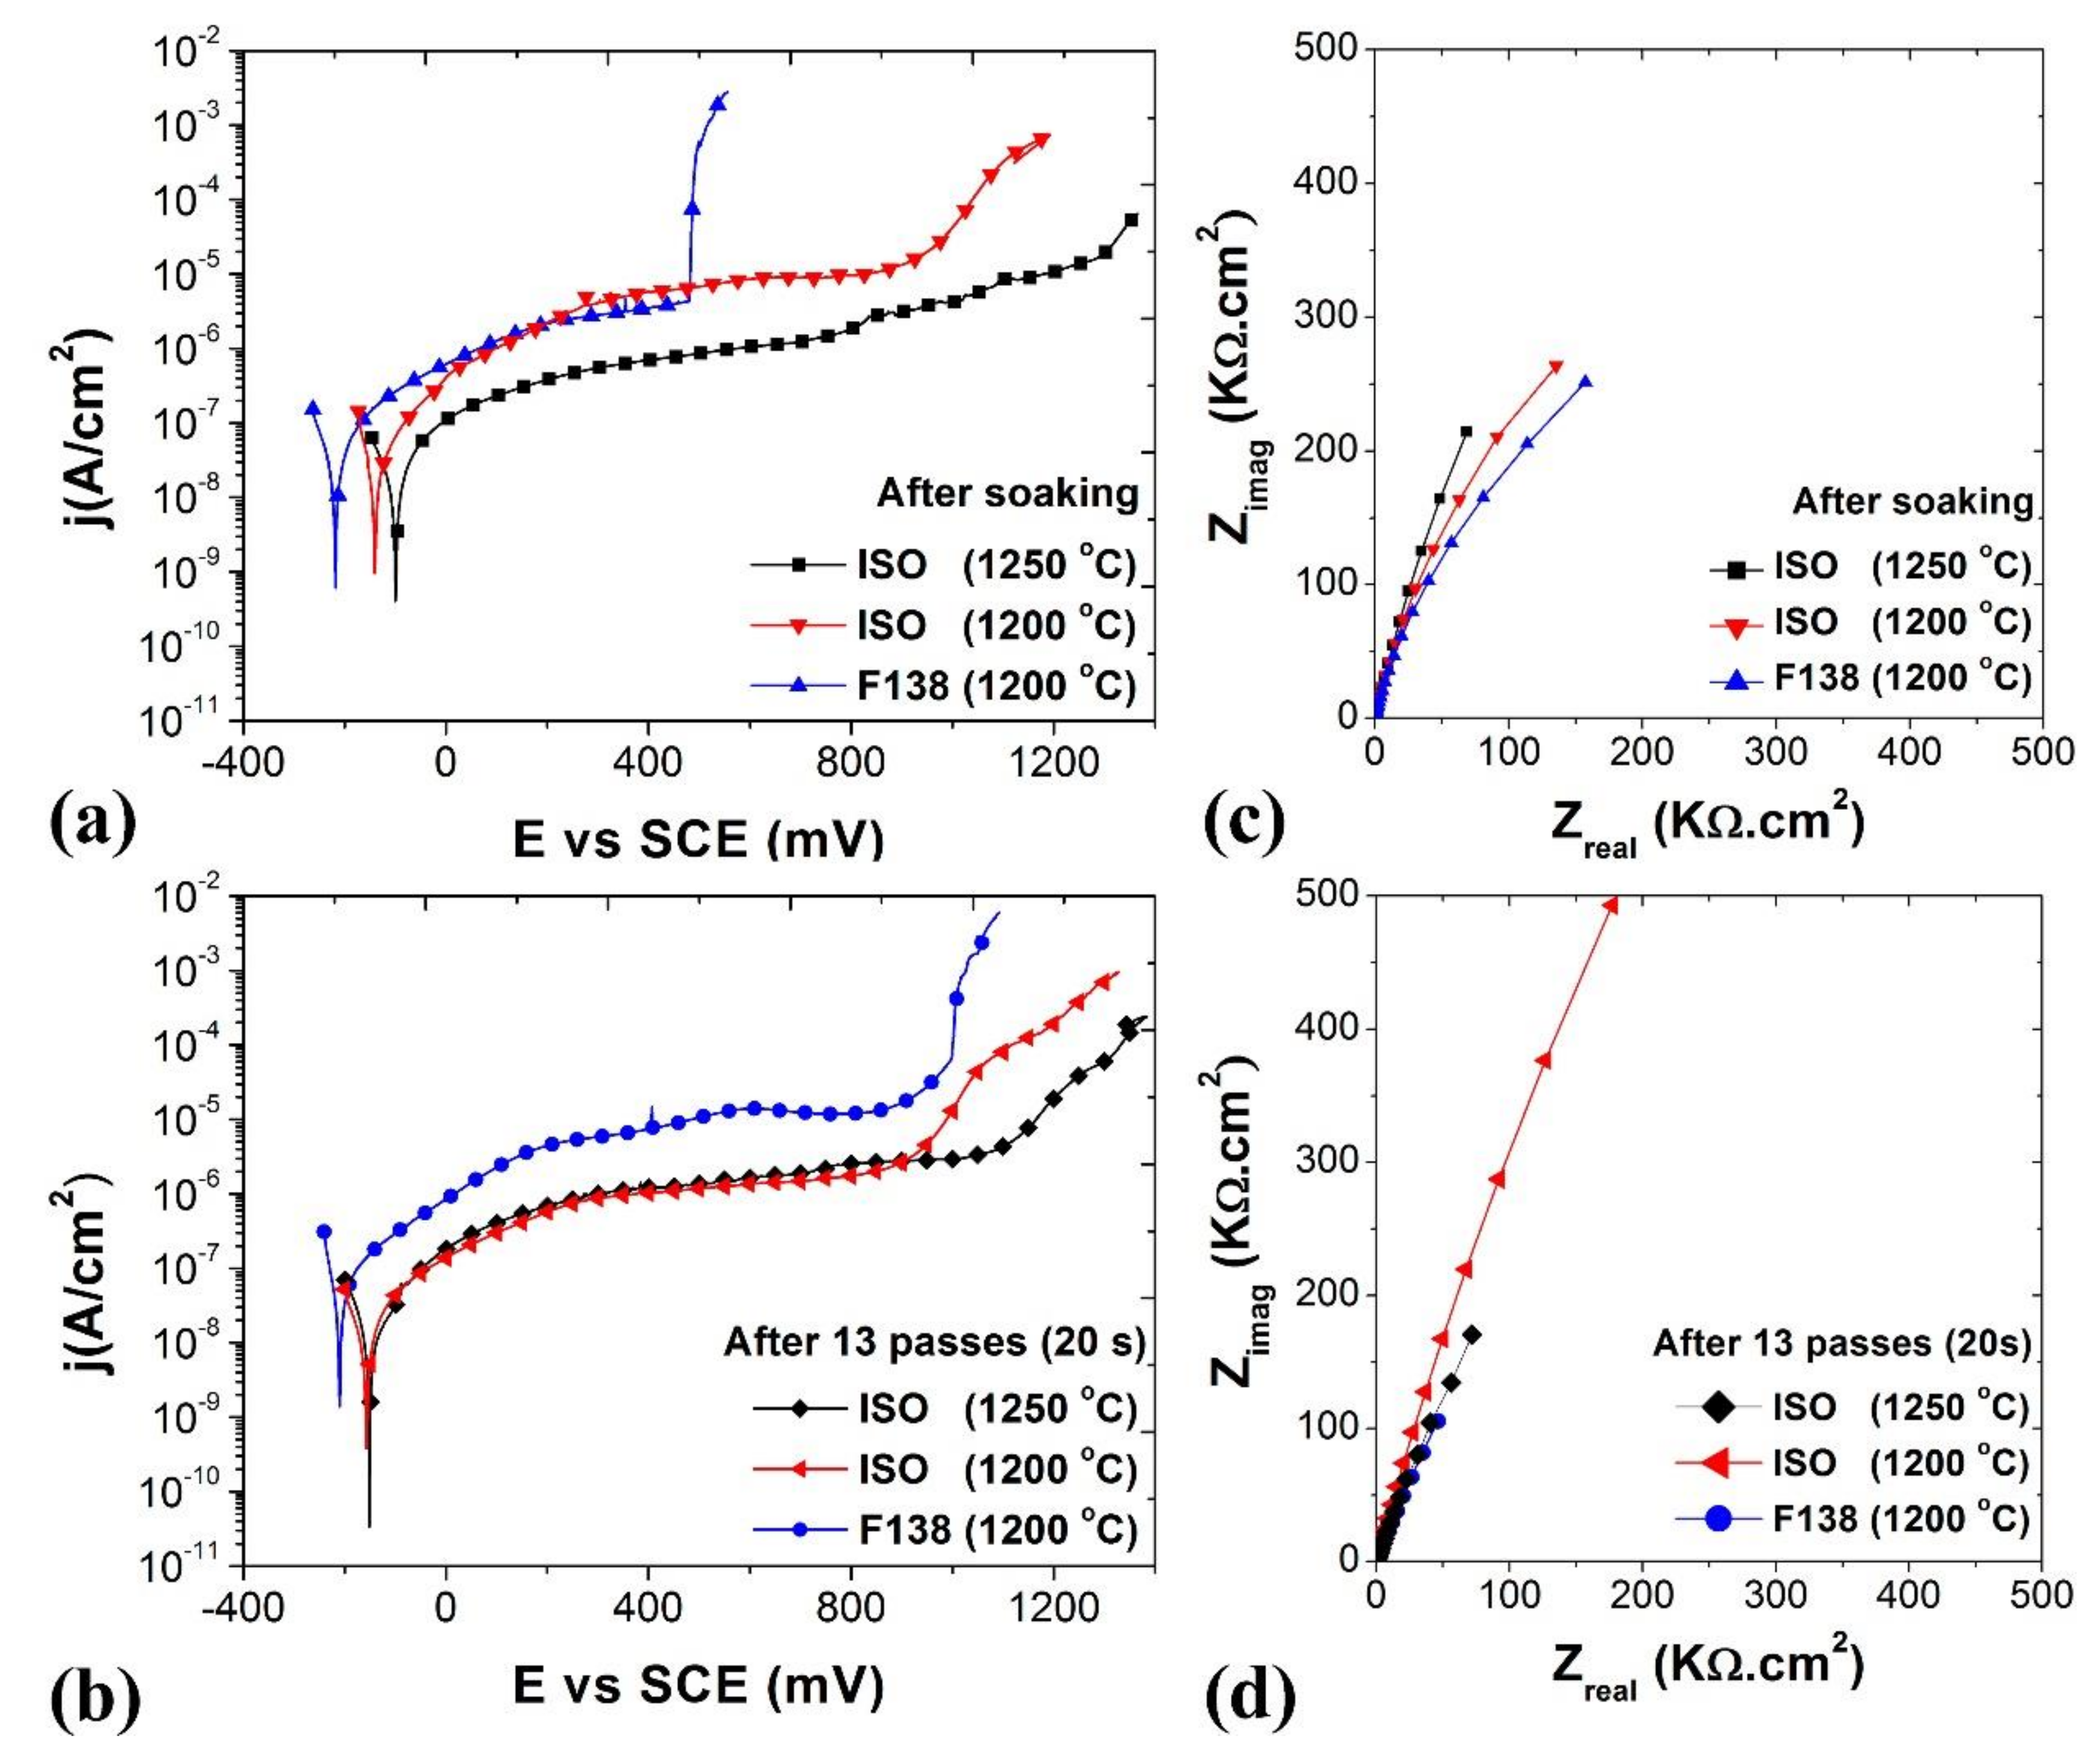
3.4. Corrosion Behavior

As commented above, it is undesirable that metallic implants can degrade within the human body. The present change in processing parameters led to a considerable decrease in grain sizes and excellent mechanical properties. However, because of such modification, the processing also led to the presence of particles, whose maximum dimension was about 0.8 µm after the last pass. Thinking about biomaterials, even with this reduced size, one cannot disregard the effect of such second-phase particles on the corrosion properties.
Figure 12 displays representative results of potentiodynamic polarization and Nyquist plots of electrochemical impedance spectroscopy (EIS) for the steels F138 and ISO soaked at 1200 °C and 1250 °C after the 13th pass, using an interpass time of 20 s. Table 2 summarizes the values of corrosion current density (Icorr), corrosion potential (Ecorr), and pitting potential (Epit) taken from polarization curves.
The results of potentiodynamic polarization for materials in the soaking condition (Figure 12a and Table 2) show that Ecorr for the ISO steel was always higher, and Icorr was always smaller than for the F138 steel. The electrochemical behavior presented by the F138 steel is characteristic of materials exhibiting an obvious critical pitting potential. Though not so well-defined and despite being at a higher potential than for the F138 steel, pitting initiation is also visible in the polarization curve of the ISO steel soaked at 1200 °C. However, when soaked at 1250 °C, the ISO steel does not present pitting corrosion. The rise in current density noticed over about 1300 mV is most probably due to the water decomposition, which occurs at approximately 1230 mV [25]. From these results, it is clear that the ISO steel, in any soaking condition, has a much higher pitting corrosion resistance and also better corrosion resistance than the F138 steel. Excluding pitting potentials, corrosion currents are very similar for both kinds of steels in any soaking condition. The differences in potentials are not so high to produce any significant difference in corrosion resistance. It is also noteworthy the difference in passive current density developed by the materials soaked at 1200 °C. Both F138 and ISO steels reheated at 1200 °C present current density in the passive region considerably higher than that of the ISO steel soaked at 1250 °C, meaning some instability of the passivation layer [26].
The facts mentioned above are confirmed by the results displayed in Nyquist plots of electrochemical impedance spectroscopy (EIS) in Figure 12b. One may see small differences in the behaviors of different materials soaked at different temperatures. Such differences show an increase in corrosion resistance, following the same sequence of Icorr and Ecorr described above, i.e., from the F138 steel to the ISO soaked at 1250 °C. This behavior is observable by the increase of the impedance modulus following the same sequence as above and with only a one-time constant, which is, indeed, related to the protective film formed rapidly on the electrode surface and the less stability for the F138 steel to the ISO steel soaked at 1250 °C. Such better corrosion properties of the ISO steel soaked at 1250 °C can be attributed to particles/precipitates dissolution. Such dissolution releases Cr and N in the matrix, thus, as stated elsewhere [14], avoiding sensitization and favoring the stability of the passive film, respectively. If one pays attention, the slightly better and somewhat worst corrosion behavior of the ISO steel reheated at 1200 °C compared to the F138 and ISO soaked at 1250 °C can be assigned to a little dissolution of coarse particles that delivered less Cr and N in the matrix than in the condition of soaking at 1250 °C.
Figure 12c presents potentiodynamic polarization curves for both materials deformed up to 13 passes. The polarization curve for the F138 after 13 passes is within the expected range, from where (see Table 2) one may observe that its corrosion current density is the same. Its corrosion potential increased comparing to the soaked condition. However, its pitting potential, the most critical parameter concerning metal passivation, was significantly increased (almost double). If one compares Figure 12a,b, the current at the passivation plateau (Iplat) was decreased by nearly one order of magnitude. Both Epit and Iplat indicate a significant improvement in corrosion behavior.
By comparing steels and soaking conditions, it is noteworthy that the ISO soaked at 1200 °C presented much better corrosion behavior than the F138 and ISO steel reheated at 1250 °C. The ISO steel soaked at 1200 °C exhibited an increased pitting potential, and its corrosion current density decreased by almost 16%.
On the contrary, the current density for the ISO steel reheated at 1250 °C increased by nearly 22% and pitting started to appear for such condition. For both cases, soaking at 1200 °C and 1250 °C, corrosion potentials were virtually the same and decreased compared to the soaked state. It is also noteworthy that passivation current plateaus of the ISO steels are the same and smaller than for the F138 alloy, whose passivation current was kept at the same level as after soaking. Such an improvement in the corrosion behavior presented by the ISO steel soaked at 1200 °C can also be verified in the Nyquist EIS plots in Figure 12d. These plots show significant differences in the behaviors of different materials soaked at different temperatures. Such differences are noticed by a substantial increase of the impedance modulus of the ISO steel soaked at 1200 °C, which was kept almost the same in the soaking condition of 1250 °C.

4. Discussion

4.1. Flow Stress Behavior

In general terms, as shown in Figure 2, the stress level increases with the progress of the deformation schedule. Such behavior can be partially associated with cooling during thermomechanical processing of the ISO steel and entirely due to the temperature decrease in the case of the F138 steel.
The dependence of the flow stress with the temperature was presented in Figure 2b,d,e. There is an evident linear growth of MFS in the whole range of temperatures for the F138 steel that can be solely associated with the temperature decrease. Contrarily, the ISO steel, when reheated to 1250 °C, softened in the first pass of the schedule and then hardened in the subsequent one. Such behavior has been discussed elsewhere [16] and was associated with interaction with Nb precipitates and will be briefly summarized here. Linear growth was observed in the ISO steel when reheated either to 1250 °C or 1200 °C, after the second pass in the first reheating condition and since the first pass for the later one. In this region, the stress increases due to a decrease in temperature. However, it appears that another strengthening mechanism is acting when soaking at 1200 °C because, in the range of the higher temperatures (before the inflection point indicated by TT in Figure 2d,f), the stress levels are about 20 MPa higher in the 1200 °C soaked condition compared to reheating at 1250 °C. Such behavior could be promptly related [16] to the matrix reinforcement by nondissolved particles, which in turn were observed to be broken and redistributed and partially dissolved during straining.
At lower temperatures (after the inflection point TT), either soaking at 1200 °C or 1250 °C along with the effect of decreasing in temperature, the evidence of another strengthening mechanism in the ISO steel is apparent. Such an indication can be observed through a slope change of the stress level rise (more evident in the ISO reheated at 1250 °C). This inflection point (TT) occurs around the sixth pass after reheating at 1200 °C and after the eighth pass when reheating at 1250 °C. Such behavior, which is more visible when the ISO steel is soaked at 1250 °C, was also discussed elsewhere [16].
The alteration of slopes in the MFS vs. 1/T diagrams can be related to a transition from a fully recrystallized region (higher temperatures before TT) to another of partial recrystallization (lower temperatures after TT). This behavior is almost equivalent to the nonrecrystallization temperature (Tnr) observed in microalloyed steels, with the difference that, in the ISO steel, the precipitation is not as able to entirely cease the recrystallization. Nonetheless, such precipitation in the ISO alloy soaked at 1250 °C can emphasize the inflection point because the solubilization at such a high temperature is more efficient than in lower temperatures, making the material more prone to a copious reprecipitation. In other words, Tnr defines the transition from complete recrystallization to nonrecrystallization. At the same time, TT establishes a change from complete recrystallization to partial recrystallization. Accordingly, it was decided here to use different terminology for each transformation.
In addition, by comparing all graphs in Figure 2, one can notice that the required stresses to deform the F138 steel are lower than for the ISO steel, either for the soaking condition at 1200 °C or 1250 °C. Such a difference can reach values up to about 70 MPa at the end of the sequence of passes. Moreover, Figure 2d indicates that, in general terms, stresses to deform the ISO steel decreases with the rise of the interpass time. Besides, Figure 2f shows that the soaking temperature strongly influences the evolution of the MFS at higher temperatures. Below the transition temperature (TT), the MFS values are nearly the same irrespective of the soaking temperature. However, at high temperatures, stress differences remain constant and equal to 20 MPa. Additionally, observing Figure 2a,c,e, it is worth noticing that the initial stress in each pass is lower than the stress level at the end of the previous pass. This behavior occurs for any steel at any soaking temperature, indicating that static recovery and recrystallization occur during interpass times and occurs in the whole set of deformation passes.

4.2. Microstructural Evolution

Microstructures after soaking (Figure 3) were taken as the reference ones and considered as the starting condition for the applied deformation pass schedules. Summarizing, after soaking, the average grain size for the steel F138 was ~90.7 µm and ~42.7 µm for the ISO, which exhibited undissolved second phase particles of about 3.4 μm, placed within the grains and into their boundaries. Both steels presented very homogeneous equiaxed grain microstructures. Initial microstructures for the ISO steel reheated at 1250 °C were presented in [16], which also exhibited many nondissolved coarse particles of different sizes, showing an average grain size of 61.8 μm, and, therefore, revealing another advantage in reducing the reheating temperature that avoided substantial grain growth.
Figure 4 and Figure 5 presented the microstructure evolution as a function of the pass number and interpass times in the F138 and ISO steels, respectively. In general, both steels showed a significant grain refinement with the decrease of interpass time and the increase in the number of passes. Regarding the F138 steel (Figure 4), after initial passes, grain sizes were slightly heterogeneous. Still, they rapidly became homogeneous with continued deformation up to the last pass. Bearing in mind that the initial grain size was ~91 µm (Figure 4b), one can readily notice that even after two passes, the grain size was considerably reduced. Such reduction followed the sequence of interpass times of 50 s, 20 s, and 5 s, being more significant for the last. After 13 passes, the average grain size was ~10.3 µm, ~6.8 µm, and ~4.9 µm, for interpass times of 50 s, 20 s, and 5 s, respectively.
Figure 5 indicates that the grain refinement was more intense in the ISO steel soaked at 1200 °C than in the F138 one. Grains reached relatively small sizes at the end of the 13th pass, being smaller than 8 µm whatever the interpass time considered. Microstructures were remarkably homogeneous. Large particles present after soaking were broken, dynamically dissolved during deformation, and randomly distributed along the sample volume during deformation passes. After 13 passes, with an interpass time of 5 s, the particles’ size was reduced from ~3.4 μm to ~0.8 μm.
By comparing the microstructural evolution of the steels, one may observe that grain sizes at the end of each pass are smaller for the ISO steel. For instance, with an interpass time of 5 s, the resultant grain size after the 13th pass for the ISO steel was ~2.5 µm, while, for the F138 steel, the grain size was ~4.9 µm. Obviously, besides the influence of the small amounts of fine precipitation (Figure 2) that can avoid grain growth, this behavior is also a consequence of a smaller initial grain size of the ISO steel when reheated at a lower temperature.
After EBSD analysis, one may observe in Figure 6a,c that microstructures are constituted by elongated grains surrounded by small new grains nucleated at boundaries of old grains, following the well-known necklace mechanism. This is a clear indication that both steels were reaching the critical strain for the onset of dynamic recrystallization [27]. Maps of the distribution of boundaries superimposed to their respective IQ images (Figure 6b,d) reveal that around 60 to 70% of boundaries correspond to high-angle ones, indicating partial recrystallization in both kinds of steels again. However, several high-angle boundaries present in the F138 steel are related to old grain boundaries. Meanwhile, considering the ISO steel, most of them are associated with new grains, thus confirming the above comments regarding the effectiveness of deformation to refine grains in this steel compared to the F138 one.
The indexation of boundaries presented in Figure 7c (F138 steel) and 6f (ISO steel) reveals that more than 90% of them are high-angle grain boundaries, meaning that both materials were practically recrystallized after deformation. Regardless of interpass times, both materials presented the same microstructural evolution with either two or six passes (Figure 6 and Figure 7, respectively). The average grain sizes were smaller at shorter interpass times. However, with similar deformation, grain sizes for the ISO steel were always smaller than for the F138 one in any conditions.
It is noteworthy from Figure 8 that, after 13 passes, grain sizes were much smaller than after the sixth pass. Average grain size of ~ 4.9 µm was obtained for the F138 steel and ~2.5 µm for the ISO steel. It is also worth mentioning that the particle size was reduced from ~7 μm (Figure 6) to ~0.8 μm. Some of them, pinning grain boundaries, are indicated by red arrows in Figure 8c. Maps of the nature of the boundaries (Figure 8b,d) suggest that, after 13 passes, samples continue recrystallizing and, importantly, refining the microstructure, indicating that they could be even more refined with further deformation.
By comparing the set of images presented in Figure 9, one observes that, when the thermomechanical processing starts at the lowest soaking temperature (Figure 9a), the resulting microstructure is more homogeneous than when reheating at the highest temperature (Figure 9c). Furthermore, some slightly elongated grains are observed in the sample soaked at 1250 °C. The analysis of boundaries shows that the fraction of high-angle boundaries for the specimen of the ISO steel soaked at 1200 °C was ~91% (Figure 9b), meaning almost full recrystallization. This value is markedly higher than the one (~72%) found when the ISO steel was soaked at 1250 °C (Figure 9d), indicating that recrystallization was retarded in this case. It is essential to mention that, although this difference in the microstructural homogeneity was observed after the 13th pass, up to six passes, despite different degrees of refinement, microstructures were homogenous for both reheating temperatures and for all interpass times.
TEM observations (Figure 10) confirm the partial recrystallization after the 13th pass already noticed in the ISO steel soaked at 1250 °C. Indeed, strain-induced precipitation occurring during the last passes of this schedule, as indicated in Figure 2, is another critical factor for retarding recrystallization. Under this context, one can infer that the reheating temperature is also critical in the interaction between recrystallization and precipitation. Such effects are less pronounced in the ISO steel soaked at 1200 °C than when soaked at 1250 °C because the large particles of TiNbN are not fully dissolved, thus reducing the impact of solute in the alloy. Consequently, the smaller dissolution leads the steel to lower reprecipitation, favoring recrystallization in all the passes and increasing the grain refinement and microstructural homogeneity in this condition.
Figure 13 displays the evolution of grain size during the physical simulated thermomechanical processing. In all studied conditions, the development of pass schedules reduced grain sizes, which decreased gradually. However, the ISO steel reheated at 1250 °C tended to show less reduction than the other samples soaked at 1200 °C. For instance, depending on the interpass time, an initial microstructure with a grain size of ~91 µm for the F138 steel was refined to 5–10 µm. For the ISO steel reheated at 1200 °C, the refinement was from 42.7 µm to 2.5–6.5 µm, while for the ISO steel soaked at 1250 °C, the grain size was reduced from 62 µm to 5–11 µm.
The above behavior brings several corroborations with other results discussed above. It is again clear that, by reducing the reheating temperature, the initial grain size will be diminished. The total refinement is obviously a consequence of the initial grain size. However, it is also clear that the higher the solubilization temperature, the larger the recrystallization delay. This behavior can be confirmed by comparing the ISO steel soaked at 1250 °C and the F138 steel. The ISO steel started with a grain size of 62 µm and the F138 alloy of 91 µm.
Nevertheless, the final grain size was almost the same for both conditions. In other words, the F138 steel recrystallized in all deformation passes, while in the ISO soaked at 1250 °C, recrystallization was delayed. Now, comparing the F138 and ISO steels reheated at 1200 °C, one must bear in mind that particles are not totally dissolved at this temperature. Consequently, the influence of the solid solution is reduced in this condition. Therefore, as observed above, there will be smaller reprecipitation, which induces the material to copious recrystallization in all the passes, resulting in considerable grain refinement and microstructural homogeneity.

4.3. Mechanical Properties

Figure 11 displayed the evolution of Vickers microhardness as a function of the deformation schedules. The mechanical strength of both steels showed to be dependent on both pass number and interpass time. Bearing in mind that the F138 steel is free of Nb, V, and Ti, and is N-poor, no second phases are expected. Hence, its hardness is only dependent on the grain size and amount of solid solution elements.
On the other hand, when soaked at 1200 °C, even with partial dissolution, the TiNbN particles are already present in the ISO steel [16] after soaking at 1200 °C (Figure 3d). During processing, such particles will break, redistribute (Figure 5, Figure 6c,d, Figure 7e,f, Figure 8c,d), and precipitate sparingly. When soaked at 1250 °C, those particles are almost entirely dissolved (some large particles are still present). They also break, redistribute, and, as for reheating at 1200 °C, will promote copious precipitation during processing. However, the large particles are here assumed to be not effective in controlling recrystallization or grain growth.
Nevertheless, they can produce stress fields around them, thus increasing the stress during processing or also hardness values. Thereby, hardness will be dependent on grain size, reinforcement particles, and even on small precipitates because of the increased number of boundaries in addition to the grain ones. As it is well known, grain and phase boundaries serve as dislocation sources and barriers to dislocation motion, thus playing an essential role in the deformation behavior of polycrystals. Consequently, the mechanical properties of polycrystalline materials are greatly influenced by the volume fraction of boundaries. Such a fraction rises with the reduction in grain size, fine precipitation, and even the presence of sizeable second-phase particles, followed by an increase in the flow stress at low temperatures.
Hall [28] proposed that the hardness dependence on grain size might follow the Hall–Petch relation directly [29,30]. Thus the hardness–grain-size relation could be described by:
H = H 0 + K H D
where H and KH are materials dependent constants.
However, physical meanings for the constants of Equation (1) are still not well defined. The latter equation can be translated to grain sizes, as shown in Equation (2):
σ Y = σ i + K Y D
where σ Y is the yield stress, D is the average grain size, σ i is the friction stress, representing the overall resistance of the crystal lattice to dislocation movement, and K Y is the Petch parameter, also known as unpinning constant or “locking parameter”, which measures the relative hardening contribution of the grain boundaries.
If one assumes that the average strength of the steel is about 3.295 times the HV [31], measured values of hardness can be readily transformed in stress (in MPa). In this way, the Hall–Petch plot corresponding to the present experimental results is presented in Figure 14. The values of σ i and K Y for each alloy in different reheating temperatures are annotated in the figure.
Different K Y values for iron and single-phase iron alloys have been reported in the literature. For instance, Anderson et al. [32] found a value of 0.55 MPa m1/2 for ARMCO iron, while, for low-carbon steels, Morrison et al. [33] observed a K Y of 0.6 MPa m1/2. For an AISI 316L steel with grain sizes in the same range of the present work, Kashyap and Tangri [34] determined a value of 0.547 MPa m1/2. This value agrees very well with the one found in this work for the F138 steel. Variations in this constant for the same alloys are usually attributed to the purity of the steel grade [35].
However, as observed in Figure 14, the values of K Y are sensibly different for the ISO steel, which possesses different values for different reheating temperatures. As stated above, K Y expresses the efficiency of grain boundaries to strengthen polycrystalline materials. In this way, it becomes clear from K Y values that boundaries in the ISO steel are much more effective in such a strengthening than in the F138 one. Also, boundaries are more efficient in the ISO steel soaked at 1250 °C than when reheated at 1200 °C. Considering that most of the values of D−1/2 are similar (similar grain sizes), one can promptly say that, in the case of the ISO steel, other boundaries are contributing to K Y , which were not accounted for the measured grain sizes. In other words, boundaries between moderately large second-phase particles and also fine precipitates and the matrix are having a considerable contribution to the grain boundary strengthening expressed by K Y . If one compares reheating conditions for the ISO steel, it is reasonable to say that the massive fine precipitation after soaking at 1250 °C reinforced grain boundaries more than after reheating at 1200 °C, where fine precipitation was minimal.
Considering now the influence of σ i in the Hall–Petch relation, which represents the strength of the grain interior, one may observe that there is a vast difference in such strength when comparing the F138 and ISO steels, and that σ i values for the ISO steel are very similar. Naturally, one can infer that second-phase particles (large or fine) located within grains are also influencing the strength of the grain interior because of induced stress fields around particles during deformation. For a more in-depth analysis, the product K Y D−1/2 for grain sizes of respective materials and reheating conditions in the Hall–Petch plot (Figure 13) can be compared with the corresponding values of σ i . Such a comparison clearly shows that, for any material and any condition, σ Y is dominated by the lattice friction ( σ i ) instead of grain boundary resistance. Precisely, for the F138 steel, the value of σ i is 463 MPa whereas K Y D−1/2 varies from ~243 to ~78 MPa (corresponding to D = 4.9 to 47.8 μm) constituting, on average, only ~29% of the applied stress, which ranges over ~712 to ~533 MPa. In the case of the ISO steel soaked at 1200 °C, σ i is 684 MPa, while K Y D−1/2 changes from 462 to 126 MPa (D = 2.5 to 33.6 μm), contributing on average in only ~34% to σ Y , which ranges from 1137 to 820 MPa. When the ISO steel was reheated to 1250 °C, σ i changed to ~630 MPa, and K Y D−1/2 varied from ~407 to ~158 MPa (D = 5.1 to 33.9 μm), whose average contribution to σ Y is of only ~37%. In this latter case, σ Y extends from ~1017 to ~822 MPa.
Microhardness measurements conducted in this work were performed with a load of 500 g, resulting in diagonal indentations with sizes between 50 and 60 µm. To confirm the influence of individual larger particles and fine precipitation on stress fields produced by them and consequently on the strengthening of the grain interior and grain boundaries, measurements using a load of 25 g were performed in specific regions. Figure 15a,b (Figure 15b shows indentation marks) represent measurements that have been made using such low load in the ISO steel soaked at 1250 °C, after two passes, with an interpass time of 50 s, and quenched immediately after deformation. The average of several measurements for large particles + matrix (1) was 346 ± 22 HV, in grain boundaries 271 ± 11 HV (2) and 293 ± 15 HV inside grains with the presence of small particles (3). If one considers that the matrix hardness is about 242 HV, these data indicate that the stress field around large particles increases the hardness of the matrix by about 30%.
These measurements also confirm the different values of σ i between both steels. Considering that the hardness of the F138 steel for the same condition is about ~164 HV, the increase in hardness due to large particles (346 HV) present in the ISO steel is about 47% larger than that. By applying this relationship to the σ i value for the F138 steel (1.47 × 463 MPa), one will obtain the value of ~682 MPa. This number is very similar to the value of σ i for the ISO steel soaked at 1200 °C, which is more abundant in larger particles than when it is reheated to 1250 °C. Additionally, it also is possible to confirm that boundaries are really less resistant (271 HV) than the grain interior (293 HV).

4.4. Corrosion Behavior

The corrosion behavior (Figure 12 and Table 2) of the ISO steel after 13 deformation passes is fascinating. If one goes back to previous sections, it will be possible to verify that, after soaking at 1250 °C, the ISO steel was almost wholly solubilized. Thus, N and Cr were delivered to the matrix and kept in solid solution until the transition temperature (TT; inflection point in Figure 2). In this way, the steel was very well protected and acquired excellent corrosion properties. However, copious precipitation occurs after reaching TT, hence consuming a considerable amount of Cr and N in solid solution, leading to worse corrosion properties after 13 passes.
On the contrary, by soaking the ISO steel at 1200 °C, coarse particles were little dissolved, causing its corrosion behavior to be not so good. However, after deformation passes, such particles were broken, redistributed, and dynamically dissolved during thermomechanical processing. Therefore, after 13 passes, N and Cr were replaced, thus leading to improved corrosion properties.

5. Conclusions

Physical simulation of the industrial thermomechanical processing of the steels ISO 5832-9 and ASTM F138 was performed by hot torsion tests. Particular consideration was given to the influence of interpass times and reheating temperatures. The usual soaking temperature for processing the ISO steel is 1250 °C. However, it was reduced to 1200 °C in an effort to minimize processing times, thus reducing processing costs, which may lead to reduced prices of bone implants. From the results and discussion, the following conclusions can be drawn:
  • The reduction of reheating temperature to 1200 °C led the steel ISO 5832-9 to have better mechanical and corrosion properties than when soaked at 1250 °C.
  • Processing loads were not significantly increased with the reduction of the reheating temperature. This fact indicates that existing processing equipment can continue to be used.
  • The decrease of interpass times and reduction of reheating temperature shorten the processing time, causing production costs to be reduced, which would help to reduce the price of prosthesis’ implantation greatly.

Author Contributions

Conceptualization, J.-M.C., O.B. and A.M.J.J.; methodology, M.-B.R.S.; data curation, M.-B.R.S., V.R., T.M.B. and N.H.V.; investigation, M.-B.R.S., V.R., T.M.B. and N.H.V.; writing—original draft preparation, A.M.J.J.; writing—review and editing, J.-M.C., V.R., T.M.B., N.H.V., O.B. and A.M.J.J.; supervision, J.-M.C. and A.M.J.J.; funding acquisition, J.-M.C. and A.M.J.J. All authors have read and agreed to the published version of the manuscript.

Funding

The authors are grateful to CAPES (Coordenação de Aperfeiçoamento de Pessoal de Nível Superior) and Ministerio de Educacion (Spain) for funding bilateral cooperation, under the cooperation project CAPES#179/09 and to FAPESP (Fundação de Amparo à Pesquisa do Estado de São Paulo) under the grant #2009/10919-6.

Acknowledgments

The authors thank Villares Metals, São Paulo-Brazil, the suppliers of the steels. The authors also thank the Laboratory of Structural Characterization (LCE/DEMa/UFSCar/Brazil) for the use of its facilities. MBRS would like to acknowledge the CNPq (Brazil) under grant # 506440/2013-3. JMC also acknowledges the support received from CONACyT (Mexico) to finance his sabbatical in UMSNH partially.

Conflicts of Interest

The authors declare no conflict of interest.

References

  1. Gong, P.; Palmiere, E.J.; Rainforth, W.M. Dissolution and precipitation behaviour in steels microalloyed with niobium during thermomechanical processing. Acta Mater. 2015, 97, 392–403. [Google Scholar] [CrossRef]
  2. Lu, J.; Omotoso, O.; Wiskel, J.B.; Ivey, D.G.; Henein, H. Strengthening mechanisms and their relative contributions to the yield strength of microalloyed Steels. Metall. Mater. Trans. A 2012, 43, 3043–3061. [Google Scholar] [CrossRef]
  3. Taca, M.; Constantinescu, D.M.; Baciu, F.; Geanta, V.; Daisa, D.; Stefanoiu, R. Influence of technological parameters on the toughness improvement of microalloyed steels. Mater. Today Proc. 2016, 3, 1177–1182. [Google Scholar] [CrossRef]
  4. Yuan, S.Q.; Liang, G.L.; Zhang, X.J. Interaction between elements Nb and Mo during precipitation in microalloyed austenite. J. Iron Steel Res. 2010, 17, 60–63. [Google Scholar] [CrossRef]
  5. Elwazri, A.M.; Yue, S.; Wanjara, P. Effect of prior-austenite grain size and transformation temperature on nodule size of microalloyed hypereutectoid steels. Metall. Mater. Trans. A 2005, 36, 2297–2305. [Google Scholar] [CrossRef]
  6. Phaniraj, M.P.; Behera, B.B.; Lahiri, A.K. Thermo-mechanical modeling of two phase rolling and microstructure evolution in the hot strip mill: Part I. Prediction of rolling loads and finish rolling temperature. J. Mater. Process. Technol. 2005, 170, 323–335. [Google Scholar] [CrossRef]
  7. Craven, A.J.; He, K.; Garvie, L.A.J.; Baker, T.N. Complex heterogeneous precipitation in titanium–niobium microalloyed Al-killed HSLA steels-I. (Ti,Nb)(C, N) particles. Acta Mater. 2000, 48, 3857–3868. [Google Scholar] [CrossRef]
  8. Show, B.K.; Veerababu, R.; Balamuralikrishnan, R.; Malakondaiah, G. Effect of vanadium and titanium modification on the microstructure and mechanical properties of a microalloyed HSLA steel. Mater. Sci. Eng. A 2010, 527, 1595–1604. [Google Scholar] [CrossRef]
  9. Karmakar, A.; Biswas, S.; Mukherjee, S.; Chakrabarti, D.; Kumar, V. Effect of composition and thermo-mechanical processing schedule on the microstructure, precipitation and strengthening of Nb-microalloyed steel. Mater. Sci. Eng. A 2017, 690, 158–169. [Google Scholar] [CrossRef]
  10. Souza, R.C.; Silva, E.S.; Jorge, A.M., Jr.; Cabrera, J.M.; Balancin, O. Dynamic recovery and dynamic recrystallization competition on a Nb- and N-bearing austenitic stainless steel biomaterial: Influence of strain rate and temperature. Mater. Sci. Eng. A 2013, 582, 96–107. [Google Scholar] [CrossRef]
  11. Mandal, G.K.; Stanford, N.; Hodgson, P.; Beynon, J.H. Static recrystallisation study of as-cast austenitic stainless steel. Mater. Sci. Eng. A 2013, 576, 118–125. [Google Scholar] [CrossRef]
  12. Silva, E.S.; Sousa, R.C.; Jorge, A.M.; Balancin, O. Hot deformation behavior of an Nb- and N-bearing austenitic stainless steel biomaterial. Mater. Sci. Eng. A 2012, 543, 69–75. [Google Scholar] [CrossRef]
  13. Okazaki, Y. Effects of solution treatment and cold rolling on microstructure and mechanical properties of stainless steel for surgical implants. Mater. Trans. 2008, 49, 1423–1427. [Google Scholar] [CrossRef]
  14. Giordano, E.J.; Guimarães, V.A.; Pinto, T.B.; Ferreira, I. Effect of precipitates on the corrosion–fatigue crack initiation of ISO 5832-9 stainless steel biomaterial. Int. J. Fatigue 2004, 26, 1129–1136. [Google Scholar] [CrossRef]
  15. Giordano, E.J.; Alonso-Falleiros, N.; Ferreira, I.; Balancin, O. Electrochemical behavior of two austenitic stainless steel biomaterials. REM: R. Esc. Minas Ouro Preto 2010, 63, 159–166. [Google Scholar] [CrossRef] [Green Version]
  16. Silva, M.B.R.; Gallego, J.; Cabrera, J.M.; Balancin, O.; Jorge, A.M. Interaction between recrystallization and strain-induced precipitation in a high Nb- and N-bearing austenitic stainless steel: Influence of the interpass time. Mater. Sci. Eng. A 2015, 637, 189–200. [Google Scholar] [CrossRef] [Green Version]
  17. Silva, M.B.R.; Gallego, J.; Cabrera, J.M.; Balancin, O.; Jorge, A.M. Thermomechanical controlled processing to achieve very fine grains in the ISO 5832-9 austenitic stainless steel biomaterial. Mater. Charact. 2017, 127, 153–160. [Google Scholar] [CrossRef] [Green Version]
  18. Giordano, E.J.; Jorge, A.M., Jr.; Balancin, O. Evidence of strain induced precipitation on a Nb- and N-bearing austenitic stainless steel biomaterial. Mater. Sci. Forum 2005, 500, 179–186. [Google Scholar] [CrossRef]
  19. Cuddy, L.J.; Raley, J.C. Austenite grain coarsening in microalloyed steels. Met. Trans. A 1983, 14, 1989–1995. [Google Scholar] [CrossRef]
  20. Altuna, M.A.; Iza-Mendia, A.; Gutiérrez, I. Precipitation of Nb in ferrite after austenite conditioning. Part II: Strengthening contribution in high-strength low-alloy (HSLA) steels. Met. Mater. Trans. A 2012, 43, 4571–4586. [Google Scholar] [CrossRef] [Green Version]
  21. Gorni, A.A.; Mei, P.R. Development of alternative as-rolled alloys to replace quenched and tempered steels with tensile strength in the range of 600–800 MPa. J. Mater. Proc. Tech. 2005, 162, 298–303. [Google Scholar] [CrossRef]
  22. Jansto, S.G. MicroNiobium alloy approach in medium and high carbon steel bar, plate and sheet products. Metall. Mater. Trans. B 2014, 45, 438–444. [Google Scholar] [CrossRef]
  23. Kokubo, T.; Takadama, H. How useful is SBF in predicting in vivo bone bioactivity? Biomaterials 2006, 27, 2907–2915. [Google Scholar] [CrossRef] [PubMed]
  24. Boratto, F.; Barbosa, R.; Yue, S.; Jonas, J.J. Effect of chemical composition on the critical temperatures of microalloyed steels. In Proceedings of the International Conference on Physical Metallurgy of Thermomechanical Processing of Steels and Other Metals (Thermec-88), ISIJ, Tokyo, Japan, 6–10 June 1988; pp. 383–390. [Google Scholar]
  25. Bandy, R.; Cahoon, J.R. Effect of composition on the electrochemical behaviour of austenitic stainless steel in Ringer’s solution. Corrosion 1977, 33, 204–208. [Google Scholar] [CrossRef]
  26. Levey, P.R.; Van Bennekom, A.A. A mechanistic study of the effects of nitrogen on the corrosion properties on stainless steels. Corrosion 1995, 51, 911–921. [Google Scholar] [CrossRef]
  27. Varela-Castro, G.; Cabrera, J.M.; Prado, J.M. Critical strain for dynamic recrystallization. The particular case of steels. Metals 2020, 10, 135. [Google Scholar] [CrossRef] [Green Version]
  28. Hall, E.O. Variation of hardness of metals with grain size. Nature 1954, 173, 948–949. [Google Scholar] [CrossRef]
  29. Hall, E.O. The deformation and ageing of mild steel: III Discussion of results. Proc. Phys. Soc. B 1951, 64, 747–753. [Google Scholar] [CrossRef]
  30. Petch, N.J. The cleavage strength of polycrystals. J. Iron Steel Inst. 1953, 174, 25–28. [Google Scholar] [CrossRef] [Green Version]
  31. Pavlina, E.; Van Tyne, C. Correlation of yield strength and tensile strength with hardness for steels. J. Mater. Eng. Perform. 2008, 17, 888–893. [Google Scholar] [CrossRef]
  32. Anderson, E.; King, D.W.W.; Spreadborough, J. The relationship between lower yield stress and grain size in Armco iron. Trans. TMS-AIME 1968, 242, 115–119. [Google Scholar]
  33. Morrison, W.B. The effect of grain size on the stress-strain relationship in low-carbon steel. Trans. Am. Soc. Met. 1966, 59, 824–846. [Google Scholar]
  34. Kashyap, B.P.; Tangri, K. On the Hall-Petch relationship in type 316L stainless steel at room temperature. Scr. Metall. Mater. 1990, 24, 1777–1782. [Google Scholar] [CrossRef]
  35. Takeda, K.; Nakada, N.; Tsuchiyama, T.; Takaki, S. Effect of interstitial elements on Hall–Petch coefficient of ferritic iron. ISIJ Int. 2008, 48, 1122–1125. [Google Scholar] [CrossRef] [Green Version]
Figure 1. Sketch of the thermomechanical schedule: heating rate (HR): 2.0 °C s−1, soaking temperature (ST): 1200 or 1250 °C, soaking time (st): 300 s, interpass time (it): 50, 20, or 5 s, and cooling rate (CR): 24, 60, and 240 °C min−1. The cooling rate was selected to ensure that the deformation temperature was the same at each interpass time.
Metals 10 01311 g001
Figure 2. (a,c,e) Flow stress curves for 13 passes. (a) F138 and (c) ISO steels with interpass times tip of 50, 20, and 5 s. (e) Comparison between flow stress curves for schedules with 13 passes with different reheating temperatures and an interpass time of 5 s. (b,d,f) Dependence of the mean flow stress (MFS) with the inverse of absolute temperature (1/T). (b) F138; (d) ISO with a tip of 50, 20, and 5 s. (f) Comparison between MFS curves with different reheating temperatures and an interpass time of 5 s.
Metals 10 01311 g002
Figure 3. Optical micrographs from: (a) F138 as-received; (b) F138 after reheating at 1200 °C; (c) ISO as-received and (d) ISO after reheating at 1200 °C. Black spots in (c) and (d) correspond to large second phase particles [16].
Metals 10 01311 g003
Figure 4. (a) 2 passes—50 s, (b) 6 passes—50 s, (c) 13 passes—50 s, (d) 2 passes—20 s, (e) 6 passes—20 s, (f) 13 passes—20 s, (g) 2 passes—5 s, (h) 6 passes—5 s, (i) 13 passes—5 s. Optical micrographs of F138 steel reheated at 1200 °C, after the second, sixth, and thirteenth pass with interpass times of 50, 20, and 5 s. Samples were water quenched after waiting for the interpass time to elapse following deformation interruption.
Metals 10 01311 g004
Figure 5. (a) 2 passes—50 s, (b) 6 passes—50 s, (c) 13 passes—50 s, (d) 2 passes—20 s, (e) 6 passes—20 s, (f) 13 passes—20 s, (g) 2 passes—5 s, (h) 6 passes—5 s, (i) 13 passes—5 s. Optical micrographs of ISO steel soaked at 1200 °C, after the second, sixth, and thirteenth pass with interpass times of 50, 20, and 5 s. Samples were water quenched after waiting for the interpass time to elapse following deformation interruption.
Metals 10 01311 g005
Figure 6. Electron backscatter diffraction (EBSD) for samples quenched after the second pass with interpass time of 20 s: (a,b) for F138 steel; (c,d) for ISO steel (soaked at 1200 °C). Image quality map: (a,c). Maps of the distribution of boundaries superimposed to respective image quality (IQ) images showing high-angle (misorientations θ > 15°, blue lines) and low-angle (subgrains, 2° < θ < 15°, red lines) grain boundaries: (b,d). Samples were water quenched immediately after the second pass deformation.
Metals 10 01311 g006
Figure 7. EBSD attained from samples reheated at 1200 °C after the sixth pass and interpass time of 20 s, and water quenched after waiting for the interpass time to elapse following deformation interruption: (ac) for F138 steel and (df) ISO steel, after reheating at 1200 °C. Orientation imaging maps (color orientation indexation is shown in the inverse of pole figures (IPF) presented in respective insets): (a,d). IQ images: (b,e). Maps of the distribution of boundaries superimposed to respective IQ images, showing high-angle boundaries (misorientations θ > 15°, blue lines) and low-angle boundaries (subgrains, 2° < θ < 15°, red lines): (c,f).
Metals 10 01311 g007
Figure 8. EBSD from samples with 13 passes quenched immediately after deformation, for interpass time of 5 s; (a,b) for the F138 steel, and (c,d) for the ISO steel. Red arrows indicate the position of second phase particles. IQ maps: (a,c). Maps of the distribution of boundaries superimposed to respective IQ images showing high-angle (misorientations θ > 15°, blue lines) and low-angle (subgrains, 2° < θ < 15°, red lines) grain boundaries: (b,d).
Metals 10 01311 g008
Figure 9. EBSD from samples water quenched after deformation with interpass time of 20 s and 13 passes: (a,b) for ISO steel (soaked at 1200 °C); (c,d) for ISO steel (soaked at 1250 °C). IQ map: (a,c). Orientation image mapping (OIM) showing high-angle (misorientations θ > 15°, blue lines) and low-angle (subgrains, 2° < θ < 15°, red lines) grain boundaries: (b,d).
Metals 10 01311 g009
Figure 10. Thin-foil TEM analysis of the ISO steel soaked at 1250 °C after 13 passes with 20 s of interpass time. A clear interaction of precipitates with grain boundaries and dislocations is observed in four random areas. (a) Twinned region with some dislocations, precipitates, and thickness fringes. (b,c) Regions with a high density of dislocations and precipitates randomly dispersed in the austenitic matrix. (d) Grain boundary temporarily retained by small particles with short spacing in between them.
Metals 10 01311 g010
Figure 11. Microhardness dependence with the pass number and interpass time for the steels F138 and ISO 5832-9. Error bars represent the standard deviation obtained from microhardness tests.
Metals 10 01311 g011
Figure 12. Representative potentiodynamic polarization curves (a) after soaking and (b) after deformation up to 13 passes. Nyquist plots of electrochemical impedance spectroscopy (EIS) (c) after soaking and (d) after deformation up to 13 passes. Soaking temperature conditions are annotated in the Figures. Tests were performed in the simulated body fluid (SBF) solution at 37 °C.
Metals 10 01311 g012
Figure 13. Grain size evolution as a function of the pass number and interpass times. Error bars represent the standard deviation obtained from measurements.
Metals 10 01311 g013
Figure 14. Hall–Petch plot corresponding to the present experimental results for the F138 and ISO steels.
Metals 10 01311 g014
Figure 15. Representative images (a) before and (b) after microhardness measurements in grain boundaries, large and small particles in a sample of the ISO steel soaked at 1250 °C after two passes with an interpass time of 50 s and quenched immediately after deformation.
Metals 10 01311 g015
Table 1. Chemical composition of the two austenitic stainless steels (wt.%).
AlloyCSiMnNiCrMoSPCuNNbVTiFe
ISO0.0310.383.9810.4320.432.460.00180.0220.120.350.280.120.005bal.
F1380.0110.191.7514.3017.302.77<0.0010.0190.090.079---bal.
Table 2. Summary of values of corrosion current density (Icorr), corrosion potential (Ecorr), and pitting potential (Epit) taken from polarization curves.
Potentiodynamic ValuesAfter SoakingAfter 13 Passes, 20 s
F138ISO (1200 °C)ISO (1250 °C)F138ISO (1200 °C)ISO (1250 °C)
Icorr (A/cm2)9.5 × 10−84.3 × 10−83.7 × 10−89.5 × 10−83.7 × 10−84.5 × 10−8
Ecorr (mV)−217−140−100−210−157−151
Epit (mV)480879-8649021056

