New Developments in Understanding Harper–Dorn, Five-Power Law Creep and Power-Law Breakdown

Abstract
1. Introduction
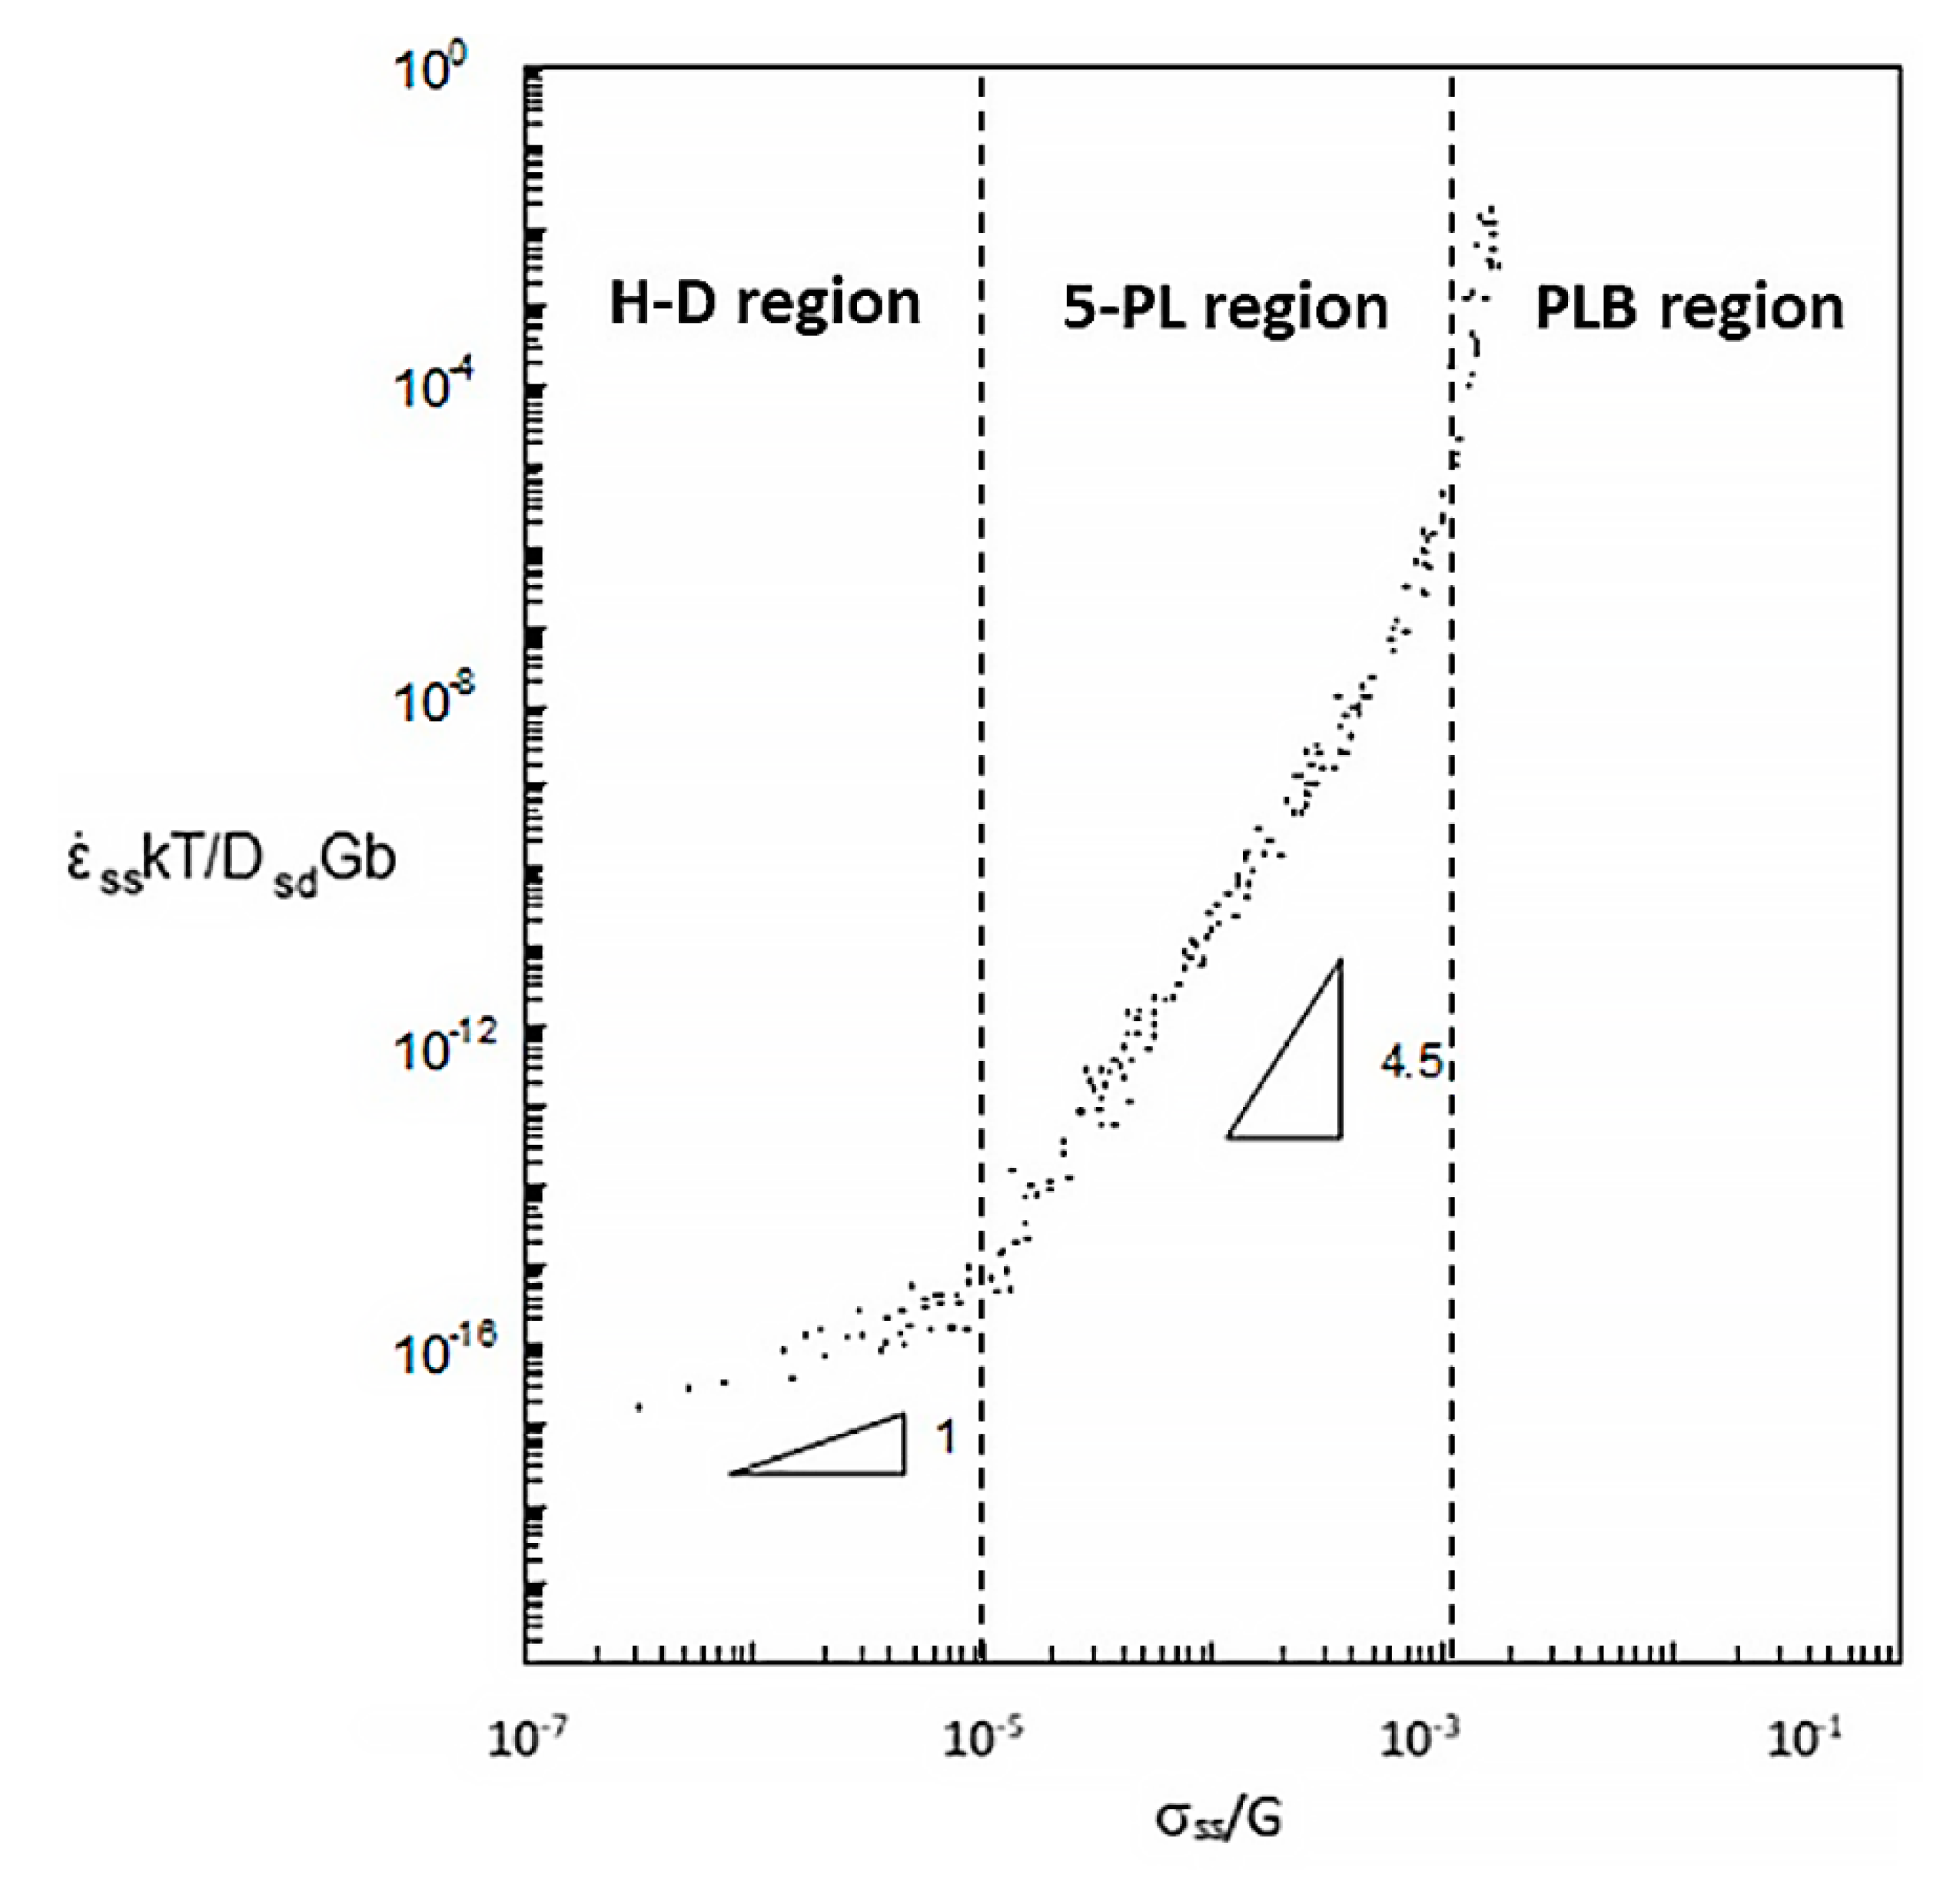
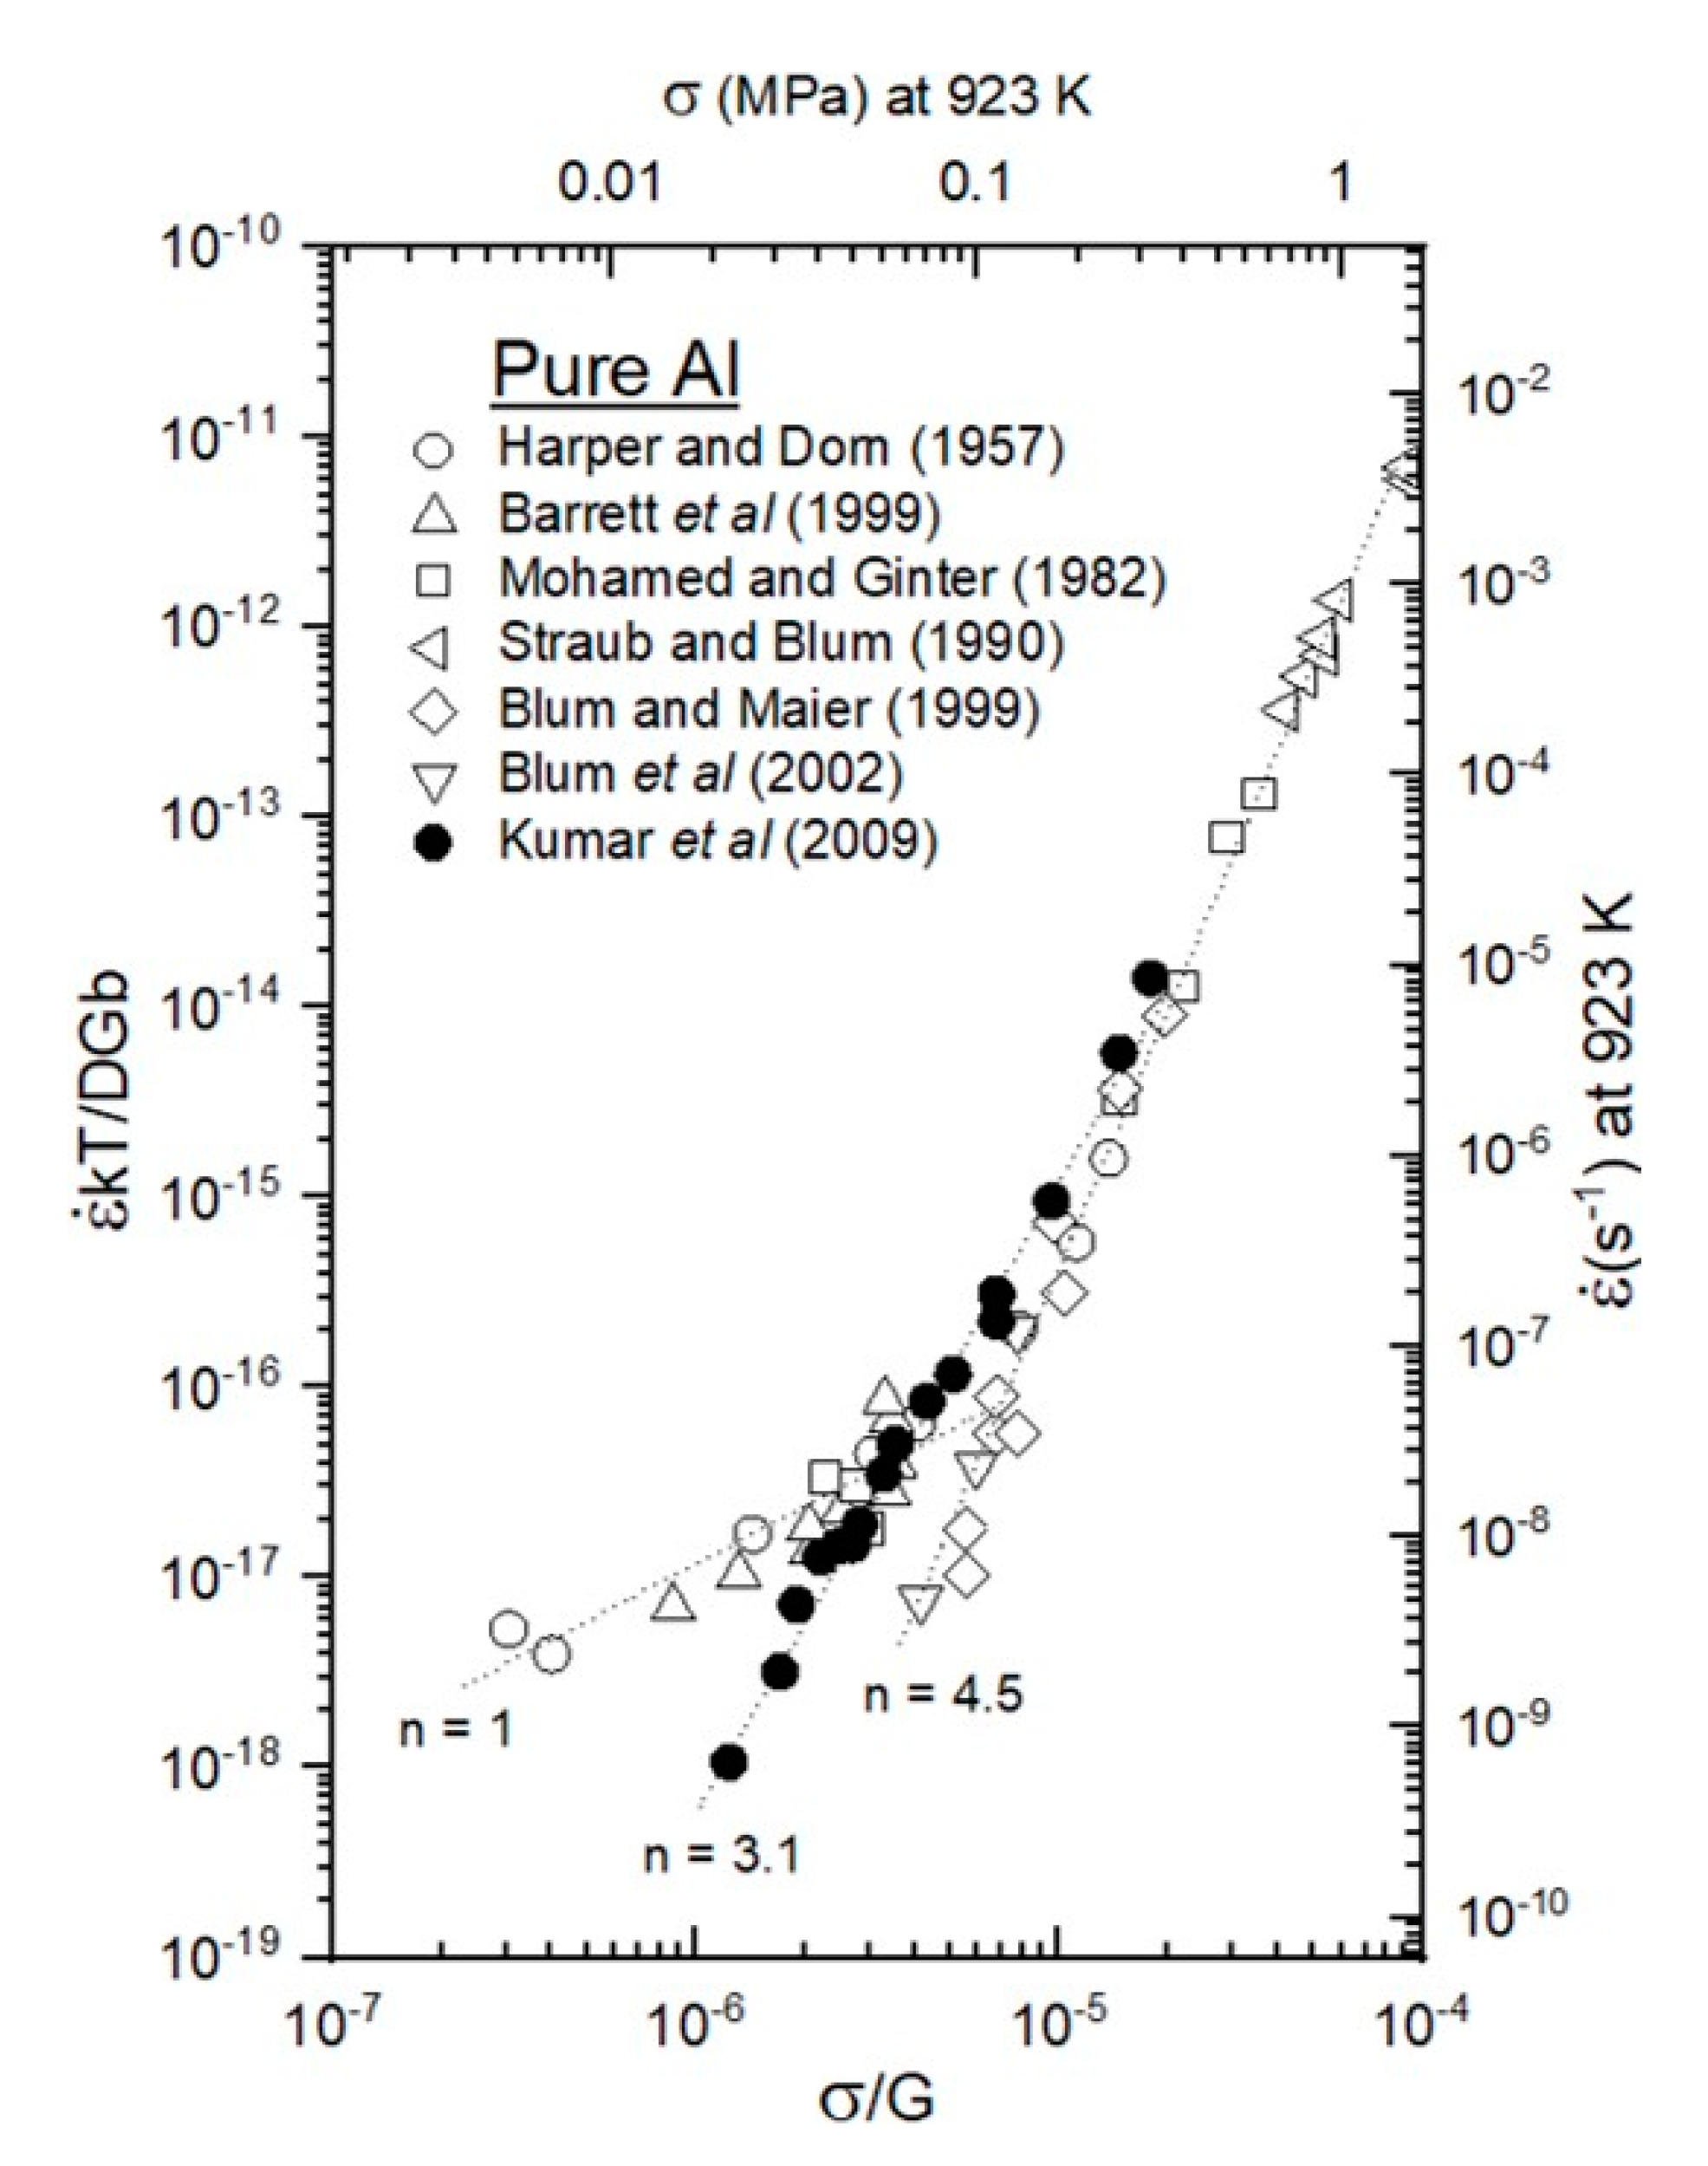
- (1)
- Temperatures near the melting point with a slope of 1 (stress exponent of 1), (HD).
- (2)
- Temperatures above approximately 0.6Tm where the constant slopes for crystalline materials vary from 3.5–7 (5-PL).
- (3)
- Below about 0.6Tm, the stress exponent is no longer constant and power-law breakdown is observed (PLB) This is sometime referred to as intermediate temperature creep that extends to roughly 0.3Tm.
2. General Creep Plasticity Considerations and Five Power-Law Creep
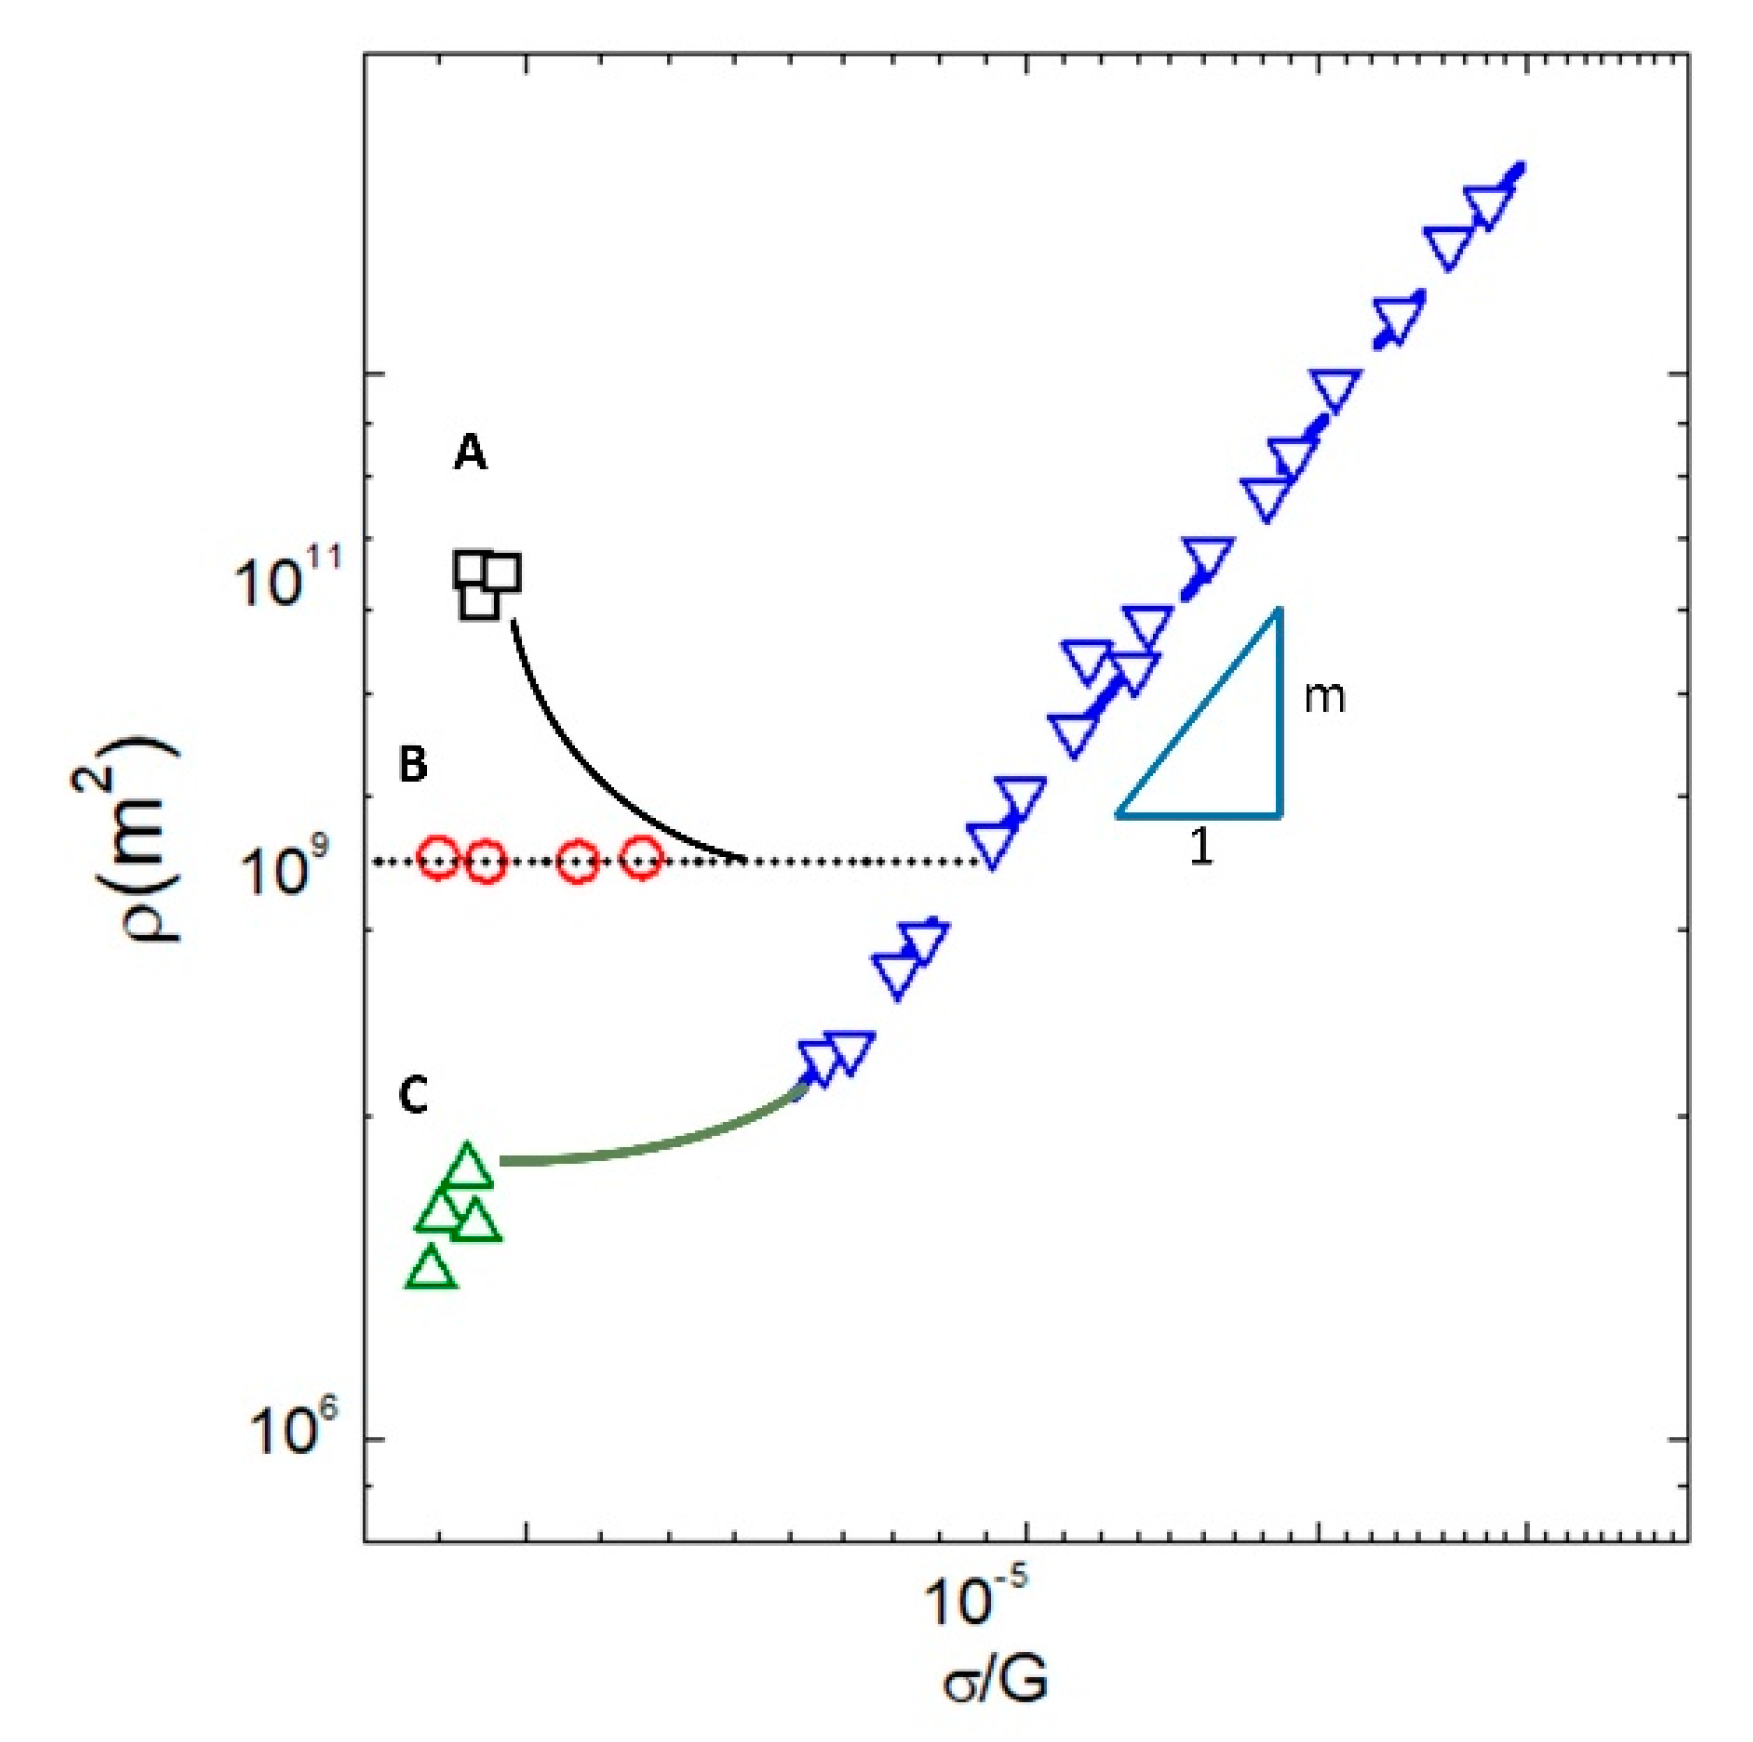
3. The So-Called Harper–Dorn Regime
- Activation energy about equal to lattice self-diffusion,
- Grain-size independence with grain boundary shearing,
- Steady-state stress exponent of one,
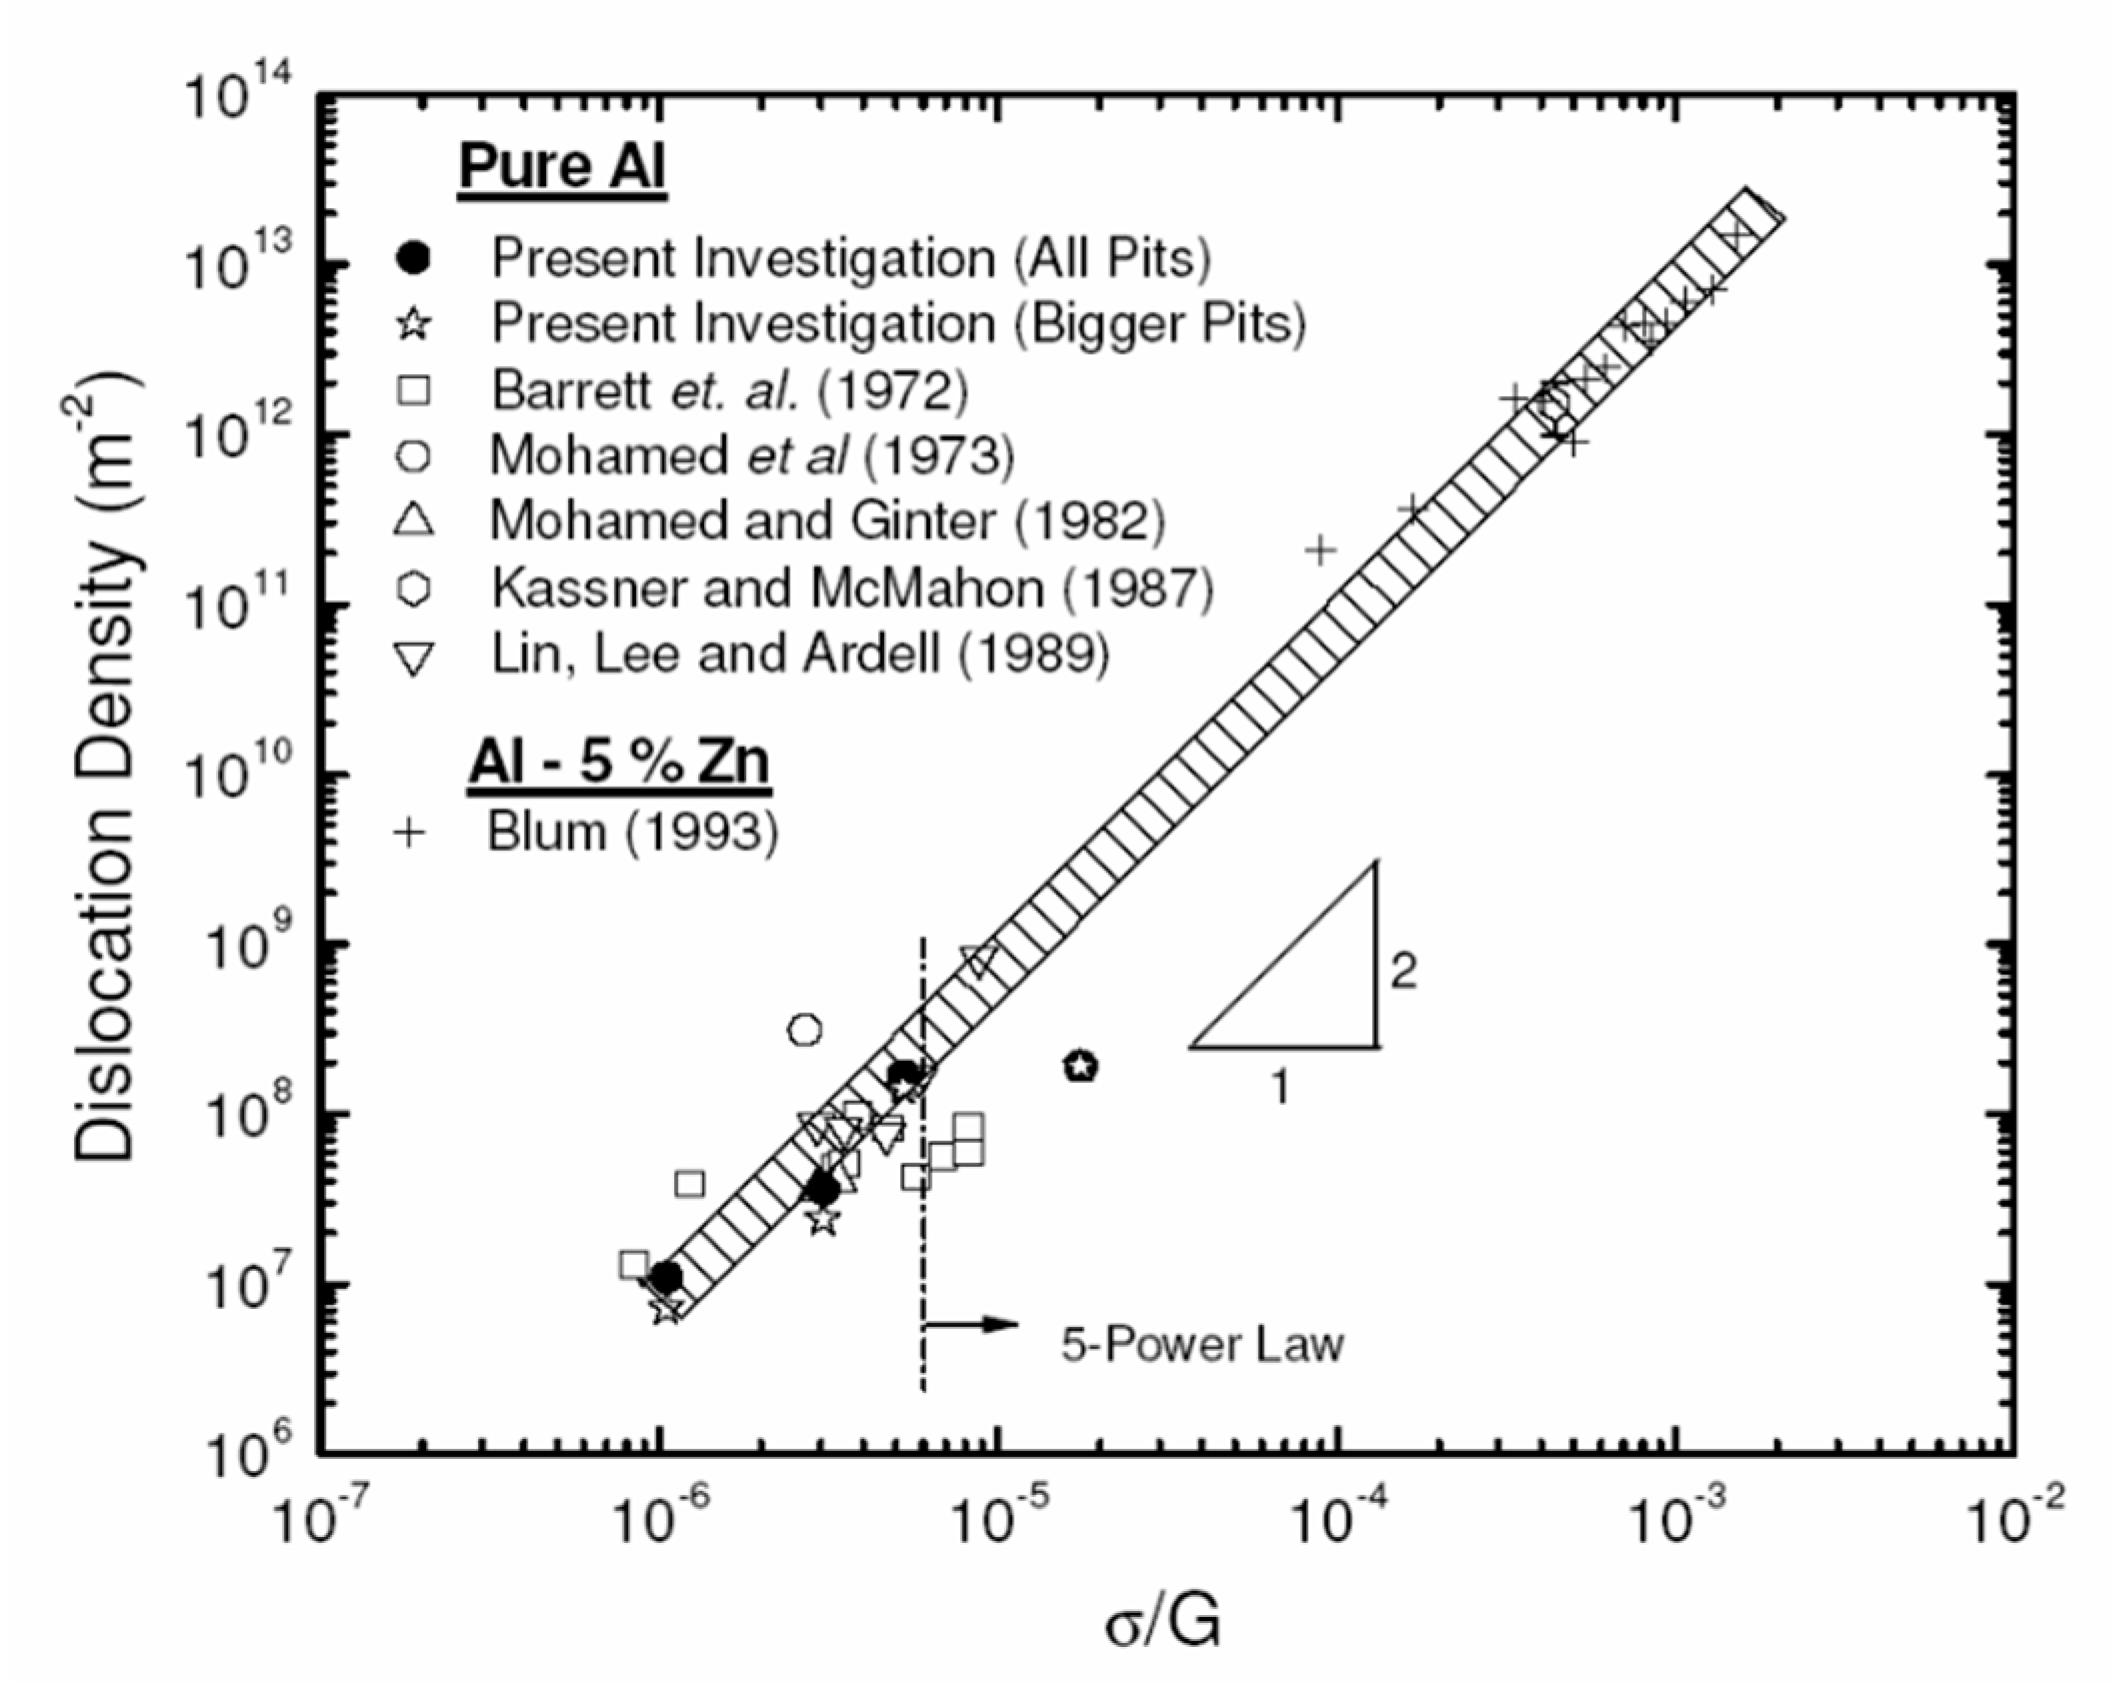
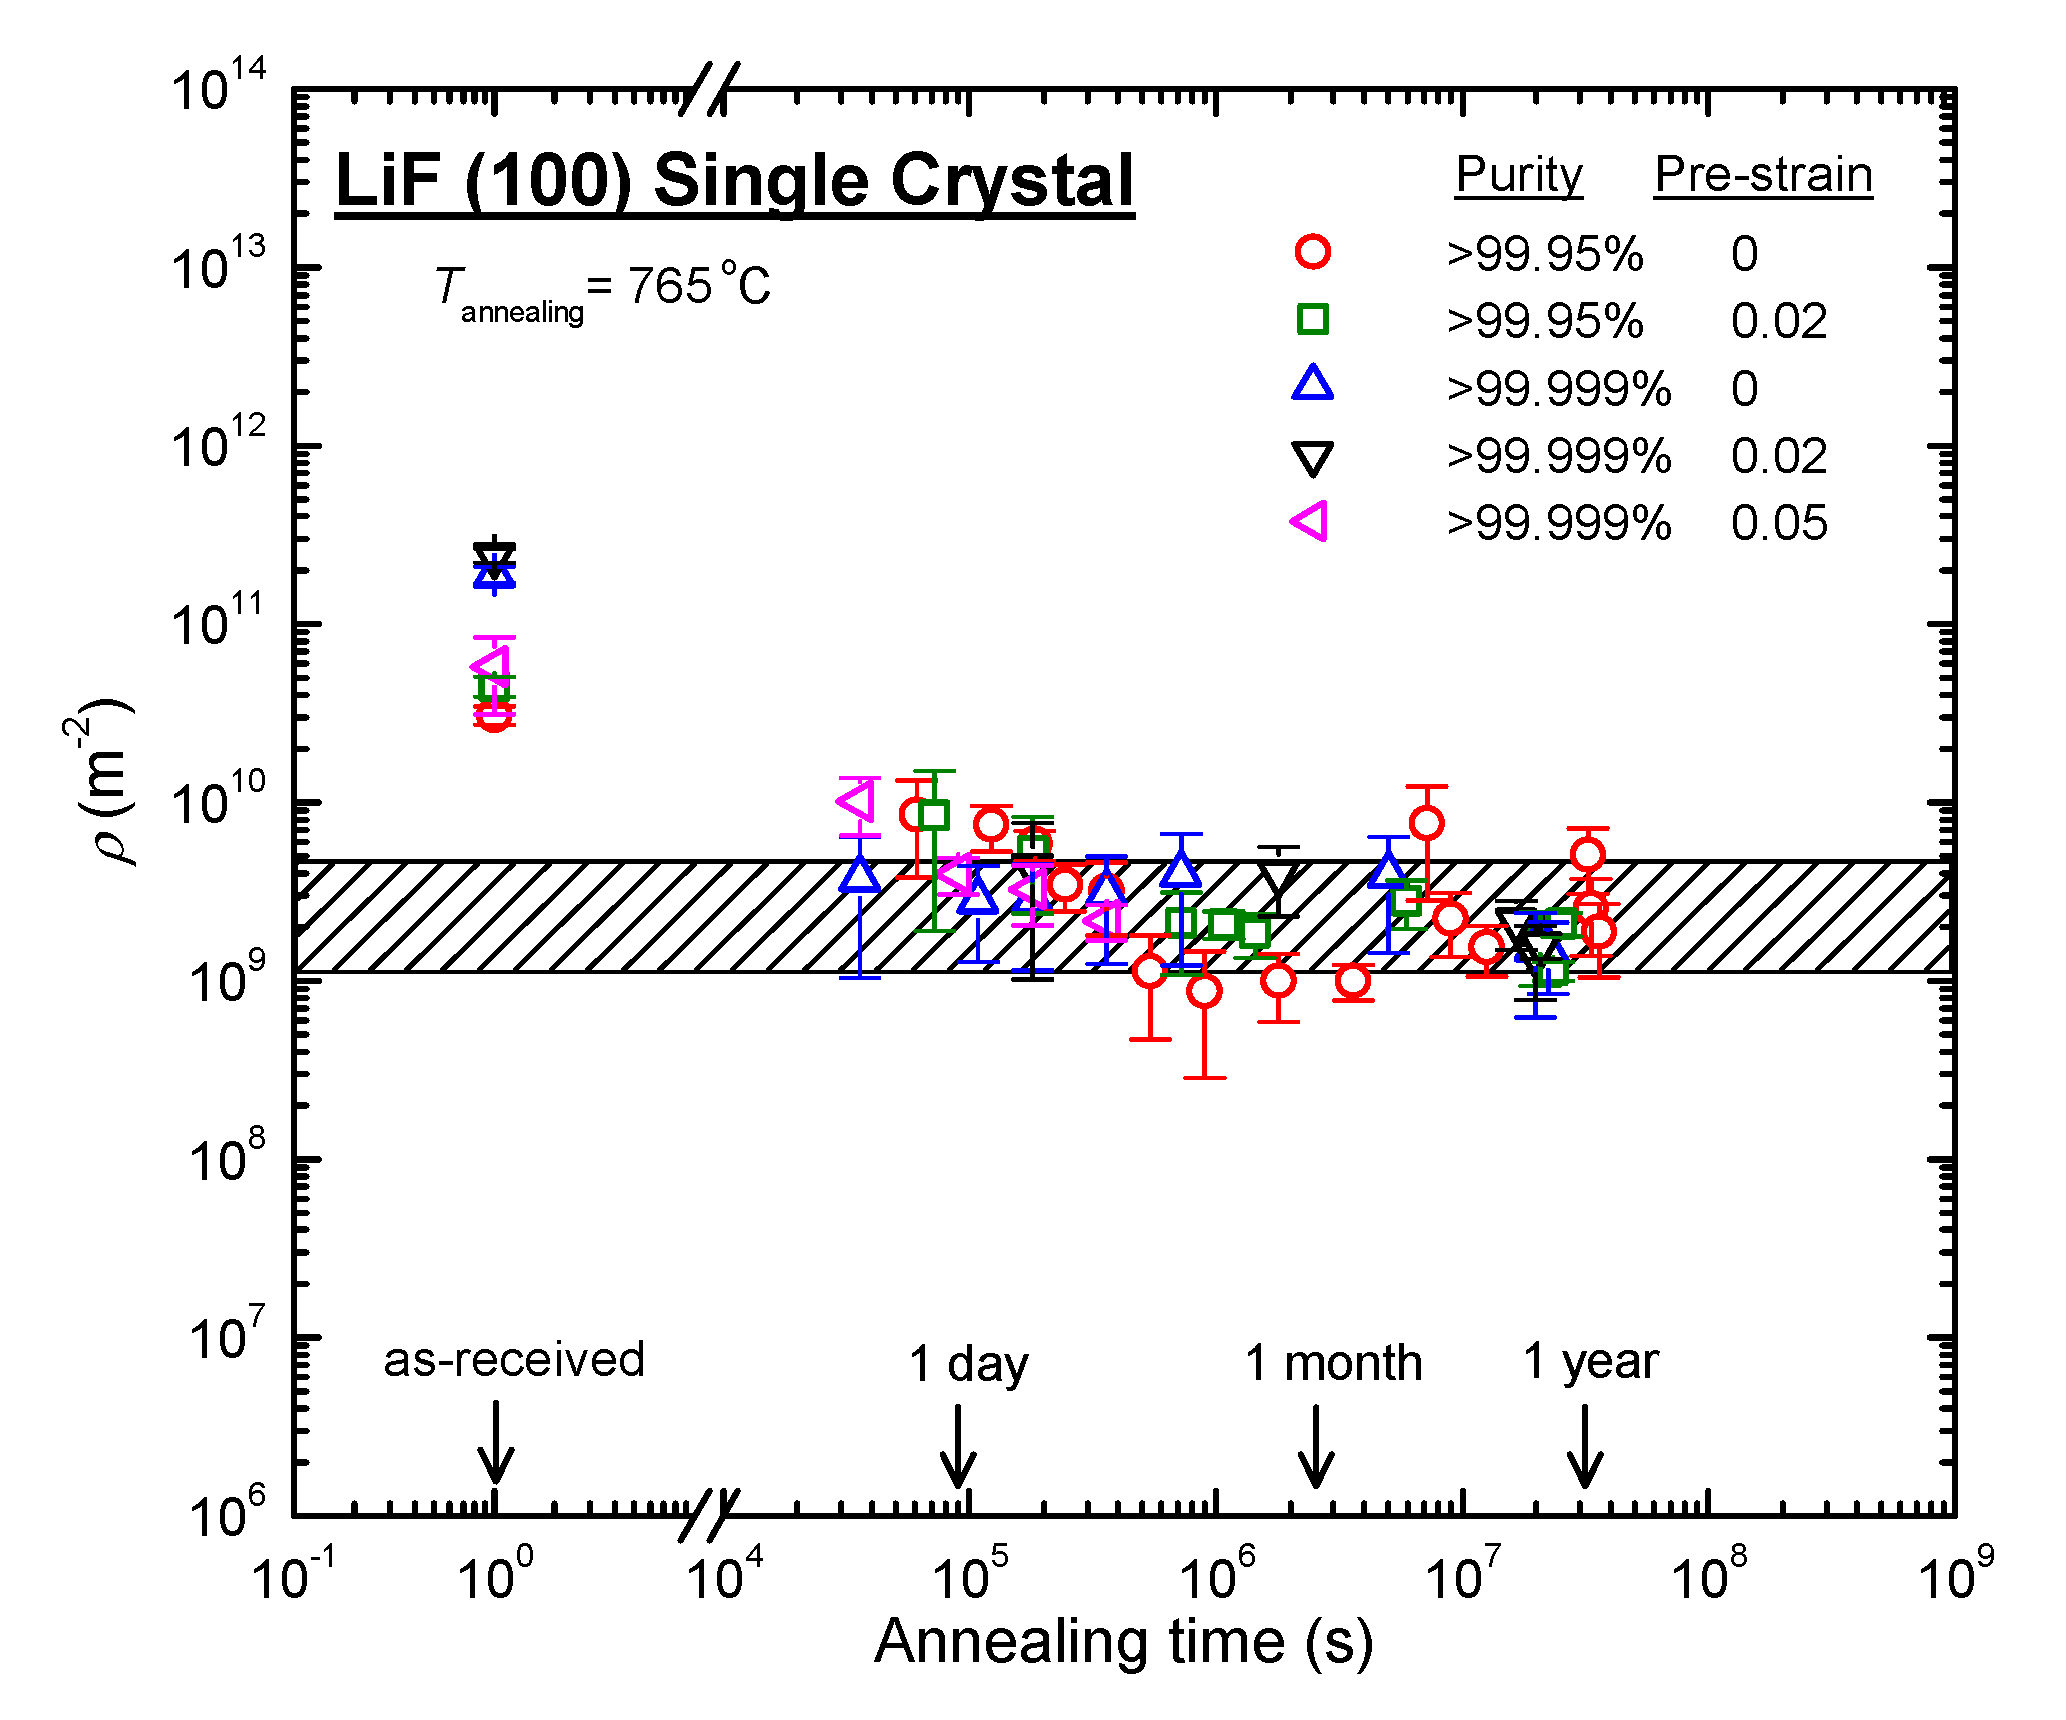
- Dislocation density that appears independent of stress, and
- A primary creep stage.
4. Power law Breakdown
5. Conclusions
Funding
Acknowledgments
Conflicts of Interest
References
- Straub, S.; Blum, W. Does the ‘Natural’ Third Power Law of Steady-state Hold for Pure Aluminum? Scr. Metall. Mater. 1990, 24, 837–1842. [Google Scholar] [CrossRef]
- Kassner, M.E. A Case for Taylor Hardening During Primary and Steady-State Creep in Aluminum and Type 304 Stainless Steel. J. Mater. Sci. 1990, 25, 1997–2003. [Google Scholar] [CrossRef]
- Kassner, M. Fundamentals of Creep in Metals and Alloys; Elsevier: Amsterdam, The Netherlands, 2015; pp. 1–338. [Google Scholar]
- Kassner, M.E. Taylor hardening in five-power-law creep of metals and Class M alloys. Acta Mater. 2004, 52, 1–9. [Google Scholar] [CrossRef]
- Kassner, M.E.; Miller, A.K.; Sherby, O.D. The Separate Roles of Forest Dislocations and Subgrains in the Isotropic Hardening of Type 304 Stainless Steel. Metall. Trans. 1982, 13, 1977–1986. [Google Scholar] [CrossRef]
- Evans, H.; Knowles, G. A model of creep in pure materials. Acta Metall. 1977, 25, 963–975. [Google Scholar] [CrossRef]
- Kumar, P.; Kassner, M.E. Theory for very low stress (“Harper-Dorn”) creep. Scr. Mater. 2009, 60, 60–63. [Google Scholar] [CrossRef]
- Ostrom, P.; Lagneborg, R. A Dislocation Link Length Model for Creep. Res. Mech. 1980, 1, 59–79. [Google Scholar]
- Ardell, A.J. Harper–Dorn creep–The dislocation network theory revisited. Scr. Metall. 2013, 69, 541–544. [Google Scholar] [CrossRef]
- Shi, L.; Northwood, D. Strain-hardening and recovery during the creep of pure polycrystalline magnesium. Acta Metall. Mater. 1994, 42, 871–877. [Google Scholar] [CrossRef]
- Burton, B. The Low Stress Creep of Aluminum Near the Melting Point: Oxidation and Substructural Changes. Phil. Mag. 1972, 25, 645–659. [Google Scholar] [CrossRef]
- Weertman, J. Theory for Steady-state Creep Based on Dislocation Climb. J. App. Phys. 1955, 26, 1213–1217. [Google Scholar] [CrossRef]
- Kassner, M.E. The rate dependence and microstructure of high-purity silver deformed to large strains between 0.16 and 0.30T m. Metall. Mater. Trans. A 1989, 20, 2001–2010. [Google Scholar] [CrossRef]
- Lüthy, H.; Miller, A.; Sherby, O. The stress and temperature dependence of steady-state flow at intermediate temperatures for pure polycrystalline aluminum. Acta Metall. 1980, 28, 169–178. [Google Scholar] [CrossRef]
- Weertman, J. High Temperature Creep Produced by Dislocation Motion. In Rate Processes in Plastic Deformation of Materials; Li, J.C.M., Mukherjee, A.K., Eds.; American Society for Metals—Metals Park: Novelty, OH, USA, 1975; pp. 315–336. [Google Scholar]
- Biberger, M.; Blum, W. On the natural law of steady state creep. Scr. Metall. 1989, 23, 1419–1424. [Google Scholar] [CrossRef]
- Kassner, M.E.; Geantil, P.; Levine, L. Long range internal stresses in single-phase crystalline materials. Int. J. Plast. 2013, 45, 44–60. [Google Scholar] [CrossRef]
- Harper, J.; Dorn, J.E. Viscous Creep of Aluminum Near Its Melting Temperature. Theory of Steady-State Creep Based on Dislocation Climb. Acta Metall. 1957, 5, 654–665. [Google Scholar] [CrossRef]
- Kassner, M.E.; Kumar, P.; Blum, W. Harper-Dorn Creep. Int. J. Plast. 2007, 23, 980–1000. [Google Scholar] [CrossRef]
- Mohamed, F.A.; Murty, K.L.; Morris, J.W. Harper-dorn creep in al, pb, and sn. Metall. Mater. Trans. A 1973, 4, 935–940. [Google Scholar] [CrossRef]
- Malakondaiah, G.; Rao, P.R. Creep of Alpha-Titanium at low stresses. Acta Metall. 1981, 29, 1263–1275. [Google Scholar] [CrossRef]
- Fiala, J.; Novotny, J.; Cadek, J. Coble and Harper-Dorn Creep in Iron at Homologous Temperatures T/Tm of 0.40-0.54. Mater. Sci. Eng. A 1983, 60, 195–206. [Google Scholar] [CrossRef]
- Malakondaiah, G.; Rao, P.R. Viscous creep of β-Co. Mater. Sci. Eng. 1982, 52, 207–221. [Google Scholar] [CrossRef]
- Novotny, J.; Fiala, J.; Čadek, J. Harper-Dorn creep in alpha-zirconium. Acta Metall. 1985, 33, 905–911. [Google Scholar] [CrossRef]
- Dixon-Stubbs, P.J.; Wilshire, B. Deformation processes during creep of single and polycrystalline CaO. Philos. Mag. A 1982, 45, 519–529. [Google Scholar] [CrossRef]
- Ruano, O.A.; Wolfenstine, J.; Wadsworth, J.; Sherby, O. Harper-Dorn and power law creep in uranium dioxide. Acta Metall. Mater. 1991, 39, 661–668. [Google Scholar] [CrossRef]
- Ruano, O.A.; Wolfenstine, J.; Wadsworth, J.; Sherby, O.D. Harper-Dorn and Power-Law Creep in Single-Crystalline Magnesium Oxide. J. Am. Ceram. Soc. 1992, 75, 1737–1741. [Google Scholar] [CrossRef]
- Ramesh, K.S.; Yasuda, E.; Kimura, S. Negative creep and recovery during high-temperature creep of MgO single crystals at low stresses. J. Mater. Sci. 1986, 21, 3147–3152. [Google Scholar] [CrossRef]
- Banerdt, W.; Sammis, C. Low stress high temperature creep in single crystal NaCl. Phys. Earth Planet. Inter. 1985, 41, 108–124. [Google Scholar] [CrossRef]
- Wolfenstine, J.; Ruano, O.A.; Wadsworth, J.; Sherby, O. Harper-dorn creep in single crystalline NaCl. Scr. Metall. Mater. 1991, 25, 2065–2070. [Google Scholar] [CrossRef]
- Wang, J.N. Harper-Dorn creep in single crystals of lead, rutile and ice. Philos. Mag. Lett. 1994, 70, 81–85. [Google Scholar] [CrossRef]
- Barrett, C.; Nix, W. A model for steady state creep based on the motion of jogged screw dislocations. Acta Metall. 1965, 13, 1247–1258. [Google Scholar] [CrossRef]
- Friedel, J. Dislocations; Pergamon Press: Oxford, MS, USA, 1964. [Google Scholar]
- Yavari, P.; Miller, D.A.; Langdon, T.G. An Investigation of Harper-Dorn Creep–I. Mechanical and Microstructural Characteristics. Acta Metall. 1982, 30, 871–879. [Google Scholar]
- Mohamed, F.A.; Ginter, T.J. On the nature and origin of Harper-Dorn creep. Acta Metall. 1982, 30, 1869–1881. [Google Scholar] [CrossRef]
- Ardell, A.; Przystupa, M. Dislocation link-length statistics and elevated temperature deformation of crystals. Mech. Mater. 1984, 3, 319–332. [Google Scholar] [CrossRef]
- Kassner, M.E. Recent Developments in Understanding the Creep of Aluminum. Mater. Phys. Mech. 2018, 40, 1–6. [Google Scholar] [CrossRef]
- Blum, W.; Maier, W. Harper-Dorn Creep—A Myth? Phys. Stat. Sol. A 1999, 171, 467–474. [Google Scholar]
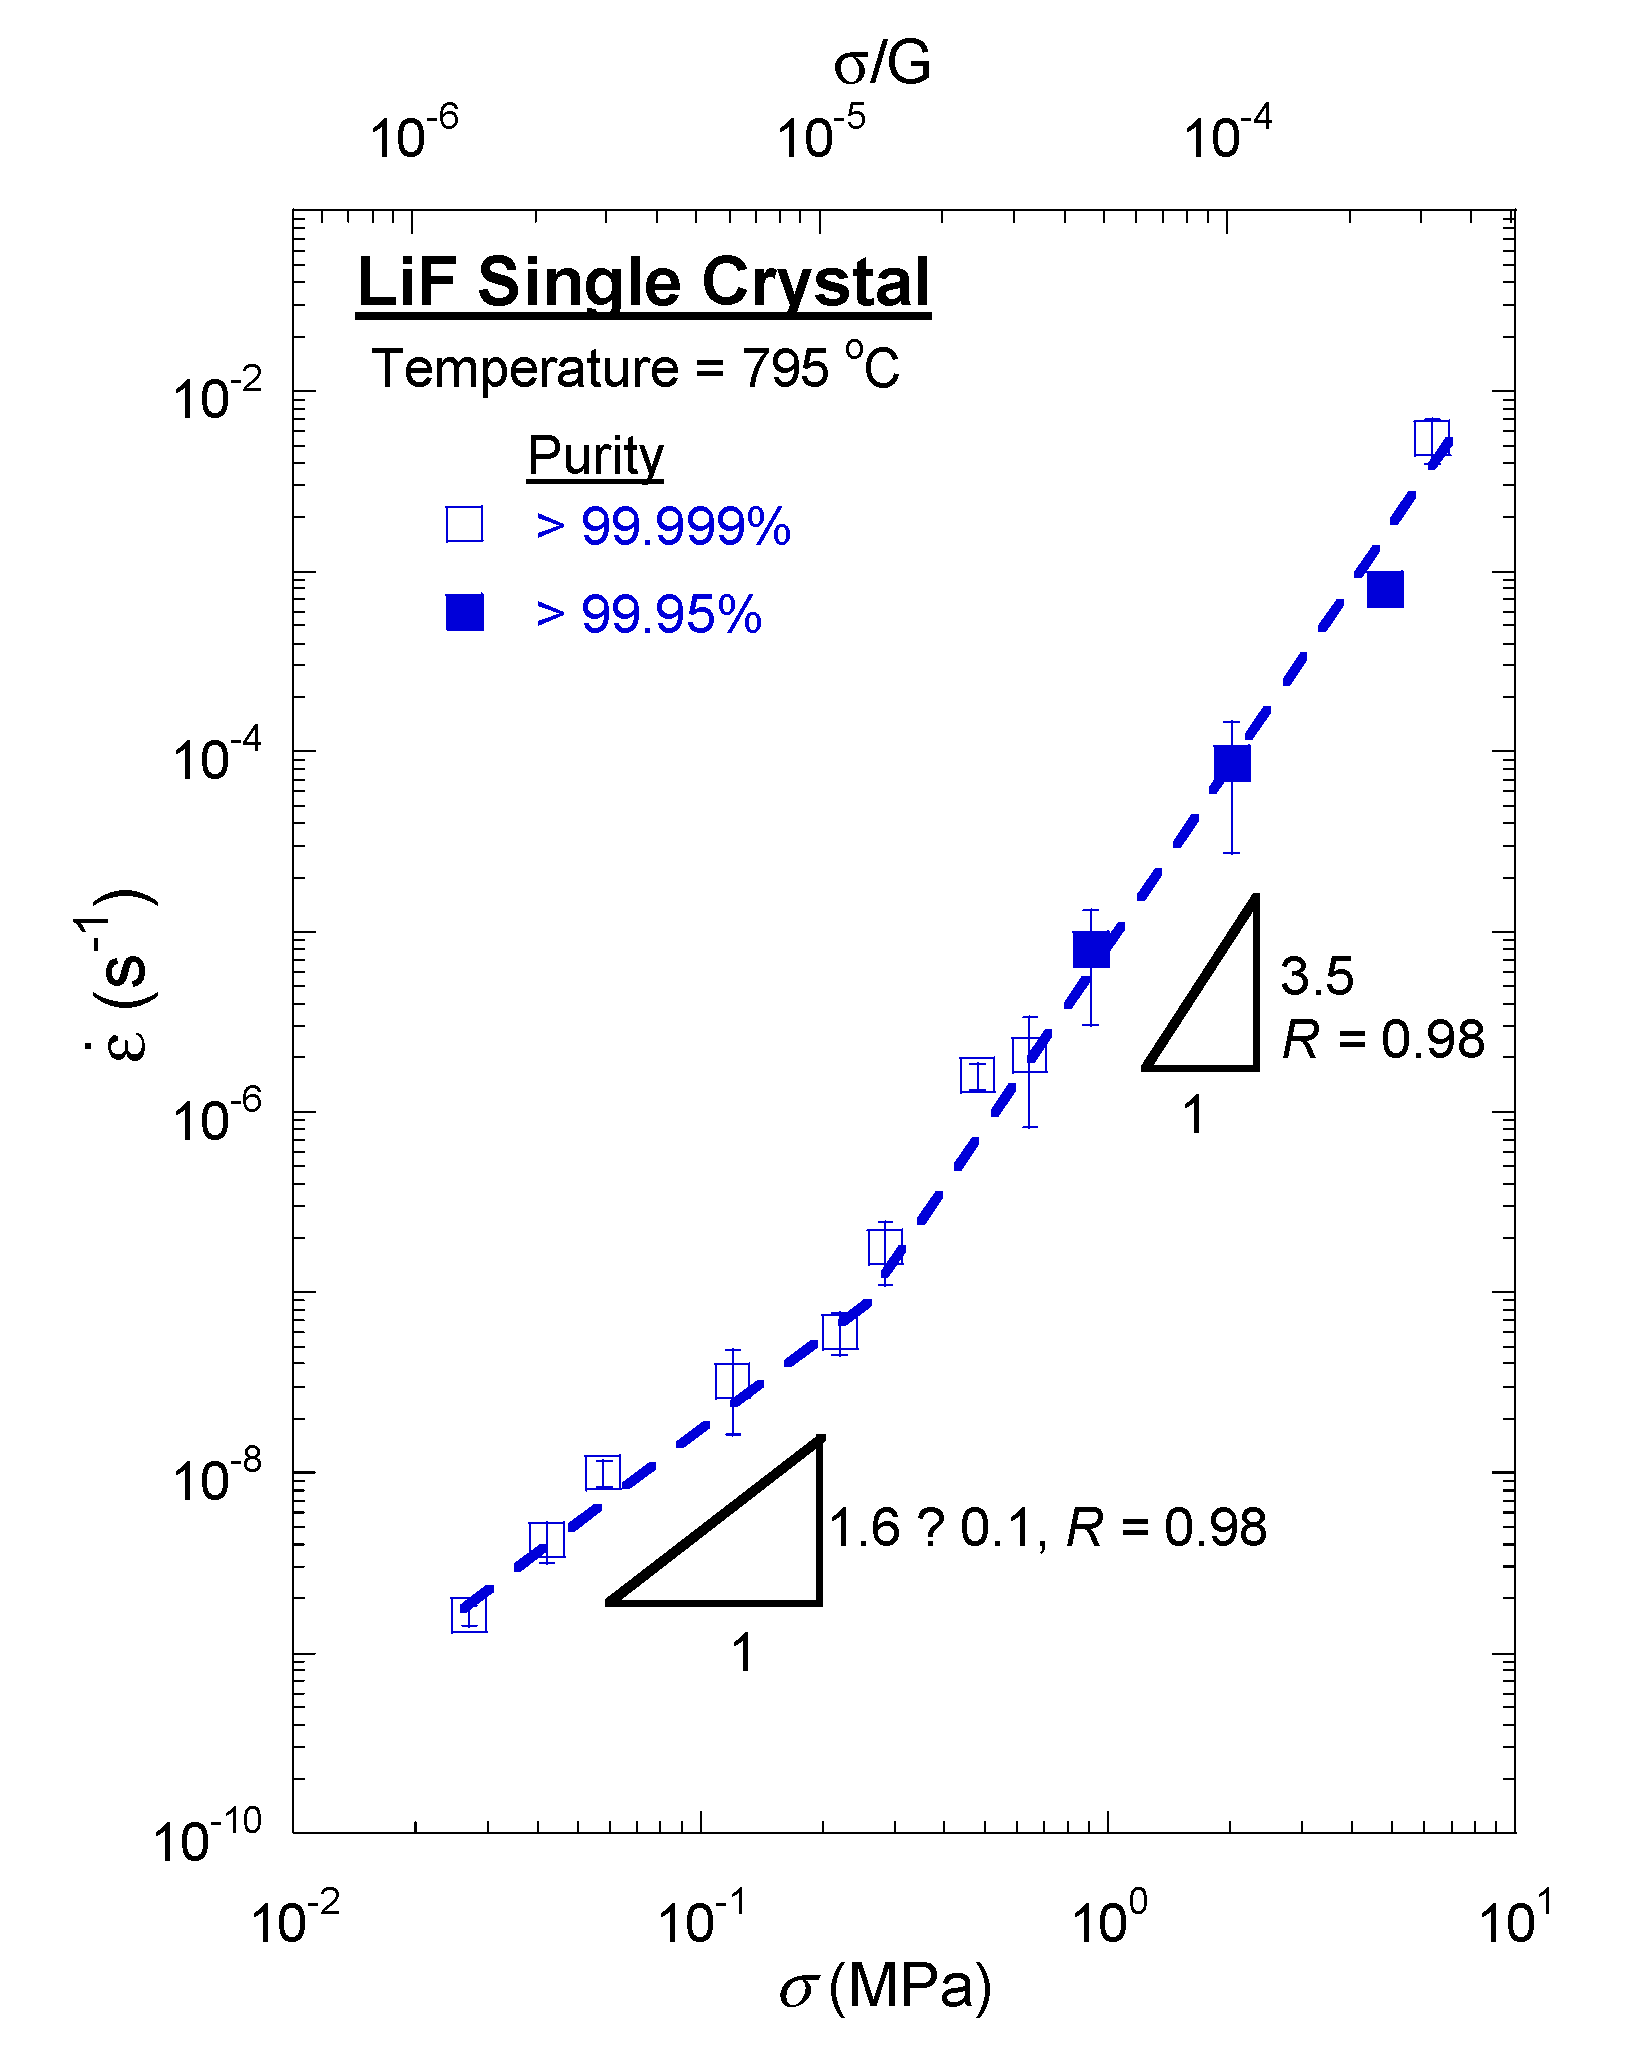
- Singh, S.P.; Kumar, P.; Kassner, M.E. The Low-Stress and High-Temperature Creep in LiF Single Crystals: An Explanation for the So-called Harper-Dorn Creep. Materialia 2020, 13, 100864. [Google Scholar] [CrossRef]
- Singh, S.; Huang, X.-R.; Kumar, P.; Kassner, M.E. Short communication: Assessment of the dislocation density using X-ray topography in Al single crystals annealed for long times near the melting temperature. Mater. Today Commun. 2019, 21, 100613. [Google Scholar] [CrossRef]
- Kumar, P.; Kassner, M.E.; Blum, W.; Eisenlohr, P.; Langdon, T.G. New observations on high-temperature creep at very low stresses. Mater. Sci. Eng. A 2009, 510, 20–24. [Google Scholar] [CrossRef]
- Nes, E.; Nost, B. Dislocation Densities in Slowly Cooled Aluminum Single Crystals. Phil. Mag. 1966, 124, 855–865. [Google Scholar]
- Mohammed, F.A. The Role of Impurities during Creep and Superplasticity at Very Low Stresses. Metall. Mater. Trans. A 2002, 33, 261–278. [Google Scholar]
- McQueen, H.; Blum, W.; Straub, S.; Kassner, M. Dynamic grain growth a restoration mechanism in 99.999 Al. Scr. Metall. Mater. 1993, 28, 1299–1304. [Google Scholar] [CrossRef]
- Kassner, M.; Pollard, J.; Evangelista, E.; Cerri, E. Restoration mechanisms in large-strain deformation of high purity aluminum at ambient temperature and the determination of the existence of a Steady State. Acta Metall. Mater. 1994, 42, 3223–3230. [Google Scholar] [CrossRef]
- Kassner, M.; McQueen, H.; Pollard, J.; Evangelista, E.; Cerri, E. Restoration mechanisms in large-strain deformation of high purity aluminum at ambient temperature. Scr. Metall. Mater. 1994, 31, 1331–1336. [Google Scholar] [CrossRef]
- McNee, K.R.; Jones, H.; Greenwood, G.W. Low Stress Creep of Aluminum at Temperatures near to Tm. In Creep and Fracture of Engineering Materials and Structures: Proceedings of the 9th International Conference; Parker, J.D., Ed.; Inst. Metals: London, UK, 2001; p. 3. [Google Scholar]
- Mompiou, F.; Caillard, D. On the stress exponent of dislocation climb velocity. Mater. Sci. Eng. A 2008, 483, 143–147. [Google Scholar] [CrossRef]
- Kabir, M.; Lau, T.T.; Rodney, D.; Yip, S.; Van Vliet, K.J. Predicting Dislocation Climb and Creep from Explicit Atomistic Details. Phys. Rev. Lett. 2010, 105, 095501. [Google Scholar] [CrossRef] [PubMed]
- Kassner, M.E.; Ermagan, R. Power Law Breakdown in the Creep of Metals and Alloys. Metals 2019, 9, 1345. [Google Scholar] [CrossRef]
- Wu, M.Y.; Sherby, O.D. Unification of Harper-Dorn and power law creep through consideration of internal stress. Acta Metall. 1984, 32, 1561–1572. [Google Scholar] [CrossRef]
- Arieli, A.; Mukherjee, A.K. Creep and Fracture of Engineering Materials and Structures; Wilshire, B., Owen, D.R.J., Eds.; Pineridge Press: Swansea, UK, 1981; pp. 97–111. [Google Scholar]
- Weertman, J.; Weertman, J.R. Physical Metallurgy, 3rd ed.; Cahn, R.W., Haasen, P., Eds.; North Holland: Amsterdam, The Netherlands, 1983; pp. 159–1307. [Google Scholar]
- Nix, W.; Ilschner, B. Mechanisms Controlling Creep of Single Phase Metals and Alloys. In Strength of Metal and Alloys; Haasen, P., Gerold, V., Kostorz, G., Eds.; Pergamon: Aachen, Germany, 1980; pp. 1503–1530. [Google Scholar]
- Ungár, T.; Schafler, E.; Hanák, P.; Bernstorff, S.; Zehetbauer, M. Vacancy production during plastic deformation in copper determined by in situ X-ray diffraction. Mater. Sci. Eng. A 2007, 462, 398–401. [Google Scholar] [CrossRef]
- Čížek, J.; Janeček, M.; Vlasák, T.; Smola, B.; Melikhova, O.; Islamgaliev, R.; Dobatkin, S. The Development of Vacancies during Severe Plastic Deformation. Mater. Trans. 2019, 60, 1533–1542. [Google Scholar] [CrossRef]


© 2020 by the author. Licensee MDPI, Basel, Switzerland. This article is an open access article distributed under the terms and conditions of the Creative Commons Attribution (CC BY) license (http://creativecommons.org/licenses/by/4.0/).
Share and Cite
Kassner, M.E. New Developments in Understanding Harper–Dorn, Five-Power Law Creep and Power-Law Breakdown. Metals 2020, 10, 1284. https://doi.org/10.3390/met10101284
Kassner ME. New Developments in Understanding Harper–Dorn, Five-Power Law Creep and Power-Law Breakdown. Metals. 2020; 10(10):1284. https://doi.org/10.3390/met10101284
Chicago/Turabian StyleKassner, Michael E. 2020. "New Developments in Understanding Harper–Dorn, Five-Power Law Creep and Power-Law Breakdown" Metals 10, no. 10: 1284. https://doi.org/10.3390/met10101284
APA StyleKassner, M. E. (2020). New Developments in Understanding Harper–Dorn, Five-Power Law Creep and Power-Law Breakdown. Metals, 10(10), 1284. https://doi.org/10.3390/met10101284