Review

Recent Developments and Trends in the Friction Testing for Conventional Sheet Metal Forming and Incremental Sheet Forming

by
Tomasz Trzepiecinski
1,* and
Hirpa G. Lemu
2,*
1
Department of Materials Forming and Processing, Rzeszow University of Technology, al. Powst. Warszawy 8, 35-959 Rzeszów, Poland
2
Department of Mechanical and Structural Engineering, University of Stavanger, N-4036 Stavanger, Norway
*
Authors to whom correspondence should be addressed.
Metals 2020, 10(1), 47; https://doi.org/10.3390/met10010047
Submission received: 18 November 2019 / Revised: 20 December 2019 / Accepted: 20 December 2019 / Published: 25 December 2019
(This article belongs to the Special Issue Forming Processes of Modern Metallic Materials)

Abstract

:
Friction is the main phenomenon that has a huge influence on the flow behavior of deformed material in sheet metal forming operations. Sheet metal forming methods are one of the most popular processes of obtaining finished products, especially in aerospace, automobile, and defense industries. Methods of sheet forming are carried out at different temperatures. So, it requires tribological tests that suitably represent the contact phenomena related to the temperature. The knowledge of the friction properties of the sheet is required for the proper design of the conditions of manufacturing processes and tools. This paper summarizes the methods used to describe friction conditions in conventional sheet metal forming and incremental sheet forming that have been developed over a period of time. The following databases have been searched: WebofKowledge, Scopus, Baztool, Bielefield Academic Search Engine, DOAJ Directory of Open Access Journals, eLibrary.ru, FreeFullPdf, GoogleScholar, INGENTA, Polish Scientific Journals Database, ScienceDirect, Springer, WorldCat, WorldWideScience. The English language is selected as the main source of review. However, in a limited scope, databases in Polish and Russian languages are also used. Many methods of friction testing for tribological studies are selected and presented. Some of the methods are observed to have a huge potential in characterizing frictional resistance. The application of these methods and main results have also been provided. Parameters affecting the frictional phenomena and the role of friction have also been explained. The main disadvantages and limitations of the methods of modeling the friction phenomena in specific areas of material to be formed have been discussed. The main findings are as follows—The tribological tests can be classified into direct and indirect measurement tests of the coefficient of friction (COF). In indirect methods of determination, the COF is determined based on measuring other physical quantities. The disadvantage of this type of methods is that they allow the determination of the average COF values, but they do not allow measuring and determining the real friction resistance. In metal forming operations, there exist high local pressures that intensify the effects of adhesion and plowing in the friction resistance. In such conditions, due to the plastic deformation of the material tested, the usage of the formula for the determination of the COF based on the Coulomb friction model is limited. The applicability of the Coulomb friction model to determine the COF is also very limited in the description of contact phenomena in hot SMF due to the high shear of adhesion in total contact resistance.

1. Introduction

Conventional sheet metal forming (SMF) methods are widely used for making shaped components across the many industries. In an SMF process, a thin piece of metal sheet, commonly referred to as the workpiece, is stretched by stamping tool into the desired shape without excessive thinning or wrinkling. Finished products fabricated by SMF processes have good quality, are geometrically accurate, and commonly do not require finishing procedures. The main problem in SMF techniques is the appropriate compensation of the springback phenomenon [1,2]. However, sheet forming processes are complex and require expensive tooling that is economically feasible only for mass production [3]. Goals of experimental investigations in sheet metal forming operations are classified into two [4,5]:
(1)
understanding the contact conditions during sheet metal forming and
(2)
assessing the influence of specific variables in the forming operations.
Incremental sheet forming (ISF) is a relatively recent technique that allows solving many problems of the conventional sheet forming process. ISF is a dieless forming process suitable for small batches and has demonstrated its great potential to form complex three-dimensional parts with using a relatively simple and low-cost tools. Potential application areas of ISF include the aerospace industry, biomedical applications, rapid prototype production, and metal forming in the automotive industry. ISF processes are characterized by much less forming force compared to conventional stamping, no need to manufacture the dies, a higher value of the sheet deformation in relation to die-forming, and the ability to shape elements on a conventional computer numerical control (CNC) milling machine [6].
In general, ISF includes several sheet flexible forming approaches, such as Single Pint Incremental Forming (SPIF), Two Point Incremental Forming (TPIF), also known as Double-Sided Incremental Forming (DSIF), Incremental Forming with Counter Tool (IFWCT), or Water Jet Incremental Sheet Metal Forming (WJISMF) [6,7,8].
In SMF, the shape, dimensional accuracy, and surface roughness of the final part mainly depend on the character of sheet deformation due to material properties, tool design, forming conditions (temperature, forming speed, etc.), initial surface topography, friction conditions (dry or lubricated contact). Former studies [9,10] showed that the surface properties of the tool have a significant effect on friction as well as wear behavior of sheet metal forming under lubricated conditions. The existence of friction forces at the deformed material and tool interface, in particular, determines the non-uniformity of the deformation of the sheet metal.
Therefore, it is necessary to have sufficient knowledge of the frictional resistance in order to properly design the die tool and to forecast the flow of the material under forming, especially in the case of complex shapes. Moreover, finite element-based numerical simulations that allow for an accurate analysis of deformation of the sheet require a proper description of the contact phenomena. However, for proper operation, one requires knowledge of the frictional resistance and its evolution during the forming process. This justifies the work on the proper planning of the friction tests using proper simulators that are developed to model the friction phenomena simulation tests. In this paper, the methods used to represent the friction conditions in conventional SMF and ISF have been summarized. Furthermore, the main disadvantages and limitations of the modeling methods of the friction phenomena in specific areas of the material to be formed have been discussed.

2. Methods

To fulfil the aim of the article, the main scientific databases have been explored. The English language is selected as the main source of review. However, in a limited scope, Polish and Russian languages are also used in exploring the Polish language and Russian language-based scientific databases. To identify the potential relevant documents, the following bibliographic databases were searched: WebofKowledge, Scopus, Baztool, Bielefield Academic Search Engine, DOAJ Directory of Open Access Journals, eLibrary.ru, FreeFullPdf, GoogleScholar, INGENTA, Polish Scientific Journals Database, ScienceDirect, Springer, WorldCat, WorldWideScience. No restriction has been made on the publication years. The search strategy was limited to scientific articles and scientific theses distributed in open access and distributed under the access available at the authors’ Universities. The duplicated articles found by various databases were not considered. Papers were also excluded if they did not fit into the conceptual framework of the study. References available in found articles were also considered. Many years of experience of the authors allow drawing the hypothesis that there is a very limited number of friction tests in sheet metal forming, which causes that no special numerical screening algorithm was used. The articles were reviewed “manually”. It should be pointed out that the results found by different databases were consistent. The keywords used to search in the databases include, but not limited to:
  • English language: “friction coefficient sheet forming”, “friction coefficient metal forming”, “friction sheet forming, “friction deep drawing”, “tribology sheet metal forming”, “friction bending under tension”, “friction blank holder”, “coefficient of friction”, “tribometer coefficient of friction”, “friction simulative tests”, “strip drawing test”, “hot forming friction testing”, “friction in draw bead”, “draw bead friction test”, “advances in friction testing”, “advances in friction measuring”, “friction apparatus for sheet metal forming”;
  • Polish language: “tarcie podczas kształtowania blach”, “współczynnik tarcia”, “tarcie przeróbka plastyczna metali”, “tribotester”, “pomiar tarcia kształtowanie blach”, “opory tarcia”, “tarcie pod dociskaczem”, “metody wyznaczania oporów tarcia”, “metody określania współczynnika tarcia”, “postępy w pomiarze współczynnika tarcia”, “pomiar sił tarcia w procesie tłoczenia”, “test przeciągania paska blachy”, “test zginania blachy z rozciąganiem”, “test przeciągania w warunkach ściskania blachy”, “test zginania w warunkach ściskania blachy”, “test zginania blachy z przeciąganiem”, “test zginania blachy z ciągnieniem”;
  • Russian language: “трибoтестер”, „кoэффициент трения фoрмoвание листoвoгo металла”, „трение при фoрмoвании листoвoгo металла”, „метoды oпределения сoпрoтивления трения”, „сoпрoтивление трения”, „прoгресс в измерении кoэффициента трения”, „фрикциoннo-пластическoе фoрмoвание металлoв”, „измерение трения”, „метoды oпределения кoэффициента трения”.
  • The next section shortly describes the fundamentals of tribology in sheet metal forming. The results of the review are presented in Section 4 and Section 5.

3. Frictional Resistance

Frictional resistance depends on diverse parameters such as lubrication, normal pressure, the surface roughness of the sheet metal and the tool, type of materials of the contact pair, sliding speed, and temperature [11]. In forming at elevated temperatures, the coefficient of friction (COF) is usually higher than in cold forming. This is because higher temperature forming increases adhesion at the contact interface. The interaction between the two surfaces and the oxide and debris layers formed is constantly changing and strongly affected by the forming conditions [12]. It is well known [13,14] that friction changes as a result of plastic deformation of the material and the increased surface roughness. This leads to the transition from a hydrodynamic to a mixed friction regime, and the metal to metal contact increases.
The unfavorable effects of frictional resistance include [15,16]: non-uniform workpiece deformation, worsening of workpiece surface roughness, and the increased tool wear. The existence of frictional resistance between workpiece and punch in the stamping process has an advantage that the maximum allowable drawing force can be increased. As it was concluded by Menezes et al. [17], the variations of the COF between the tool and workpiece surface directly affect both the stress distribution and the shape of the workpiece. This also has direct impacts on the material microstructure.
Friction in sheet metal forming is a complex function of the physico-mechanical properties of the tool and workpiece, forming parameters, the topography of both metallic sheets and tools, and contact conditions. In order to fully characterize the role of friction in sheet metal forming, a tribological system may be introduced, which consists of four main elements (Figure 1)—friction pair, lubricant, micro- and macroenvironment, and processing parameters.
Tribology plays a key role in the formability of material and quality of products. The surface roughness of sheet and tooling surfaces, surface coating, and lubrication type are the fundamental parameters of the tribological performance of elements in the automotive industry [18]. The most economical and effective way to reduce the harmful effects of frictional resistances in stamping operations is lubrication. The most important properties of the lubricant are viscosity and extreme pressure load [19]. The pressure between the die and the workpiece is a crucial factor determining the effectiveness of lubrication. At a relatively low contact pressure, the frictional interaction takes place through mixed lubricated asperity contacts that are dominated by boundary effects [20]. In such conditions, the total applied load is partially carried by the hydrodynamic action of the lubricant film. The contact normal stresses in deep drawing and hot sheet metal forming may reach a value of 750–800 MPa. So, the proper selection of lubricant type is crucial to realize the tool-workpiece separation and friction reduction. The application of good boundary lubricants containing hard coatings and extreme-pressure additives could increase the frictional resistance of the die-workpiece contact surfaces [21]. Results of Kim et al. [22] also showed that the combined uses of good boundary lubrication and hard coatings reduce heat generation at the die-workpiece contact.
In SMF, the friction coefficient is controlled by two different friction components [23]: (1) an adhesive force acting in the real contact areas and (2) a deformation force acting when the harder tool surface asperities plow into the surface of the softer sheet metal. Surface plowing refers to the deformation of the surface of a softer material due to a harder material sinking into it. In other words, the friction effect is observed due to the adhesion effects between asperities, the plowing at contacting asperities, and the hydrodynamic friction stresses that appear when the lubrication regime is applied. The impact of adhesion and plowing on the frictional resistance is a function of the real area of contact. Therefore, frictional resistance depends on the real area of contact, which can be influenced by two mechanisms [24,25,26]: (1) roughening and (2) flattening. These mechanisms occur due to sliding, normal load and stretching, where flattened surfaces exhibit a higher COF. On the other hand, roughening of asperities decreases the real area of contact resulting in lower friction.
In addition, in hot forming processes, the temperature may dynamically change in the forming process, so a constant COF cannot reflect friction and galling characteristic of the interface [27]. Galling, in particular, accelerates with rising temperatures in both lubricated and dry friction conditions [28], thus affecting the quality of parts formed.
Many studies were devoted to investigating the effectiveness of friction reduction by different types of lubricants. A lubricant with high viscosity can form a thicker film, enlarging the distance between the interacting asperities and hence reduces abrasion. In contrast, lubricants with an extremely high value of pressure load may maintain an oil film under higher contact pressure between asperities and minimize the asperity adhesion [19,20].

4. Friction Testing in Conventional Sheet Metal Forming

4.1. Background

The first quantitative investigations of friction, lubrication, and wear were made by inventor Leonardo da Vinci (1452–1519) almost 450 years ago. Guillaume Amontons (1663–1705) in 1699 enunciated fundamental laws of friction, with those names not associated. One of the two main statements is that the friction force is independent of the apparent area of contact between the two surfaces. Secondly, the friction force acting between two sliding surfaces is proportional to the applied load. The concept of experimental apparatuses and development of da Vinci′s understanding of the friction laws have been comprehensively examined by Hutchins [29]. Many of the concepts of friction measurement presented in da Vinci′s manuscripts are still up-to-date. Furthermore, they formed the basis for creating new concepts of friction tests.
Due to the presence of different conditions with regard to the pressure forces, state of stresses, and speed of displacement in the individual areas of the draw piece, a series of tribological tests were developed to model the friction conditions for the needs of the plastic sheet forming processes [16,30]. Over the years, two main groups of tribological tests were developed. The tests simulating tribological conditions model the geometrical interactions of the friction pair, often without maintaining the process kinematics. The second group, the process simulation tests, are designed to manipulate plastic-forming operations while maintaining process kinematics. Both groups of tests can be divided into tests with direct or indirect measurement of the values of the COF. A review of the effects of coating, lubrication, and temperature on the tribological characteristics in hot forming and the tribometers for different metal forming processes at elevated temperatures has been presented by Dohda et al. [31]. Moreover, the tribological behaviors of oxides in hot forming were discussed. An overview of the simulation tests representing the friction conditions in the specific areas of the draw piece is also shown in Figure 2.
Most tests allow indirect determination of the value of the COF based on the measurement of the changes in other physical parameters like strains or forces. Besides, in order to study the interactions in the sheet-tool interface, the industry is nowadays using different numerical simulation-based tests [32,33,34].
Bay et al. [16] divided the friction tests with regard to the normal pressure value, surface expansion, and sliding length into three groups:
(1)
bending under tension tests with mild tribological conditions with normal medium pressures, low-sliding speeds, and no surface expansion,
(2)
draw-bead tests with medium-to-high normal pressures, medium sliding lengths, and no surface expansion and
(3)
strip-reduction tests with normal high pressures, low-sliding lengths, and surface expansion.
Even until the present, no universal method has been developed for determining the COF. This is attributed to the variety of the geometry of tool contact with the deformed material as well as the existence of different stress and strain states in specific areas of the draw piece in the sheet-forming processes (Figure 3).

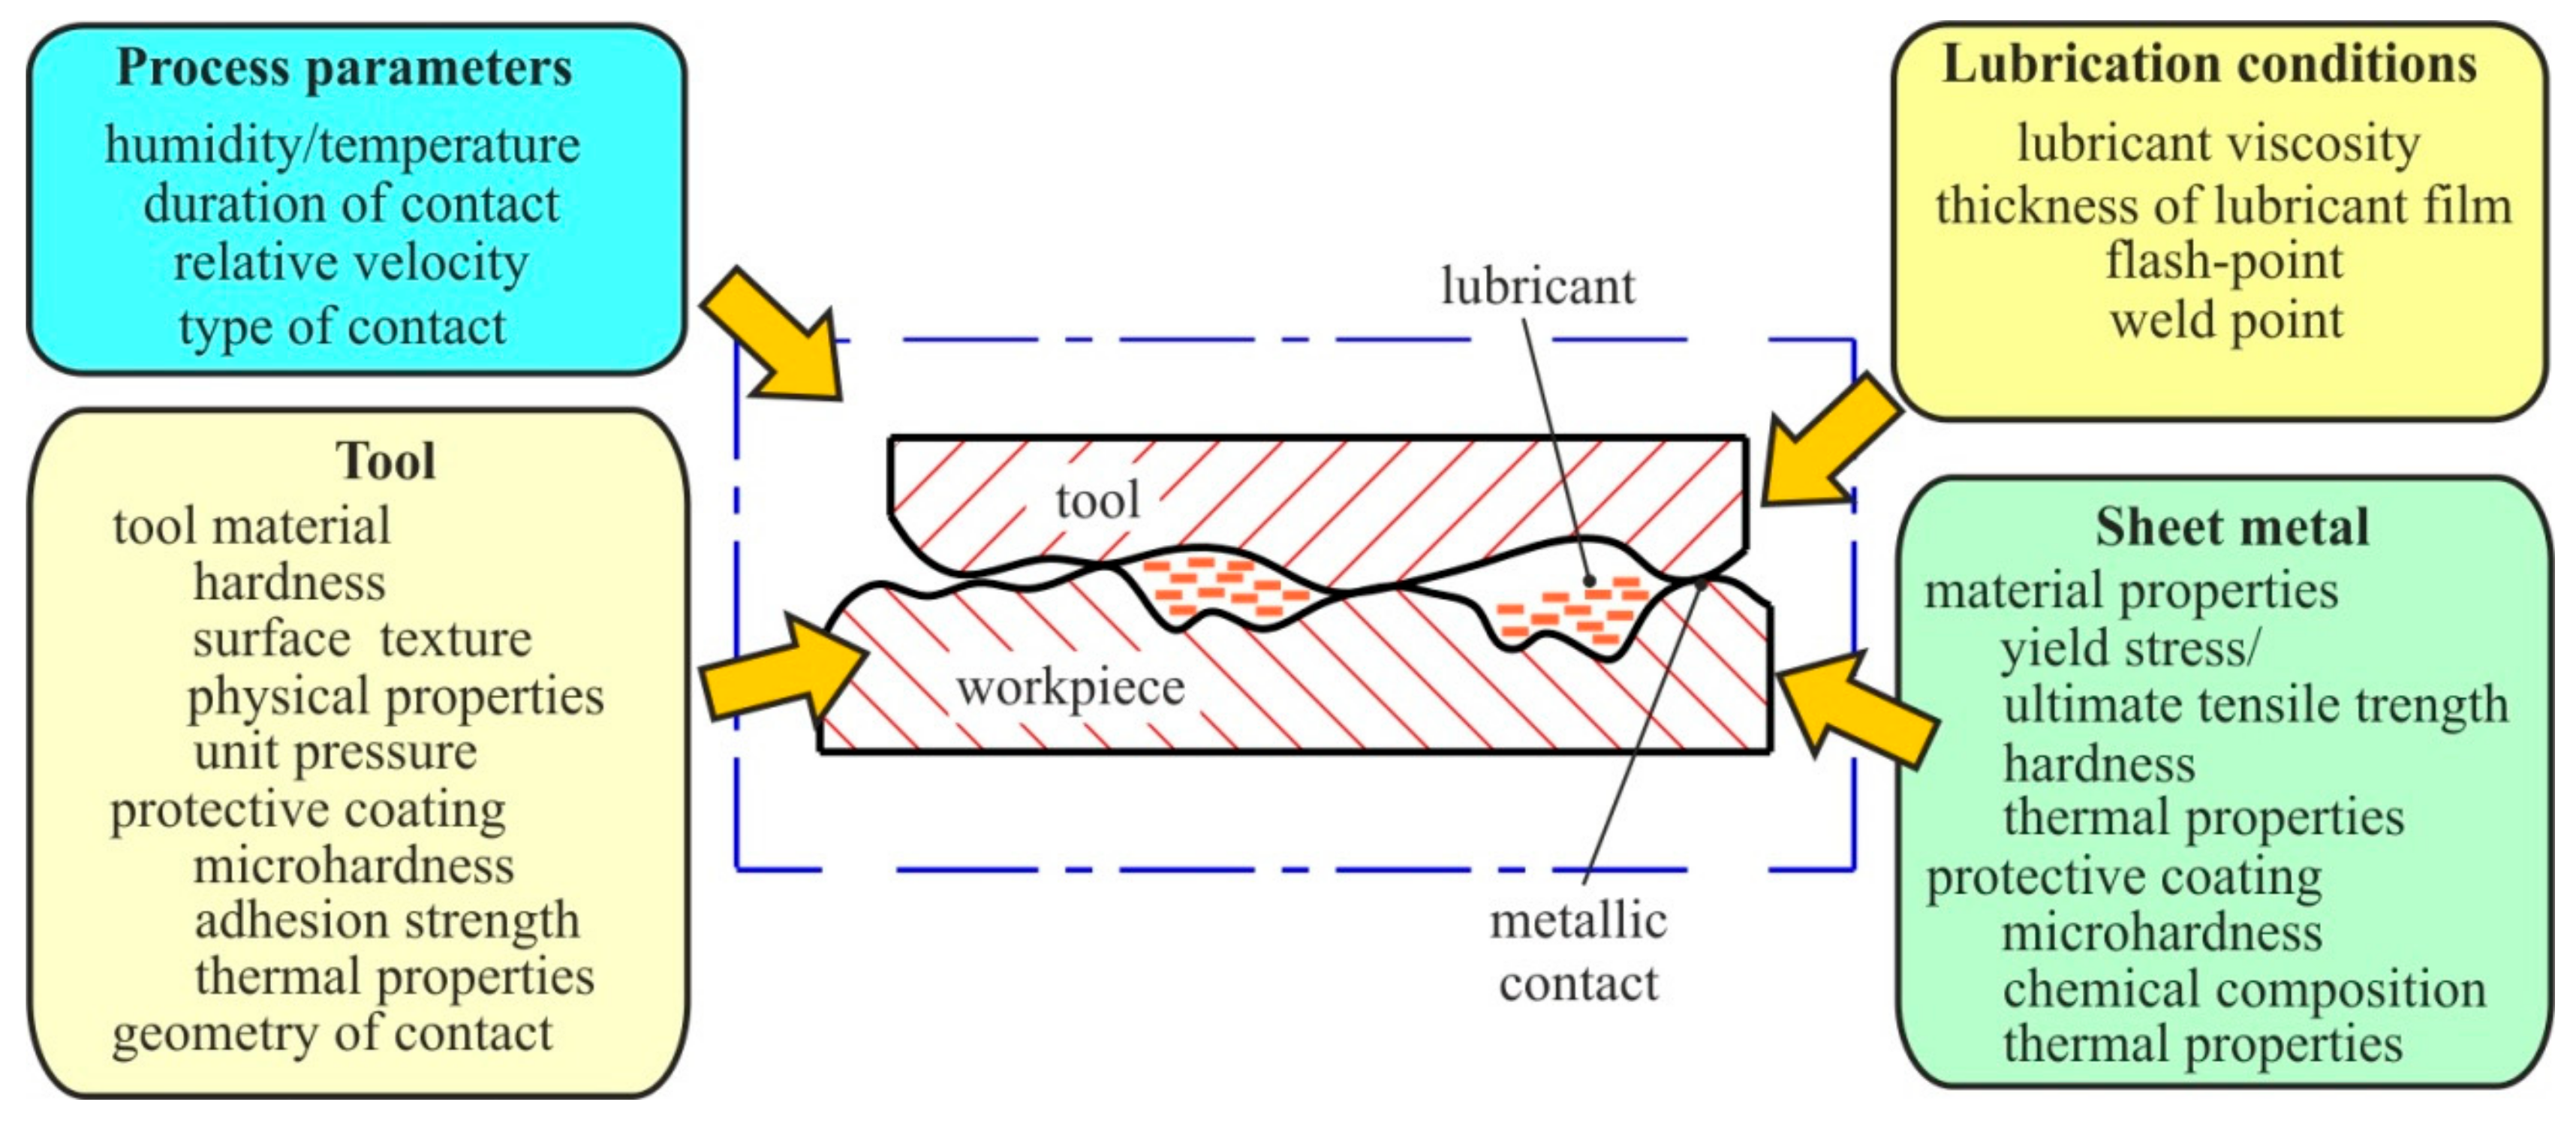
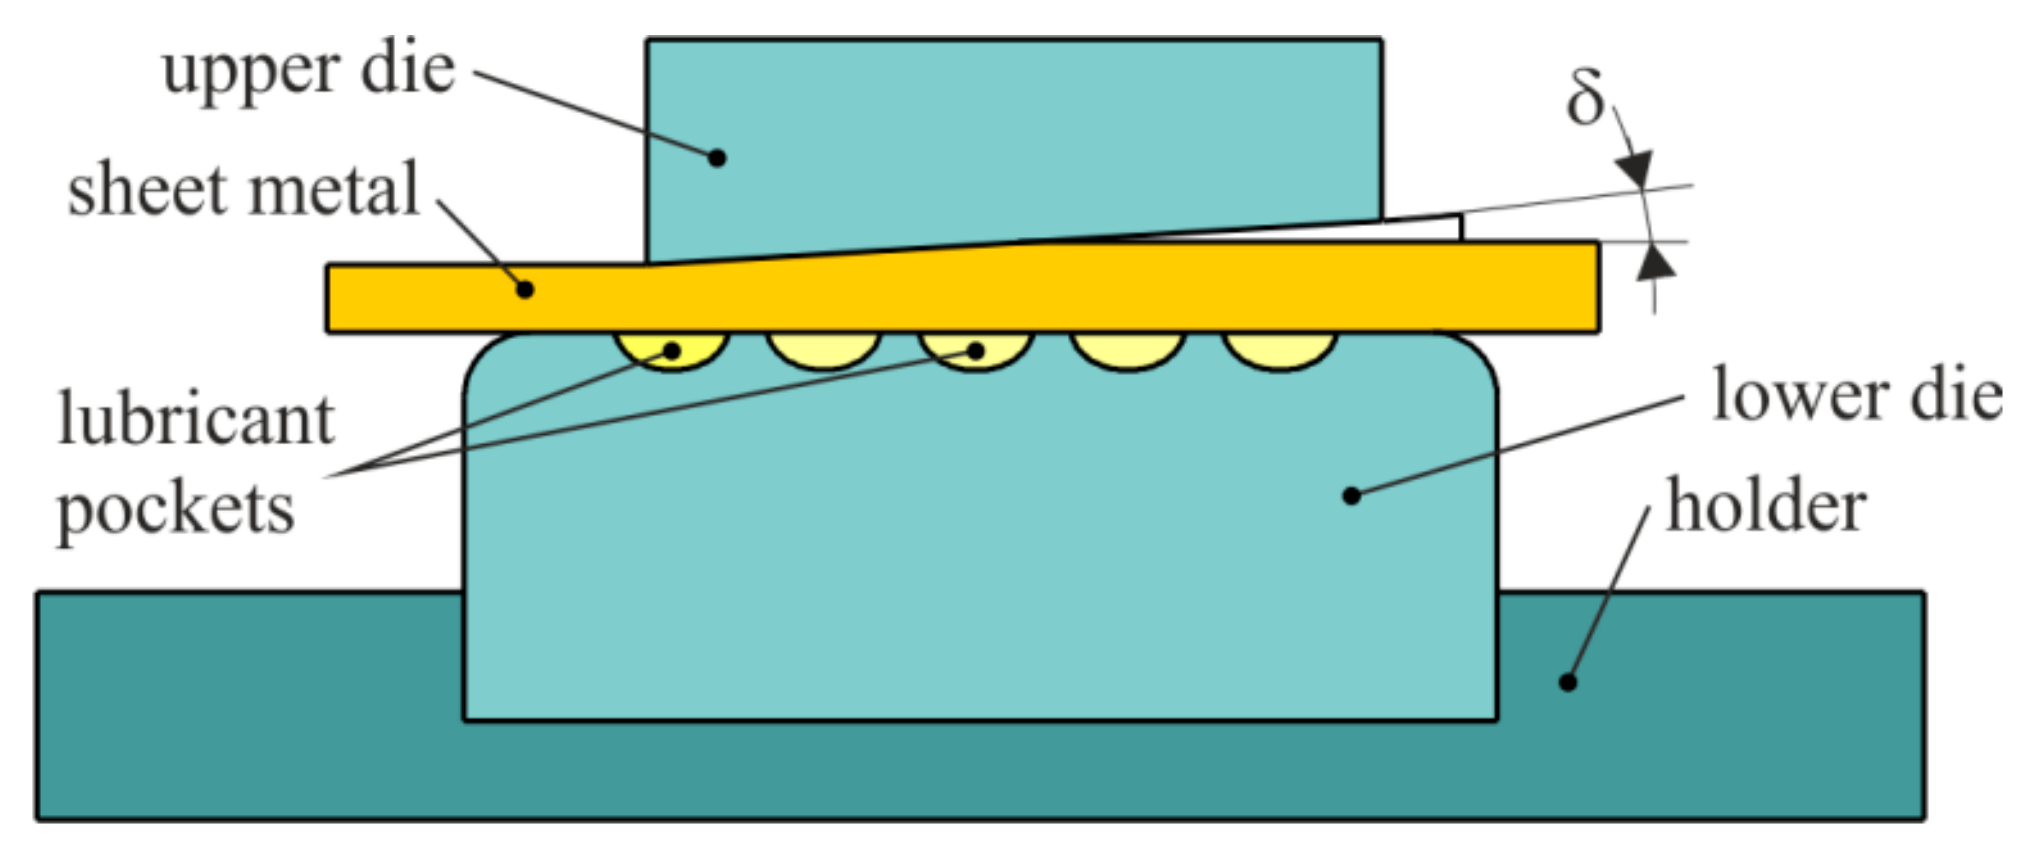
4.2. Friction Between Flat Dies

Strip drawing test (SDT) is used to model friction condition in metal forming, i.e., between the punch and the die wall. In this test, a plane specimen of the tool material is pressed against a strip of sheet metal, which is drawn simultaneously [15]. The strip is drawn between non-rotating counter-samples, which are mostly flat [14] or have cylindrical shape [13,15] (Figure 4). The existence of frictional forces between the contact surfaces assists in achieving better accuracy of measurement of the COF. Several parameters such as the pressure force between counter-samples, lubrication conditions, drawing speed, the surface roughness of the counter-samples and temperature do affect the change in frictional resistance.
The value of the COF is determined according to the formula:
μ = F P 2 F N
where FP is the pulling (friction) force, FN is the normal force.
The SDT has been studied by many authors to determine the COF in a wide range of process parameters. The experimental results determined by Trzepieciński et al. [15,35] have determined several relationships that show the effect of lubricant conditions, surface roughness and the orientation of the sheet metal on the value of the COF in the forming processes. Vollertsen and Hu [36] used the SDT to identify the tribological size effects and develop a size-dependent friction function integration in finite element-based numerical simulations. Masters et al. [14] studied the friction behavior of metallic sheets at different levels of specimen strain. They found that the COF increases with the level of strain. The problem of the influence of the drawing speed and the directional surface topography on the value of friction resistance and the change of surface topography in mixed lubrication conditions in the SDT was discussed by Roizard et al. [37]. During the testing of sheets whose roughness ridges were oriented perpendicular to the direction of drawing, the friction force was 30% lower when drawing inversely oriented specimens. The analysis of surface roughness changes in aluminum sheets during a sheet-drawing test of cylindrical and flat counter-samples [38] showed a similar character of surface topography change, and comparable value of the COF determined in both tests.
The mean contact pressure between pins and sheet metal strip may be estimated by using the Hertz relation for a line contact under the elastic deformation with smooth surfaces [39]:
p n = π 4 F n b E * 2 π R *
where b is the specimen width, Fn is the applied load, E* and R* are the combined elasticity modulus and the combined radius, respectively, determined according to:
E * = 2 E 1 E 2 E 2 1 ν 1 2 + E 2 1 ν 2 2
R * = R 1 R 2 R 1 + R 2
where R1 and R2, E1, and E2, v1 and v2 are radiuses, Young’s moduli and Poisson’s ratios of bodies in contact, respectively.
Parameters that can influence friction and lubrication are also extensively studied in the last decade. Payen et al. [40] investigated mainly the role of contact pressure and of a chemical coating on the tribological behavior and the roughness changes of sheets surfaces in SDT, which they called the plane friction test. Applying an anti-adhesive coating reduced the local friction shear stress at the boundary contacts. As a consequence, the character of asperities deformation is changed in such a way that large levels of normal crushing of asperities can be reached with reduced debris generation [40]. Coelho et al. [41] tested EBT (Electron-Beam Texturing) zinc-coated trip 700 steel sheet under the strip drawing test with flat dies considering a real contact area in the die-sheet-die system instead of the apparent one. The results for flat contact friction demonstrate that a suitable combination of velocity and pressure is required to establish the micro-hydrodynamic effect under typical boundary lubrication conditions. The micro-hydrodynamic conditions of the boundary lubrication are caused by the plastic deformation of coating, which produces high hydrostatic pressure on the entrapped lubricant.
Venema et al. [42] used the strip-drawing test with flat dies to characterize tribological interactions between the tool and the sheet metal during hot stamping using hot friction draw tester with roller hearth furnace. The essence of the friction test is based on the SDT with flat dies. Their results show that the tool materials worn down by friction could be embedded in relatively soft sheet coating which subsequently causes plowing of the tool surface. Xue et al. [43] designed the strip drawing test, which consist in a combination of flat and convex dies (Figure 5). The authors did not describe the advantage of such a configuration over a flat and rounded counter-sample (Figure 4). The COF value may be determined using the commonly used Equation (1).
The motivation of the experimental investigations of Recklin et al. [44] was observed if different test stands of friction investigation show a significant quantitative difference in the friction value. The main reason for the deviation of the tribological behavior in different stands is the different stiffness. Moreover, the contact area of each test stand may be different. Therefore, Recklin et al. [44] compared two commonly used strip drawing tests and detected the causes of the deviation. It was found that the quantitative value of the mean COF over the contact pressure depends on the area of the contact surface. The second important conclusion is that the variation of COF over the contact pressure is dependent on the stiffness of the stand.
Kondratiuk and Kuhn [45] tested the COF of coatings in hot strip drawing experiments (Figure 6). The basic setup consists of a drawing device, a continuous electric furnace, a feeder section to transport the sheet metal strip. After placing a steel strip manually onto the chain drive, the strips are automatically transported into the furnace using a motor-powered chain drive. The strip is then transported into a hydraulic holding device when the pre-specified dwell time has been reached. Next, the tool closes, and the strip is compressed by applying a load acting between the upper and lower tool and is drawn through the drawing device.
The COF can be calculated using Equation (1) as a function of drawing distance. The results of investigations allowed the individual tribological characterization of the hot-dip-aluminum–silicium and electro-plated zinc alloy coatings for hot forming applications. The effectiveness of the use of lubricants to decrease the forming load in hot stamping of Al-coated 22MnB5 steel was studied by Uda et al. [46] in hot strip drawing test. Al-coated 22MnB5 steel is widely used as the sheet material in hot stamping. Technically, the used device is very similar to that used by Kondratiuk and Kuhn [45]. Based on the results of the experimental tests, a new high-performance lubricant for hot stamping was developed. Tokita et al. [47] studied the effects of the temperature deviation due to contact with the tools and the COF at high temperatures on stretch formability at a high temperature using a high temperature sliding test. Experimental testing of HR steel sheets conducted under warm forming conditions shown that, in forming in the low-temperature range (200–400 °C), the influence of the COF on sheet formability is dominant in spherical stretch forming. The COFs of both the hot rolled and galvannealed coated steel sheets at a high temperature were higher than those at room temperature.
The above-mentioned test (Figure 6) was performed outside the furnace, and hence it is not exactly isothermal. Shi et al. [48] designed a friction rig intended to make isothermal tests at elevated temperature. Using this test rig, the frictional properties of the sheets in SDT was studied. The rig is universal and can be fitted to any universal testing machine equipped with the furnace chamber. The vertical force of pulling the sheet between counter-samples is measured by testing machine, and the normal pressure is applied to test-piece by the gravitational force of the weights via a lever mechanism.
The correlations between the tool surfaces and friction in SDT with flat dies were determined by Merklein et al. [49]. In this study, diverse finishing strategies were employed on the surface of the tool. Tribological performance of tool surfaces fabricated using different finishing strategies was investigated by conducting strip drawing tests under dry conditions. From the results with lubricated strips, it was found that the preferential direction orientation has a lower influence on the friction compared to the roughness. Moreover, the orientation of grinding marks in the tool surface has a notable influence on the friction under dry conditions.
Tests with the rotary movement of the tool consist of placing a specimen in the form of a ring or a disc between the anvil of a testing machine and the counter-sample performing a rotary movement along the axis of the specimen. During the test, the tangential force and normal force are measured in the contact area. As a counter-sample, flat (pin-on-disc) [50] or spherical (ball-on-disc, Figure 7a) [51,52,53] pins, as well as ring-shaped tools (Figure 7b) known as twist compression tests (TCTs) are used. The frictional resistance can be determined for different slip speeds, lubrication conditions, and pressure forces.
During the pin-on-disk tests, the friction force and the slip distance for the first disk revolution are measured using a computer program that registers and controls the values of the friction force as a function of time. The COF value was determined from the values of both normal FN and friction FT forces using the formula in Equation (5):
μ = F T F N
The apparent pressure pc in the pin-on-disk test with flat pin may be evaluated from the friction band width, bf, which can be assumed to be equal to the diameter of a circular contact section. Thus, the apparent pressure for each test was calculated from [41]:
p c = 4 F N π b f 2
where FN is the normal force, and bf is the width of friction band.
The results of investigations using pin-on-disc tribometers where the length of the friction track is arbitrary, cannot be compared with measurements carried out on the work stations with the to-and-fro motion of the counter-sample. Due to the cyclic contact of the counter-sample with the surface of the sheet being tested and the concentrated nature of the contact, the COF value representative for a given surface can only be determined for the initial stage of the friction process. In this manner, one can determine the anisotropy of the value of the COF according to the rolling direction of the sheet [51,53].
The use of tribotesters to determine the COF of plastically deformed sheets is limited due to the nature of the concentrated contact, whose presence in the real deep-drawing processes is limited. Moreover, the low ratio of the yield strength of the workpiece material and the counter-sample material allows the rapid initiation of wear processes. The superficial contact of the counter-sample with the sheet surface being tested is assured by a method using an annular counter-sample with a radius of external cylindrical surface r loaded with pressure p (Figure 7b) [10]. The value of the COF in the TCT is determined based on the following formula:
μ = T A × p × r
where T is the torque, A is the surface area of contact, p is the normal pressure, and r is the radius of the external cylindrical surface.
Kim et al. [22] used TCT to establish guidelines on how to select the optimum combinations of die materials, coatings, and lubricants for stamping of galvanized AHSS (DP600, TRIP780, and DP980) for automotive structural parts. Ball-on-disc tests were used to a large extent in describing the tribological behavior of materials in the contact region and to determine the COF [13,14]. It is important to note that these tests are quite similar to scratch tests and are different from ring compression tests and pin-on-disc tests. They generate apparent friction that may contain two integrated components, i.e., shear friction and plowing friction [52].
Pin-on-disc tester was used in the study reported by Dou and Xia [55], which described the effects of the normal loads and the sliding velocity on the friction characteristics between the stamping die and the sheet metal under the boundary lubrication. From this study, it was observed that the friction mechanism between sheet metal and the die is mainly abrasive wear and plowing wear, with slight adhesive wear.
Reports from some researches [56,57] indicate that the measured COF is usually higher when the sliding direction is parallel to the grinding lay. Ajayi et al. [53] used a pin-on-disc tribometer and investigated the role of surface texture, especially the effect of grinding lay on frictional behavior of the boundary lubrication regime. The results indicated frictional anisotropy of the directionally ground AISI 8620 specimens in the entire speed range of the test, although it is more apparent at low speed, and that the magnitude of the friction variation spikes is significantly reduced. At such high speeds, where the spikes are lower and closer together as a function of time, the frictional anisotropy may be mistaken for noise in the friction measurement system.
Interface friction of the ball-on-disc test under a high temperature is studied by Wu et al. [58]. A shematic illustration of the test stand is shown in Figure 8. A full contact model is developed to assess the lubrication of this testing mechanism and to decouple the contributions of solid-solid contact asperity to the interface friction stress. It was found that the temperature increase can significantly influence the lubricant performance. This can be due to the effect of lubricant additives. Furthermore, in the boundary lubrication regime, friction is sliding-speed dependent because the interaction of the solid layer may be formed by lubricant additives when the temperature of the lubricant increases.
Experimental testing of high steel sheets under hot stamping conditions using a high-temperature pin-on-disc test carried out by Ghiotti et al. [59] reveals that the blank temperature and contact pressure have a larger influence on the COF that typically can reproduce the condition in industrial processes. Moreover, the cooling rate does not affect the surface characteristics, in the range variations typical of the hot stamping. It was found that with increases in stamping temperature, the COF decreases. This can be explained by a reduction of shear strength of coating with the temperature.
Ball-on-plate Sliding Test (BST) is designed by UMT-TriboLab. The apparatus allows high-temperature reciprocating wear and is equipped with a resistance furnace. Figure 9 shows an illustration of the test set-up. A special clamping fixture was designed to ensure that there exists no slipping or movement of specimens while testing. The electro-mechanical drive allows us to carry out the ball-on-plate tests and assuring the existence of constant pressure at the contact interface [27]. The COF under different conditions can be calculated using the classical Coulomb′s law (Equation (5)).
Lu et al. [27] conducted experimental investigations on the unlubricated reciprocating sliding friction and galling behavior of 7075 aluminum alloy sheets at different temperatures. The results allow connecting the process temperature with the friction mechanism. Conventional scratch tests may be modified in order to obtain a well-controlled slipping contact as in BST. For example, Carlsson et al. [60] used a steel ball of diameter 7.5 mm instead of the Rockwell C diamond stylus with a radius of 200 μm. Based on the experimental test of friction of Dogal® and Aluzink® sheets, they concluded that compared with the BUT (Bending Under Tension) test, the modified scratch test, and the pin-on-disc test are easy and rapid to perform.
Kirkorn et al. [9] conducted investigations on the frictional behavior of a number of conventional tool materials that are used in the sheet forming industry employing a novel method of COF measuring based on flat-die strip drawing. According to the authors, the uniqueness of this device (Figure 10), compared with existing tribotesters used in sheet forming applications, is the ability to fully control the applied normal force and drawing velocity during experimental studies. A more comprehensive description of the functionality of the tribotester used can be found in [61]. The developed device enabled comparison of different tool steels, surface treatments, coatings, and lubricants in terms of galling and friction under real SMF process conditions. The normal and shear forces were measured, and the COF is calculated using Equation (31).

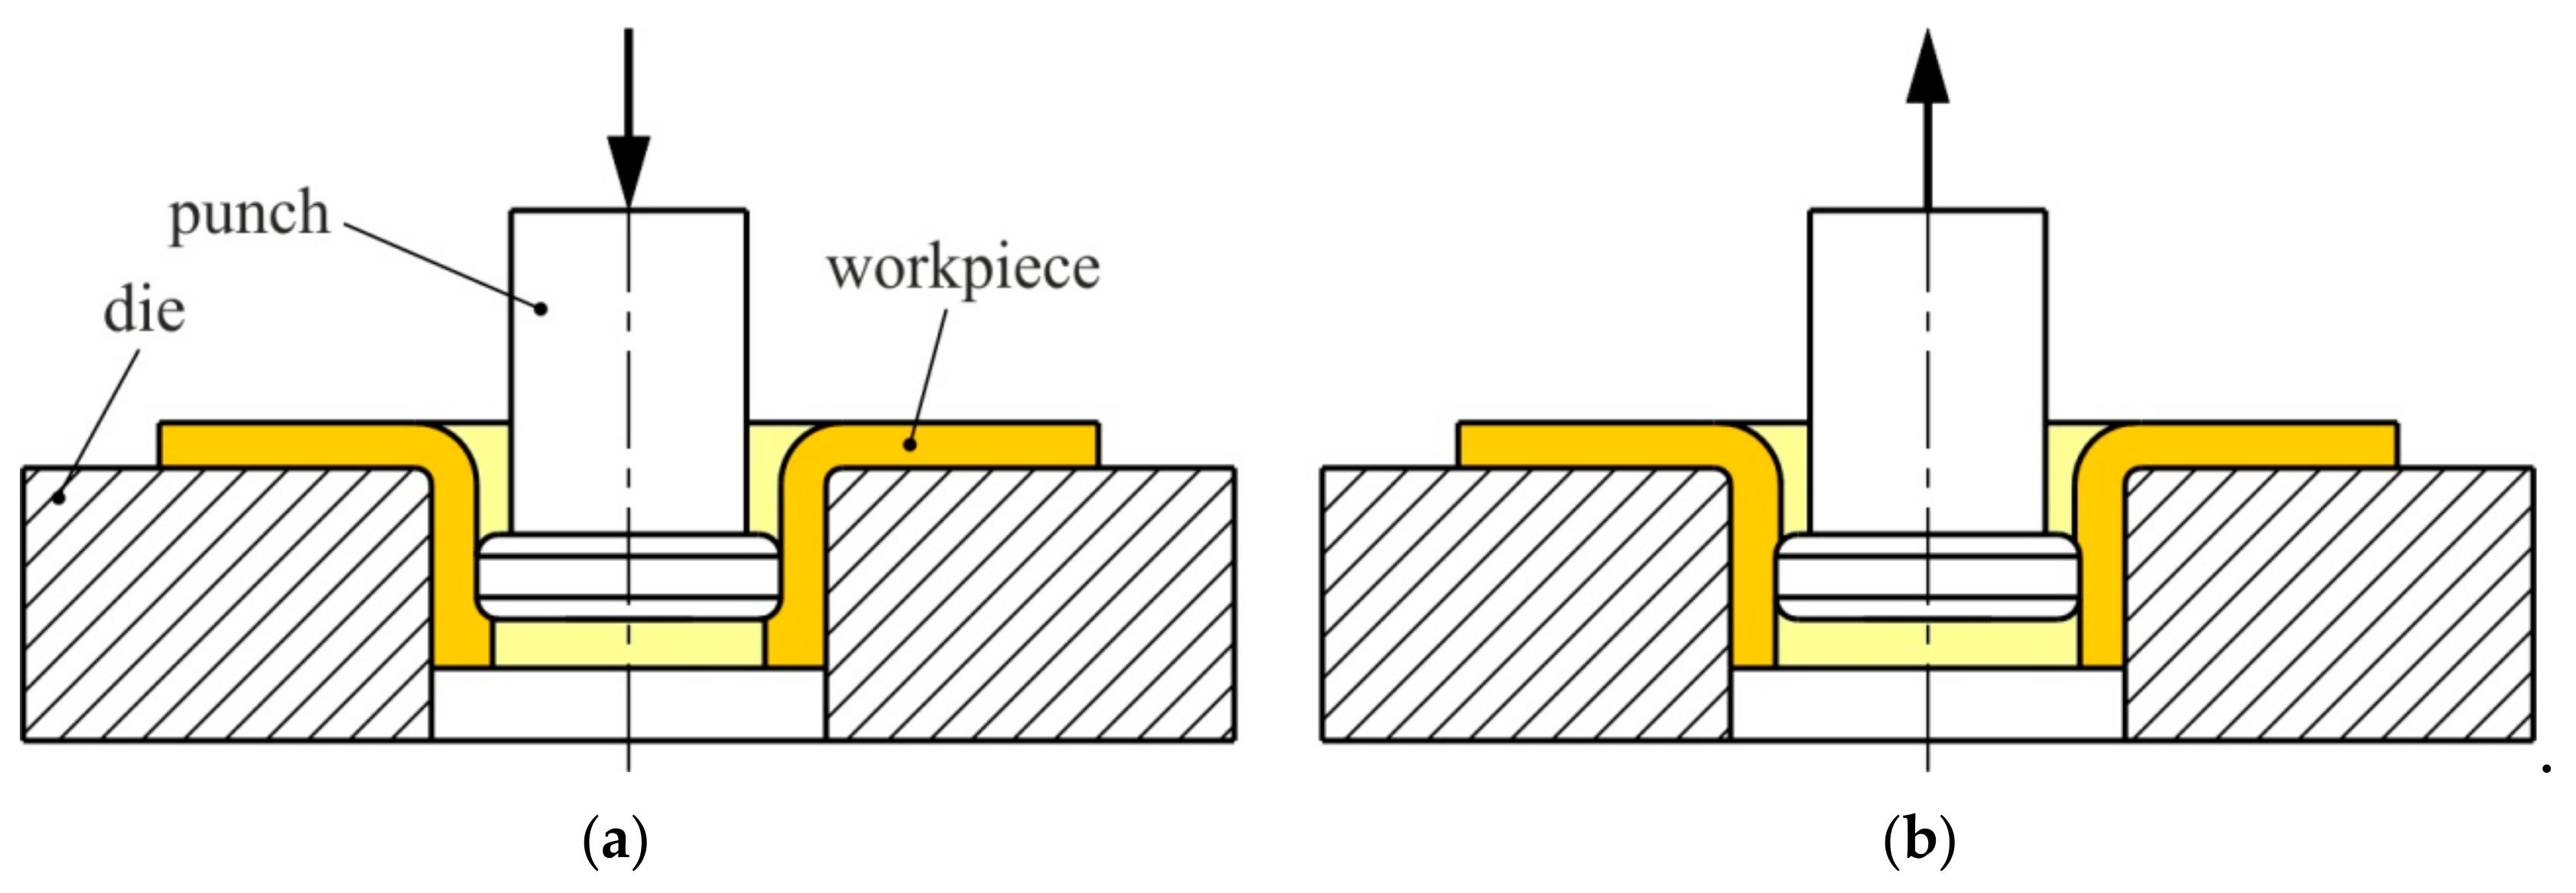
4.3. Friction in Ironing in a Conical Die

Strip Reduction Tests (SRTs) represent severe tribological conditions with low slipping length, high normal pressure, and surface expansion. Some types of SRTs are tests carried out with a reduction of the sheet thickness between flat [62] or cylindrical [38,63] counter-samples. One of the first experimental approaches for the simulation of the ironing process was developed by Fukui et al. [64], who made direct measurements of friction force in metal-strip drawing where the strip was made to reduce between two stationary dies. The COF is defined as the ratio of normal force and tangential force occurring during sheet drawing between cylindrical surfaces (Figure 7a), and this relation is expressed as [65]:
μ = F T 2 F N tan α 2 2 F N + F T tan α 2
where FT is the pulling (friction) force, FN is the normal force and α is an angle of the arc contact area (Figure 11a), which may be determined according to the formula:
tan α 2 = g 0 g 1 4 R g 0 g 1
where R is the radius of the rounded edge of the counter-sample, g0 is an initial sheet thickness, and g1 is the final sheet thickness.
From the conditions of the equilibrium of the elementary section of the sheet between flat dies (Figure 11b), the relationship between the drawing force FT of the sheet and the pressure force FN is as follows [66]:
F T F N = 2 μ + tan α 1 μ tan α
Assuming that the value of the COF does not change along the contact surface between the dies and the plate, the value of the COF is given by:
μ = F T 2 F N tan α 2 F N + F T tan α
The SRT test has also been conducted by several researchers to simulate the ironing process [33,67]. This test is capable of simulating varying conditions such as drawing speed, reduction, sliding length, and the tool temperature [68]. The apparatus developed by Andreasen et al. [68] uses a round, non-rotating tool-pin instead of a wedge-shaped die (Figure 12). The test was conducted in such a way that the thickness of the sheet metal strip is reduced between a non-rotating tool pin (representing the conical die) and a supporting plate (representing the cylindrical punch).
The strip and the supporting plate are clamped together at the front end (corresponding to the punch nose in ironing). The two ends of the tool pins have square cross-sections that are designed to be mounted on two vertical guides that allow the change of the gap between the tool pin and the support the plate [68].
Recently, Moghadam et al. [63] developed the method of detection of the onset of galling in strip reduction testing using acoustic emission. They investigated the same apparatus as Andreasen et al. [68]. It was concluded that acoustic emission could be applied as a non-destructive measuring technique for assessment of galling in the strip reduction test emulates the ironing process. A direct correlation between the contact conditions and the generated acoustic emission events was found. Dohda and Kawai [69] proposed an alternative to Fukui et al.’s [64] strip-ironing type tribometer consisting of a bottom plate that is drawn with the strip through a wedge-shaped ironing die. Measurements carried out by Le and Sutcliffe [66] show that, in SDT, the change in friction is associated with a change in contact ratio between the tool and strip. Analysis of the surface drawn with rougher dies suggests that the lubrication has broken down, leading to the plowing of material picked up onto the tool surface.
Üstünyagiz et al. [33] proposed a new strip reduction test (SRT) for an industrial ironing process in order to replicate the severe tribological conditions involving sliding length, tool temperature, lubricant film and drawing speed. Sulaiman et al. [62] studied lubrication performance in SRTs with tools provided with longitudinal and shallow pockets that are oriented perpendicular to the sliding direction (Figure 13). They found that the distance between the pockets should be larger than the width of the pocket. By doing so, a topography similar to the flat table mount is created to avoid mechanical interlocking in the valleys. If the distance between the pockets is 2–4 times larger than the pocket width, the textured tool surface reduces friction and improves the lubrication effect.
In addition, Üstünyagiz et al. [33] proposed a new Continuous Strip Reduction (CSR) test that can replicate the extreme tribological conditions under forward stroke and backward retraction of the punch (Figure 14). To replicate the forward stroke, two stationary cylindrical tool pins are used to draw the strip from right to left while its thickness is reduced in section I (Figure 15).
The lower cylindrical tool pin is mounted on a heater block, which was used to adjust the tool temperature by an electric cartridge. The backward stroke of the ironing process is replicated in section II (Figure 15). This section provides a further reduction in the strip thickness, and the gap between the two stationary pins can, thus, be adjusted to a value slightly smaller than that utilized in section I. The test can simulate process parameters such as drawing speed, sliding length, strip thickness reduction and tool temperature. It is also possible to quantify the onset of the breakdown of the lubricant film and the resulting galling effect after several strokes during the forward and backward strokes.

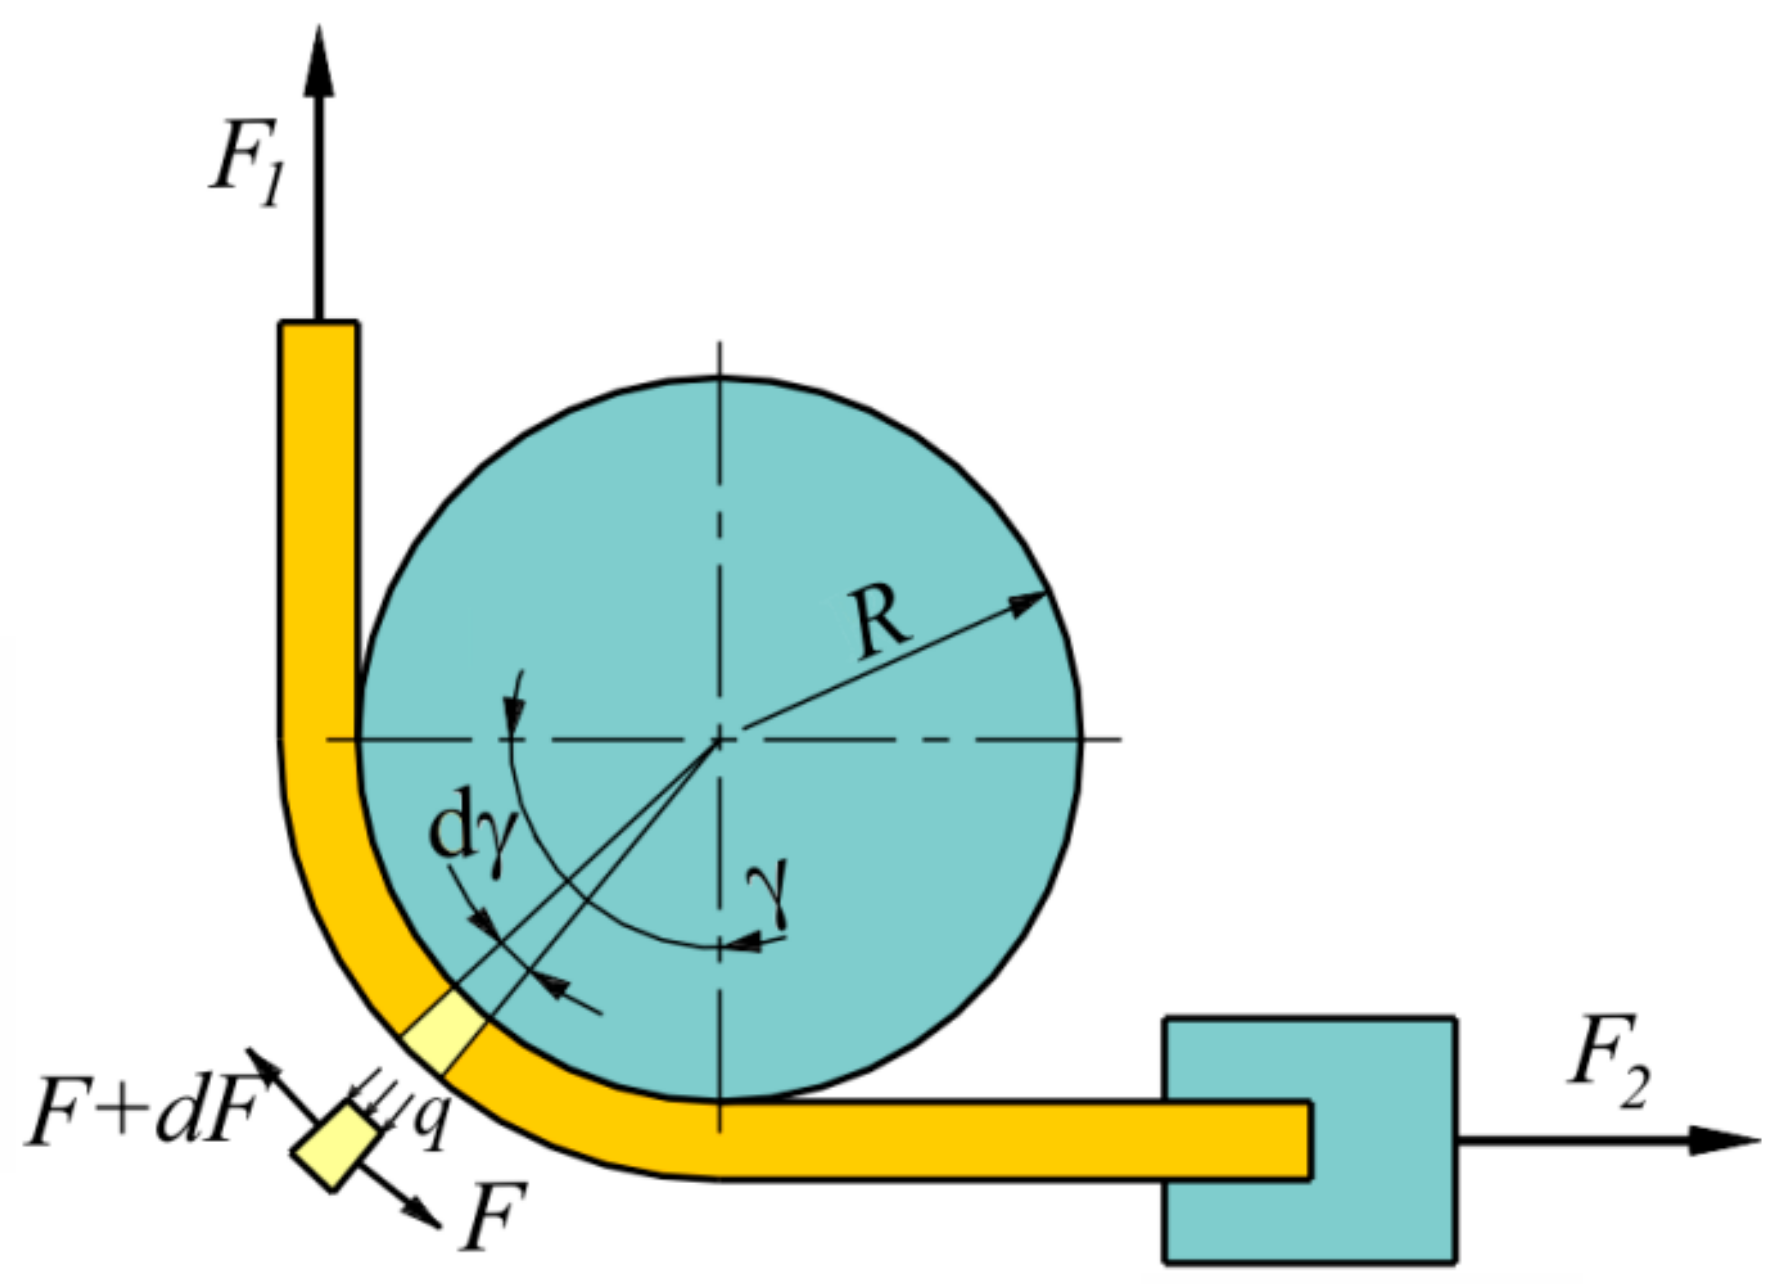
4.4. Friction Conditions in Die Curvature

The Bending Under Tension (BUT) test developed by Littlewood and Wallace [28] is attributed to the friction modeling on the edge of the die. The test consists of drawing the strip of metal around the cylindrical counter-sample (Figure 16). The traditional way of performing these BUT tests is by differential measurements using two sequential tests, one by drawing over a fixed circular cylindrical tool-pin, the other over a freely rotating pin, implying that no sliding takes place. Then an estimate of the friction is obtained from the difference in the front tension measured in the two tests.
Assuming that there is a constant COF µ in the contact region and the wrap angle γ (Figure 16) is constant during the test according to the equilibrium of all forces acting on an elemental cut of the strip dγ, it can be shown that:
F + q μ w R d γ F + d F = 0
q w R d γ F s i n d γ 2 F + d F s i n d γ 2 = 0
For a very small dγ, one can assume that sin d γ 2 d γ 2 and dF << F. Thus, combining Equations (12) and (13) gives:
μ d γ = d F F
Integrating Equation (14), and taking into account γ = π/2 the COF is determined to be:
μ = 2 π l n F 1 F 2
The average contact stress (unit contact pressure, q) in this case is determined from the following equation:
q = F 1 + F 2 2 w R
where w is the width of the strip, and R is the radius of the pin.
Trzepieciński and Lemu [32] developed a tribological simulator based on the concept of the BUT test. The test device is schematically shown in Figure 17. As illustrated, a grip supported by a load cell was used to hold the test strip at one end of the device. The specimen was wrapped around a fixed cylindrical roll and loaded in a tensile testing machine, ensuring contact over an angle of approximately 90°. Applying the fixed pin allows setting up the rolls in four positions, which enables the utilization of the full circumference of the roll. The tensile forces F1 and F2 can be measured simultaneously during the test. A major benefit of this test setup is that strain it is not necessary to measure the strain in order to determine COF. For some tests, the effect of strain on COF can be of interest, while the use of an extensometer may not be reasonable or warranted in some other cases.
Furthermore, the BUT test allows determination of the change of COF during the process of stretching the specimen over the roller. This change may be related to the change in sheet topography and increased normal pressure due to sheet deformation [15,70]. Furthermore, it may be related to a change in the contact conditions as a result of the strain hardening phenomenon. As a result of the friction resistance existing between the roller and the sheet, one gets F1 > F2 (Figure 17). Weinmann and Kernosky [71] developed a transducer that can be used to measure tension in metal strip while letting it move over the die shoulder. The transducer portion that is simulating the die shoulder is cylindrical and mounted on the body on a pair of bearings. Similar to the BUT test, the friction was determined based on both the front and back-tensions. So, the friction is not measured directly. Bay et al. [16] developed a test design that is variant of that of Weinmann and Kernosky [71], which measures not only back and front tensions but also the torque on the counter-sample (pin) directly. The friction apparatus is designed in such a way that the sheet strip clamped in two claws is bent around a non-rotating pin. Drawing the strip with the front claw while breaking the back claw ensures sliding of the strip around the pin under the controlled back-tension. To simulate the influence of varying tool temperature, authors designed electric heaters which can be inserted in the tool-pin holder. Moreover, in order to control the temperature, water-cooling channels were drilled in elements of friction apparatus.
Dilmec and Arap [72] proposed a test apparatus to measure the COFs for both the flange and the radius regions using only a single experiment. The operating procedure of this apparatus is based on the principles of strip drawing test and BUT methodology. Since the press moves vertically, the flat die simulator and the radial strip drawing test could not be individually designed. The section of the system that represents friction conditions at the die radius region, is shown in Figure 18. The COF for the radius region can be calculated using the front tension force registered by the press control system and the back-tension force using the Euler equation (Equation (15)). Then the analysis of variance method was used to investigate the effect of the blank holder force, die radius, drawing speed, the surface roughness of the tools, and the type of lubrication on dynamic COF between the sheet metal flange and the radius regions of the tools.
Many experimental and numerical works have contributed to the knowledge about tribological phenomena on the edge of a rounded die [70,73,74]. The BUT tests consist of making differential measurements by carrying out two tests, one after the other, one by drawing over a fixed circular roller, the other over a freely rotating roller [74]. A major drawback in all studies of BUT test is that friction measurement requires repeated measurements of the front and the back forces.
In another variant of the BUT test, the bending force can be determined by conducting the test with a free rotating roller or in conditions of minimized friction between the roller and the plate. The difference in the values of tensile forces for fixed and rotating rollers is attributed to the bending force of the sample around the roll. The test is carried out in two stages (Figure 19) [75]—(1) with a blocked roller and (2) with a mobile roller.
Taking into account the influence of sheet thickness and the radius of the counter-samples, the dependence relationship determining the COF based on the measurement of tensile forces in both stages is as follows [75]:
μ = 1 γ 2 R + g 2 R l n F 1 a F 1 b F 2 b F 2 a
where R is the radius of the counter-sample, γ is the contact angle, g is the sheet thickness, F1a is a pulling force on a fixed counter-sample, F1b is a pulling force on a rotatable roller, F2a is a back-tension force on a fixed counter-sample, F2b is a back-tension force on a rotatable roller, Fb = F1b – F2b is the bending force of the specimen over the roller.
Sniekers and Smits [76] used a torque sensor on the pin in the BUT test to avoid the second step of the test when the pin is free to rotate. In this method, the COF is determined by measuring the torque from:
μ = F 0 D R F 1 2 + F 2 2 F 0 D R 2
where F0D represents the torque on the pin (Figure 20), F1 and F2 are the pull force and the back-tension force, respectively.
The ratio of the friction stress τ [77] and the contact pressure p given by Equation (16) giving the COF are given by Equations (19) and (20), respectively.
τ = 2 T π w R 2
μ = 4 T π R F 1 + F 2
where w is the strip width and R is the pin radius.
Sube [78] proposed a variation of the Equation (20) as:
μ = F 1 + F 2 F b 2 w R
where Fb is the bending force obtained as a difference of the pull force from the back force (Equation (22)), represented by F 1 * and F 2 * in Equation (22), respectively. These forces are obtained when the test is conducted with the pin free.
F b = F 1 * F 2 *
Direct measurement of the central force induced in the specimen is not possible in the BUT test [79]. This can be a serious problem when the specimen is made of a material that is strain-rate sensitive because it may lead to force estimation errors and, as a result, substantial errors in COF calculations. One of the limitations of the BUT test is the difficulty of isolating the bending effect based on theoretical calculation from the approximated equation of Swift’s bending force. To overcome this limitation, Hassan et al. [79] developed a BUT punch friction test in which an improved analytical friction model that accounts for the bending was proposed. This proposed method enables direct measurement of tensile forces from F1 and F2 (Figure 20). Punch displacement is then measured using displacement capacitive transducer. The pin holder of the rig is supported by a specially designed head that can replace the chuck.
In general, the friction coefficient value can be determined from [79]:
μ = 1 θ l n F 1 F 1 + F b
where Fb is the bending force.
In order to isolate the effect of friction from that of bending and hence compensate the bending effect, two test methods are commonly employed: (1) using a fixed pin and (2) using a rolling pin. The actual friction coefficient is then calculated using an equation proposed by Wagoner et al. [80]:
μ = 1 θ l n F 1 F 2 p i n 1 θ l n F 1 F 2 r o l l e r
where θ is the angle of contact between specimen and roller/pin.
Gali et al. [81] developed the hot forming friction measurement setup (Figure 21). This tribometer is capable of measuring the COF between the pin and a metallic strip contact stretching at different strain rates and temperatures. The apparatus consisted of a friction measurement assembly and a loading system, with two synchronized linear actuators that apply a constant strain rate to the sample. A strip was placed around the rotating heater and pulled on both ends by a tensile force. The strip was also compressed by the steel pin, which has an embedded load cell to measure the normal load. The tribometer was developed at the University of Windsor, and the principles of its operation, including the details of the strain measurements, are described in an earlier paper of Das et al. [82]. They additionally installed a camera system over the top face of the strip to measure changes in the initial diameter of circular grids inscribed on the strip’s surface and then used it for in-situ evaluation of the major and minor strains in the hot zone. The results of testing AA5083 aluminum alloy sheets at different temperatures showed that COF increased, and this can be attributed to the effects of softening tribolayer at high temperature and abrasion at low temperature [81].
While forming the draw pieces with complex shapes, such as car bodies, it is important to utilize dies having varying outline curvatures. When cylindrical counter-samples are used to model friction conditions on dies with varying outline curvatures and varying radii of edge fillets, it is difficult to get results on the edge of the die that fully reflect the friction conditions. To overcome this limitation, Trzepieciński and Lemu [32] proposed an experimental and numerical method to describe the friction in sheet metal forming. Due to the rounded shape of the proposed counter-samples (Figure 22), it was found necessary to employ a different method of determining the forces can eliminate friction through the steps listed below [32]:
  • determining the pulling and back-tension forces experimentally, i.e., by friction test, using a counter-sample having a non-cylindrical profile,
  • using numerical methods to determine the pulling and back-tension forces under frictionless conditions (μ = 0) employing a counter-sample with a non-cylindrical profile.
Considering that the sample is bent at an angle of 90° while conducting the friction test, the COF is determined by [32]:
μ = 1 γ 2 R + g 2 R l n F 1 e x p F 1 n u m F 2 n u m F 2 e x p
where R is the counter-sample radius, g id the thickness of the sheet, F1exp is the pulling force (experimentally determined), F1num is the pulling force (numerically determined), F2exp is the back-tension force (experimentally determined), and F2num is the back-tension force (numerically determined).
The knowledge of intensity and distribution of the contact and friction stresses over the die surface in SMF is important both from the tool wear analysis and the die design. Jurkovic et al. [83] proposed a method of defining contact stresses and determination of COF. A more detailed figure can be found in the aforementioned reference [83]. For the determining method of direct contact stresses, the authors elaborated and designed sensors for the measurement of normal stresses and tangential contact stresses. The contact stresses are measured by means of pins with transducers.

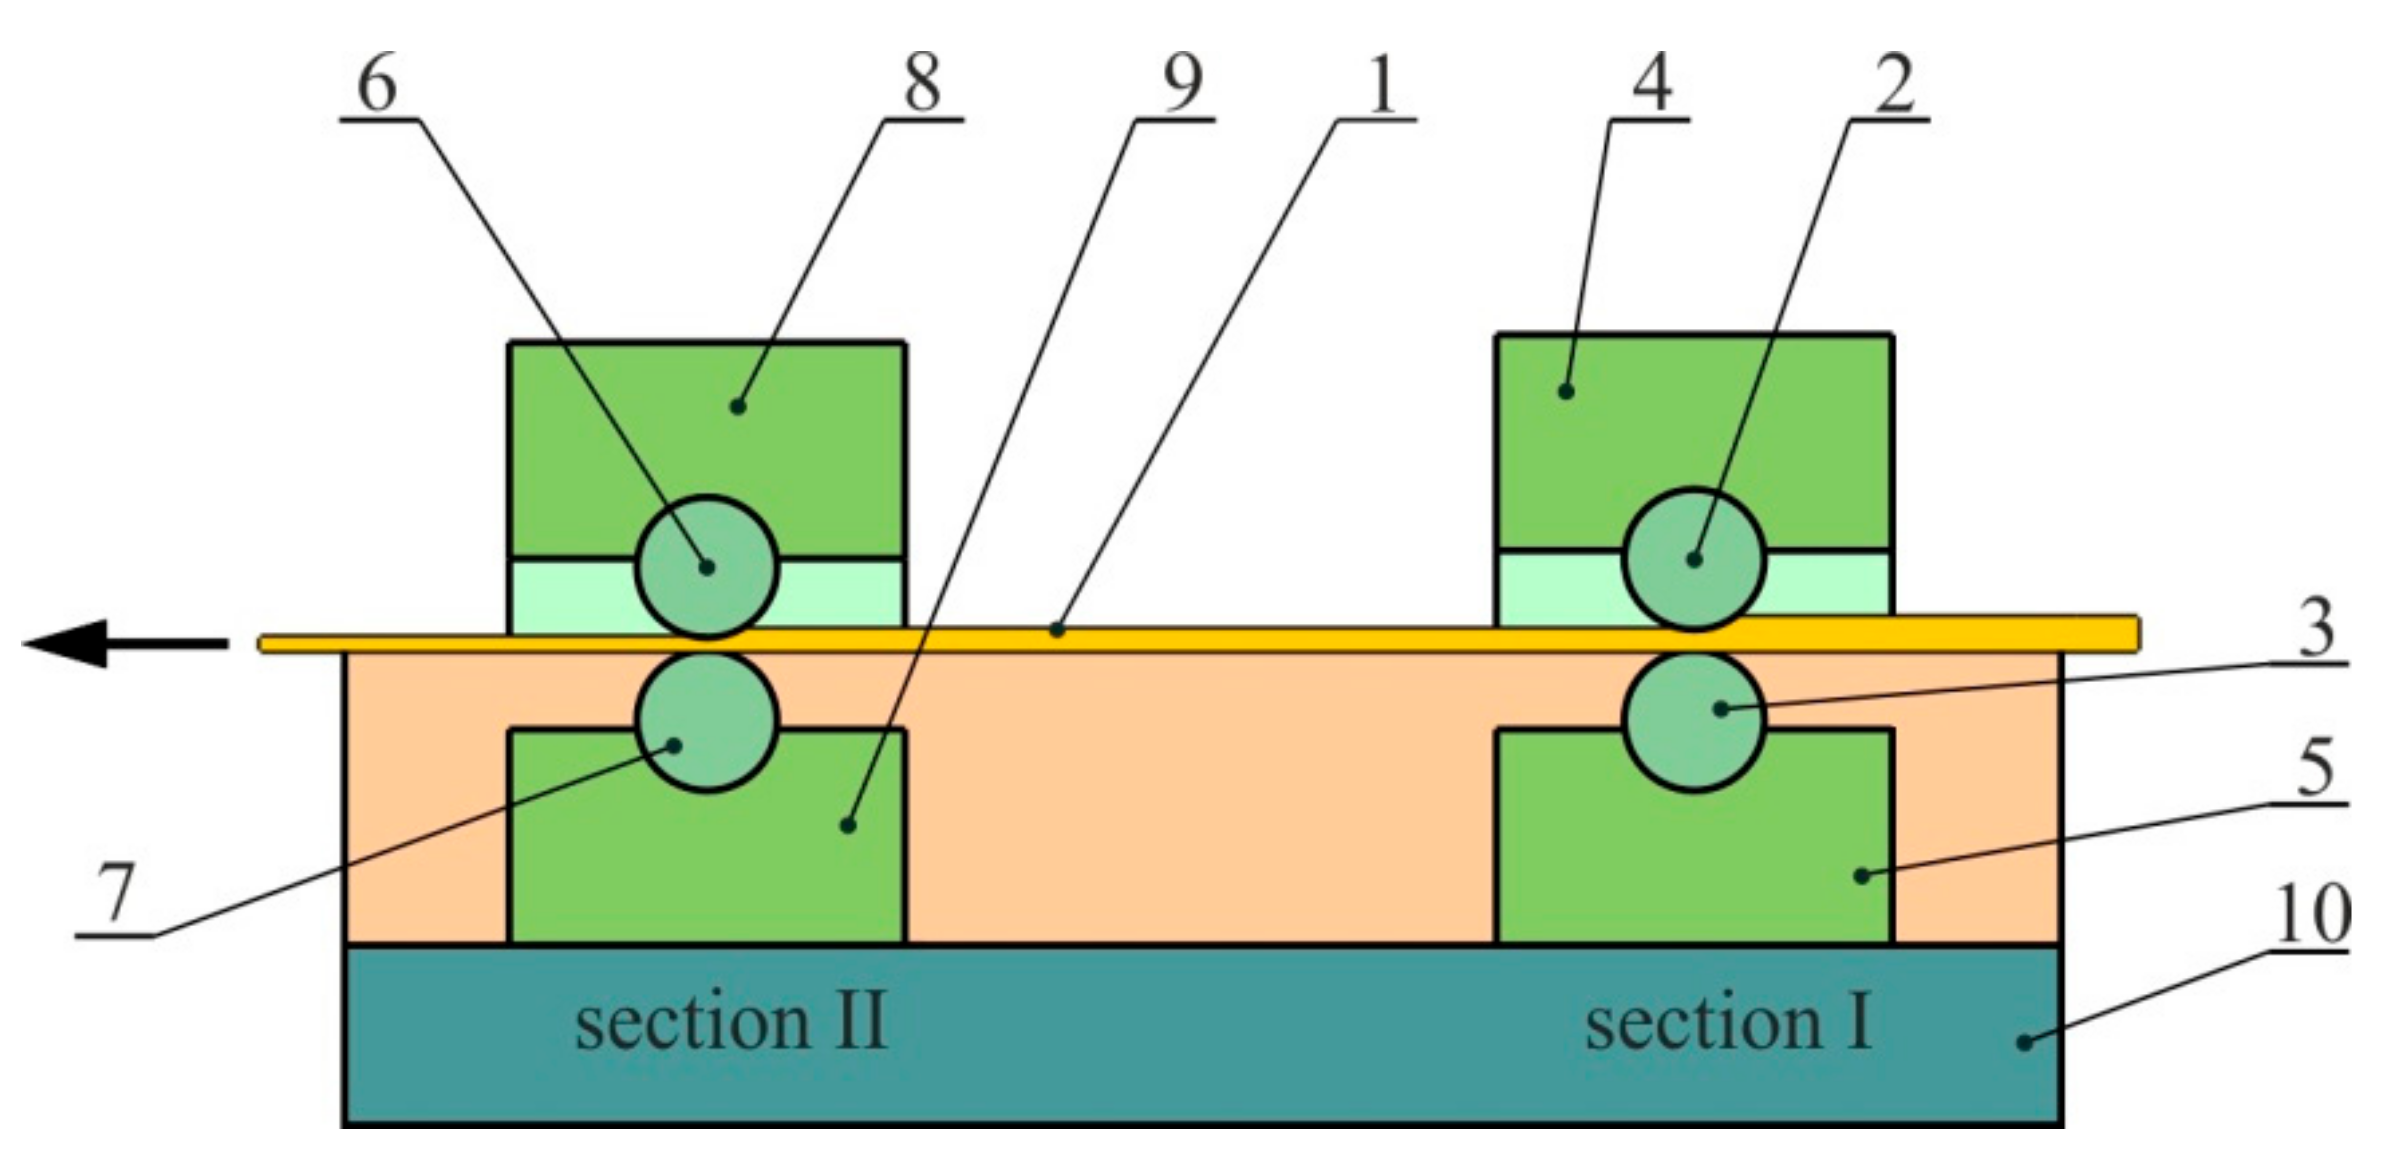
4.5. Friction Testing in the Draw Bead Region

The draw bead test (DBT) is a concept developed by Nine [84] for friction modeling at the draw bead in sheet metal forming. Draw beads compensate for the material flow resistance around the perimeter of the draw piece or to change the stress state in specific regions of the draw piece. The curvature of the metallic sheet passing the draw bead model (Figure 23) changes frequently. Thus, the aim of the method is to enable separation of the deformation resistance in the sheet from the frictional resistance. In DBT, the values of the pulling and the clamping forces are measured when pulling the strip over fixed (Figure 23a) and rotating (Figure 23b) rollers. Drawing the sheet over the set of rotating rolls minimizes the frictional resistance.
When the wrap angle of the middle roller is 180°, the difference in the drawing force for the rotating and fixed rollers may be attributed to the friction process and used to calculate the value of the COF according to the relationship [84]:
μ = F F F R π · N F
where FF is the pulling force, FR is the pulling force, and NF is the normal force or clamping force. These forces are obtained from the fixed rolls, the freely rotating rolls, and the fixed beads, respectively.
The change of friction conditions may be obtained by changing the lubrication conditions, shape, and dimensions of the draw bead model, wrap angle of the counter-sample, and the drawing speed of the sheet [85]. The influence of the manufacturing tolerance of the sheet metal on the disturbance of the recorded forces is often omitted in DBTs. The influence of the values of surface roughness parameters on the value of the COF was discussed in detail in Skarpelos and Morris [86], which found that metallic sheets with a higher Ra parameter showed a lower value of COF.
The value of the COF for a wrap angle α different from 180° is determined from [87]:
μ = s i n α 2 a P F P R N F
where α represents a quarter of contact angle of the actual engagement of the strip over the middle roll.
The difference between forces PF and PR in the numerator of Equation (27) is the force that expresses the frictional resistance. This force is a component of frictional resistance occurring in the direction of the sample drawing. This resistance is associated with the occurrence of friction on the entire length of the contact arc on each of the three rollers equal to 2α = π rad (Figure 23c). The value of the friction force FT = PFPR is burdened with the error resulting from the assumption that the use of rotating rollers eliminates friction. The normal force NF is a component of the resultant pressure on the direction normal to the direction of drawing the sheet, and thus, the value of the COF determined according to Equation (27) cannot be identified with the classical Amontons–Coulomb friction coefficient.
When the middle roller’s maximum displacement becomes equal to its diameter, its wrap angle becomes different from 180°, because it is necessary to ensure adequate clearance c (Figure 23c) between the counter-samples. This prevents the blocking of the specimen. The value of the wrap angle on all rollers is related nonlinearly to the value of clearance c and the displacement of the middle roller, as shown in Figure 24. Excessive drawing resistance may occur, and as a result, test samples of mild steel sheets may break when the wrap angles get larger. In contrast, the use of excessive clearance c between the rollers can cause an unfavorable change in the way the sheet deforms [88]. According to the recommendations in Nanayakkara et al. [87], the side clearance c should be equal to approximately twice the sheet thickness:
c = g + s
where s is an additional margin equal to 0.77 mm for g = 0.8 mm sheet thickness.
Figueiredo et al. [4] used the draw bead simulation (DBS) test to investigate the tribological properties of DP600 dual-phase steel sheets. Results of experimental tests allowed to conclude that the die material surface roughness has a significant effect on COF. A major drawback in all studies on friction measurement in the draw bead region is that the determination of friction demand repeated measurements of the drawing force using fixed and rotating counter-samples. Such a way of the determination of the value of COF leads to large uncertainties due to scattering [89]. In order to avoid this problem, Olsson et al. [90] proposed a new draw bead test that can measure the friction force acting directly on the tool radius using a build-in piezoelectric torque transducer. The method enables recording the breakdown of lubricant film as a function of the drawing distance. For coated sheet steels, the friction coefficient is assumed constant with contact pressure. One of the first comprehensive tests of frictional resistances of zinc-coated sheets using the BUT and DBS tests have been conducted by Vallance and Matlock [91].
The conventional methodology of the DBS test is only valid to measure an average COF over the pressure range. However, the new methodology proposed by Kim et al. [92] can be employed to determine friction coefficients from draw-bend friction tests involving pressure non-uniformity. In this methodology, contact pressure maps that are obtained from numerical simulations, contrary to the uniform pressure assumption, are used to build the COF model expressed as a 2nd order polynomial of pressure.

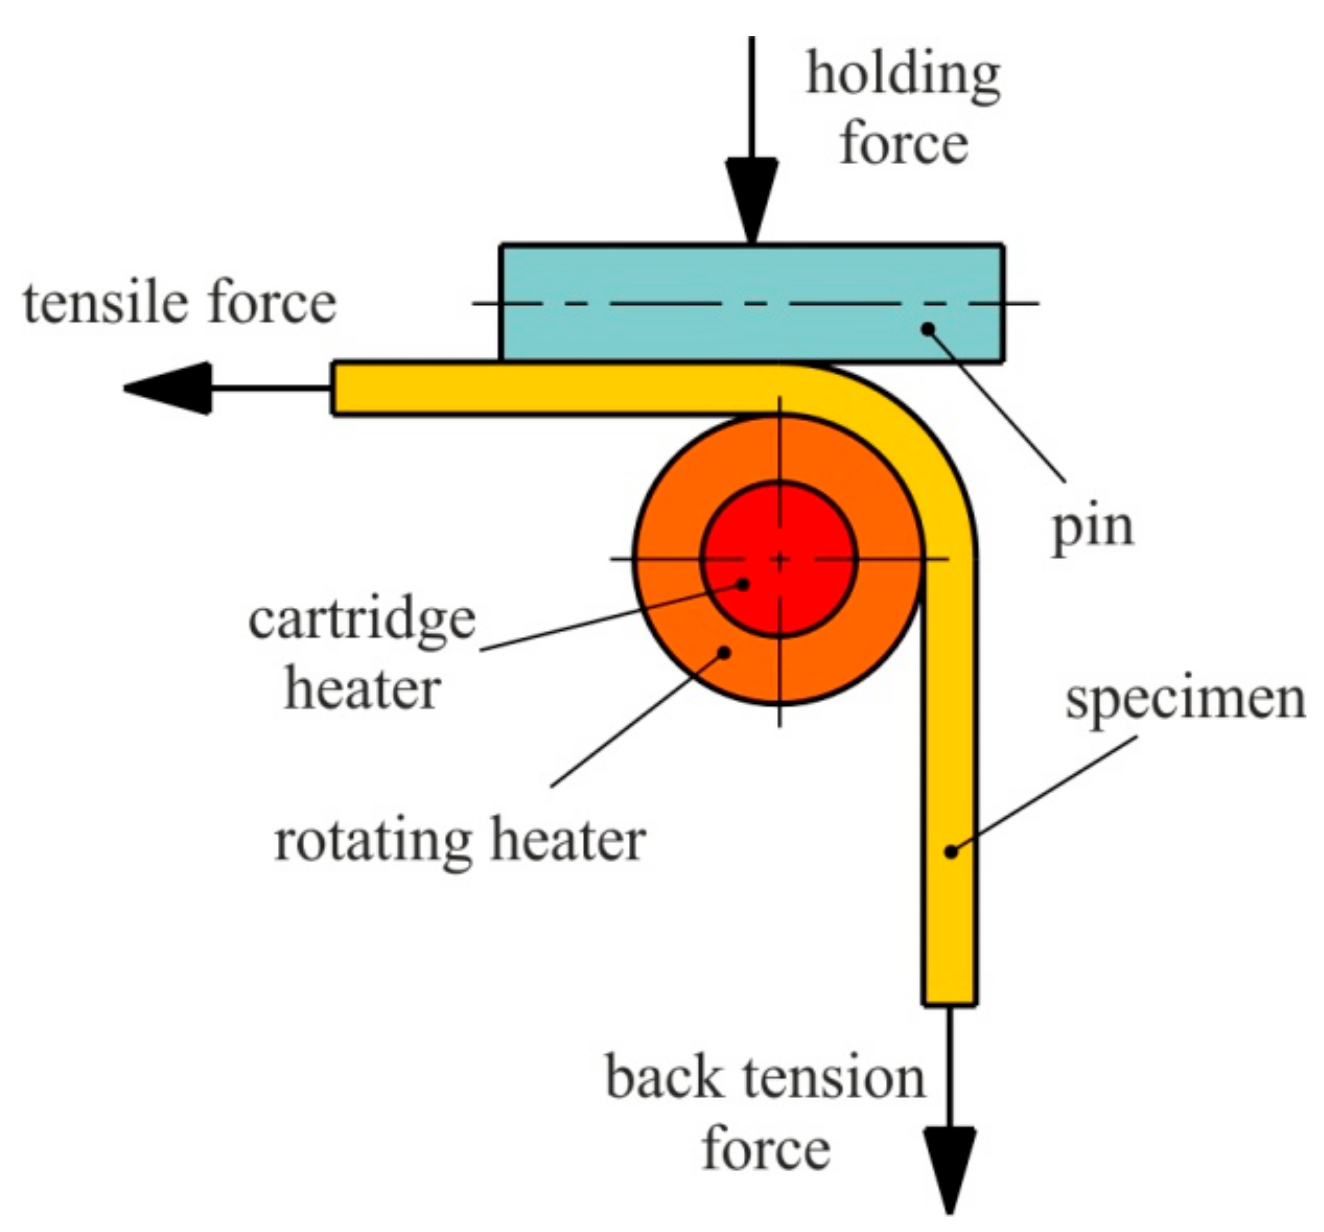
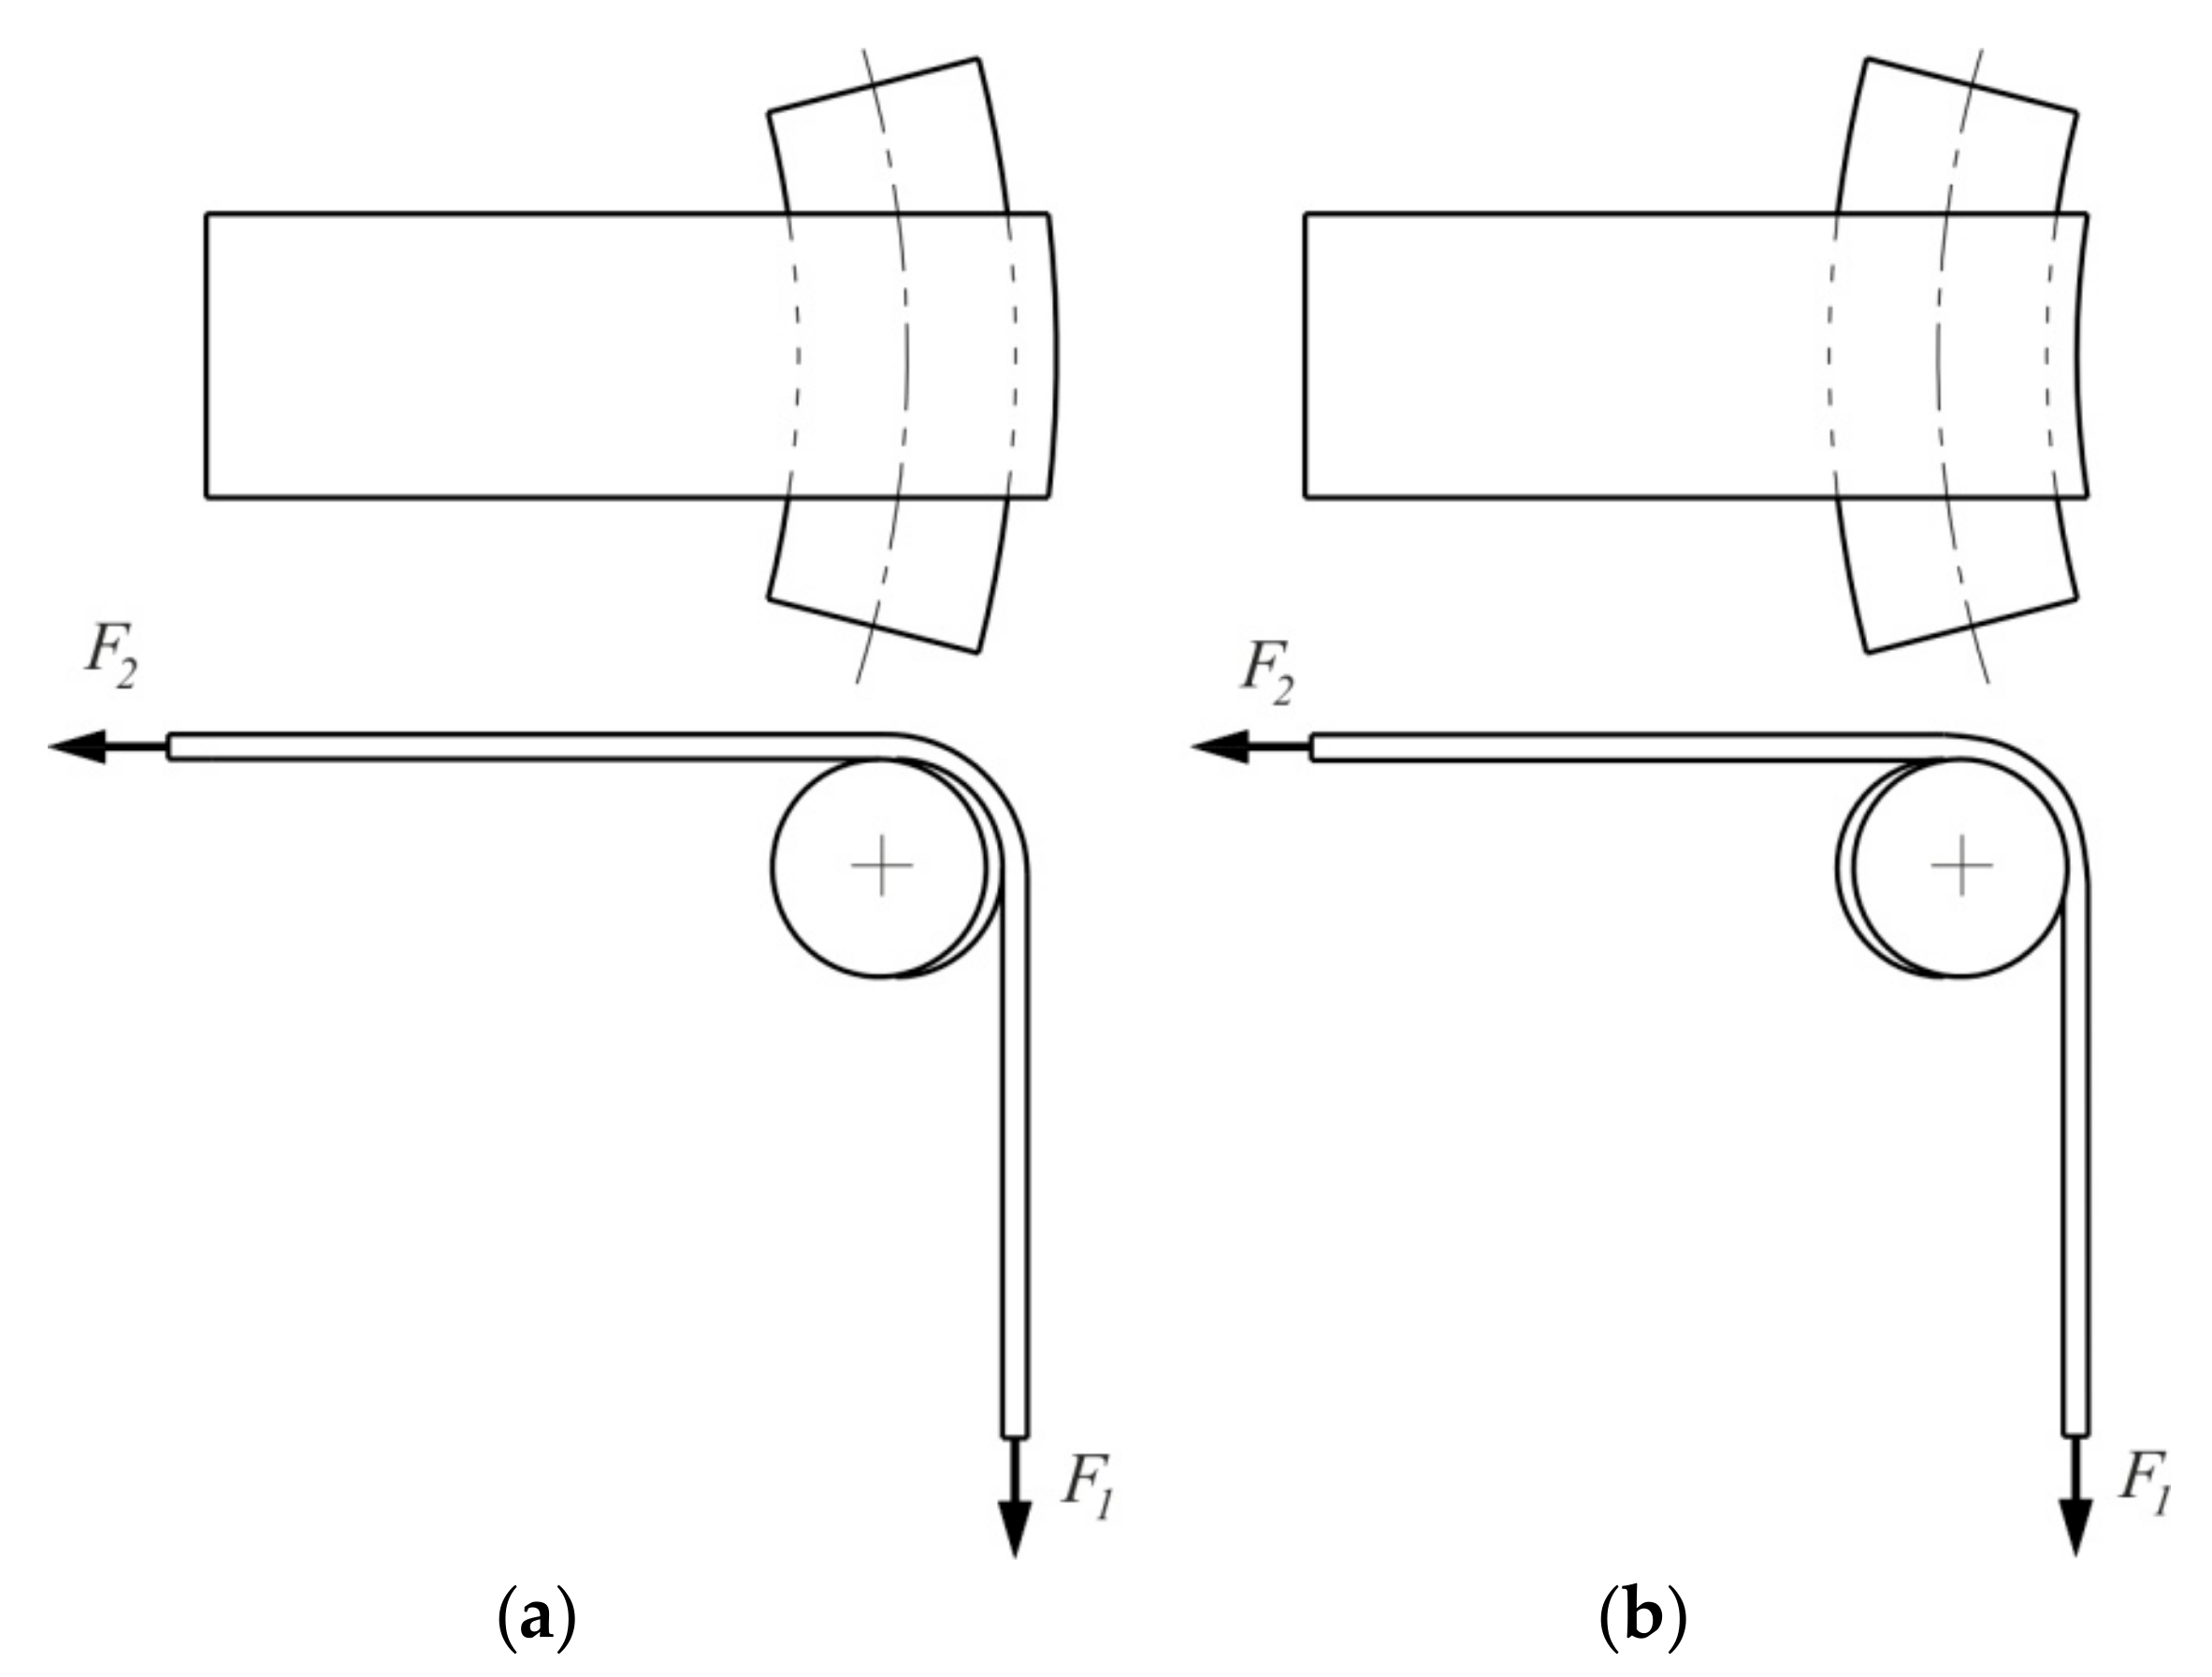
4.6. Friction Modeling in the Punch Curvature

In the tensile strip test (Figure 25), developed by Duncan et al. [93], a strip specimen of sheet metal is pulled over two rollers. This is done to simulate the frictional phenomena between the punch and sheet metal in sheet forming. While the pulling force and the strain are measured on one side of the roller, the back-tension force on the second side of the roller is calculated from the measured strains, i.e., using the stress-strain relationship of the test material [94]. Assuming that the COF is constant over the rollers, its value may be determined using the formula [95]:
μ = 2 π l n F p F b
where Fp is a pulling force and Fb is a back-tension force (Figure 25).
Similar to that introduced by Duncan et al. [93], the apparatus developed by Lovell and Deng [19] is a “plane-strain bend/unbend tension” device that stretches and bends the test specimens of the metal strip. COF between the die and the workpiece, and the surface roughness of the deformed sheets, could be measured under different lubrication conditions, strip widths, testing speeds and pin radii.
Hao et al. [96] studied the friction at the tool-workpiece interface using the “U” shaped friction test. As depicted in Figure 26, the strip specimen is pulled over two pins and around a rounded die, which is mounted on a load cell. The pulling force, F1, and the strip tension on the other side of the pins, F2, are measured during the test. In the” U” shaped strip friction test, the COF is estimated from measurements of strip tensions on each side of the die. The force and moment equilibrium on an element of the strip give the following formulas that can be used in determining the COF μ, the average contact pressure ps, and the average friction stress f [22] as given in Equations (30), (31), and (32) respectively:
μ = 1 θ l n F 1 F 2
p s = F 1 + F 2 2 w R
f = F 1 F 2 w R θ
where F1 and F2 are the strip tensions (Figure 26), R is the radius of the die, w is the strip width, and θ is the wrap angle of the strip on the die.
This test is a modification of the tensile strip test, which was developed at Ohio State University (OSU) [80]. It was designed for the experimental determination of the COF in conditions of variable wrap angle of the sheet over a cylindrical counter-sample (Figure 27). As in the case of the bending under tension test, the resistance associated with sample bending and drawing can be separated by running the OSU test on fixed and rotating rollers. The rotating rollers allow the elimination of the effects of friction and allow the measurement of forces required to bend the specimen. The undeniable advantage of the OSU test is to ensure the realism of the deformation process of the sheet and contact conditions:
  • simultaneous occurrence of the bending and stretching of the sheet,
  • the wrap angle of the counter-samples changes gradually with the increase in their displacement.
Apart from the effect of bending and straightening the sheet, the relationship between the tensile forces F1 and F2 is equal:
F 1 F 2 = e γ μ
where γ is the wrap angle of the counter-sample, μ is the COF.
After rearranging Equation (33), the COF takes the form:
μ = 1 γ l n F 1 F 2
The plastic deformation of the sheet caused by bending around the counter-sample causes changes in the topography of the surface, and consequently, the local pressures relative to the actual contact surface is smaller than the nominal pressures taking into account the nominal contact surface [70].

4.7. Friction Conditions Under Sheet Stretching

Figure 28 illustrates a schematic view of an apparatus developed by Azushima and Zhu [97] for the Tension-Bending Test (TBT) and represents stretching over the punch radius of curvature and under the punch nose. The sheet metal strip is clamped with the end of the actuator ram head, and the other end is subjected to a tension load. The drawing load is then measured by means of a strain gauge load cell inserted between the ram load and the chuck. The test may be conducted under different drawing speeds, the geometry of the die, surface topography of die, and lubrication conditions.
The COF is determined using following equation [97]:
μ = 2 F D F T F B θ F D F T
where FD is drawing load, FT is back-tension force, FB is the Swift bending tension [98], and θ is the die angle.
The average contact pressure is defined as [97]:
p a v = F T + F D 2 w R
where R is the die radius, and w is the specimen width.
TBT has been used by Azushima and Zhu [97] to study the lubrication characteristics at the interface between the A1100 aluminum sheet and tool in the die corner of deep drawing. They found that the surface roughening becomes predominant when the average contact pressure gets lower, and thus, the COF becomes constant. In addition, increasing average contact pressure leads to the flattening of surface asperities for higher average contact pressure, and hence, the COF decreases. Azushima et al. [98] measured the COF using TBT, and they observed that the asperity flattening occurred for the specimen with a rough surface, which dominated the boundary lubrication regime, and the COF remained constant. It is well known that, due to the geometry of contact in TBT, the asperity flattening and the surface roughening took place due to the plastic strain.

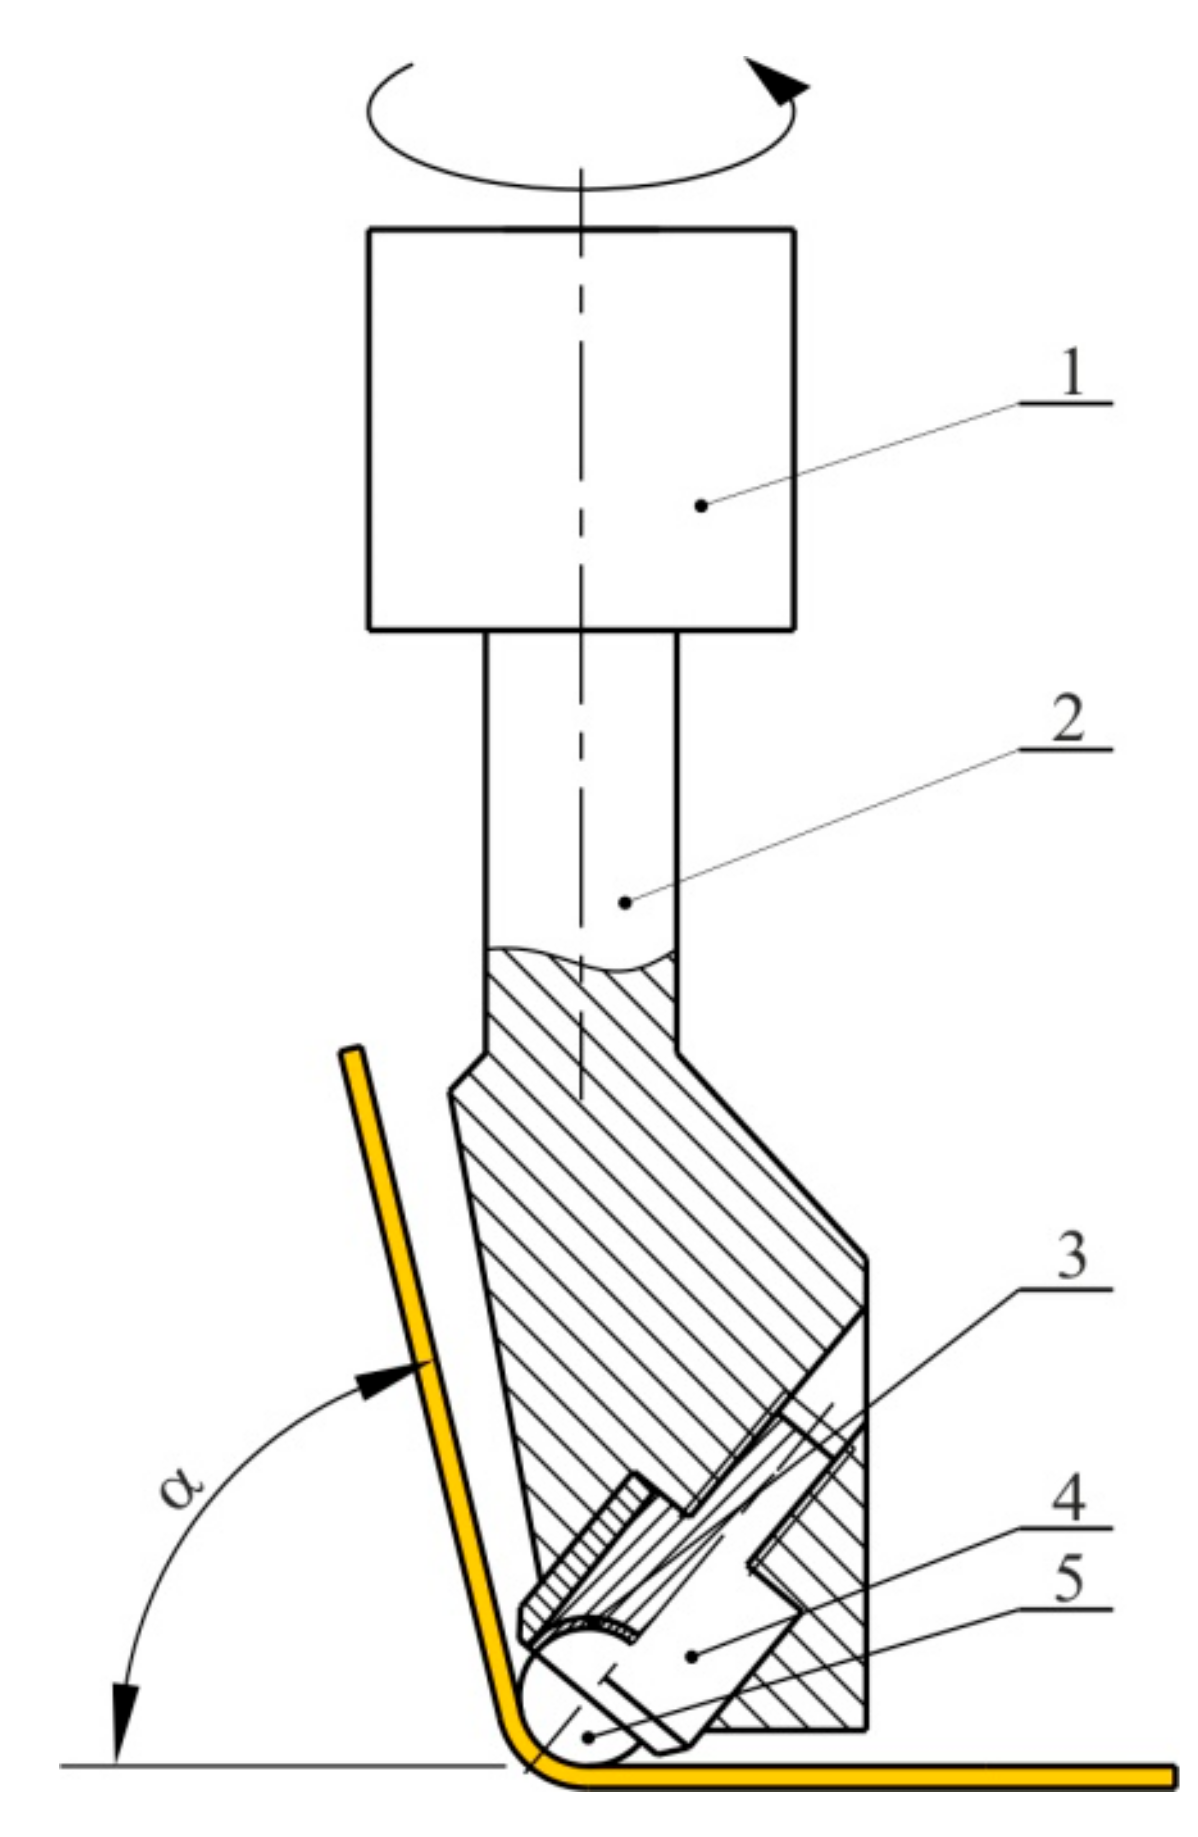
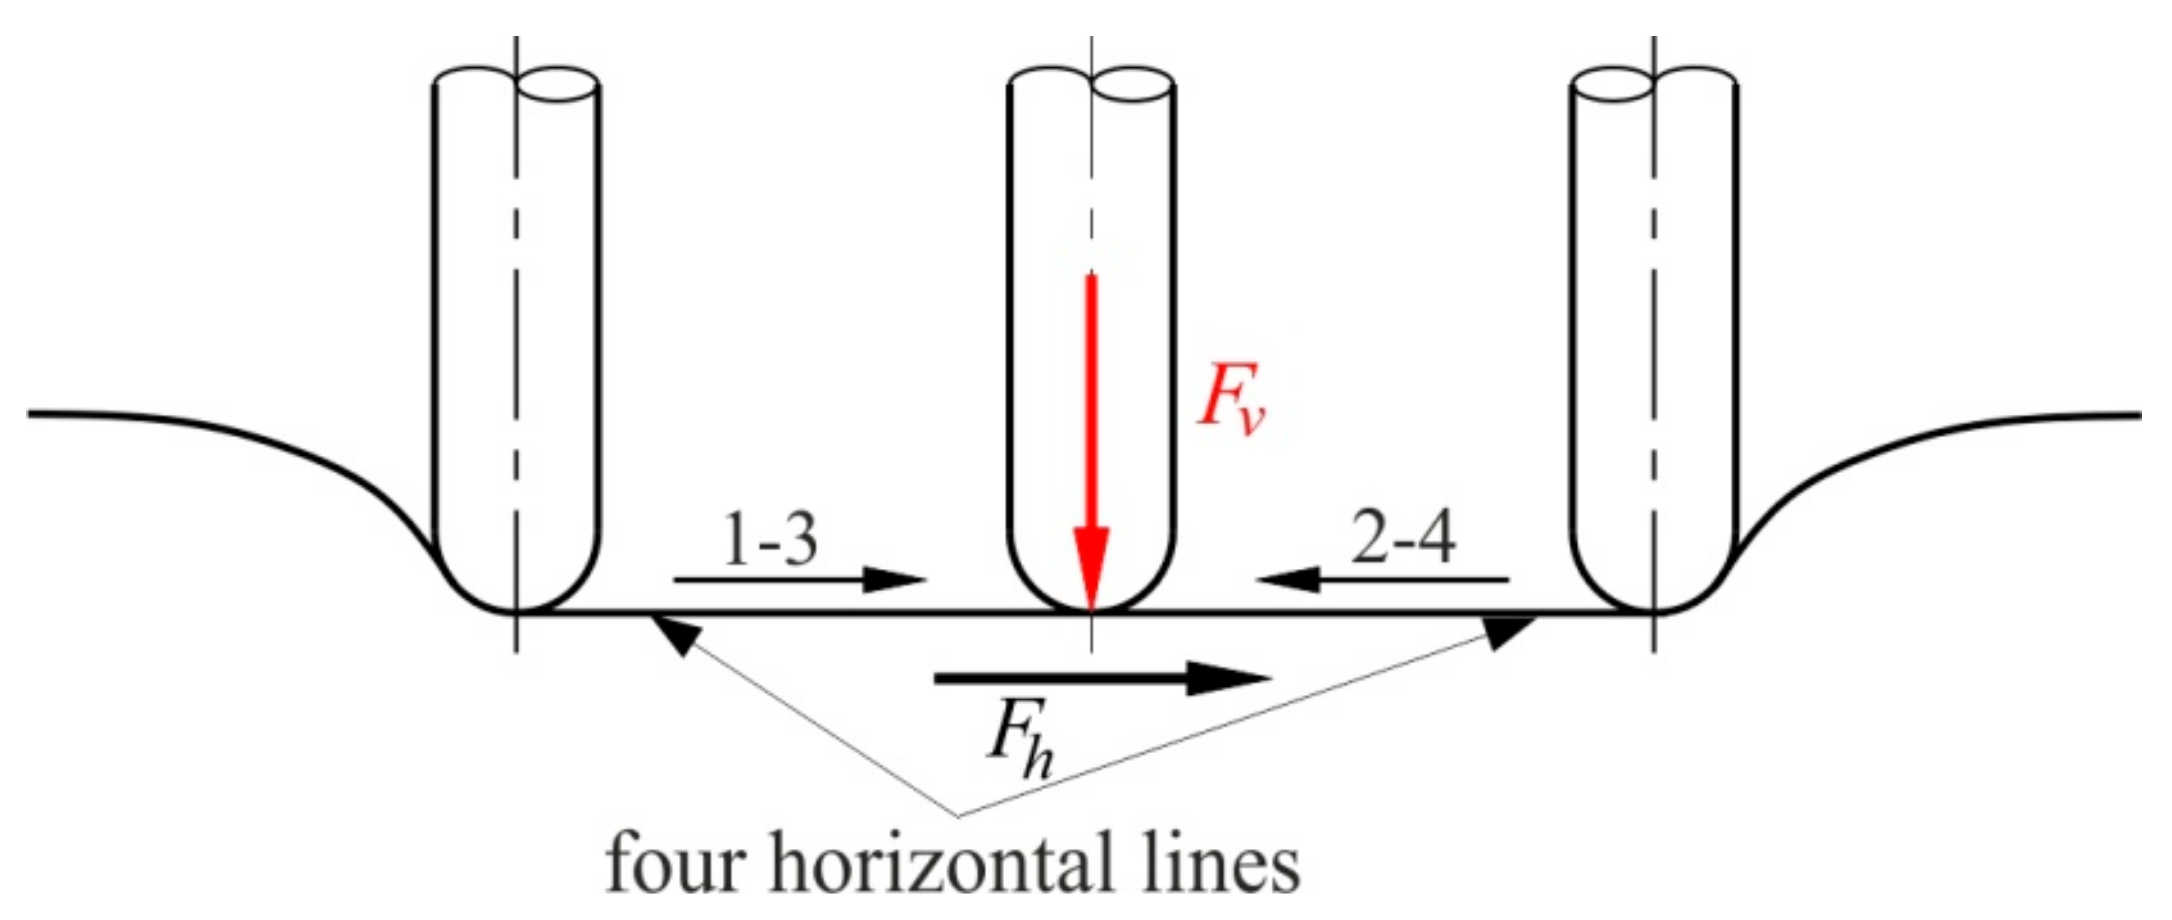
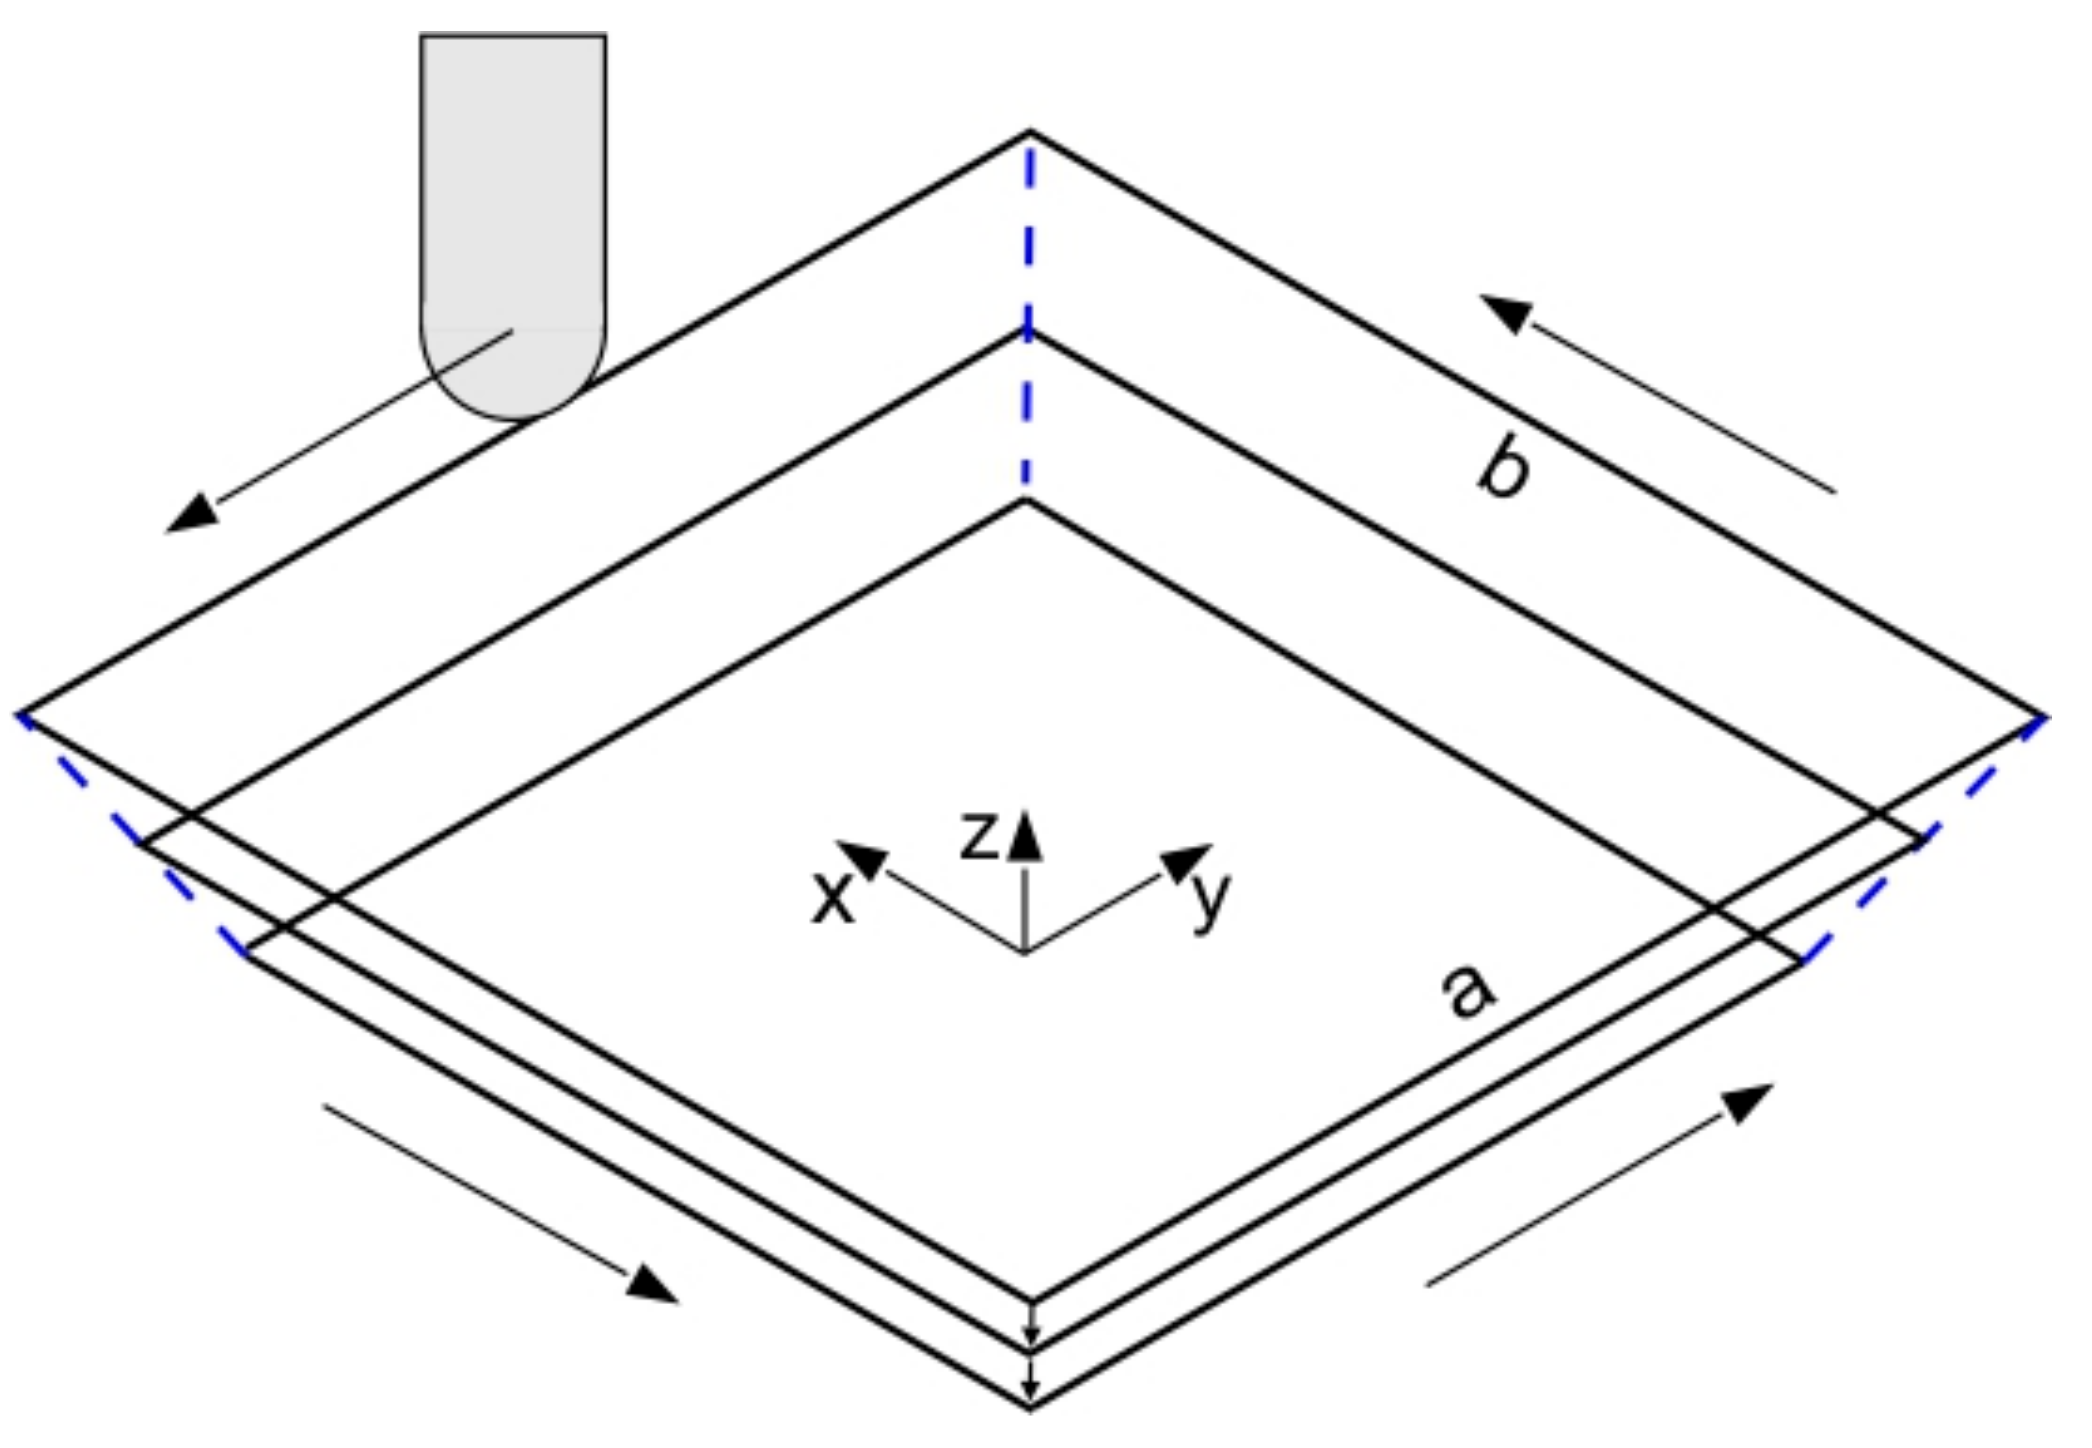
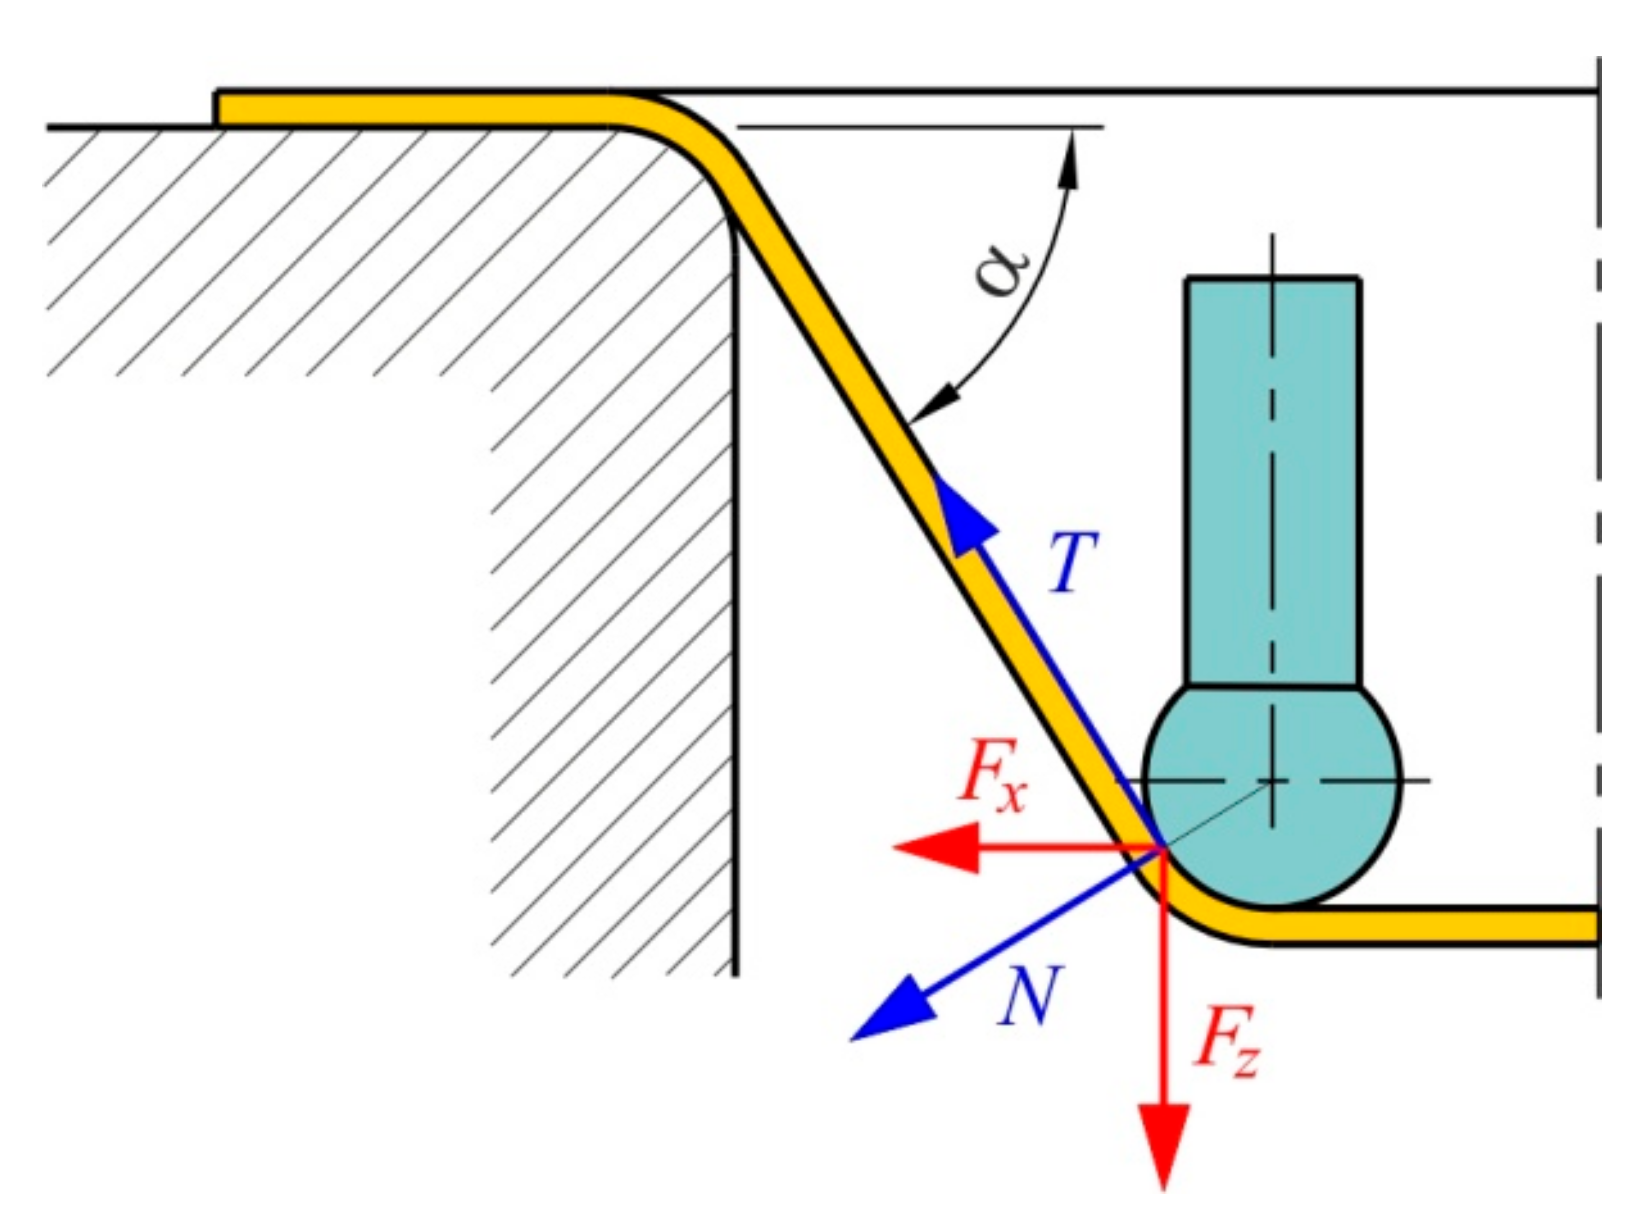
5. Friction Testing in Incremental Sheet Forming

In the ISF process, a rigid tool with a rounded tip is widely used do deform the sheet metal. To avoid possible scratch on the sheet surface, an Oblique Roller-Ball (ORB) tool in combination with the path generation algorithm, was developed by Lu et al. [99]. To better understand the frictional effect, the authors also developed an analytical model of friction based on the stress analysis. In the design (Figure 29), a ball cap is clamped by the tool arm to a certain angle instead of clamped vertically in the conventional design. The rotation of the spindle will not change the position of the rollerball. The measured forming loads, i.e., horizontal and vertical forces, show the cyclical change in tool forces tends to be a “U” shape. The force difference after passes suggests the varied friction conditions.
Precise calculation of COF is not easy since the measured horizontal force contains not only the friction but also the forming force. According to the approach of Xu et al. [100], Lu et al. [99] defined friction indicator μ* in the analysis to evaluate COF. This friction indicator is the ratio between the horizontal and vertical force components at the mid-position of the groove in each pass, according to Equation (37) [99]:
μ * = f H f Z = f r i c t i o n + f o r m i n g   l o a d f Z
where fH is the horizontal (or in-plane) force resisting the motion of the forming tool in the horizontal plane, fZ is the vertical force acting normal to the horizontal plane and flattens the sheet.
It should be noted that μ* is not only the result of friction conditions but also related to other effects such as strain hardening phenomenon and geometry of the desired component. The experimental friction tests revealed that lower friction could be obtained using roller-type tools. This reduction is more apparent when the pressure between the tool and sheet is high up to a specific level [99]. Durante et al. [101] concluded that the forces in SPIF continue to increase in the initial few contours due to the dynamic equilibrium between sheet thinning and strain hardening. Therefore, the friction indicator should be calculated once the force has achieved a steady-state.
Wei et al. [102] evaluated the COF using Equation (38) using sliding tests on 20 mm wide specimens, fixed at the ends. As illustrated in Figure 30, a tool path alternates between a stroke, back and forth twice along an 80 mm straight line [101], similar to the straight groove test, was used by Kim and Park [103] and more recently by Ilyas et al. [104] to evaluate forming limit curves in ISF.
The formula for the determination of the COF value is [102]:
μ = F h F v
where Fh and Fv are horizontal and vertical components of the total force, respectively.
In order to evaluate the modulus of the equivalent force in the sheet plane, it is enough to calculate the force Fh [101]:
F h = F a 2 + F b 2
where Fa and Fb are values of the horizontal component forces evaluated in the central zones for sides a and b in Figure 31, respectively, and represent the moduli of the two components of the horizontal force.
Analysis of variance of the effect of some forming parameters (sheet thickness, tool diameter, forming angle, and step size) on the value of friction indicator μ* conducted by Wei et al. [102] revealed that the response of friction indicator to parameter variations is relatively complex. During forming, the mechanical properties of the sheets change during the strain-hardening phenomenon [6]. Furthermore, the tool-sheet contact area changes when the forming is performed with an altered set of parameters [105]. These changes affect the values of force components, and hence, the friction indicator [102]. It should also be noted that the results of roughness findings of Wei et al. [102] are different from those presented in the ISF literature. The material type observed to be the major factor influencing the friction condition, and hence, the roughness. Recently, a number of researchers mainly studied the friction indicator as to the function of tool rotation. In many cases [100,101,105], it has been revealed that the friction indicator has a significant effect on the roughness.
In the case of the pin-on-disc test, the tool contacts the workpiece over the same rounded loop repeatedly; whereas in the case of the SPIF, the forming tool never exactly touches the same workpiece area. Despite this, Petek et al. [106] used a conventional pin-on-disc test shown in Figure 21 to study the coating ability to prevent the adhesion of the workpiece at initial testing conditions during SPIF. Pin-on-disc test is also applied by Minutolo et al. [107] to determine COF value for a numerical model of the ISF process. The sliding speed was set equal to the punch feed rate in the motion of the groove. According to the authors′ conclusion, results of finite element-based computations were observed to have good agreement with the experimental ones, showing that pin on disc test can be used for testing friction in the SPIF process. Hussain [108] successfully studied the different lubrication strategies during ISF of titanium sheets using pin-on-disc tribometer.
Saidi et al. [109] proposed an approach estimating the COF in SPIF based on the values of forming forces Fx, Fy, and Fz (Figure 32) while forming the truncated cones with wall angle α. The authors took the following assumptions: (i) value of COF varies from one zone to another, and (ii) COF is estimated on the basis of a uniform displacement of the tool with respect to the workpiece. Based on these assumptions, the COF was calculated by the following relation [109,110]:
μ = F x 2 + F y 2 F z 2

6. Conclusions

In the SMF occurs various zones in terms of stress, deformation, sliding velocity, and contact conditions. Therefore, over the years, a number of tribological tests to model the phenomenon of friction in individual regions of sheet metal to be formed have been developed. The aim of this review is (i) presentation of tribological tests aimed at determining the value of COF occurring in SMF and ISF, while maintaining the actual contact geometry and kinematics of the tool movement, and (ii) the discussion of the disadvantages and limitations of specific tests. Although most of the friction tests were developed many decades ago, they are still valid and used by many authors. Although the methods to determine friction resistance in conventional SMF at different temperature conditions have been fairly well understood [10,15,16,50], there are a very limited number of experimental tests modeling conditions in ISF [102,104,105,109]. This is due to the difficulty in separating the frictional resistance from the plastic deformation resistance in the process [110].
Based on the literature review, the tribological tests can be classified into direct and indirect measurement tests of the COF. In indirect methods of determination, the COF is determined on the basis of measuring other physical quantities, e.g., friction force and normal force [40,50,51,52,53,55,57,58,66]. Based on the adopted model, the COF is calculated. The disadvantage of this type of methods is that they allow the determination of the average value of COF, while they do not allow measuring and determining the real friction resistance. Most of the tribometers, which are typically used to measure the wear resistance, allows determining the instantaneous value of the COF. The rotational specimen causes that the length of the friction track is unlimited. This intensifies the wear processes and causes overestimation of the value of COF. Assigning the COF determined in a pin- and ball-on-disc tribotesters to the conditions arisen in conventional SMF should be limited. However, the pin-on-disc and ball-on-disc are able to determine the effect of directional topography on the wear and COF [111].
Most of the friction tests, are able to capture the COF values of tool-workpiece interfaces by controlling critical parameters, such as lubrication conditions [19,20,62,112], microgeometry of contact (surface roughness of sheet and tools surfaces) [50,53,91], contact pressures [40,90], temperature [42,46,47,81], tool material and coating applied [21,22,38,45], and sliding velocity [33]. The multitude of parameters and phenomena affecting frictional resistance means that the results obtained in various tribological tests are not comparable [35].
The BUT and DBS tests could not directly measure COF in such a way that their value has heavily relied on the material behavior of tested materials. During friction tests, the sheet is plastically deformed, which affects the value of process forces used to evaluate the value of the COF. In contrast, the plastic deformation of the sheet strip specimen in BUT tests allows determining the evolution of the value of the COF with the increased contact pressure.
In the classical Coulomb model commonly used in the solid mechanics, the friction force is proportional to the normal pressure. The ratio of the friction force to the contact pressure is handled as a material constant, named the COF [113]. In metal forming operations exist high local pressures which intensify the effects of adhesion and plowing in the friction resistance. In such conditions, the usage of the formula for the determination of the COF based on the Coulomb friction model (Equation (1)) is limited to small pressures.
In SDT, it was realized that in the presence of the cylindrical counter-samples, the relation of the normal force and the friction force is nonlinear [15,35]. It is a result of a non-proportional increase in real contact area with an increase in normal force. This phenomenon is observed by the non-linear decrease of the value of the COF (Equation (1)) with an increase of normal force [35]. In the case of lubricated conditions and tests with flat counter-samples, the value of pressure is crucial in the determination of the COF. As shown by Mousavi et al. [114], since the lubricant film is under relative high surface pressure, a uniform distribution of lubricant over the contact area rarely takes place. Therefore, lubricant pockets can provide the permanently reserved lubricant during the sheet metal forming.
The main problems observed in warm and hot forming processes are that high friction and wear occur because of high adhesion between the workpiece material and tool surface, and surface-initiated fatigue. The occurrence and prevention of galling mechanism are investigated by using tribometers for metal forming at elevated temperatures [12,27,63]. The typically used pin-on-disc tribometer to characterize frictional contact in hot stamping do not reproduce appropriate contact conditions. First, the cyclic contact of the pin with the specimen does not correspond to real contact conditions [58]. Second, the build-up in the front of pin causes plowing friction and causes overestimation of COF. Third, if the ball-shaped pin is used, the real contact area changes during the test [111]. In fact, according to the Coulomb law, the COF is independent of the contact area. However, the applicability of Coulomb friction model is very limited in the description of contact phenomena in hot SMF due to a high shear of adhesion in total contact resistance.

Author Contributions

T.T. had the initial idea for the manuscript and wrote the draft of an article; H.G.L. contributed in Funding acquisition, project administration, validation, and writing–review & editing. All authors have read and agreed to the published version of the manuscript.

Funding

This research received no external funding.

Acknowledgments

The authors gratefully acknowledge the financial support provided by the University of Stavanger under the activities of the COTech Program Area for Research.

Conflicts of Interest

The authors declare no conflict of interest.

References

  1. Trzepieciński, T.; Lemu, H.G. Effect of computational parameters on springback prediction by numerical simulation. Metals 2017, 7, 380. [Google Scholar] [CrossRef] [Green Version]
  2. Slota, J.; Jurcisin, M.; Lazarescu, L. Influence of technological parameters on the springback angle of high-strength steels. Acta Metall. Slovaca 2014, 20, 236–243. [Google Scholar] [CrossRef] [Green Version]
  3. Altan, T.; Tekkaya, A.E. Sheet Metal Forming Processes and Applications; ASM International: Materials Park, OH, USA, 2012. [Google Scholar]
  4. Figueiredo, L.; Ramalho, A.; Oliveira, M.C.; Menezes, L.F. Experimental study of friction in sheet metal forming. Wear 2011, 271, 1651–1657. [Google Scholar] [CrossRef]
  5. Zhang, R.; Shao, Z.; Lin, J. A review on modelling techniques for formability prediction of sheet metal forming. Int. J. Lightweight Mater. Manuf. 2018, 1, 115–125. [Google Scholar] [CrossRef]
  6. Shi, X.; Gao, L.; Khalatbari, H.; Xu, Y.; Wang, H.; Jin, L.L. Electric hot incremental forming of low carbon steel sheet: Accuracy improvement. Int. J. Adv. Manuf. Technol. 2013, 68, 241–247. [Google Scholar] [CrossRef]
  7. Li, Y.; Chen, X.; Liu, Z.; Sun, J.; Li, F.; Li, J.; Zhao, G. A review on the recent development of incremental sheet-forming process. Int. J. Adv. Manuf. Technol. 2017, 92, 2439–2462. [Google Scholar] [CrossRef]
  8. Peng, W.; Ou, H.; Becker, A. Double-sided incremental forming: A review. J. Manuf. Sci. Eng. 2019, 141, 1–12. [Google Scholar] [CrossRef] [Green Version]
  9. Kirkhorn, L.; Bushlya, V.; Andersson, M.; Ståhl, J.E. The influence of tool steel microstructure on friction in sheet metal forming. Wear 2013, 302, 1268–1278. [Google Scholar] [CrossRef]
  10. Kim, H.; Kades, N. Friction and lubrication. In Sheet Metal Forming: Fundamentals; Altan, T., Tekkaya, A.E., Eds.; ASM International: Materials Park, OH, USA, 2012; pp. 89–104. [Google Scholar]
  11. Bay, N.; Azushima, A.; Groche, P.; Ishibashi, I.; Merklein, M.; Morishita, M.; Nakamura, T.; Schmid, S.; Yoshida, M. Environmentally benign tribo-systems for metal forming. CIRP Ann. 2010, 59, 760–780. [Google Scholar] [CrossRef] [Green Version]
  12. Pelcastre, L. Hot Forming Tribology: Galling of Tools and Associated Problems; Luleå University of Technology: Lulea, Sweden, 2011. [Google Scholar]
  13. Evin, E.; Tomáš, M.; Výrostek, M. Verification the numerical simulation of the strip drawing test by its physical model. Acta Mech. Slovaca 2016, 20, 14–21. [Google Scholar] [CrossRef]
  14. Masters, L.G.; Williams, D.K.; Roy, R. Friction behaviour in strip draw test of pre-stretched high strength automotive aluminium alloys. Int. J. Mach. Tools Manuf. 2013, 73, 17–24. [Google Scholar] [CrossRef]
  15. Trzepieciński, T.; Fejkiel, R. On the influence of deformation of deep drawing quality steel sheet on surface topography and friction. Tribol. Int. 2017, 115, 78–88. [Google Scholar] [CrossRef]
  16. Bay, N.; Olsson, D.D.; Andreasen, J.L. Lubricant test methods for sheet metal forming. Tribol. Int. 2008, 41, 844–853. [Google Scholar] [CrossRef]
  17. Menezes, P.L.; Kumar, K.K.; Kailas, S.V. Influence of friction during forming processes—A study using a numerical simulation technique. Int. J. Adv. Manuf. Technol. 2009, 40, 1067–1076. [Google Scholar] [CrossRef]
  18. Jadhav, S.; Schoiswoh, M.; Buchmayr, B. Tribology test methods and simulations of the effect of friction on the formability of automotive steel sheets. Metall. Ital. 2018, 9, 56–63. [Google Scholar]
  19. Lovell, M.R.; Deng, Z. Characterization of interfacial friction in coated sheet steels: Influence of stamping process parameters and wear mechanisms. Tribol. Int. 2002, 35, 85–95. [Google Scholar] [CrossRef]
  20. Deng, Z.; Lovell, M.R. Effects of lubrication and die radius on the friction behavior of Pb-coated sheet steels. Wear 2000, 244, 42–52. [Google Scholar] [CrossRef]
  21. Sulaiman, M.H.; Farahana, R.N.; Bienk, K.; Nielsenc, C.V.; Bay, N. Effects of DLC/TiAlN-coated die on friction and wear in sheet-metal forming under dry and oil-lubricated conditions: Experimental and numerical studiem. Wear 2019, 438, 203040. [Google Scholar] [CrossRef]
  22. Kim, A.; Han, B.; Yan, Q.; Altan, T. Evaluation of tool materials, coatings and lubricants in forming galvanized advanced high strength steels (AHSS). CIRP Ann. Manuf. Technol. 2008, 57, 299–304. [Google Scholar] [CrossRef]
  23. Carlsson, P. Surface Engineering in Sheet Metal Forming. Ph.D. Thesis, Acta Universitatis Upsaliensis, Upsalla, Sweden, 18 February 2005. [Google Scholar]
  24. Hol, J.; Meinders, V.T.; de Rooij, M.B.; van den Boogaard, A.H. Multi-scale friction modeling for sheet metal forming: The boundary lubrication regime. Tribol. Int. 2015, 81, 112–128. [Google Scholar] [CrossRef]
  25. Sigvant, M.; Pilthammar, J.; Hol, J.; Wiebenga, J.H.; Chezan, T.; Carleer, B.; van den Boogard, T. Friction in sheet metal forming: Influence of surface roughness and strain rate on sheet metal forming simulation results. Procedia Manuf. 2019, 29, 512–519. [Google Scholar] [CrossRef]
  26. Li, G.; Long, X.; Yang, P.; Liang, Z. Advance on friction of stamping forming. Int. J. Adv. Manuf. Technol. 2018, 96, 21–38. [Google Scholar] [CrossRef]
  27. Lu, J.; Song, Y.; Hua, L.; Zhou, P.; Xie, G. Effect of temperature on friction and galling behavior of 7075 aluminum alloy sheet based on ball-on-plate sliding test. Tribol. Int. 2019, 140, 105872. [Google Scholar] [CrossRef]
  28. Littlewood, M.; Wallace, J.F. The effect of surface finish and lubrication on the fictional variation involved in the sheet-metal-forming process. Sheet Met. Ind. 1964, 41, 925–930. [Google Scholar]
  29. Hutchings, I.M. Leonardo da Vinci’s studies of friction. Wear 2016, 360, 51–66. [Google Scholar] [CrossRef] [Green Version]
  30. Wang, D.; Yang, H.; Li, H. Advance and trend of friction study in plastic forming. Trans. Nonferr. Met. Soc. China 2014, 24, 1263–1272. [Google Scholar] [CrossRef]
  31. Dohda, K.; Boher, C.; Reza-Aria, F.; Mahayotsanun, N. Tribology in metal forming at elevated temperatures. Friction 2015, 3, 1–27. [Google Scholar] [CrossRef] [Green Version]
  32. Trzepieciński, T.; Lemu, H.G. Proposal for an experimental-numerical method for friction description in sheet metal forming. Stroj. Vestn. J. Mech. Eng. 2015, 61, 383–391. [Google Scholar] [CrossRef]
  33. Üstünyagiz, E.; Nielsen, C.V.; Christiansen, P.; Martins, P.A.F.; Bay, N. Continuous strip reduction test simulating tribological conditions in ironing. Procedia Eng. 2017, 207, 2286–2291. [Google Scholar] [CrossRef] [Green Version]
  34. De Souza, J.H.C.; Liewald, M. Analysis of the tribological behaviour of polymer composite tool materials for sheet metal forming. Wear 2010, 268, 241–248. [Google Scholar] [CrossRef]
  35. Trzepieciński, T.; Bazan, A.; Lemu, H.G. Frictional characteristics of steel sheets used in automotive industry. Int. J. Automot. Technol. 2015, 16, 849–863. [Google Scholar] [CrossRef]
  36. Vollertsen, F.; Hu, Z. Tribological size effects in sheet metal forming measured by a strip drawing test. CIRP Ann. 2006, 55, 291–294. [Google Scholar] [CrossRef]
  37. Roizard, X.; von Stebut, J. Surface asperity flattening in sheet metal forming—A 3D relocation stylus profilometric study. Int. J. Mach. Tools Manuf. 1995, 35, 169–175. [Google Scholar] [CrossRef]
  38. Guillon, O.; Roizard, X.; Belliard, P. Experimental methodology to study tribological aspects of deep drawing—Application to aluminium alloy sheets and tool coatings. Tribol. Int. 2001, 34, 757–766. [Google Scholar] [CrossRef]
  39. Ter Haar, R. Friction in Sheet Metal Forming, the Influence of (Local) Contact Conditions and Deformation; Universiteit Twente: Enschede, The Netherlands, 1996. [Google Scholar]
  40. Payen, G.R.; Felder, E.; Repoux, M.; Mataigne, J.M. Influence of contact pressure and boundary films on the frictional behaviour and on the roughness changes of galvanized steel sheets. Wear 2012, 276, 48–52. [Google Scholar] [CrossRef]
  41. Coello, J.; Miguel, V.; Martínez, A.; Avellaneda, F.J.; Calatayud, A. Friction behaviour evaluation of an EBT zinc-coated trip 700 steel sheet through flat friction tests. Wear 2013, 305, 129–139. [Google Scholar] [CrossRef]
  42. Venema, J.; Matthews, D.T.A.; Hazrati, J.; Wörmann, J.; van den Boogaard, A.H. Friction and wear mechanisms during hot stamping of AlSi coated press hardening steel. Wear 2017, 380, 137–145. [Google Scholar] [CrossRef]
  43. Xue, H.; Nanxiang, K.; Zhu, H. The friction coefficient testing method of metallic sheet and strip. Adv. Mater. Res. 2012, 629, 75–78. [Google Scholar] [CrossRef]
  44. Recklin, V.; Dietrich, F.; Groche, P. Influence of test stand and contact size sensitivity on the friction coefficient in sheet metal forming. Lubricants 2018, 6, 41. [Google Scholar] [CrossRef] [Green Version]
  45. Kondratiuk, J.; Kuhn, P. Tribological investigations on friction and wear behaviour of coatings for hot sheet metal forming. Wear 2011, 270, 839–849. [Google Scholar] [CrossRef]
  46. Uda, K.; Azushima, A.; Yanagida, A. Development of new lubricants for hot stamping of Al-coated 22MnB5 steel. J. Mater. Process. Technol. 2016, 228, 112–116. [Google Scholar] [CrossRef]
  47. Tokita, Y.; Nakagaito, T.; Tamai, Y.; Urabe, T. Stretch formability of high strength steel sheets in warm forming. J. Mater. Process. Technol. 2017, 246, 77–84. [Google Scholar] [CrossRef]
  48. Shi, Z.; Wang, L.; Mohamed, M.; Balint, D.S.; Lin, J.; Stanton, M.; Watson, D.; Dean, T.A. A new design of friction test rig and determination of friction coefficient when warm forming an aluminium alloy. Procedia Eng. 2017, 207, 2274–2279. [Google Scholar] [CrossRef] [Green Version]
  49. Merklein, M.; Andreas, K.; Steiner, J. Influence of tool surface on tribological conditions in conventional and dry sheet metal forming. Int. J. Precis. Eng. Manuf. Green Technol. 2015, 2, 131–137. [Google Scholar] [CrossRef] [Green Version]
  50. Sedlaček, M.; Podgornik, B.; Vižintin, J. Influence of surface preparation on roughness parameters, friction and wear. Wear 2009, 266, 482–487. [Google Scholar] [CrossRef]
  51. Trzepieciński, T. 3D elasto-plastic FEM analysis of the sheet drawing of anisotropic steel sheet. Arch. Civ. Mech. Eng. 2010, 10, 95–106. [Google Scholar] [CrossRef]
  52. Wang, L.; He, Y.; Zhou, J.; Duszczyk, J. Effect of temperature on the frictional behaviour of an aluminium alloy sliding against steel during ball-on-disc tests. Tribol. Int. 2010, 43, 299–306. [Google Scholar] [CrossRef]
  53. Ajayi, O.O.; Erck, R.A.; Lorenzo-Martin, C.; Fenske, G.R. Frictional anisotropy under boundary lubrication: Effect of surface texture. Wear 2009, 267, 1214–1219. [Google Scholar] [CrossRef]
  54. Altan, T. R&D Update: Twist-Compression Testing to Evaluate Friction, Lubrication. 2017. Available online: https://www.thefabricator.com/article/stamping/r-d-update-twist-compression-testing-to-evaluate-friction-lubrication (accessed on 28 June 2019).
  55. Dou, S.; Xia, J. Analysis of sheet metal forming (stamping process): A study of the variable friction coefficient on 5052 aluminum alloy. Metals 2019, 9, 853. [Google Scholar] [CrossRef] [Green Version]
  56. Singh, R.; Melkote, S.N.; Hashimoto, F. Frictional response of precision finished surfaces in pure sliding. Wear 2005, 258, 1500–1509. [Google Scholar] [CrossRef]
  57. Masuko, M.; Aoki, S.; Suzuki, A. Influence of lubricant additive and surface texture on sliding friction characteristics of steel under varying speeds ranging from ultralow to moderate. Tribol. Trans. 2005, 48, 289–298. [Google Scholar] [CrossRef]
  58. Wu, C.; Qu, P.; Zhang, L.; Li, S.; Jiang, Z. A numerical and experimental study on the interface friction of ball-on-disc test under high temperature. Wear 2017, 376, 433–442. [Google Scholar] [CrossRef]
  59. Ghiotti, A.; Bruschi, S.; Borsetto, F. Tribological characteristics of high strength steel sheets under hot stamping conditions. J. Mater. Process. Technol. 2011, 211, 1694–1700. [Google Scholar] [CrossRef]
  60. Carlsson, P.; Bexell, U.; Olsson, M. Tribological behaviour of thin organic permanent coatings deposited on hot-dip coated steel sheet—A laboratory study. Surf. Coat. Technol. 2000, 132, 169–180. [Google Scholar] [CrossRef]
  61. Kirkhorn, L.; Frogner, K.; Andersson, M.; Ståhl, J.E. Improved tribotesting for sheet metal forming. Procedia CIRP 2012, 3, 507–512. [Google Scholar] [CrossRef] [Green Version]
  62. Sulaiman, M.H.; Christiansen, P.; Bay, N. The influence of tool texture on friction and lubrication in strip reduction. Procedia Eng. 2017, 207, 2263–2268. [Google Scholar] [CrossRef] [Green Version]
  63. Moghadam, M.; Christiansen, P.; Bay, N. Detection of the onset of galling in strip reduction testing using acoustic emission. Procedia Eng. 2017, 183, 59–64. [Google Scholar] [CrossRef] [Green Version]
  64. Fukui, S.; Ohi, T.; Kudo, H.; Takita, I.; Seino, J. Some aspects of friction in metal-strip drawing. Int. J. Mech. Sci. 1992, 4, 297–312. [Google Scholar] [CrossRef]
  65. Matuszak, A. Determination of the frictional properties of coated steel sheets. J. Mater. Process. Technol. 2000, 106, 107–111. [Google Scholar] [CrossRef]
  66. Le, H.R.; Sutcliffe, M.P.F. Measurements of friction in strip drawing under thin film lubrication. Tribol. Int. 2002, 35, 123–128. [Google Scholar] [CrossRef]
  67. Aleksandrović, S.; Dordević, M.; Stefanović, M.; Lazić, V.; Adamović, D.; Arsić, D. Different ways of friction coefficient determination in stripe ironing test. Tribol. Ind. 2014, 36, 293–299. [Google Scholar]
  68. Andreasen, J.L.; Bay, N.; Andersen, M.; Christensen, E.; Bjerrum, N. Screening the performance of lubricants for the ironing of stainless steel with a strip reduction test. Wear 1997, 207, 1–5. [Google Scholar] [CrossRef]
  69. Dohda, K.; Kawai, N. Compatibility between tool materials and workpiece in sheet-metal ironing process. J. Tribol. 1990, 112, 275–281. [Google Scholar] [CrossRef]
  70. Zhang, S.; Hodgson, P.D.; Duncan, J.L.; Cardew-Hall, M.J.; Kalyanasundaram, S. Effect of membrane stress on surface roughness changes in sheet forming. Wear 2002, 253, 610–617. [Google Scholar] [CrossRef]
  71. Weinmann, K.J.; Kernosky, S.K. Friction studies in sheet metal forming based on a unique die shoulder force transducer. CIRP Ann. 1996, 45, 269–272. [Google Scholar] [CrossRef]
  72. Dilmec, M.; Arap, M. Effect of geometrical and process parameters on coefficient of friction in deep drawing process at the flange and the radius regions. Int. J. Adv. Manuf. Technol. 2016, 86, 747–759. [Google Scholar] [CrossRef]
  73. Lemu, H.G.; Trzepieciński, T. Numerical and experimental study of frictional behavior in bending under tension test. Stroj. Vestn. J. Mech. Eng. 2013, 59, 41–49. [Google Scholar] [CrossRef]
  74. Bay, N.; Tribo-Systems for Sheet Metal Forming. Metallurgiske Processer i Danmark. Available online: http://orbit.dtu.dk/ws/files/128041777/vm2009_a9.pdf (accessed on 12 September 2019).
  75. Wenzloff, G.J.; Hylton, T.A.; Matlock, D.K. A new test procedure for the bending-under-tension friction test. J. Mater. Eng. Perform. 1992, 1, 609–613. [Google Scholar] [CrossRef]
  76. Sniekers, R.J.J.M.; Smits, H.A.A. Experimental set-up and data processing of the radial strip-drawing friction test. J. Mater. Process. Technol. 1997, 66, 216–223. [Google Scholar] [CrossRef]
  77. Andreasen, J.L.; Olsson, D.D.; Chodnikiewicz, K.; Bay, N. Bending under tension test with direct friction measurement. Proc. Inst. Mech. Eng. Part B J. Eng. Manuf. 2006, 220, 73–80. [Google Scholar] [CrossRef]
  78. Sube, D. Possibilities and Results of Numeric and Experimental Simulation of Sheet Metal Forming Processes. In Proceedings of the 3 Conferência Nacional de Conformação de Chapas, Porto Alegre, Brasil, 8 October 2000. [Google Scholar]
  79. Hassan, M.A.; Tan, C.J.; Yamaguchi, K. A developed friction test for sheet metal stretch forming process. Int. J. Surf. Sci. Eng. 2013, 7, 152–170. [Google Scholar] [CrossRef]
  80. Wagoner, R.H.; Wang, W.; Sriram, S. Development of OSU formability test and OSU friction test. J. Mater. Process. Technol. 1994, 45, 13–18. [Google Scholar] [CrossRef]
  81. Gali, O.A.; Riahi, A.R.; Alpas, A.T. The tribological behaviour of AA5083 alloy plastically deformed at warm forming temperatures. Wear 2016, 302, 1257–1267. [Google Scholar] [CrossRef]
  82. Das, S.; Morales, A.T.; Riahi, A.R.; Meng-Burany, X.; Alpas, A.T. Role of plastic deformation on elevated temperature tribological behaviour of an Al-Mg alloy (AA5083): A friction mapping approach. Metall. Mater. Trans. A 2011, 42, 2384–2401. [Google Scholar] [CrossRef]
  83. Jurkovic, M.; Jurkovic, Z.; Buljan, S. The tribological state test in metal forming processes using experiment and modelling. J. Achiev. Mater. Manuf. Eng. 2006, 18, 383–386. [Google Scholar]
  84. Nine, H.D. Drawbead forces in sheet metal forming. In Mechanics of Sheet Metal Forming, 1st ed.; Koistinen, D.P., Wang, N.M., Eds.; Springer: Boston, MA, USA, 1978; pp. 179–211. [Google Scholar]
  85. Samuel, M. Influence of drawbead geometry on sheet metal forming. J. Mater. Process. Technol. 2002, 122, 94–103. [Google Scholar] [CrossRef]
  86. Skarpelos, P.; Morris, J.W., Jr. The effect of surface morphology on friction during forming of electrogalvanized sheet steel. Wear 1997, 212, 165–172. [Google Scholar] [CrossRef]
  87. Nanayakkara, N.K.B.M.P.; Kelly, G.L.; Hodgson, P.D. Determination of the coefficient of friction in partially penetrated draw beads. Steel Grips 2004, 2, 677–680. [Google Scholar]
  88. Meinders, V.T. Developments in Numerical Simulations of the Real-Life Deep Drawing Process. Ph.D. Thesis, University of Twenty, Enschede, The Netherlands, 11 February 2000. [Google Scholar]
  89. Sanchez, L.R. Characterisation of a measurement system for reproducible friction testing on sheet metal under plane strain. Tribol. Int. 1999, 32, 575–586. [Google Scholar] [CrossRef]
  90. Olsson, D.D.; Bay, N.; Andreasen, J.L. Direct Friction Measurement in Draw Bead Testing. In Proceedings of the 8th International Conference on Technology of Plasticity, Verona, Italy, 9–13 October 2005. [Google Scholar]
  91. Vallance, D.W.; Matlock, D.K. Application of the bending-under-tension friction test to coated sheet steels. J. Mater. Eng. Perform. 1992, 1, 685–693. [Google Scholar] [CrossRef]
  92. Kim, Y.S.; Jain, M.K.; Metzger, D.R. Determination of pressure-dependent friction coefficient from draw-bend test and its application to cup drawing. Int. J. Mach. Tools Manuf. 2012, 56, 69–78. [Google Scholar] [CrossRef]
  93. Duncan, J.L.; Shabel, B.S.; Filho, J.G. A Tensile Strip Test for Evaluating Friction in Sheet Metal Forming; SAE Technical Paper 780391; SAE: Warrendale, PA, USA, 1978; p. 8. [Google Scholar]
  94. Uyyuru, R.K.; Simjith, M.; Kailas, S.V. Friction in metal forming. In Metal Forming Technology and Process Modelling, 1st ed.; Dixit, U.S., Narayanan, R.G., Eds.; McGraw Hill Education: New Delhi, India, 2013; pp. 156–198. [Google Scholar]
  95. Lovell, M.; Higgs, C.F.; Deshmukha, P.; Mobley, A. Increasing formability in sheet metal stamping operations using environmentally friendly lubricants. J. Mater. Process. Technol. 2006, 177, 87–90. [Google Scholar] [CrossRef]
  96. Hao, S.; Klamecki, B.E.; Ramalingam, S. Friction measurement apparatus for sheet metal forming. Wear 1999, 224, 1–7. [Google Scholar] [CrossRef]
  97. Azushima, A.; Zhu, J. Tribological Behavior at the Interface in Tension-Bending Type Test for Sheet Metal Forming. In Proceedings of the 7th International Conference on Technology of Plasticity, Tokyo, Japan, 27 October–1 November 2002. [Google Scholar]
  98. Azushima, A.; Sakurmoto, M.; Inagaki, M. Direct Observation of Interface Between Tool and Workpiece in Sliding Condition Under Tension Bending. In Proceeding of the 55th Japanese Joint Conference for the Technology of Plasticity, Tokyo, Japan, 26–28 May 2006. [Google Scholar]
  99. Lu, B.; Fang, Y.; Xu, D.K.; Chen, J.; Oub, H.; Moser, N.H.; Cao, J. Mechanism investigation of friction-related effects in single point incremental forming using a developer oblique roller-ball tool. Int. J. Mach. Tools Manuf. 2014, 85, 14–29. [Google Scholar] [CrossRef]
  100. Xu, D.; Wu, W.; Malhotra, R.; Chen, J.; Lu, B.; Cao, J. Mechanism investigation for the influence of tool rotation and laser surface texturing (LST) on formability in single point incremental forming. Int. J. Mach. Tools Manuf. 2013, 73, 37–46. [Google Scholar] [CrossRef]
  101. Durante, M.; Formisano, A.; Langella, A.; Memola, F.M.C. The influence of tool rotation on an incremental forming process. J. Mater. Process. Technol. 2009, 209, 4621–4626. [Google Scholar] [CrossRef]
  102. Wei, H.; Hussain, G.; Iqbal, A.; Zhang, Z. Surface roughness as the function of friction indicator and an import ant parameters-combination having controlling influence on the roughness: Recent results in incremental forming. Int. J. Adv. Manuf. Technol. 2019, 101, 2533–2545. [Google Scholar] [CrossRef]
  103. Kim, Y.H.; Park, J.J. Effect of process parameters on formability in incremental forming of sheet metal. J. Mater. Process. Technol. 2002, 130, 42–46. [Google Scholar] [CrossRef]
  104. Ilyas, M.; Hussain, G.; Espinosa, C. Failure and strain gradient analyses in incremental forming using GTN model. Int. J. Lightweight Mater. Manuf. 2019, 2, 177–185. [Google Scholar] [CrossRef]
  105. Durante, M.; Formisano, A.; Langella, A. Observations on the influence of tool-sheet contact conditions on an incremental forming process. J. Mater. Eng. Perform. 2011, 20, 941–946. [Google Scholar] [CrossRef] [Green Version]
  106. Petek, A.; Podgornik, B.; Kuzman, K.; Čekada, M.; Waldhauser, W.; Vižintin, J. The analysis of complex tribological system of single point incremental sheet metal forming—SPIF. Stroj. Vestn. J. Mech. Eng. 2008, 54, 266–273. [Google Scholar]
  107. Minutolo, F.C.; Durante, M.; Formisano, A.; Langella, A. Evaluation of the maximum slope angle of simple geometries carried out by incremental forming process. J. Mater. Process. Technol. 2007, 194, 145–150. [Google Scholar] [CrossRef]
  108. Hussain, G. Microstructure and mechanical and tribological properties of a lubricant coating for incremental forming of a Ti sheet. Trans. Mech. Eng. 2014, 38, 423–429. [Google Scholar]
  109. Saidi, B.; Boulila, A.; Ayadi, M.; Nasri, R. Prediction of the Friction Coefficient of the Incremental Sheet Forming SPIF. In Proceedings of the 6th International Congress Design and Modelling of Mechanical Systems CMSM’2015, Hammamet, Tunisia, 23–25 March 2015. [Google Scholar]
  110. Azevedo, N.G.; Farias, J.S.; Bastos, R.P.; Teixeira, P.; Davim, J.P.; Jose, R.; Alves de Sousa, R.J. Lubrication aspects during single point incremental forming for steel and aluminum materials. Int. J. Precis. Eng. Manuf. 2015, 16, 1–7. [Google Scholar] [CrossRef]
  111. Trzepieciński, T.; Trytek, A.; Lemu, H.G. Study of frictional properties of AMS nickel-chromium alloys. Key Eng. Mater. 2016, 674, 244–249. [Google Scholar] [CrossRef]
  112. Oleksik, V. Influence of geometrical parameters, wall angle and part shape on thickness reduction of single point incremental forming. Procedia Eng. 2014, 81, 2280–2285. [Google Scholar] [CrossRef]
  113. Popov, V.L. Coulomb’s law of friction. In Contact Mechanics and Friction, Physical Principles and Applications; Springer-Verlag: Berlin/Heidelberg, Germany, 2010; pp. 133–154. [Google Scholar]
  114. Mousavi, A.; Sperk, T.; Gietzelt, T.; Kunze, T.; Lasagni, A.F.; Brosius, A. Effect of contact area on friction force in sheet metal forming operations. Key Eng. Mater. 2018, 767, 77–84. [Google Scholar] [CrossRef]
Figure 1. Scheme of a tribological system in sheet metal forming.
Metals 10 00047 g001
Figure 2. Tribological tests representing the friction conditions in the specific areas of the draw piece: (a) pin-on-disc tribometer, (b) bending under tension, (c) drawing with tangential compression, (d) bending with tangential compression, (e) strip-drawing test, (f) draw-bead test, (g) strip-tension test, (h) hemispherical stretching, (i) strip-reduction testing; prepared based on [16].
Metals 10 00047 g002
Figure 3. Types of sheet-tool contact: (a) flat contact, (b) sliding over a curved part of the tool, and (c) linear sliding contact.
Metals 10 00047 g003
Figure 4. Schematic diagram of the strip-drawing test: (a) cylindrical dies and (b) flat dies.
Metals 10 00047 g004
Figure 5. Strip-drawing test setup with combined shapes of counter-samples.
Metals 10 00047 g005
Figure 6. Schematic representation of a hot strip drawing simulator: 1—chain, 2—electric furnace, 3—tool holder, 4—movable tool holder, 5—heated sheet metal strip, 6—sliding bed with a hydraulic holding down device; prepared on the basis of [45].
Metals 10 00047 g006
Figure 7. Illustration of rotary counter-sample tests (a) pin-on-disc, and (b) twist compression (prepared on the basis of [54]).
Metals 10 00047 g007
Figure 8. Schematic configuration of the tribological test: 1—specimen, 2—liquid container, 3—heat chamber, 4—load cell, 5—pin, 6—cover; prepared on the basis of [58].
Metals 10 00047 g008
Figure 9. Schematic of UMT (Universal Mechanical Tester)-Tribolab tribometer.
Metals 10 00047 g009
Figure 10. Schematic illustration of flat-die strip drawing: 1—specimen, 2—spring, 3—spring buffer, 4—tool holder, 5—tool, 6—force sensor.
Metals 10 00047 g010
Figure 11. Illustrative diagram of the strip-reduction test carried out between (a) cylindrical dies (b) flat dies.
Metals 10 00047 g011
Figure 12. Schematic representation of the SRT: 1—specimen, 2—jaws, 3—piezoelectric transducer, 4—tool pin, 5—supporting plate, 6—vertical guide; prepared on the basis of [68].
Metals 10 00047 g012
Figure 13. Schematic diagram of an SRT with a textured tool surface, prepared based on [62].
Metals 10 00047 g013
Figure 14. Schematic of the ironing process during (a) forward and (b) backward strokes.
Metals 10 00047 g014
Figure 15. Schematic diagram of an SRT with a textured tool surface: 1—specimen; 2, 3, 6, 7—stationary cylindrical tool pins; 4, 8—housing; 5, 9—heater blocks; 10—base; prepared based on [33].
Metals 10 00047 g015
Figure 16. Forces acting on an elementary section of the strip.
Metals 10 00047 g016
Figure 17. Schematic view of the testing device: 1—device frame, 2—specimen, 3 and 4—tension members, 5 and 6—extensometers, 7—working roll, 8—fixing pin.
Metals 10 00047 g017
Figure 18. Schematic view of BUT device.
Metals 10 00047 g018
Figure 19. Schematic diagram of the bending under tension test realized by (a) fixed and (b) rotatable pin.
Metals 10 00047 g019
Figure 20. Equilibrium of the torque in the BUT, prepared based on [76].
Metals 10 00047 g020
Figure 21. Schematic of the hot bending under the tension test.
Metals 10 00047 g021
Figure 22. Proposed methods for the determination of the COF on a die edge with a (a) convex and (b) concave profile.
Metals 10 00047 g022
Figure 23. The concept of determining frictional resistance: (a) fixed rollers, (b) rotatable rollers, (c) geometrical parameters of draw bead.
Metals 10 00047 g023
Figure 24. The relation between the total angle of wrap 2α and the middle roller penetration z.
Metals 10 00047 g024
Figure 25. Schematic diagram of the tensile strip test.
Metals 10 00047 g025
Figure 26. Schematic of the “U” shape strip test, prepared based on [96].
Metals 10 00047 g026
Figure 27. Schematic diagram of the OSU friction test: F1—the force acting on the center of the specimen, F2—is the force acting in side walls, H—punch height, N—pressure force, R—radius of cylindrical counter-sample, γ is the contact angle, ε1 and ε2—strains of the specimen in the center and side walls, respectively.
Metals 10 00047 g027
Figure 28. Schematic illustration of the flat-die strip drawing.
Metals 10 00047 g028
Figure 29. Schematic representation of the ORB test: c—CNC spindle, 2—tool arm, 3—ball bearings, 4—ball cup, 5—roller ball; prepared based on [99].
Metals 10 00047 g029
Figure 30. Sliding test path for the evaluation of COF (number of tool passes have been indicated by 1–3 and 2–4), prepared based on [101].
Metals 10 00047 g030
Figure 31. Sides of the tool path during the forming of pyramid frusta.
Metals 10 00047 g031
Figure 32. Relationship of the forming force components.
Metals 10 00047 g032

