Article

Mechanism of CaF2 under Vacuum Carbothermal Conditions for Recovering Nickel, Iron, and Magnesium from Garnierite

1
State Key Laboratory of Complex Non-ferrous Metal Resources Clear Utilization, Kunming University of Science and Technology, Kunming 650093, China
2
National Engineering Laboratory for Vacuum Metallurgy, Kunming University of Science and Technology, Kunming 650093, China
3
Key Laboratory of Vacuum Metallurgy for Nonferrous Metal of Yunnan Province, Kunming University of Science and Technology, Kunming 650093, China
4
Faculty of Metallurgical and Energy Engineering, Kunming University of Science and Technology, Kunming 650093, China
*
Author to whom correspondence should be addressed.
Metals 2020, 10(1), 129; https://doi.org/10.3390/met10010129
Submission received: 15 November 2019 / Revised: 7 January 2020 / Accepted: 9 January 2020 / Published: 15 January 2020
(This article belongs to the Special Issue Advances in Pyrometallurgy)

Abstract

:
Nickel laterite ore is divided into three layers and the garnierite examined in this study belongs to the third layer. Garnierite is characterized by high magnesium and silicon contents. The main contents of garnierite are silicates, and nickel, iron, and magnesium exist in silicates in the form of lattice exchange. Silicate minerals are difficult to destroy so are suitable for smelting using high-temperature pyrometallurgy. To solve the problem of the large amounts of slag produced and the inability to recycle the magnesium in the traditional pyrometallurgical process, we propose a vacuum carbothermal reduction and magnetic separation process to recover nickel, iron, and magnesium from garnierite, and the behavior of the additive CaF2 in the reduction process was investigated. Experiments were conducted under pressures ranging from 10 to 50 Pa with different proportions of CaF2 at different temperatures. The experimental data were obtained by various methods, such as thermogravimetry, differential scanning calorimetry, scanning electron microscopy, energy dispersive spectrometry, X-ray diffraction, and inductively coupled plasma atomic emission spectroscopy. The analysis results indicate that CaF2 directly reacted with Mg2SiO4, MgSiO3, Ni2SiO4, and Fe2SiO4, which were isolated from the bearing minerals, to produce low-melting-point compounds (FeF2, MgF2, NiF2, etc.) at 1315 and 1400 K. This promoted the conversion of the raw materials from a solid–solid reaction to a liquid–liquid reaction, accelerating the mass transfer and the heat transfer of Fe–Ni particles, and formed Si–Ni–Fe alloy particles with diameters of approximately of 20 mm. The smelting materials appeared stratified, hindering the reduction of magnesium. The results of the experiments indicate that at 1723 K, the molar ratio of ore/C was 1:1.2, the addition of CaF2 was 3%, the recovery of Fe and Ni reached 82.97% and 98.21% in the vacuum carbothermal reduction–magnetic separation process, respectively, and the enrichment ratios of Fe and Ni were maximized, reaching 3.18 and 9.35, respectively.

1. Introduction

Nickel is an important metal in the modern world, used in stainless steel, electroplating, rechargeable batteries, and super alloys [1,2] to improve peoples’ quality of life, and widely used in improving human health in nickel-containing medical devices, medical artificial bones, stents, and new anticancer drugs [3,4,5,6]. With the increase of demand for nickel and the rapid depletion of nickel sulfide ore, more attention is being paid to low-grade nickel laterite ore [7,8,9]. Generally, nickel laterite ore can be divided into three categories: limonitic ore, transition ore, and garnierite [10,11,12]. According to the different compositions of every layer, nickel laterite ores are treated using different methods, including pyrometallurgical and hydrometallurgical methods [13]. Hydrometallurgical techniques are more applicable to limonitic ore, which includes ammonia–ammonium carbonate leaching, pressure acid leaching (PAL), and high-pressure acid leaching (HPAL) [14,15,16,17,18,19,20]. Garnierite is more suitable for pyrometallurgical methods due to the high content of magnesium. At present, the mature industrial pyrometallurgical methods include rotary kilns-electric furnaces (RKEF) and Krupp–Ren [21,22,23].
Previous studies reported that CaF2 is used as additive in pyrometallurgy of nickel laterite ore. Ma et al. [24] studied the influence of CaF2 in the nickel laterite ore reduction process. The results indicated that the aggregation of nickel and iron particles increased significantly from 1 to 200 μm after adding CaF2, which indicates that CaF2 can effectively reduce the surface tension of the newly formed alloy. This is beneficial for magnetic separation process and increases the nickel grade. Cao et al. [25] determined the production and enrichment rates of nickel and iron under different smelting conditions by changing the amount of added reducing agent and comparing the different production rates of ferronickel with CaF2, CaF2, and hydrated lime. However, the authors did not report the optimal conditions, nor did they specifically explore the mechanism of CaF2 and hydrated lime in the reduction process.
Previous studies only focused on the extraction of Ni and Fe, and ignored the extraction of higher values magnesium. The behavior of CaF2 in the reduction process has not been reported in the literature. Therefore, we propose a vacuum carbothermal reduction–magnetic separation process to recover nickel, iron, and magnesium from garnierite, and investigated the behavior of the added CaF2 in the reduction process. In this process, magnesium was reduced to magnesium vapor and condensed to obtain magnesium metal [26,27]. The experimental flow chart is shown in Figure 1.

2. Materials and Methods

2.1. Raw Materials

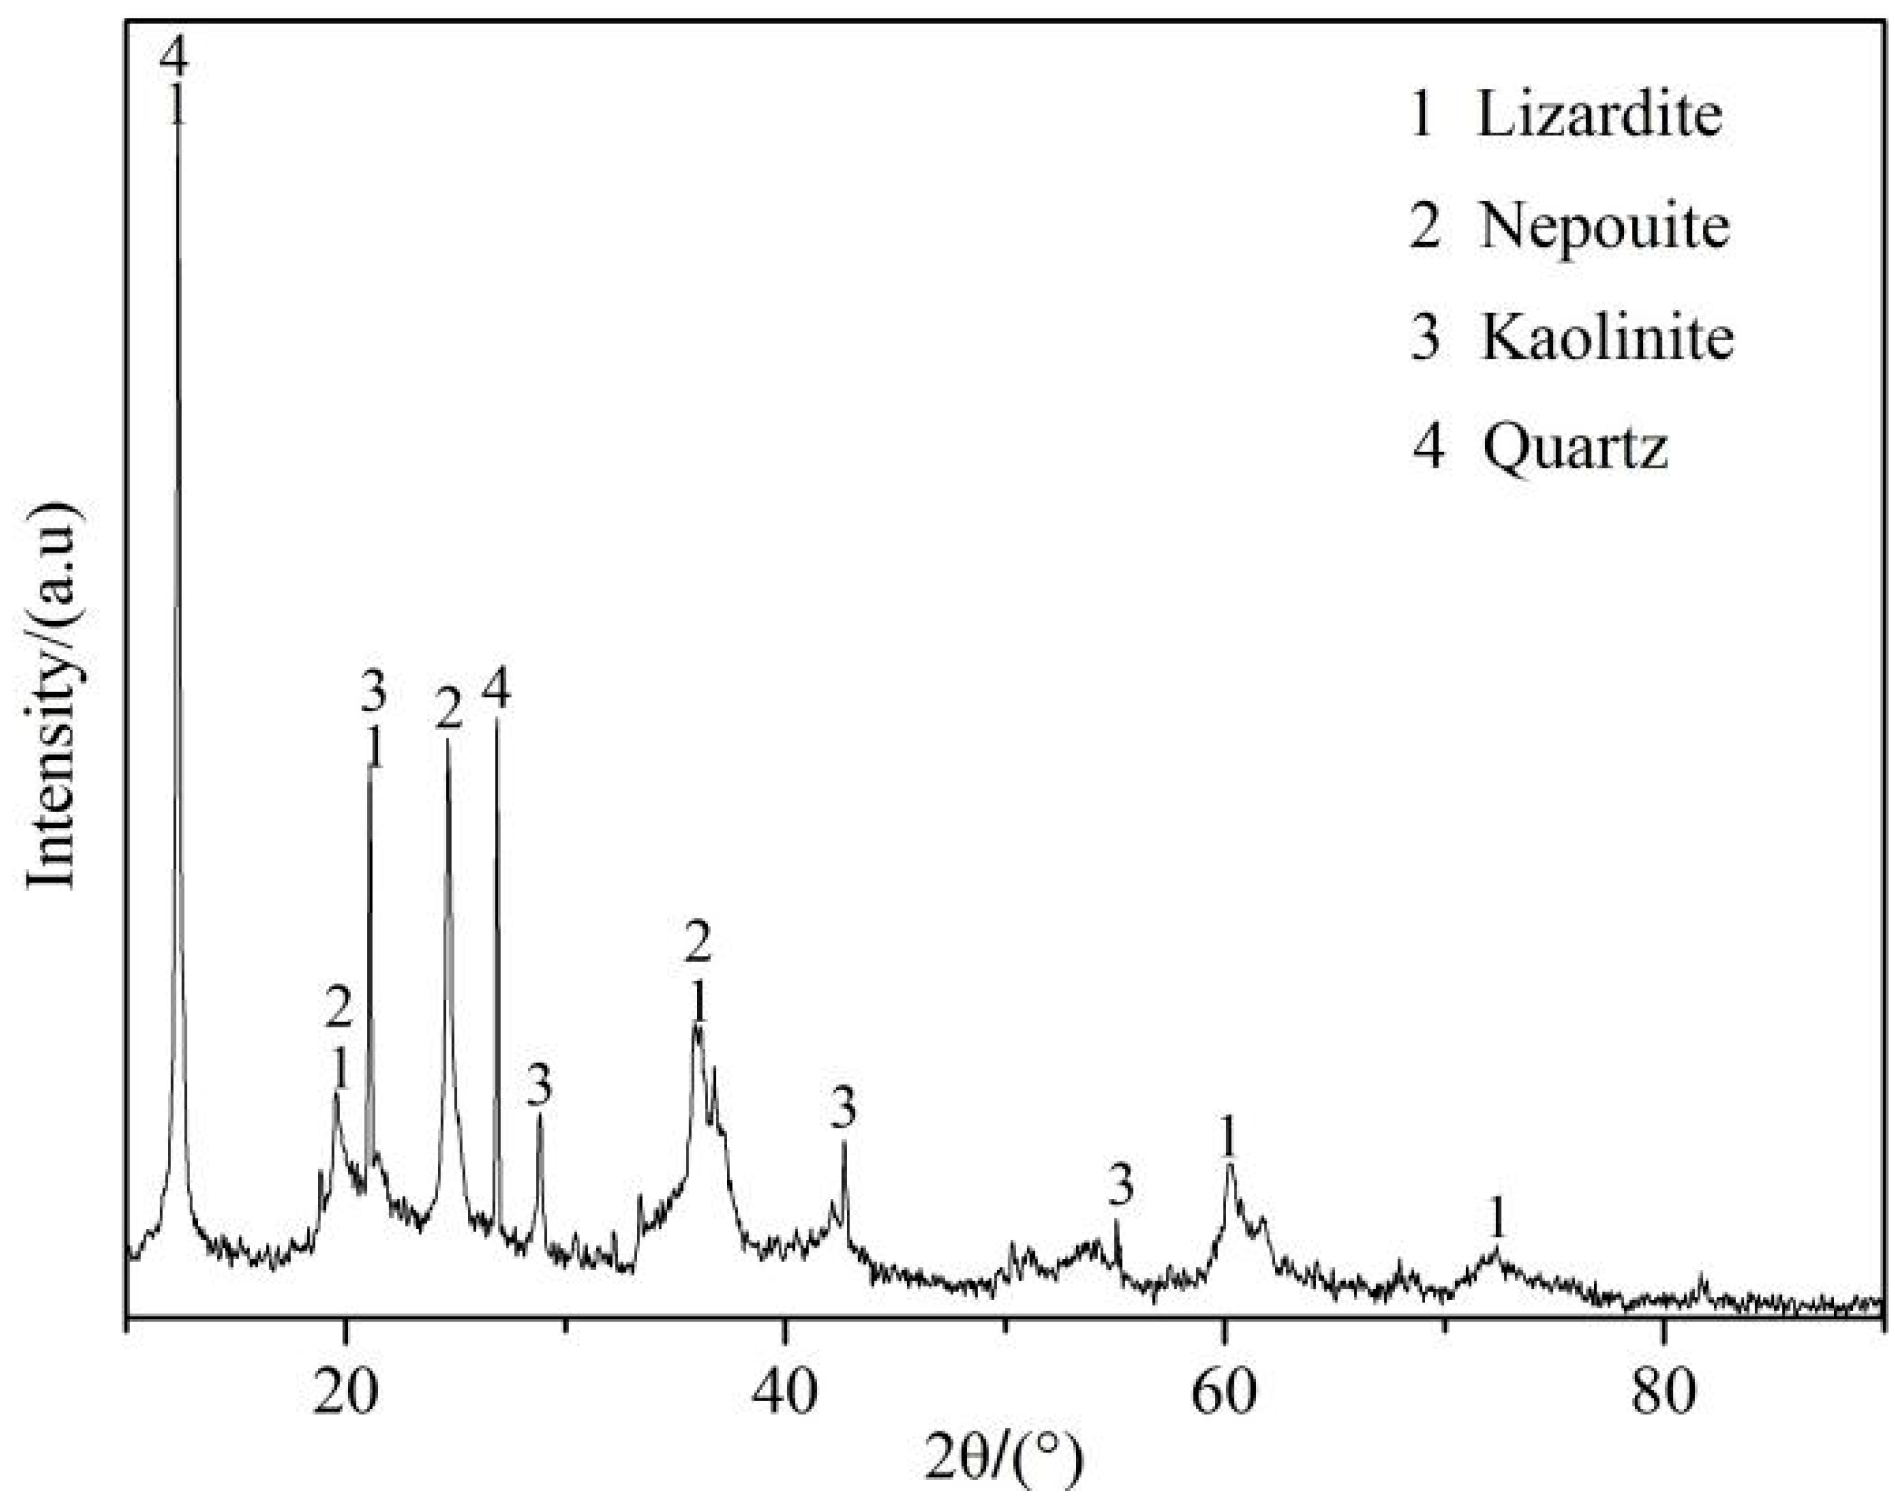
The garnierite sample used in this study was obtained from Yuanjiang, Yunnan province, China. The X-ray diffraction (XRD) analysis and the chemical analysis of the sample are shown in Figure 2 and Table 1. According to the XRD analysis, we found that the major phases of garnierite are lizardite, nepouite, kaolinite, and quartz. CaF2 was used as an additive in this study. The compositions of CaF2 and the coking coal are listed in Table 2 and Table 3, respectively.

2.2. Experimental Method and Equipment

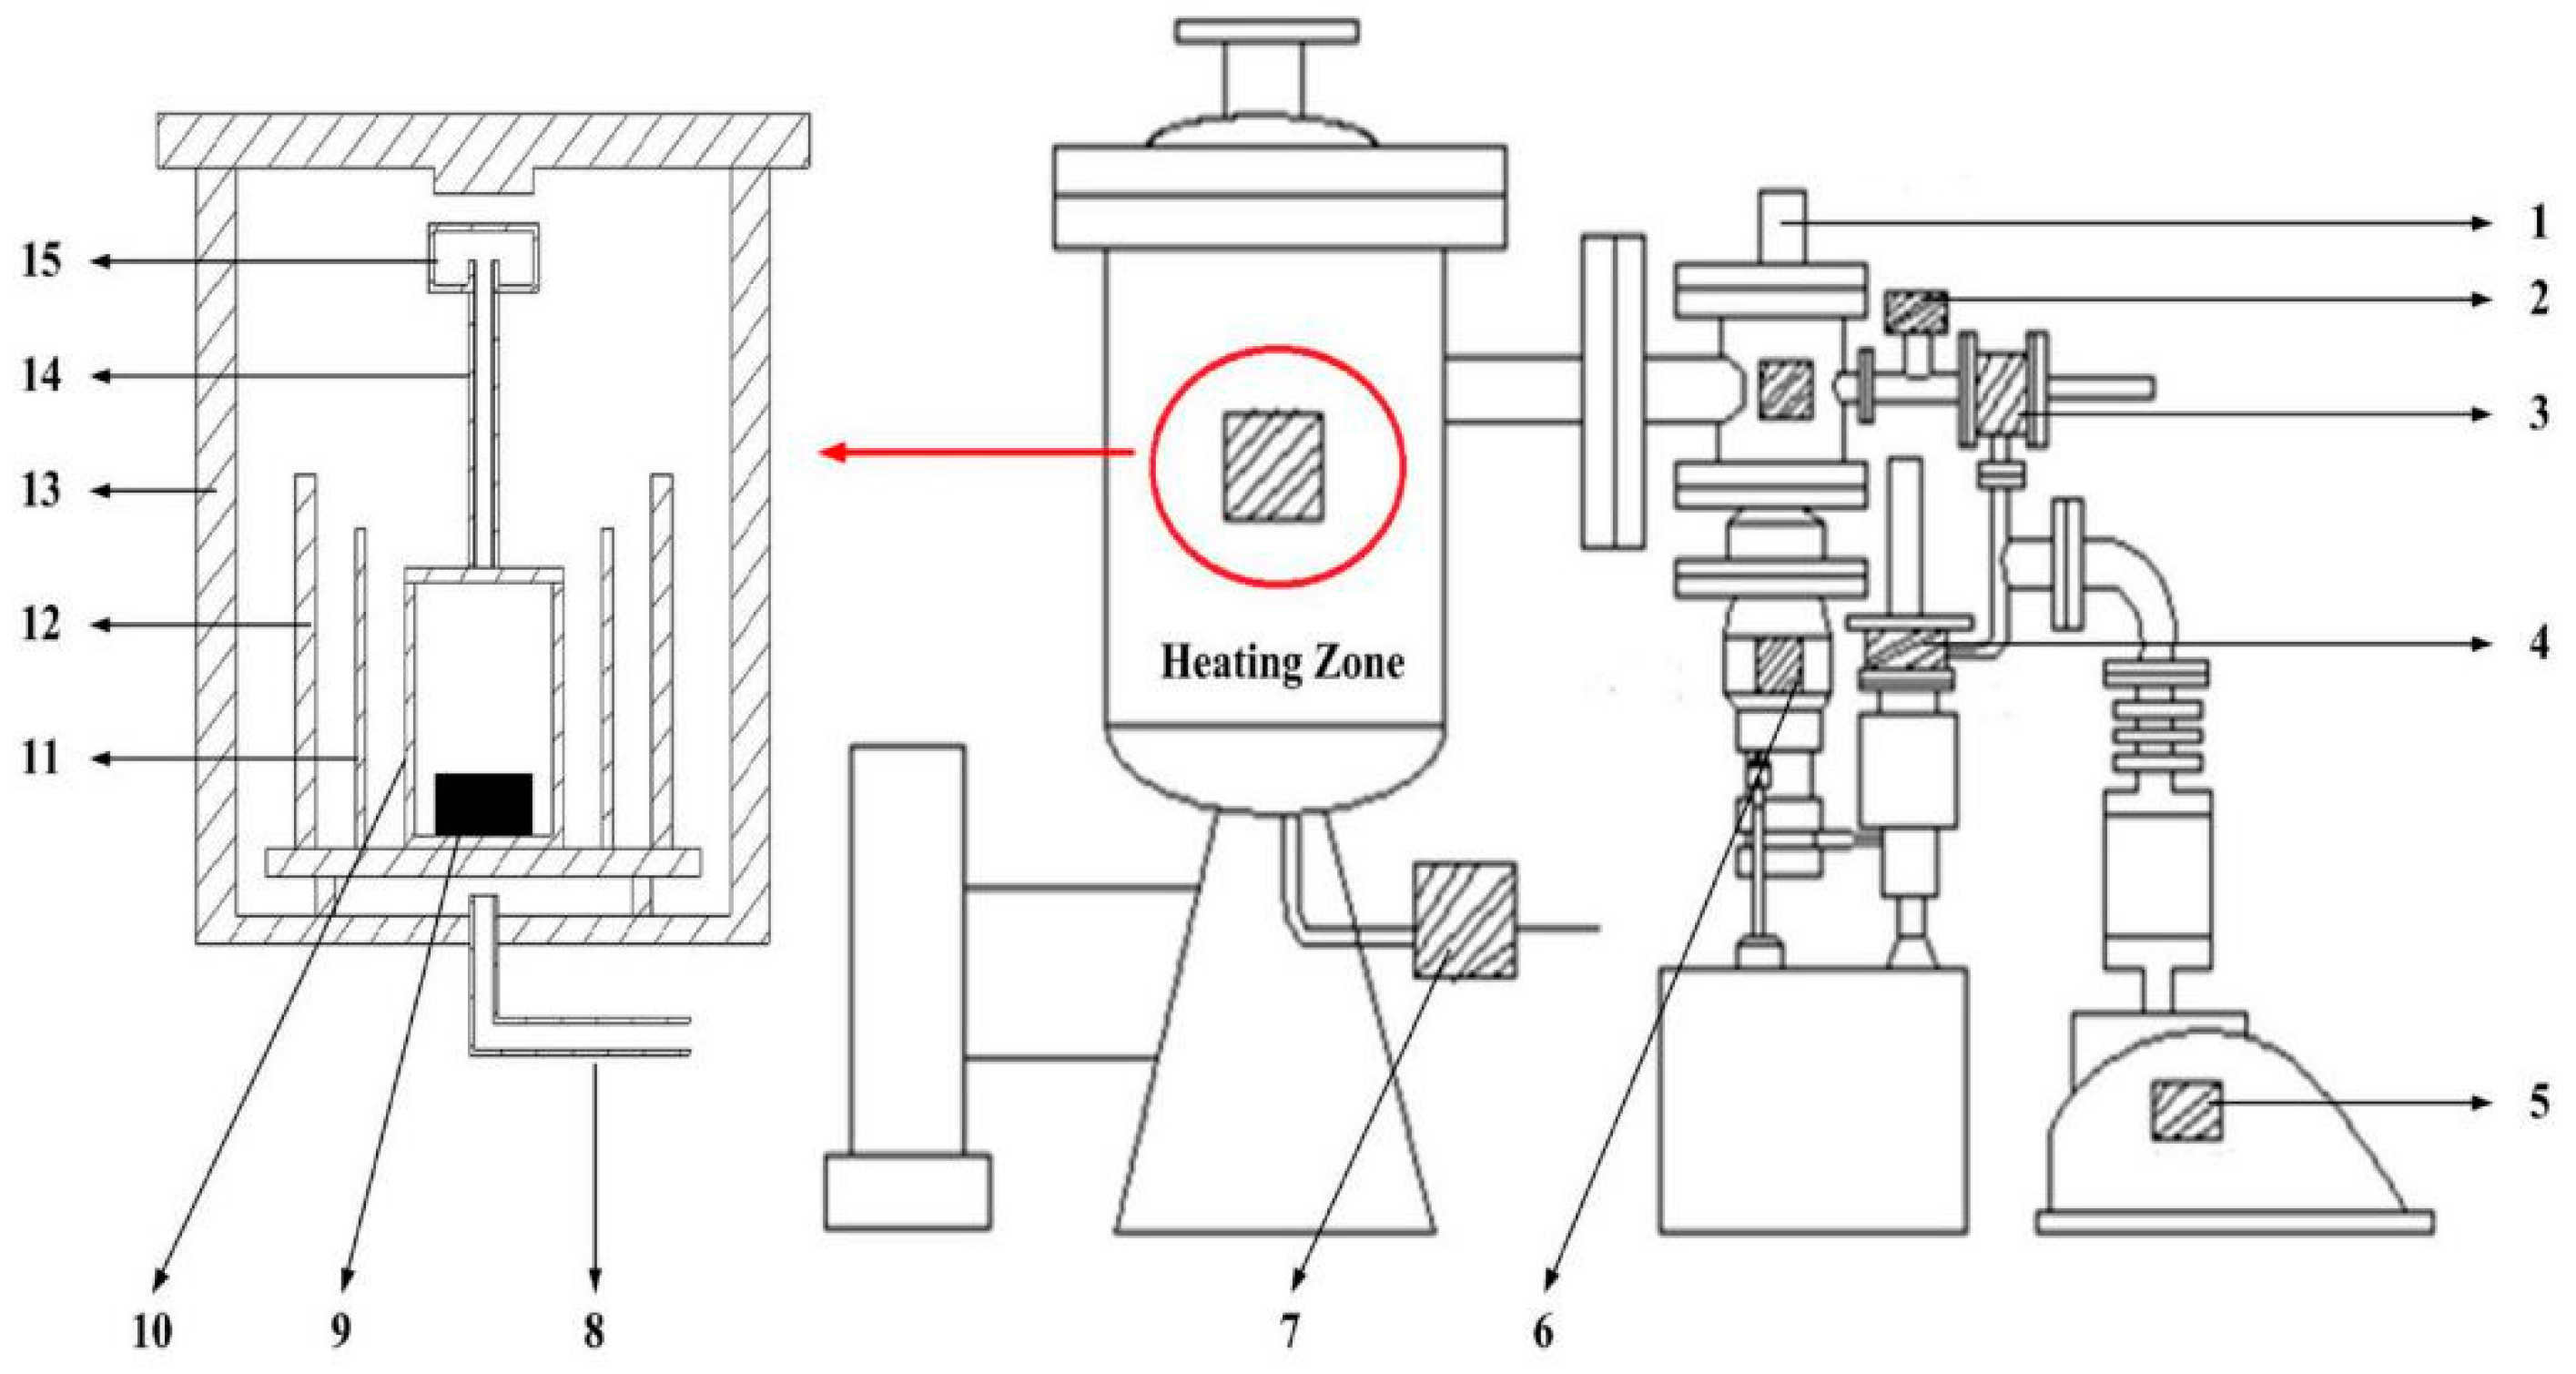
All garnierite and coking coal were crushed and screened to less than 74 µm, and the ore and C were mixed in a molar ratio of 1:1.2. The masses of CaF2, which were 0%, 3%, 6%, 9%, and 12%, were studied with regard to their behavior and effect on the experimental results. In the first, the mixed materials were formed into pellets of Φ20 mm × 20 mm at 5 MPa and then placed in a corundum crucible. Heating was applied under pressures ranging from 10 to 50 Pa by placing the corundum crucible into a graphite crucible in a vacuum furnace. The system temperature was raised from room temperature to the desired temperature and was held this temperature for 120 min. After, the reaction product was cooled to room temperature and removed. The schematic model of the vacuum distillation furnace for experiment is shown in Figure 3. For the nickel-rich residue, we used a vibrating grinding machine to crush the material to approximately 74 µm, and we placed the crushed materials into a planetary ball mill for 4 h of ball milling, allowing the materials to be mixed thoroughly and uniformly. After the ball milling was completed, the materials were removed, sampled, and sent for analyses, and magnetic separation was conducted for the remaining residue.
The remaining nickel-rich residue was ground and screened to 45 µm, and then wet magnetic separation was conducted. The N52 trademark of neodymium iron, with a surface magnetic field strength approximately 1.44–1.48 T, was used to adsorb the magnetic material. A magnetic substance was obtained after three magnetic separations.
The recovery α1 of the reduction process is expressed as:
α1 = Ma/M0,
where Ma and M0 refer to the masses of metals in the nickel-rich residue and in the ore, respectively. The recovery α2 of the reduction magnetic separation process is expressed as:
α2 = Mb/Ma,
where Ma and Mb refer to the masses of metals in the magnetic substances and in the nickel-rich residue, respectively. The recovery α of the whole process is expressed as:
α = α1 × α2.

2.3. Analysis Methods

The nickel-rich residue was identified with X-ray diffraction (XRD) Dmax-R diffractometer (Rigaku, Tokyo, Japan, Cu Kα radiation, 40 mA, 50 kV). The diffraction angle (2θ) was scanned from 10° to 90° in 4° increments. The morphology and the elemental composition of the particular regions were determined using scanning electron microscopy (SEM, TM-3030 Plus, HITACHI, Tokyo, Japan) equipped with energy-dispersive X-ray spectroscopy (EDS, INCA, Oxford, UK). Chemical analysis of the nickel-rich residue was performed using inductively coupled plasma atomic emission spectroscopy (ICP-OES) with an Optima 8000 (Perkin Elmer, Waltham MA, USA).

3. Results and Discussion

3.1. Experimental Phenomena and XRD/EDS Analysis

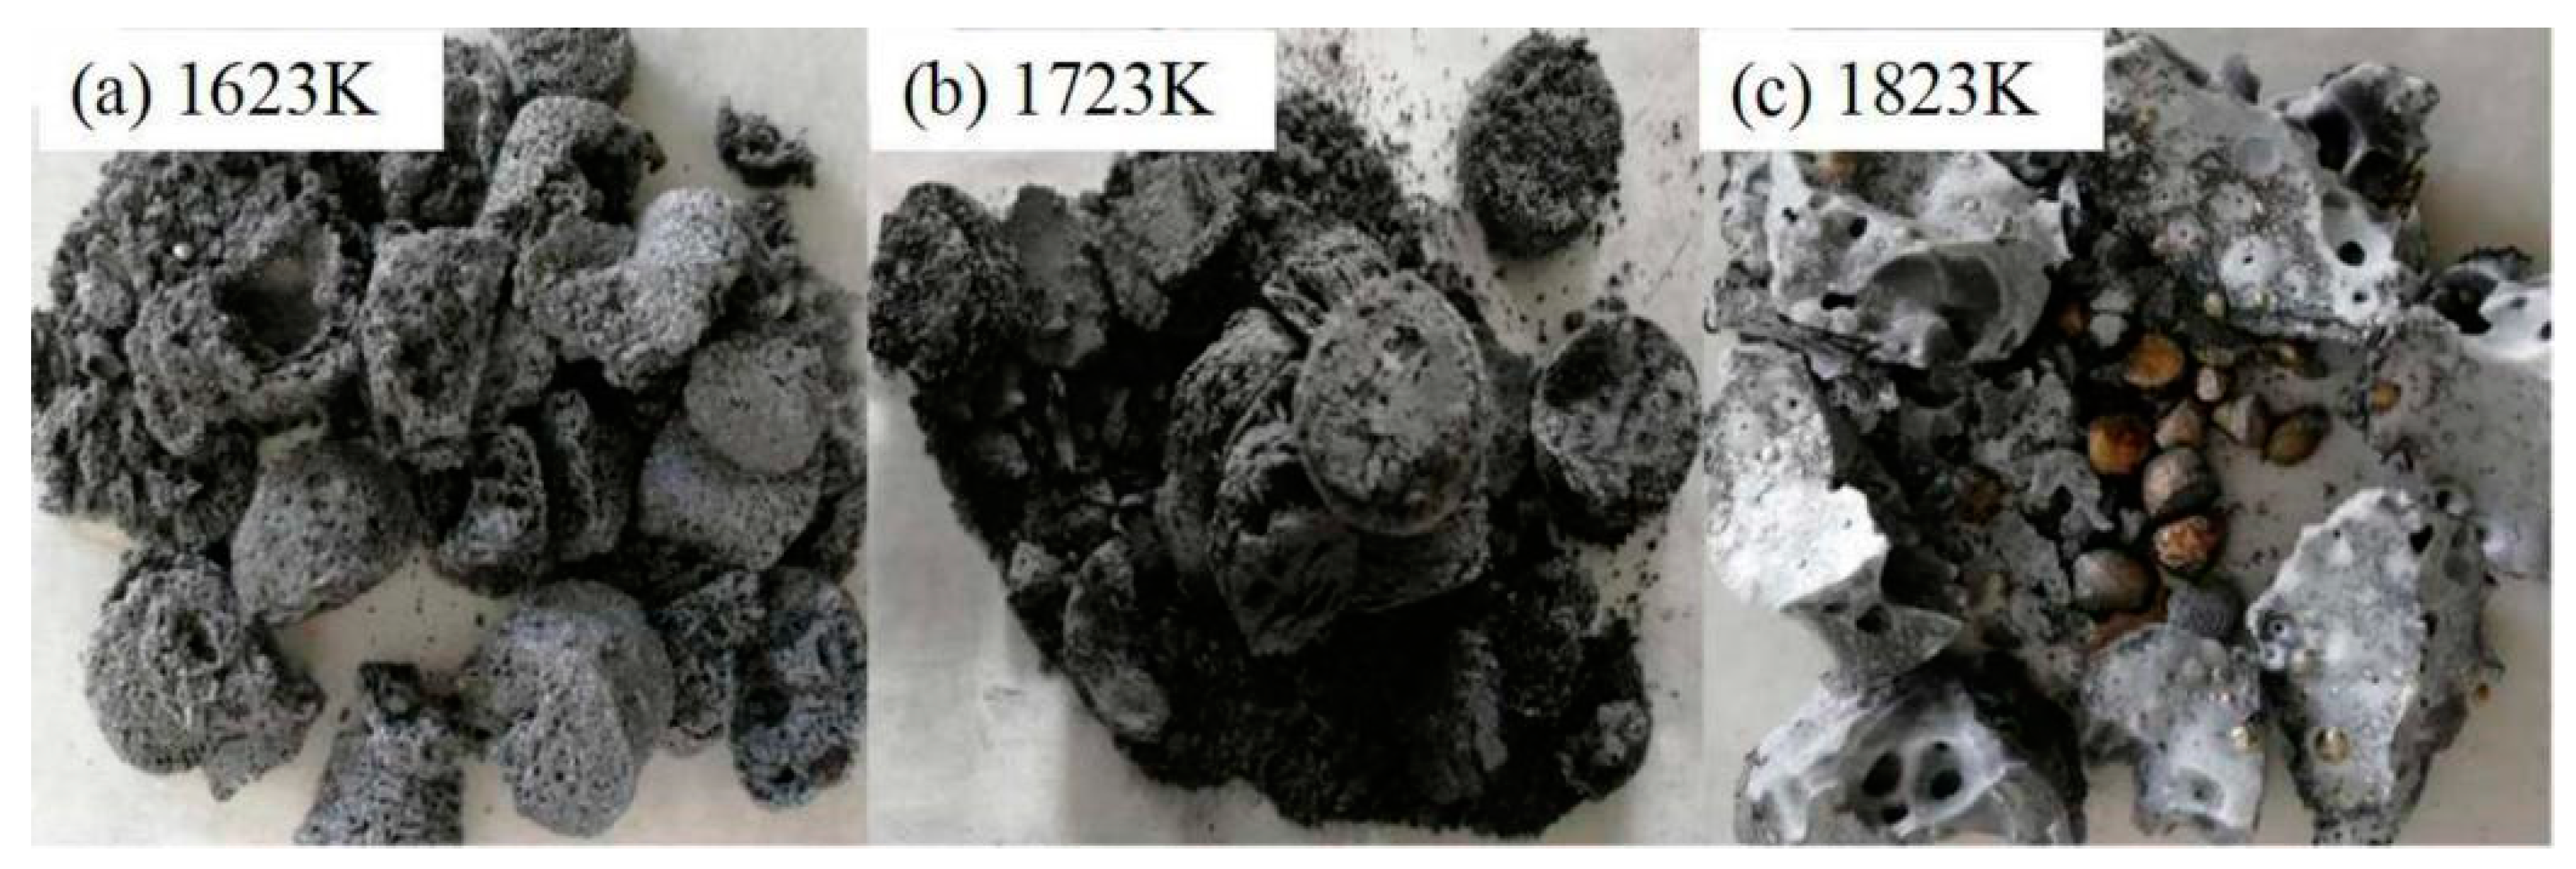
During the removal of the Fe–Ni-rich residue, we found different phenomena at the end of the experiment; no melting occurred at the experimental temperature when the addition of CaF2 was 0%. When the addition of CaF2 was 3%, the raw materials appeared to experience micro-melting at 1623 and 1723 K, however, the raw materials melted completely at 1823 K, as shown in Figure 4.
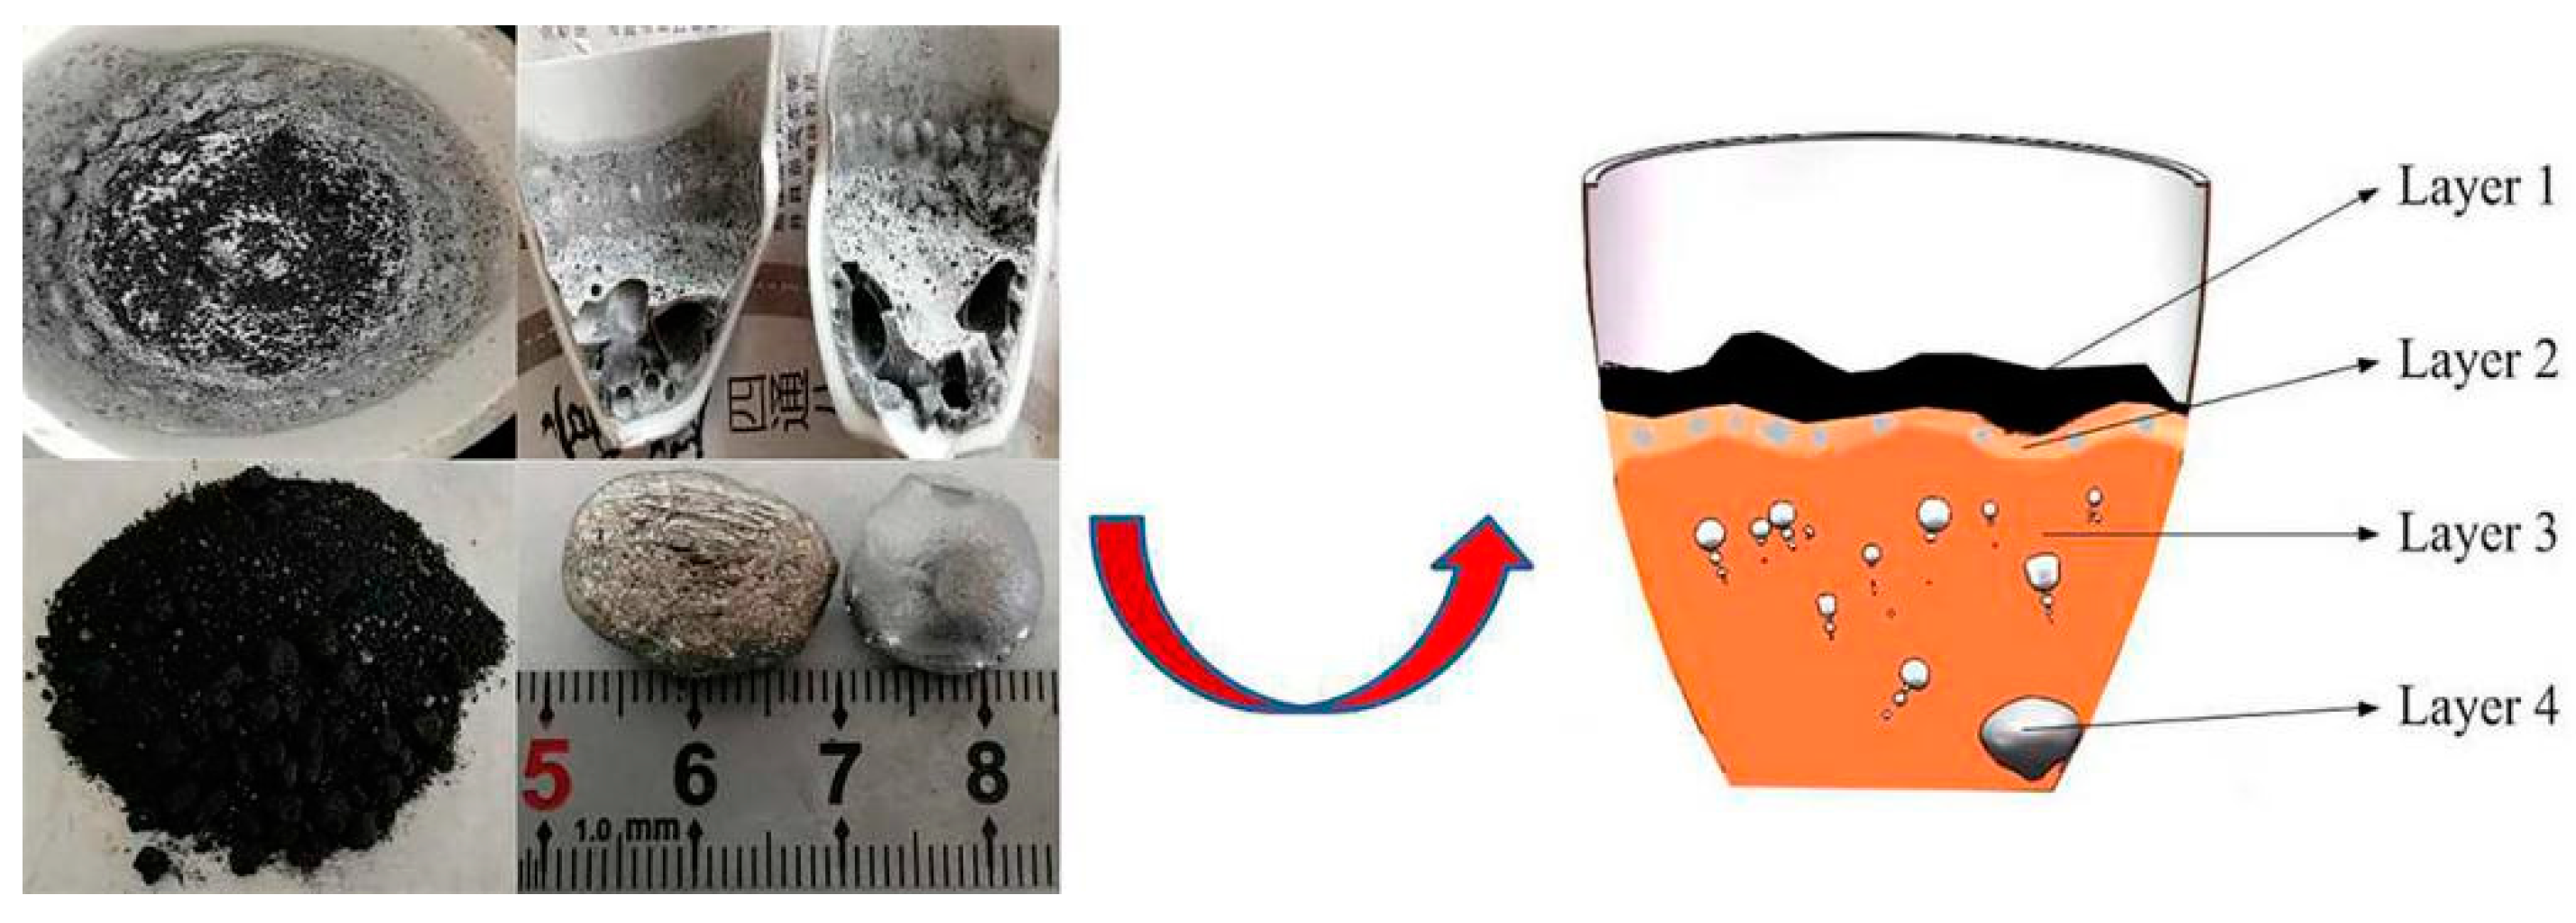
The left part of Figure 5 is the picture of the material removed after the vacuum carbothermal reduction. The black fluffy material in the picture is located on the top of the corundum crucible. After pouring the black fluffy material, we found that the material in the corundum crucible completely melted, with a layer of gray white material solidified with no hole on the surface on the top of the melted material. After the corundum crucible was broken, we found many large cavities in the melted material, and the color of solidified material below was gray black. Finally, large metal particles were found at the bottom of the corundum crucible. According to the above phenomena, we drew a layering diagram of the materials in the corundum crucible, as shown in the right part of Figure 5.
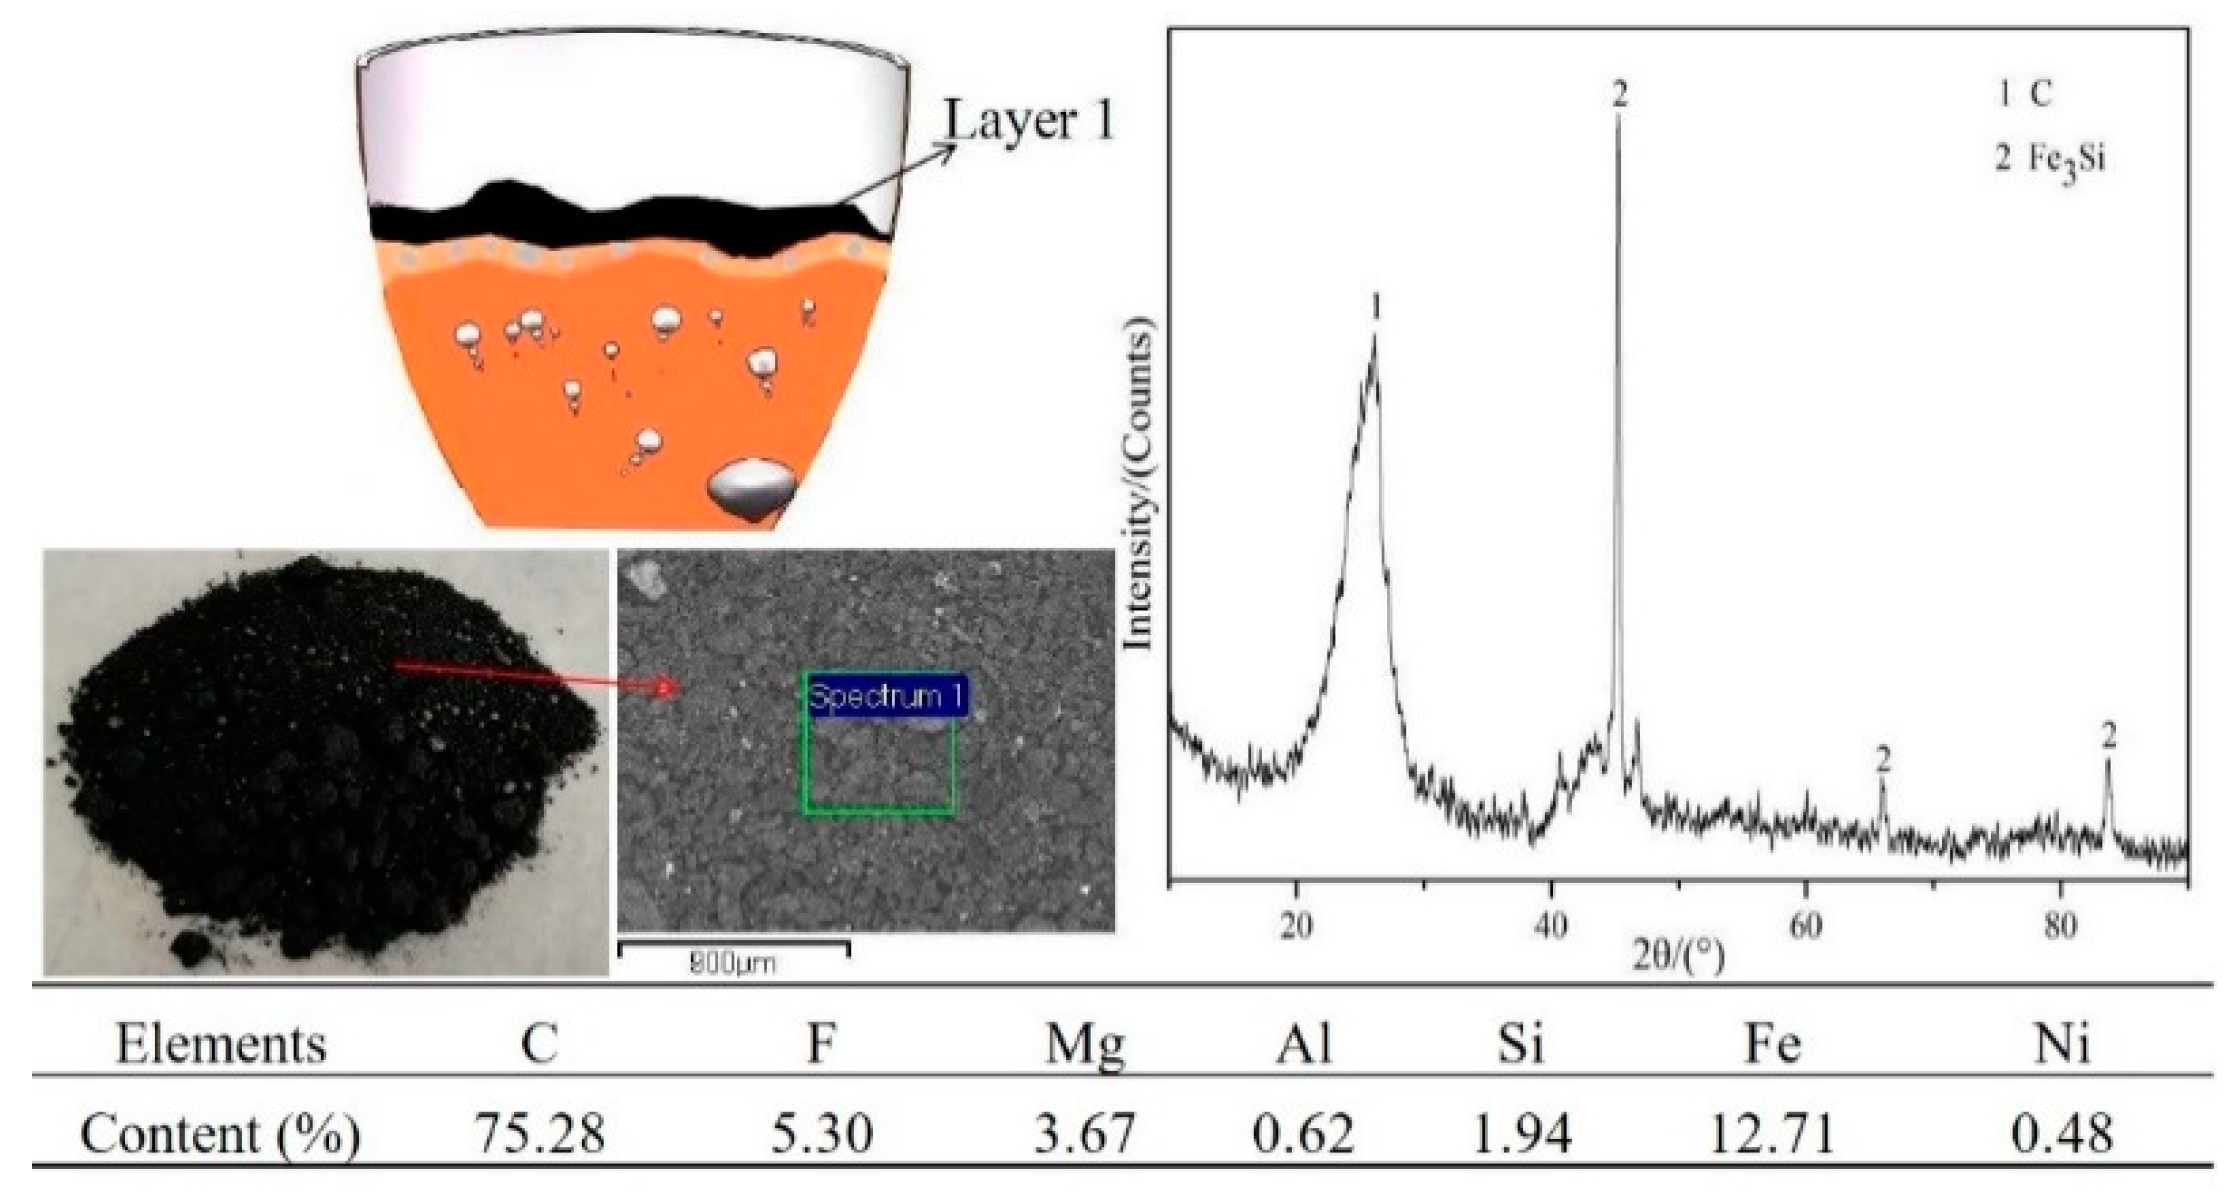
XRD and SEM/EDS analysis were conducted to determine the phase of black fluffy material and the composition of silver-white metal particles of the first layer, as shown in Figure 6. According to XRD analysis, the black fluffy material was mainly carbon, and the ferrosilicon should be the silver-white metal particles, which mixed with the black matter. SEM/EDS analysis showed that the carbon content reached 75.28%, the remaining materials were mainly Fe and F, and the contents of Fe and F were 12.71% and 5.30%, respectively.
The thermodynamic analysis of Equation (4) performed at 50 Pa showed that the initial reaction temperature of the production of FeF2 was 1398 K, and FeF2 will directly sublimate at 1373 K. We considered that the source of F was the volatilization of FeF2, with part of the Fe sourced from the ferrosilicon mixed in black matter, and the other part from the volatilization of FeF2. The equation can be expressed as:
Fe2SiO4(s) + 6C(s) + CaF2(s) = FeSi(s) + CaC2(s) + FeF2 (g) + 4CO (g)
ΔGT = 1731.126 − 1.238T kJ/mol.
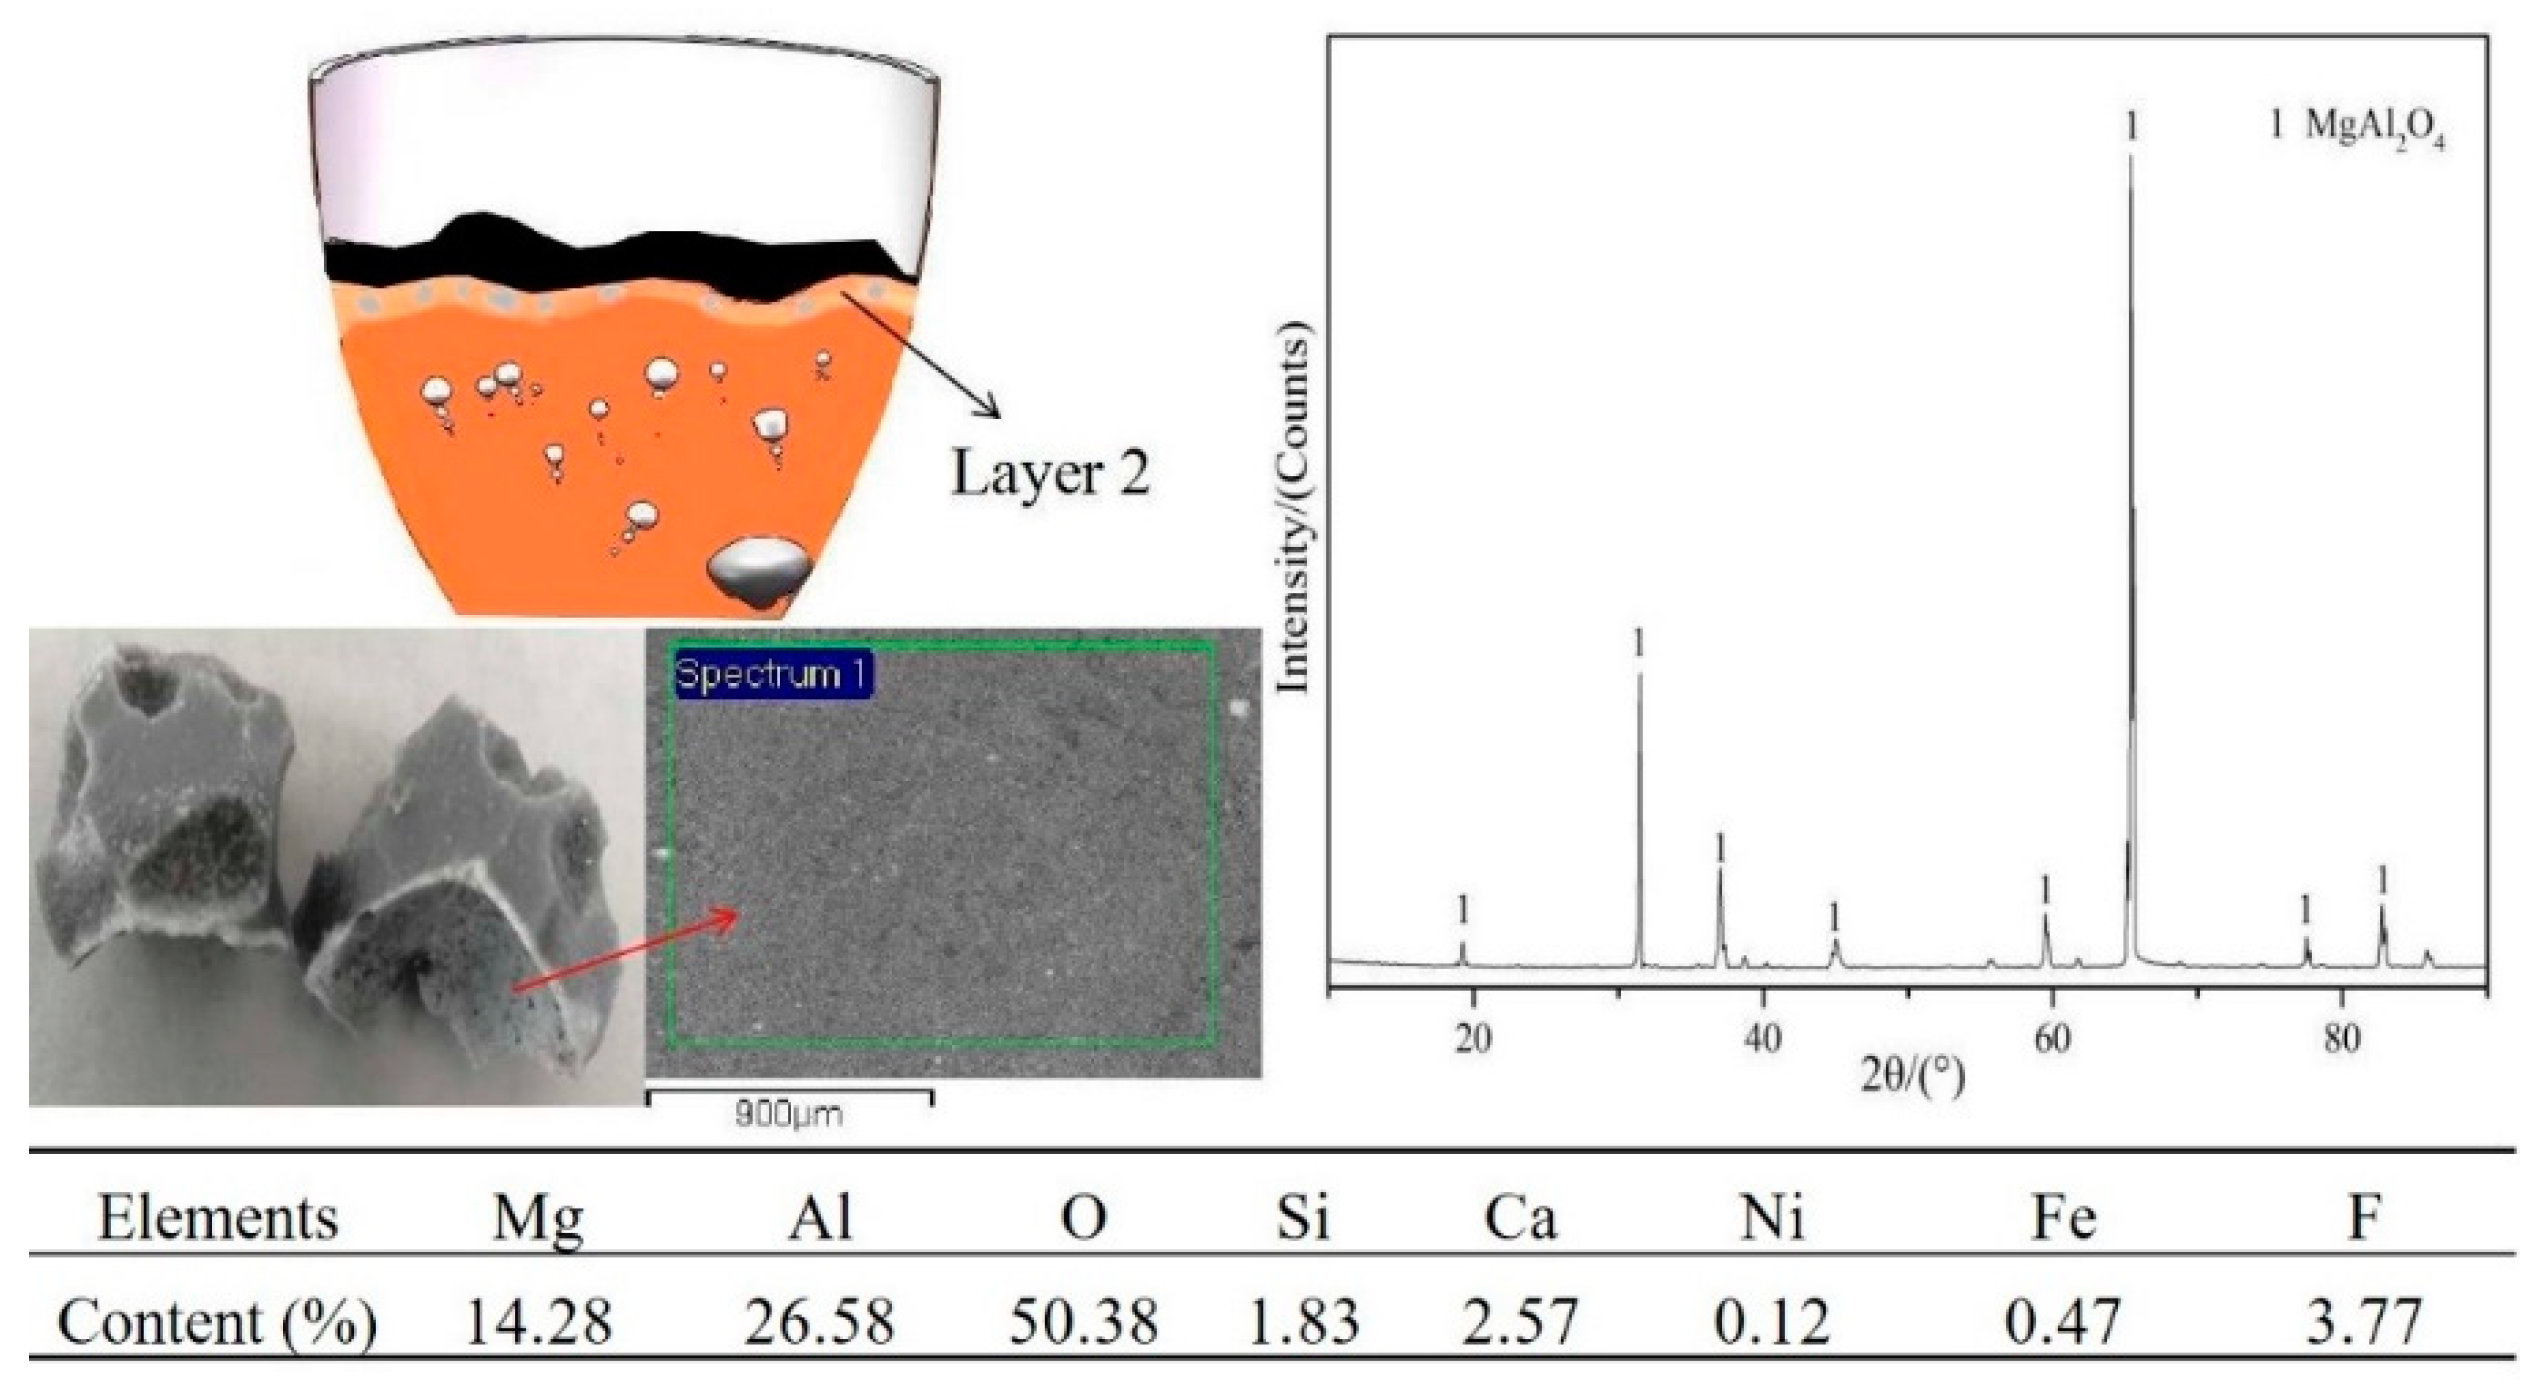
XRD and SEM/EDS analysis were performed to determine the phase and composition of the second layer, as shown in Figure 7. The XRD results showed that the white matter phase of the second layer was MgAl2O4, and the SEM/EDS results indicated that the white matter mainly contained Mg, Al, and O, at 14.28%, 26.58%, and 50.38%, respectively.
Combined with the thermodynamic calculation, Equations (5) and (6) showed that the reaction initial temperature for the formation of MgAl2O4 was 875 K, so the reaction to form MgAl2O4 could occur at the experimental conditions. The reason of Al2O3 did not reduce by carbon was the initial temperature of the reduction reaching 1691 K under the pressure of 50 Pa, which is much larger than the reaction initial temperature of MgAl2O4. The MgAl2O4 is denser than carbon, so the carbon floats above the MgAl2O4. The equations can be expressed as:
Mg2SiO4(s) + 2Al2O3(s) = 2MgAl2O4(s) + SiO2(s)
ΔGT = 19.255 − 0.022T kJ/mol,
Al2O3(s) + 3C(s) = 2Al(s) + 3CO (g)
ΔGT = 1344.640 − 0.795T kJ/mol.
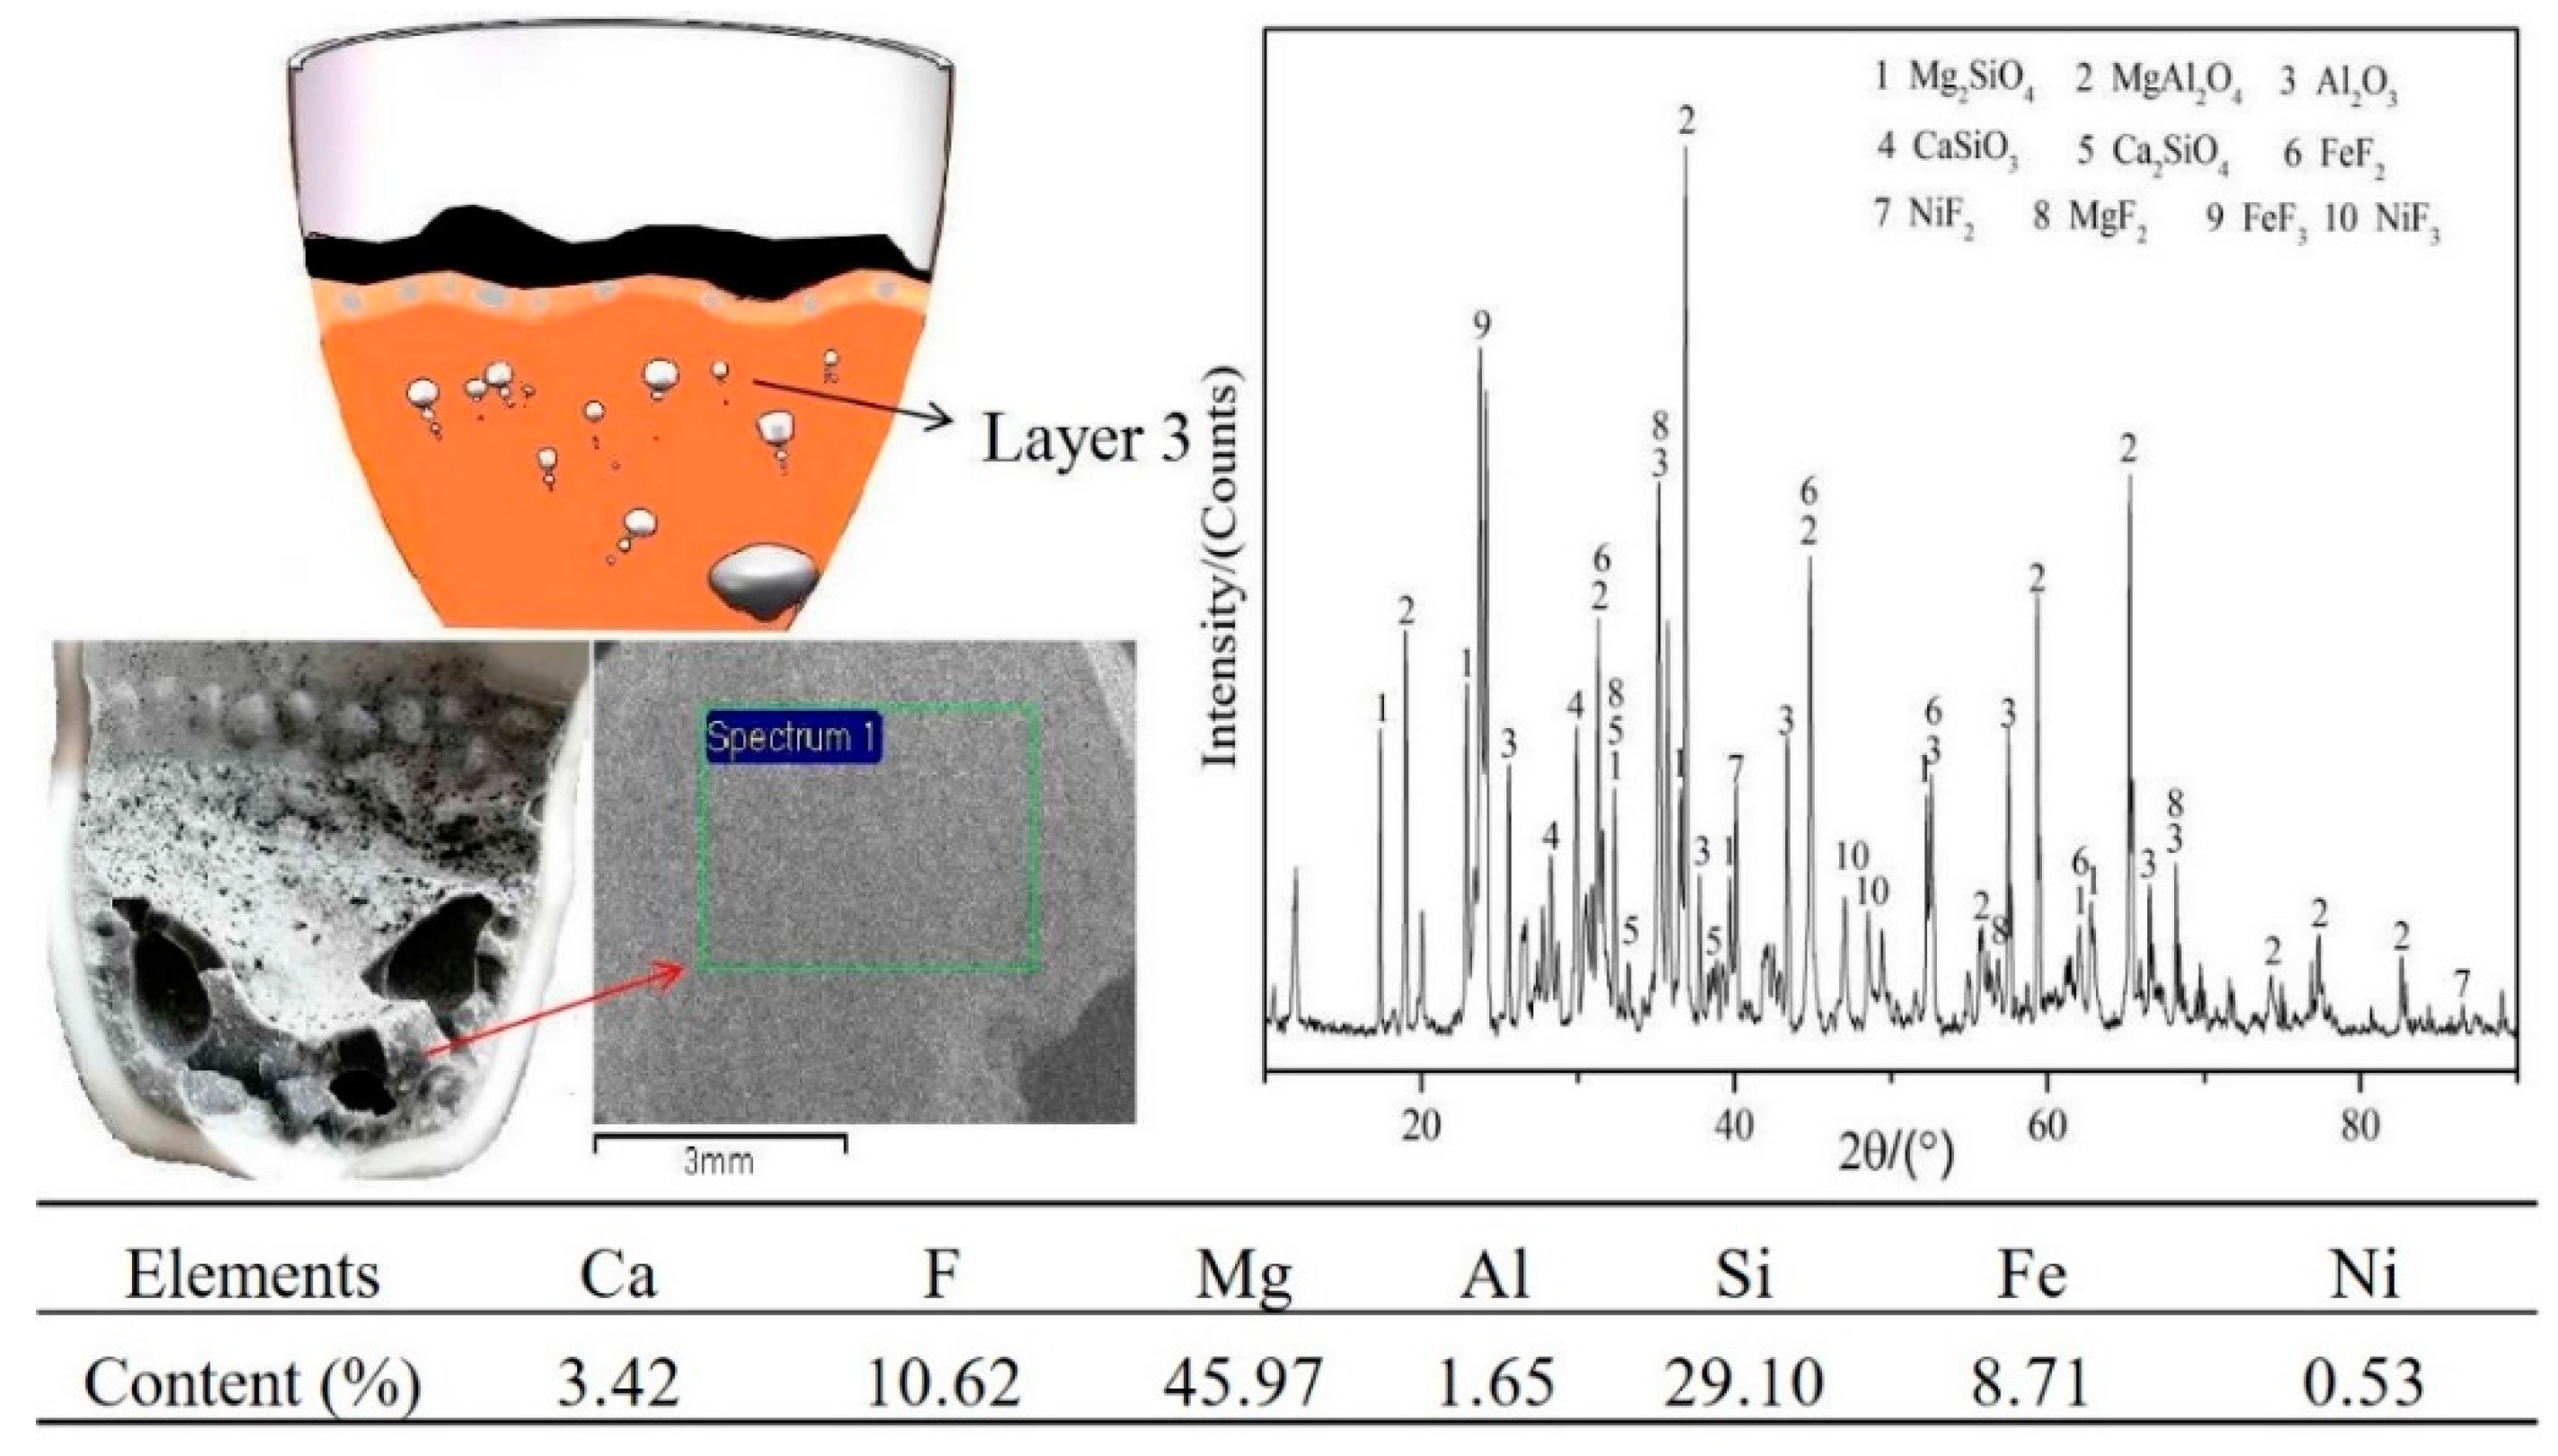
XRD and SEM/EDS analysis were performed to determine the phase and composition of the material in the third layer as well, as shown in Figure 8. XRD analysis revealed that the main phases in the third layer were Mg2SiO4 and MgAl2O4; SEM/EDS analysis showed that the main elements of this layer were Mg and Si, with contents of 45.97% and 29.10%, respectively, mixed with a small amount of F, Fe, Ca, and Al. According to the thermodynamic calculation in Equation (7), the reaction initial temperature of Mg2SiO4 under the pressure of 50 Pa was 1472 K, which is higher than the melt initial temperature. According to the analysis of the first and second layers, we found that after the melting, the carbon and the materials stratified, so most of the magnesium was not reduced. The equation can be expressed as:
3Mg2SiO4(s) + 6C(s) + 2CaF2(s) = 6Mg (g) + 6CO (g) + 2CaSiO3(s) + SiF4 (g)
ΔGT = 4297.884 − 2.920T kJ/mol.
According to the experimental findings, due to the block created by second layer, many bubbles were trapped underneath, so the Mg vapor could not overflow. This further hindered the reduction, so a large amount of Mg2SiO4 remained in the materials, and a large amount of Mg2SiO4 formed after the end of the experiment. The density of Mg2SiO4 is greater than that of MgAl2O4, resulting in MgAl2O4 floating above the Mg2SiO4.
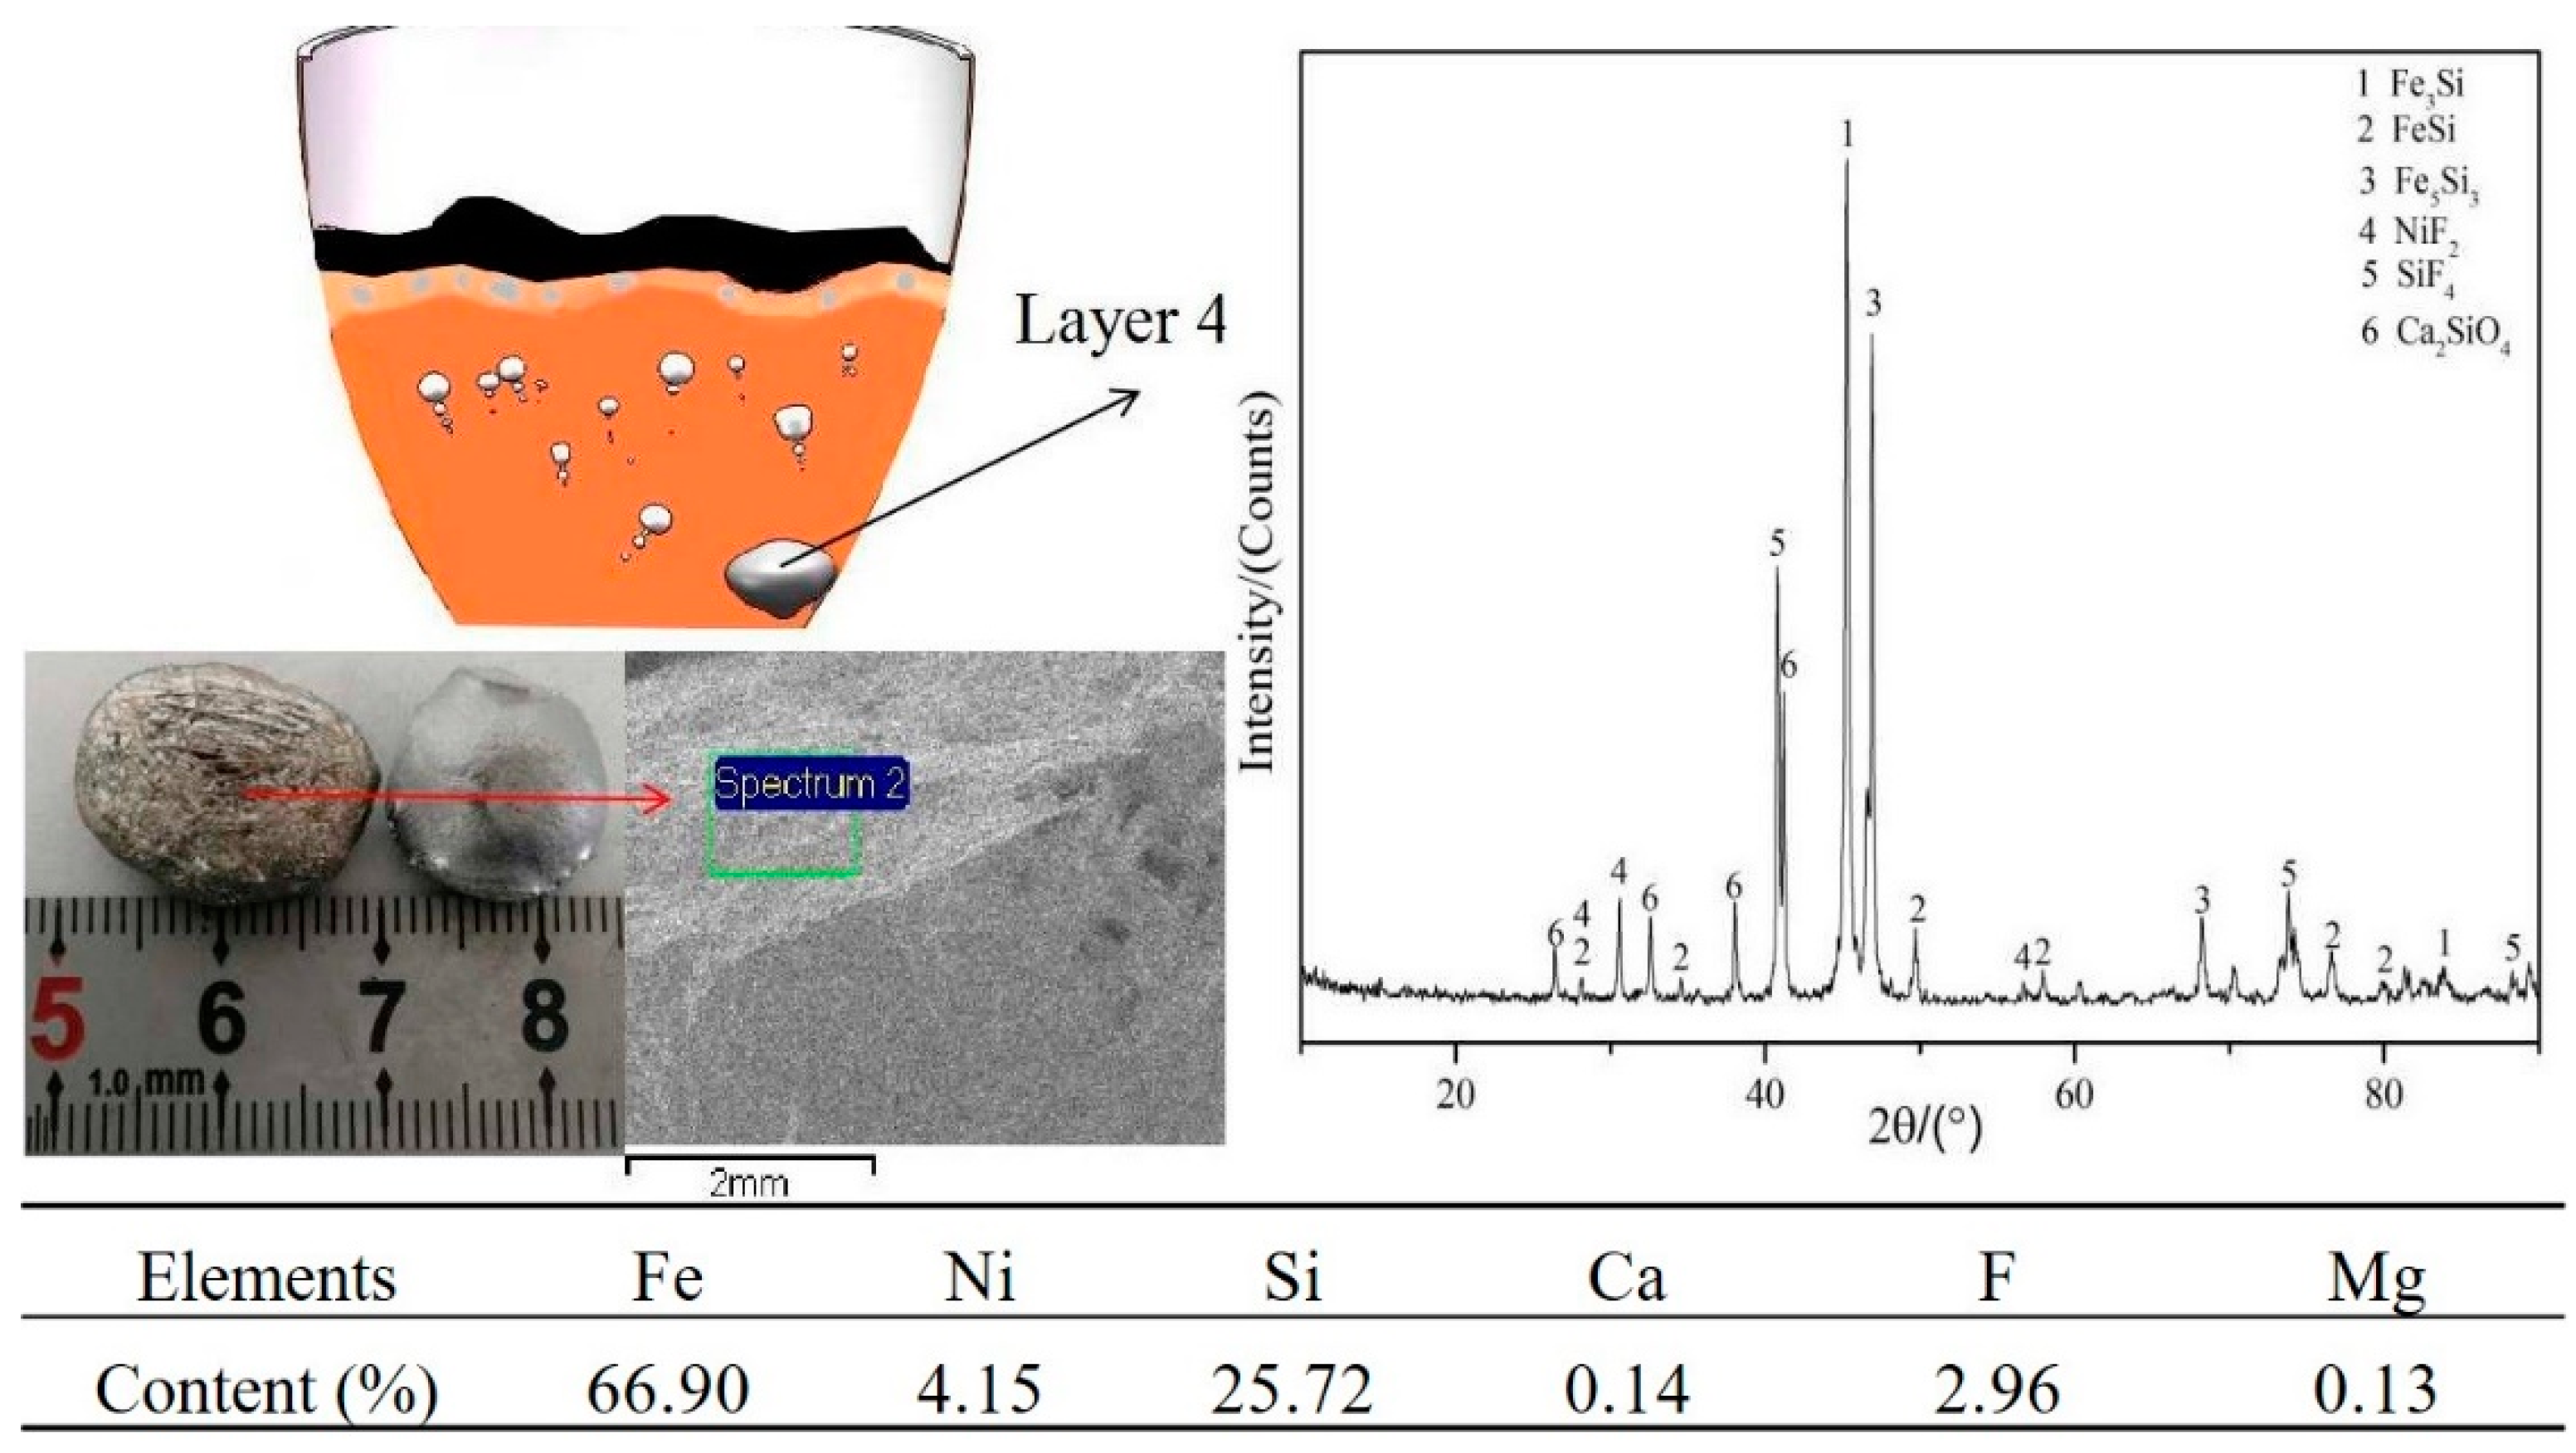
XRD and SEM/EDS analysis were performed to determine the phase and composition of the fourth layer, as shown in Figure 9. XRD analysis revealed that the fourth layer was mainly FeXSiY in various compositions. SEM/EDS analysis revealed that the layer mainly elements were Fe, Ni, and Si, with contents of 66.90%, 4.15%, and 25.72%, respectively.
From the thermodynamic calculations of Equations (4) and (8)–(10), we found that the formation of Fe, FeXSiY, Ni, and FeNi formed before the materials melted. Under the pressure of 50 Pa, the initial temperature of reactions were 1344, 808, 618, and 1389 K, respectively. After the materials melted, the mass transfer and heat transfer of Ni and Fe accelerated, forming a large particle of Fe–Ni–Si ternary alloy. Due to being denser than Mg2SiO4, it sunk into the bottom of the crucible to form the fourth layer. The equations can be expressed as:
3Fe2SiO4(s) + 6C(s) + 2CaF2(s) = 6Fe(s) + 6CO (g) + 2CaSiO3(s) + SiF4 (g)
ΔGT = 1336.421 − 1.653T kJ/mol,
3Ni2SiO4(s) + 6C(s) + 2CaF2(s) = 6Ni(s) + 6CO (g) + 2CaSiO3(s) + SiF4 (g)
ΔGT = 1110.829 − 1.797T kJ/mol,
Ni2SiO4(s) + 6C(s) + CaF2(s) = NiSi(s) + CaC2(s) + NiF2(s) + 4CO(g)
ΔGT = 1384.267 − 1.055T kJ/mol.
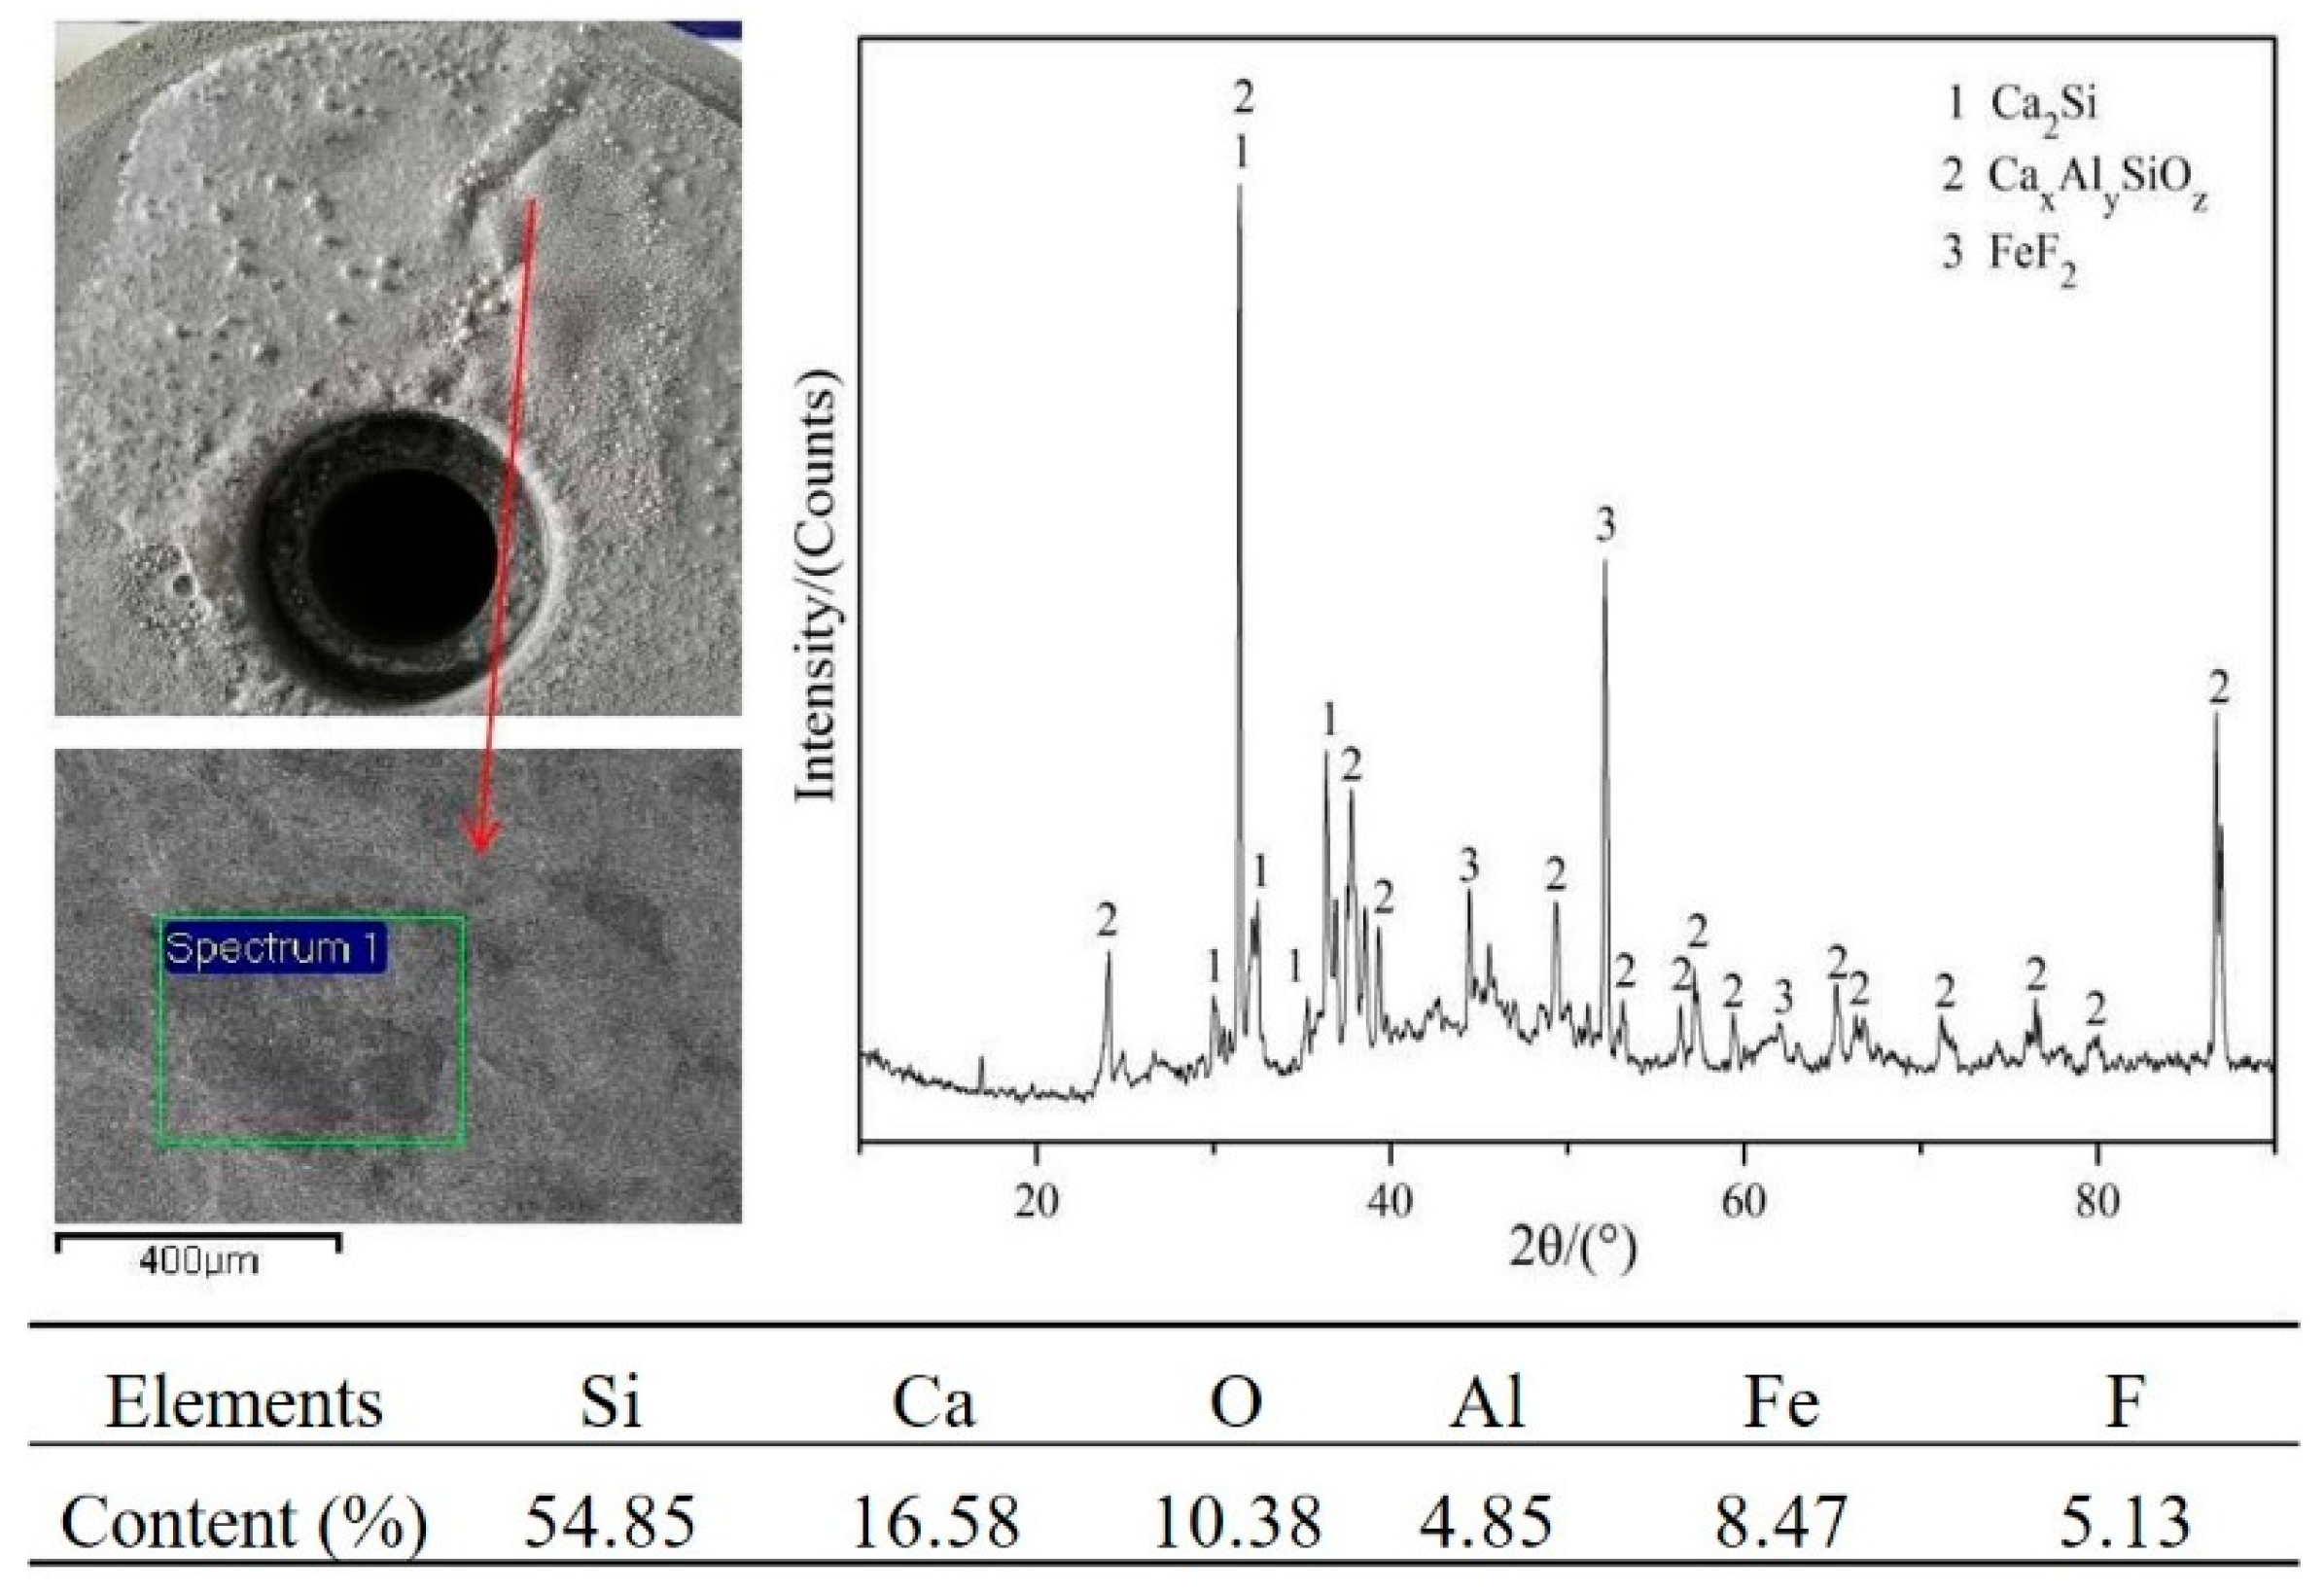
At the end of the experiment, a dense condensate with a silvery white metallic luster was found on the lid, as shown in Figure 10. XRD and SEM/EDS analysis were performed to determine the phase and composition of the condensate. XRD analysis revealed that condensate was mainly calcium–silicon compounds. SEM/EDS analysis showed that the elemental contents of Si, Ca, and Fe were 54.85%, 16.58%, and 8.47%, respectively. From the thermodynamic calculations of Equations (7)–(9) and (11)–(13), we found that the initial temperatures of the formation of SiF4 and SiO were 1472, 808, 618, 1085, 961, and 1431 K under the pressure of 50 Pa, respectively. Therefore, the Si in the condensate was mainly produced from the condensation of SiF4 and SiO, the Fe from the sublimation of FeF2, and Ca from the condensation of calcium compounds. The equations can be expressed as:
Fe2SiO4(s) + 3C(s) = SiO(g) + 2Fe(s) + 3CO(g)
ΔGT = 1044.890 − 0.962T kJ/mol,
Ni2SiO4(s) + 3C(s) = SiO(g) + 2Ni(s) + 3CO(g)
ΔGT = 968.751 − 1.008T kJ/mol,
SiO2(s) + C(s) = SiO(g) + CO(g)
ΔGT = 697.671 − 0.487T kJ/mol.
According to the above analysis of the phase and composition of each layer of materials, we found that the first layer was mainly coking coal, the small silver-white metal particles were Fe–Ni–Si, and the main component of the second transition layer was MgAl2O4. The third layer was mainly Mg2SiO4 with a small amount of MgAl2O4 and calcium–silicon compounds, and the large metal particles in the fourth layer were Fe–Ni–Si ternary alloy. The condensate on the lid was mainly Si.

3.2. Behavior of CaF2

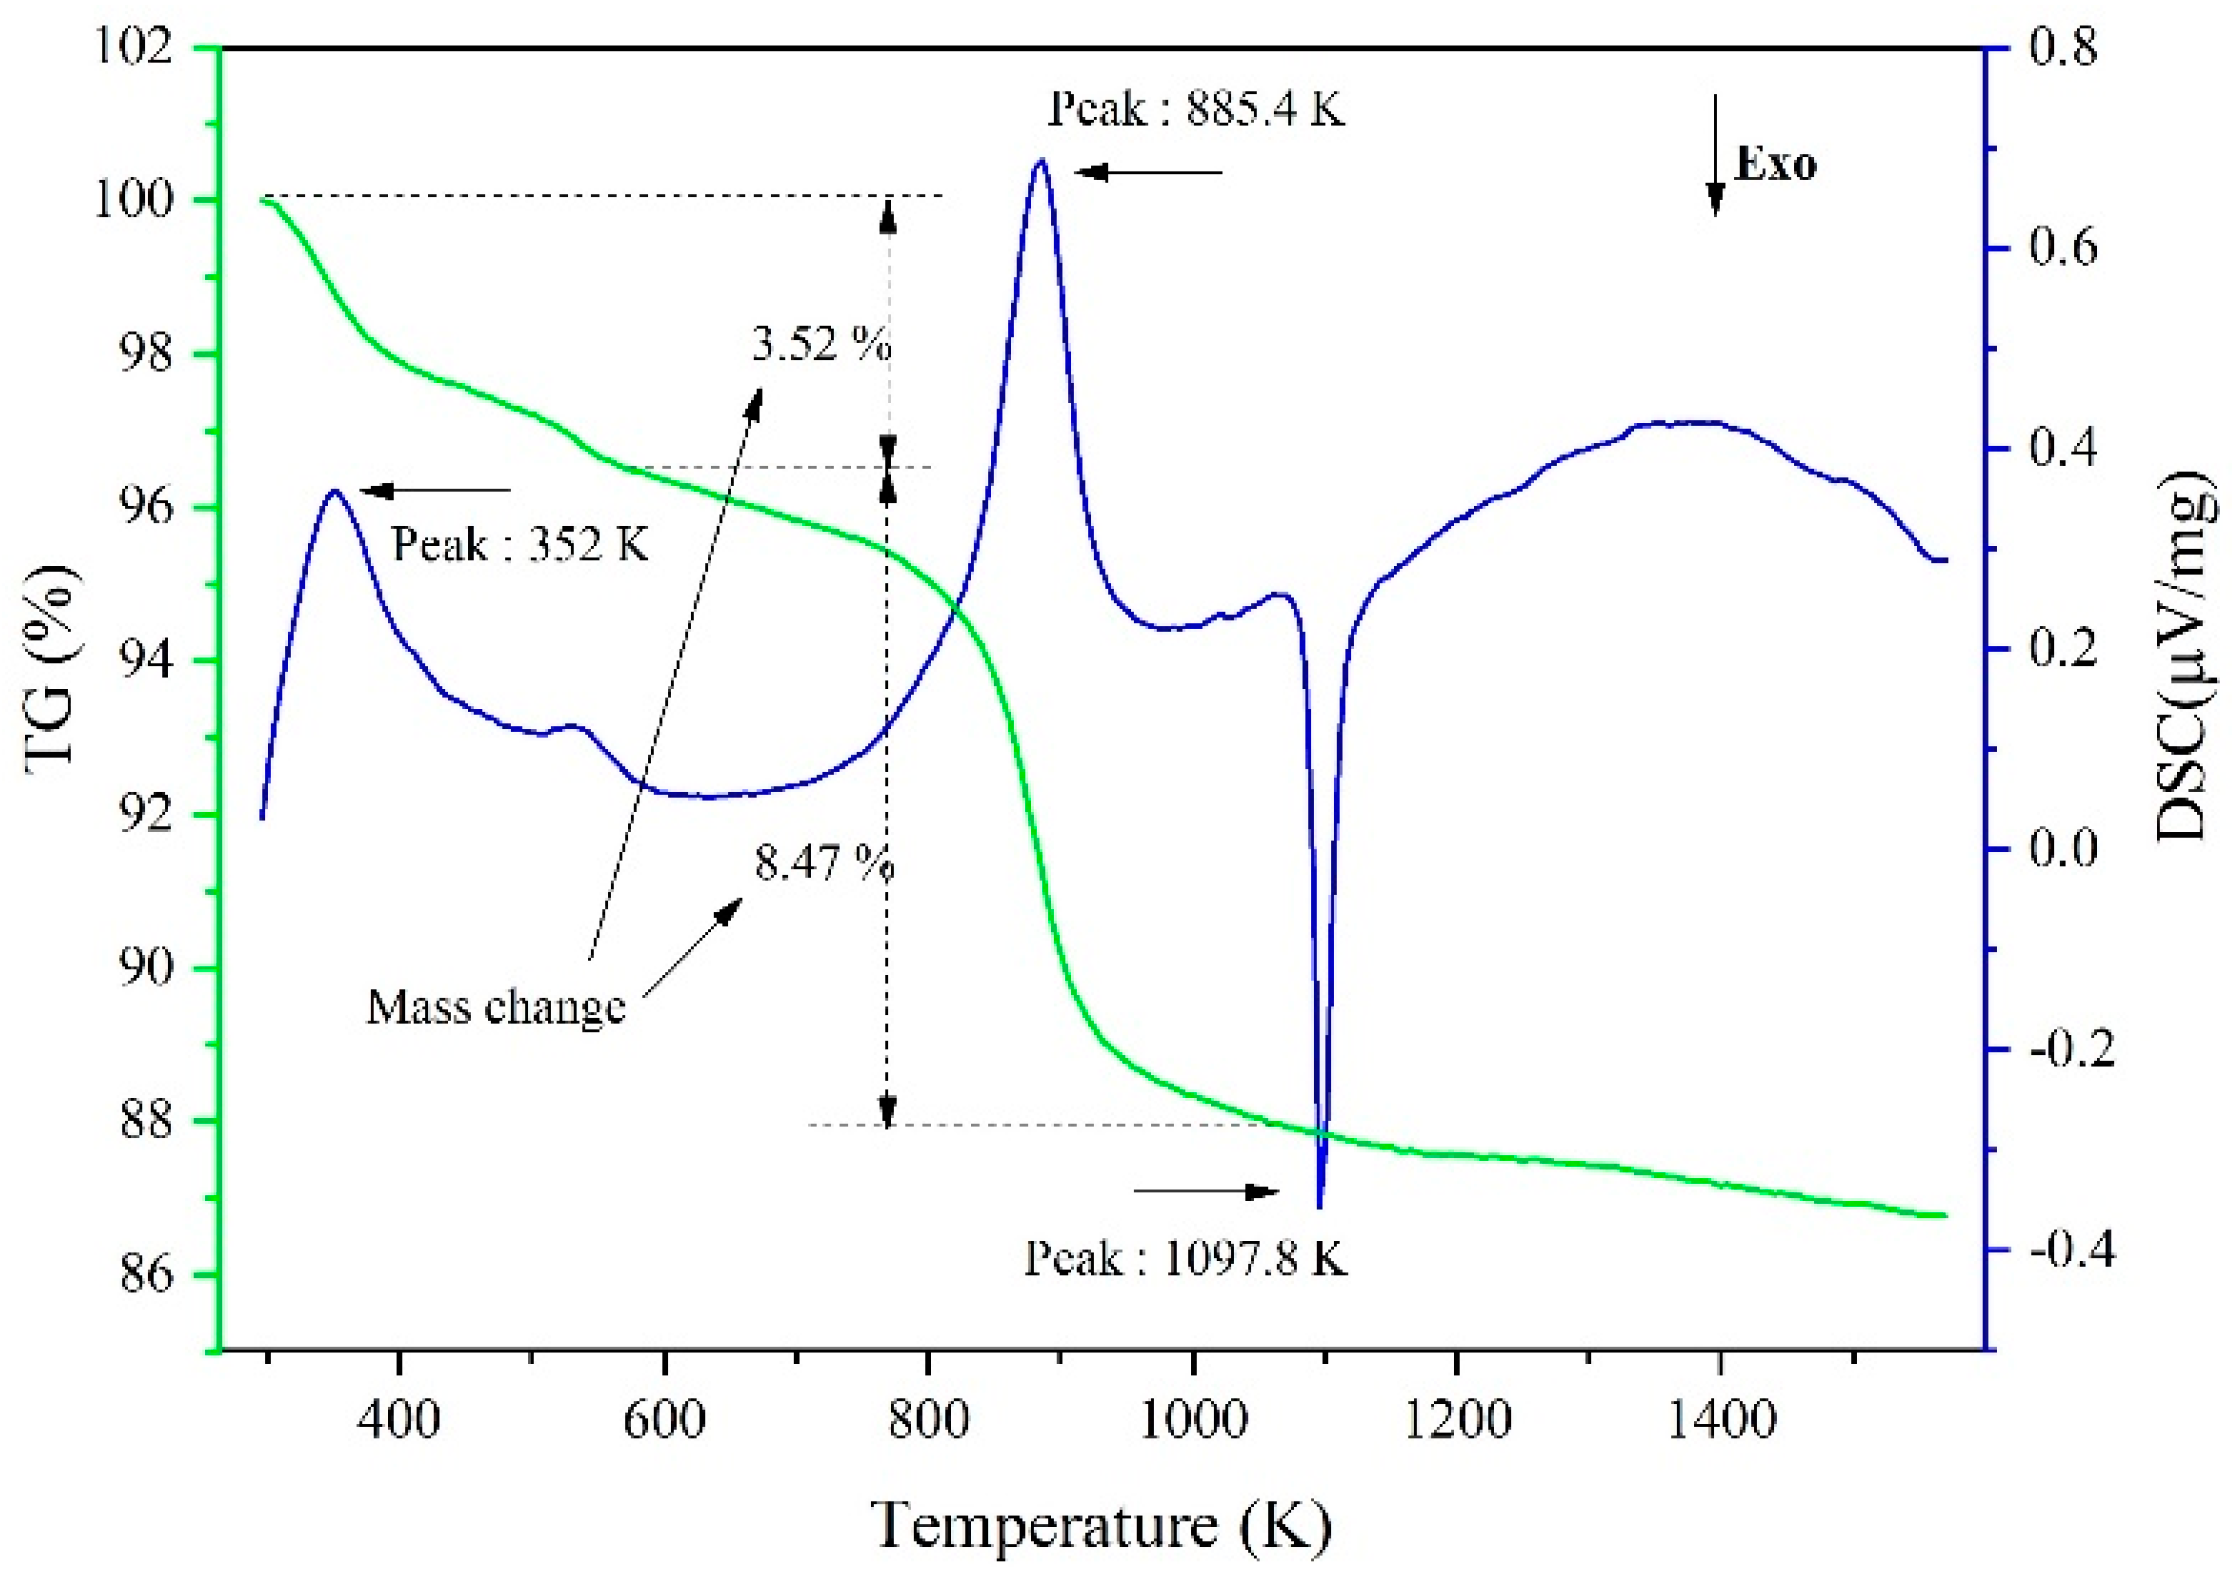
The thermogravimetry-differential scanning calorimetry (TG and DSC) curves of the garnierite are shown in Figure 11. We observed three peaks at different temperatures. According to a previous report [28], the first endothermic peak at 352 K represents the loss of the adsorption water, the second endothermic peak at 885.4 K represents the dehydroxylation of the lizardite, and the third strong exothermic peak at 1097.8 K represents the decomposition of Mg3Si2O7. The process is expressed in Equations (14) and (15).
Mg3Si2O5(OH)4(s) = Mg3Si2O7(s) + 2H2O(g)
Mg3Si2O7(s) = Mg2SiO4(s) + MgSiO3(s)
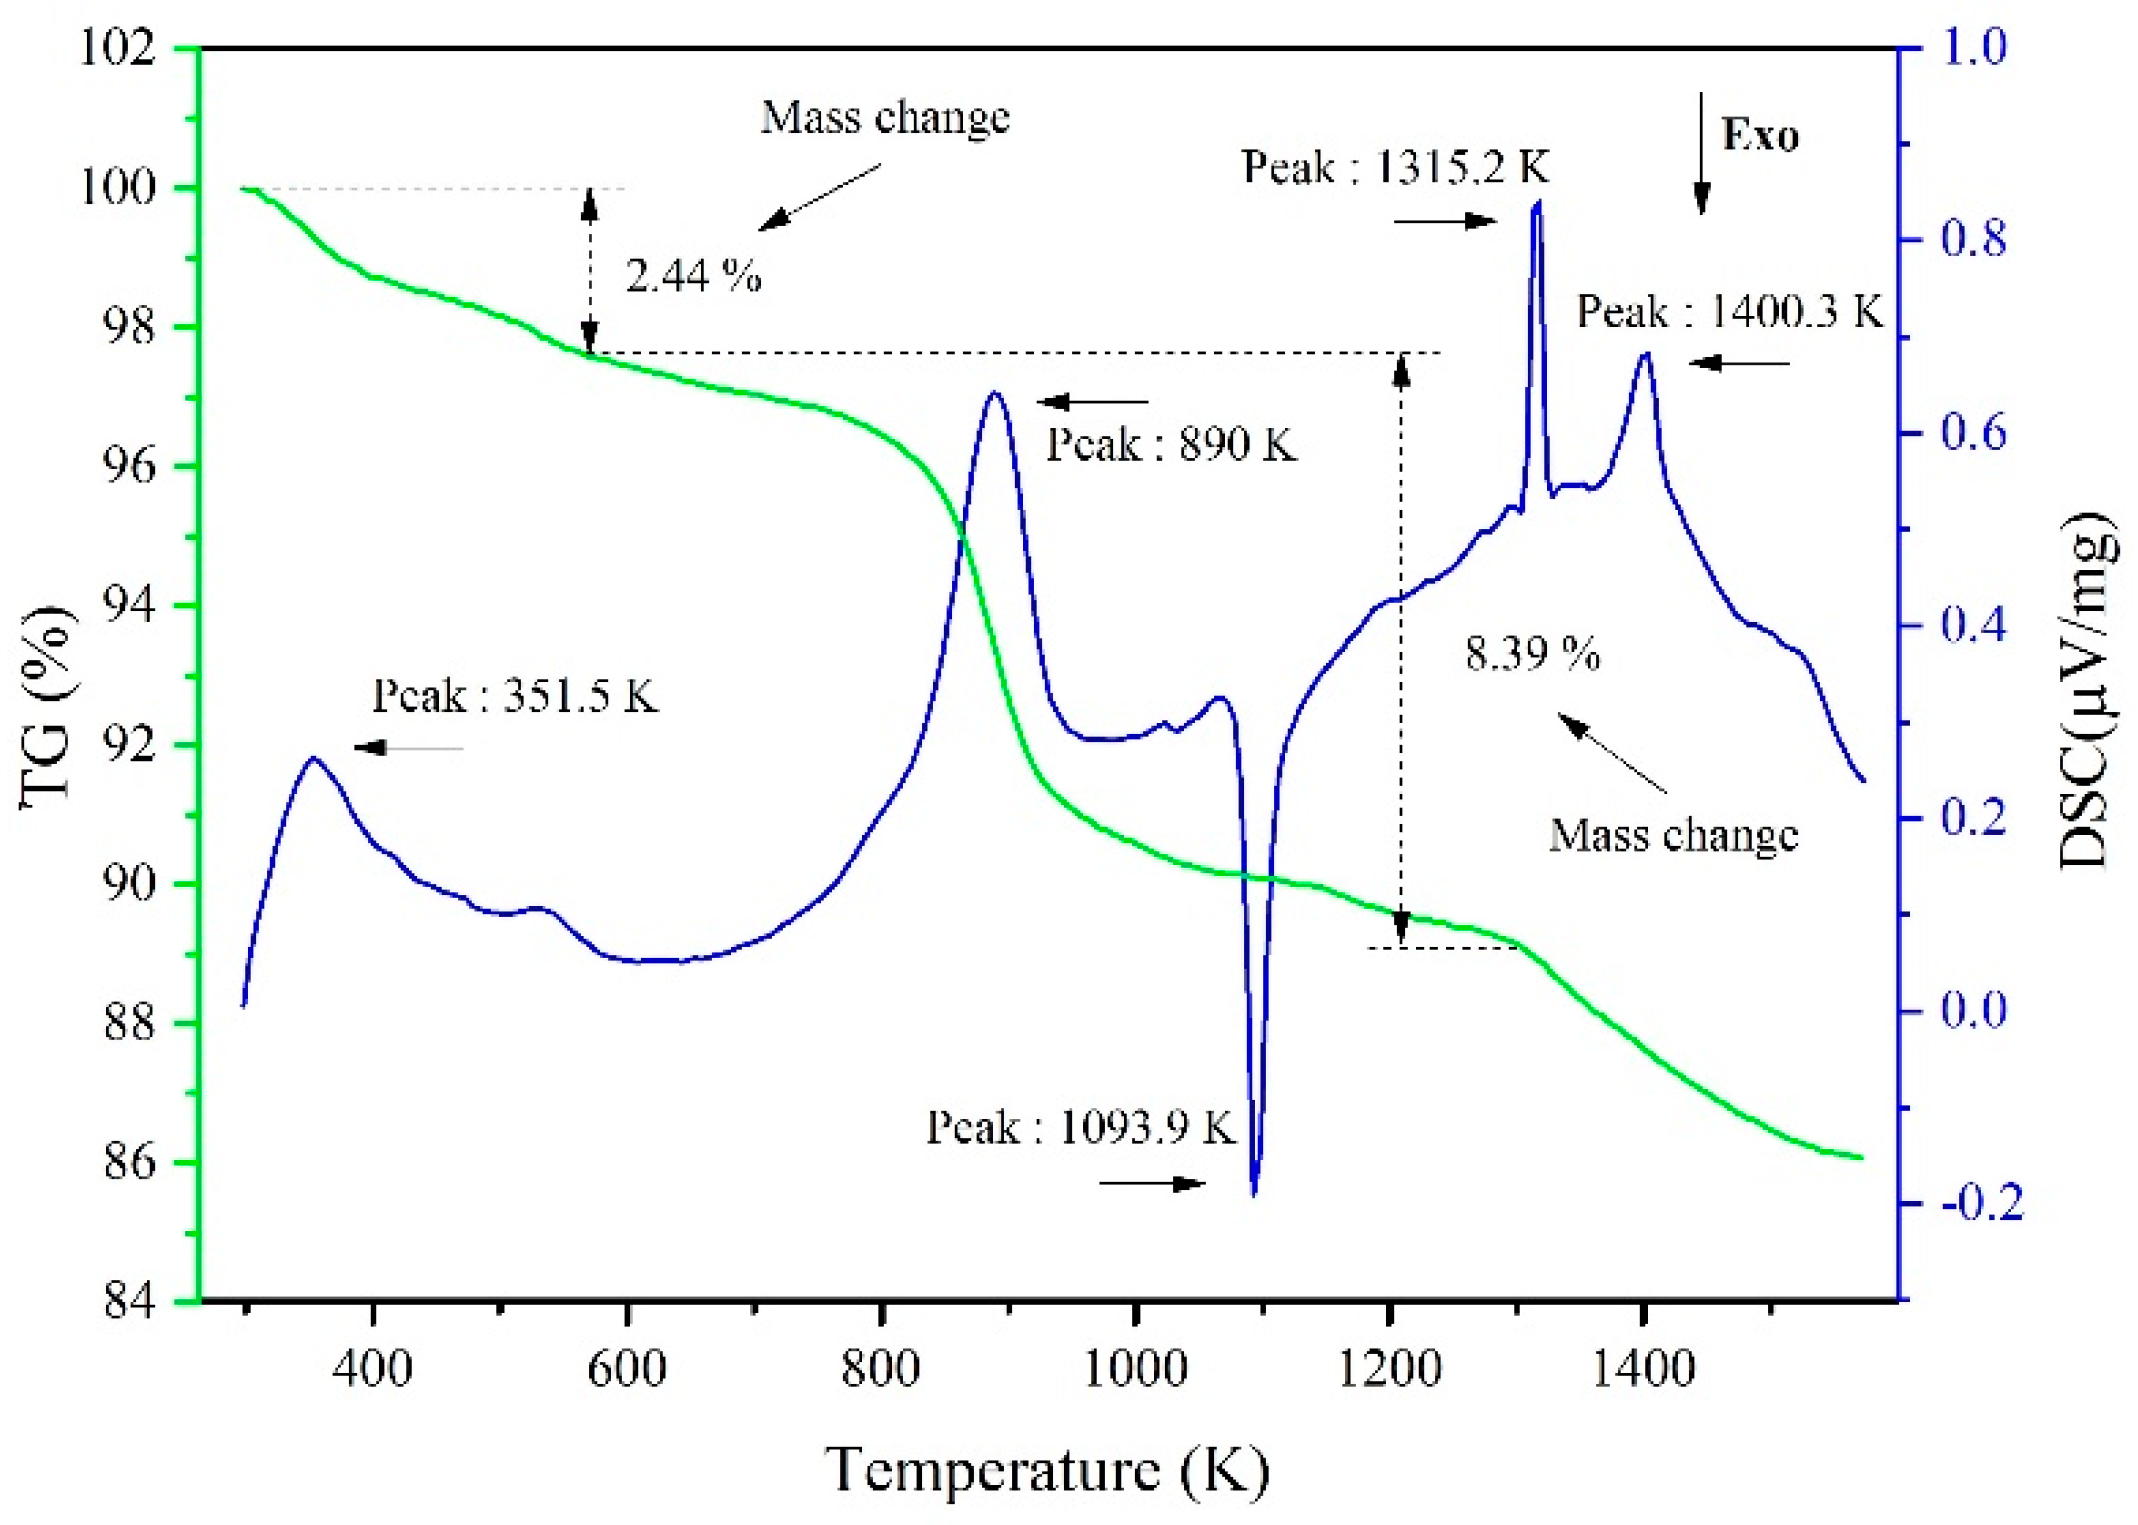
The TG and DSC curves of the garnierite with CaF2 are shown in Figure 12. By comparing Figure 11 and Figure 12, we found two more endothermic peaks at 1315 and 1400 K. The two endothermic peaks represented the conversion of the raw materials from solid to liquid, which produced low-melting-point compounds such as FeF2, NiF2, and MgF2. The thermodynamic calculations in Equations (4), (10) and (16) were performed at 50 Pa. The equations can be expressed as:
Mg2SiO4(s) + SiF4 (g) = 2MgF2(s) + 2SiO2(s)
ΔGT = −271.244 + 0.221T kJ/mol.
Based on Equations (4) and (10), the initial temperatures of the two reactions were 1398 and 1312 K, which corresponded to the two endothermic peaks in Figure 12.

3.3. Analysis of the Reduction Process

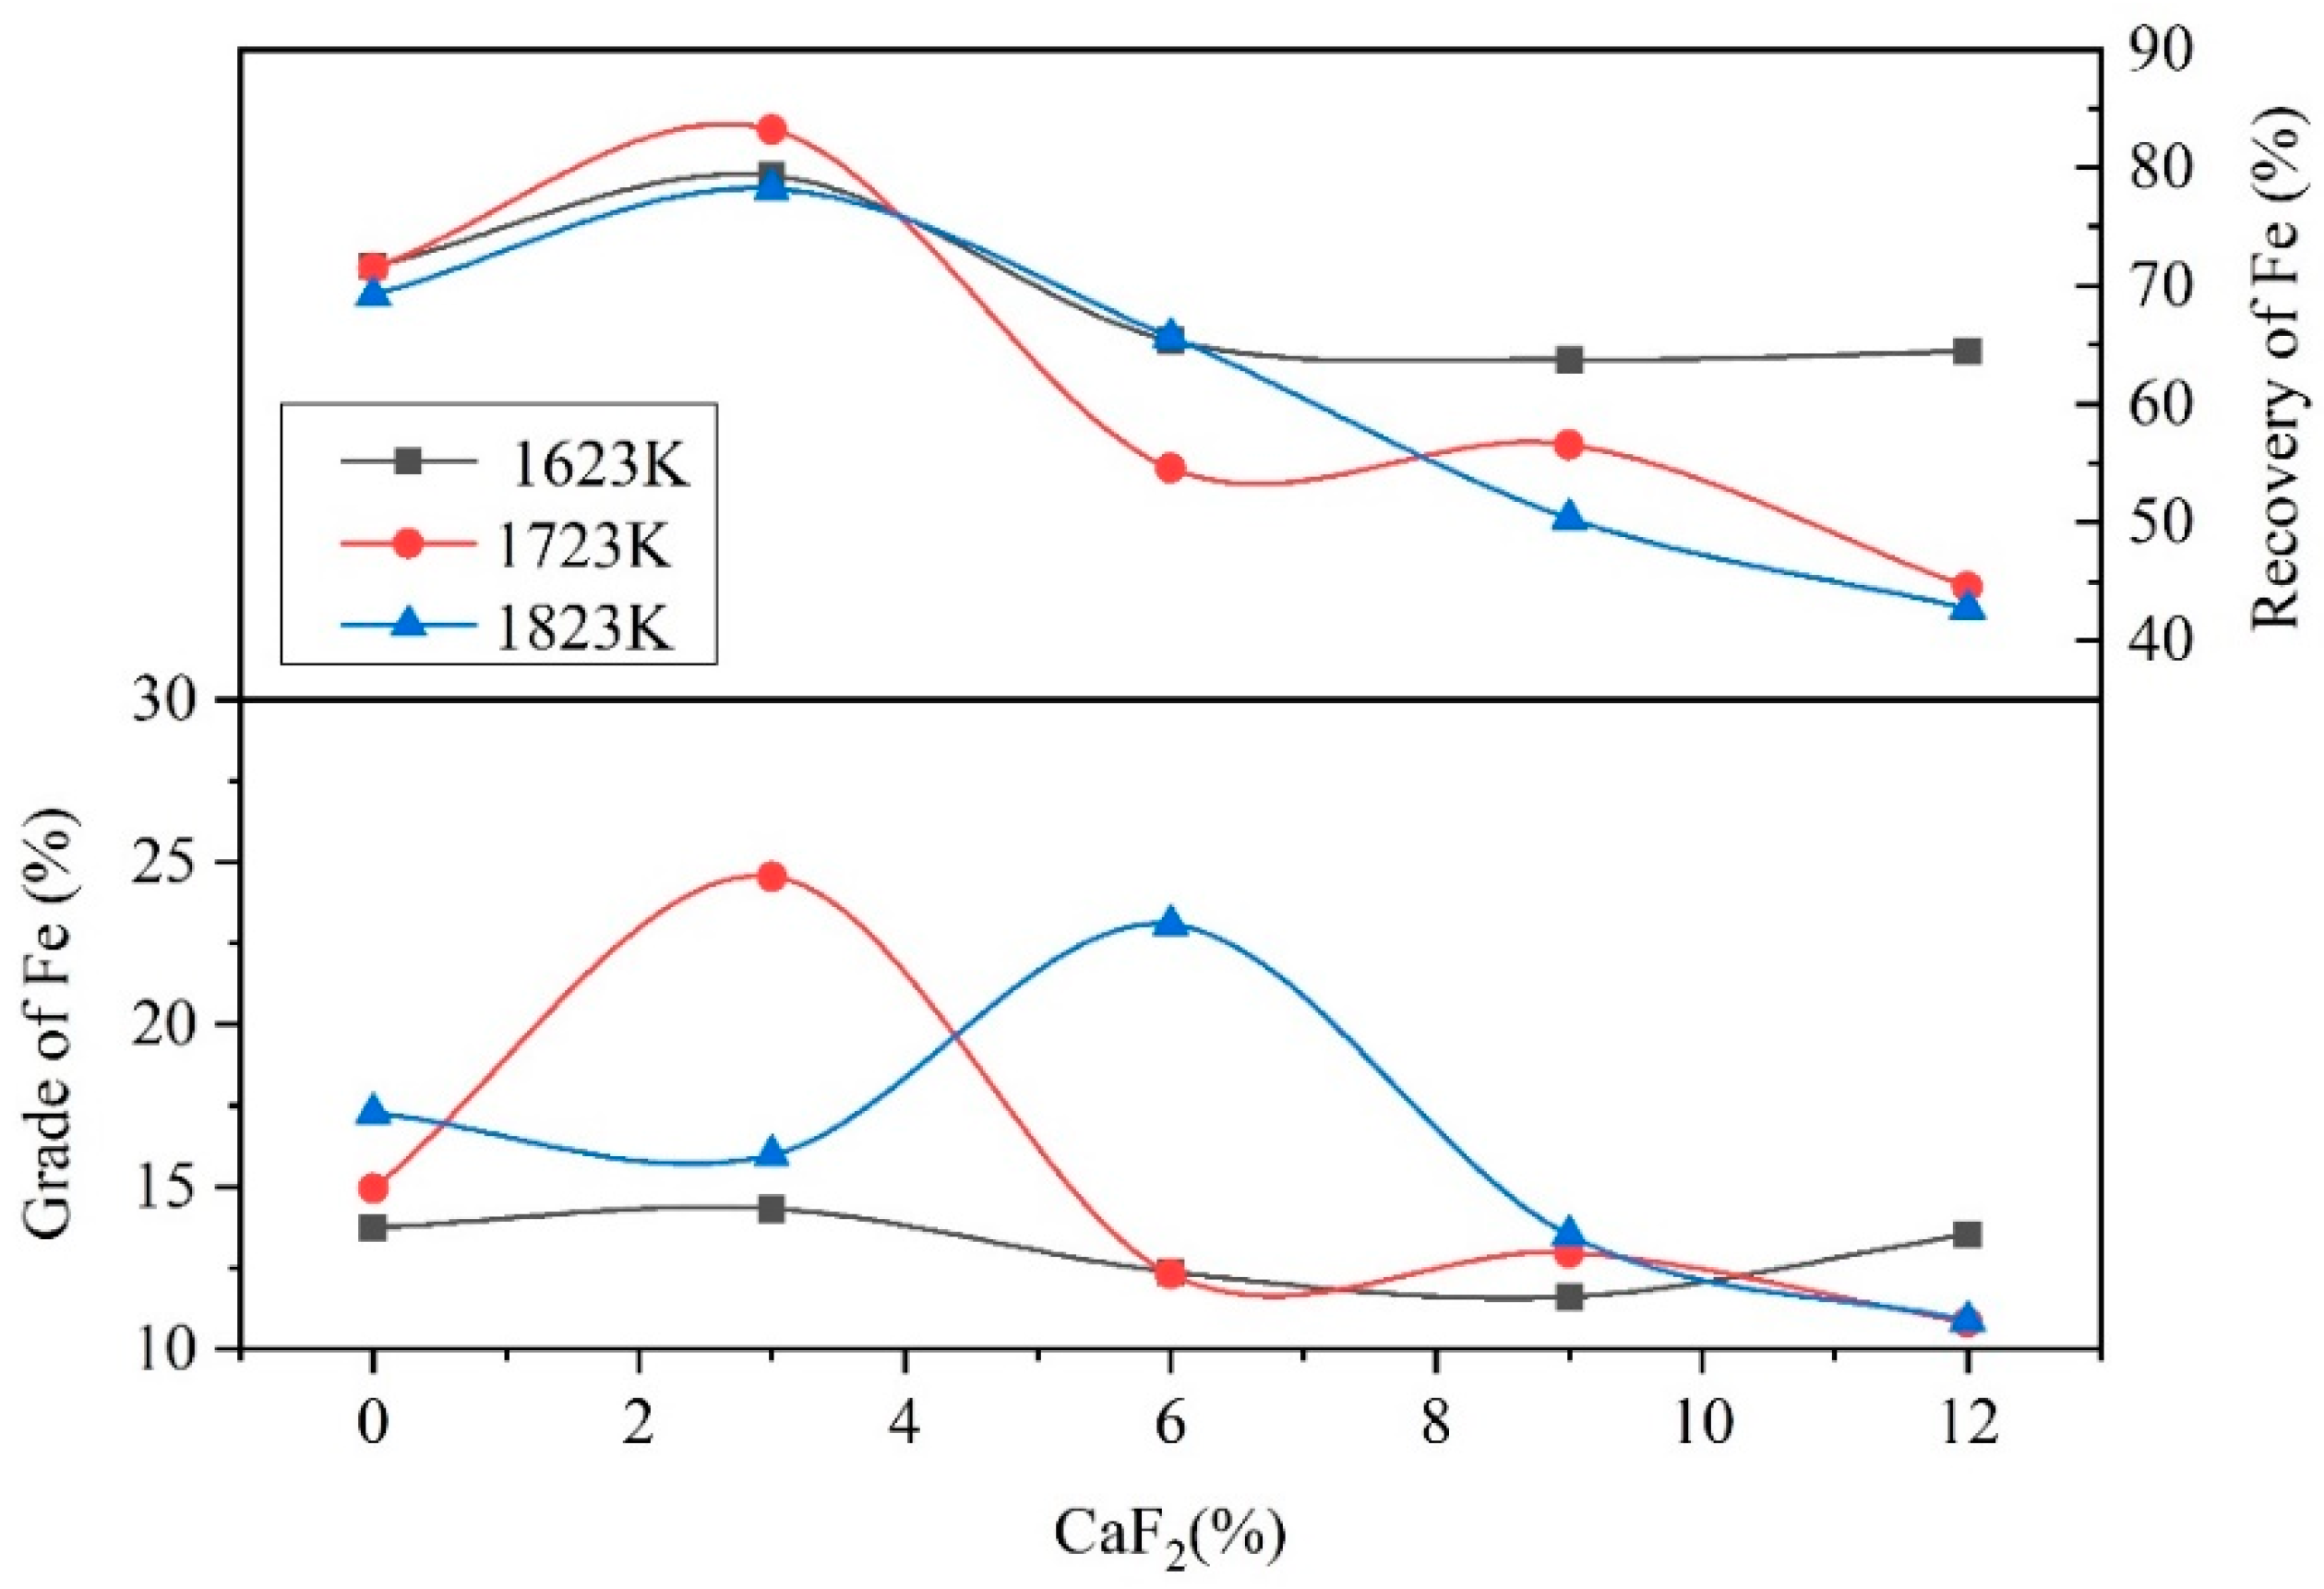
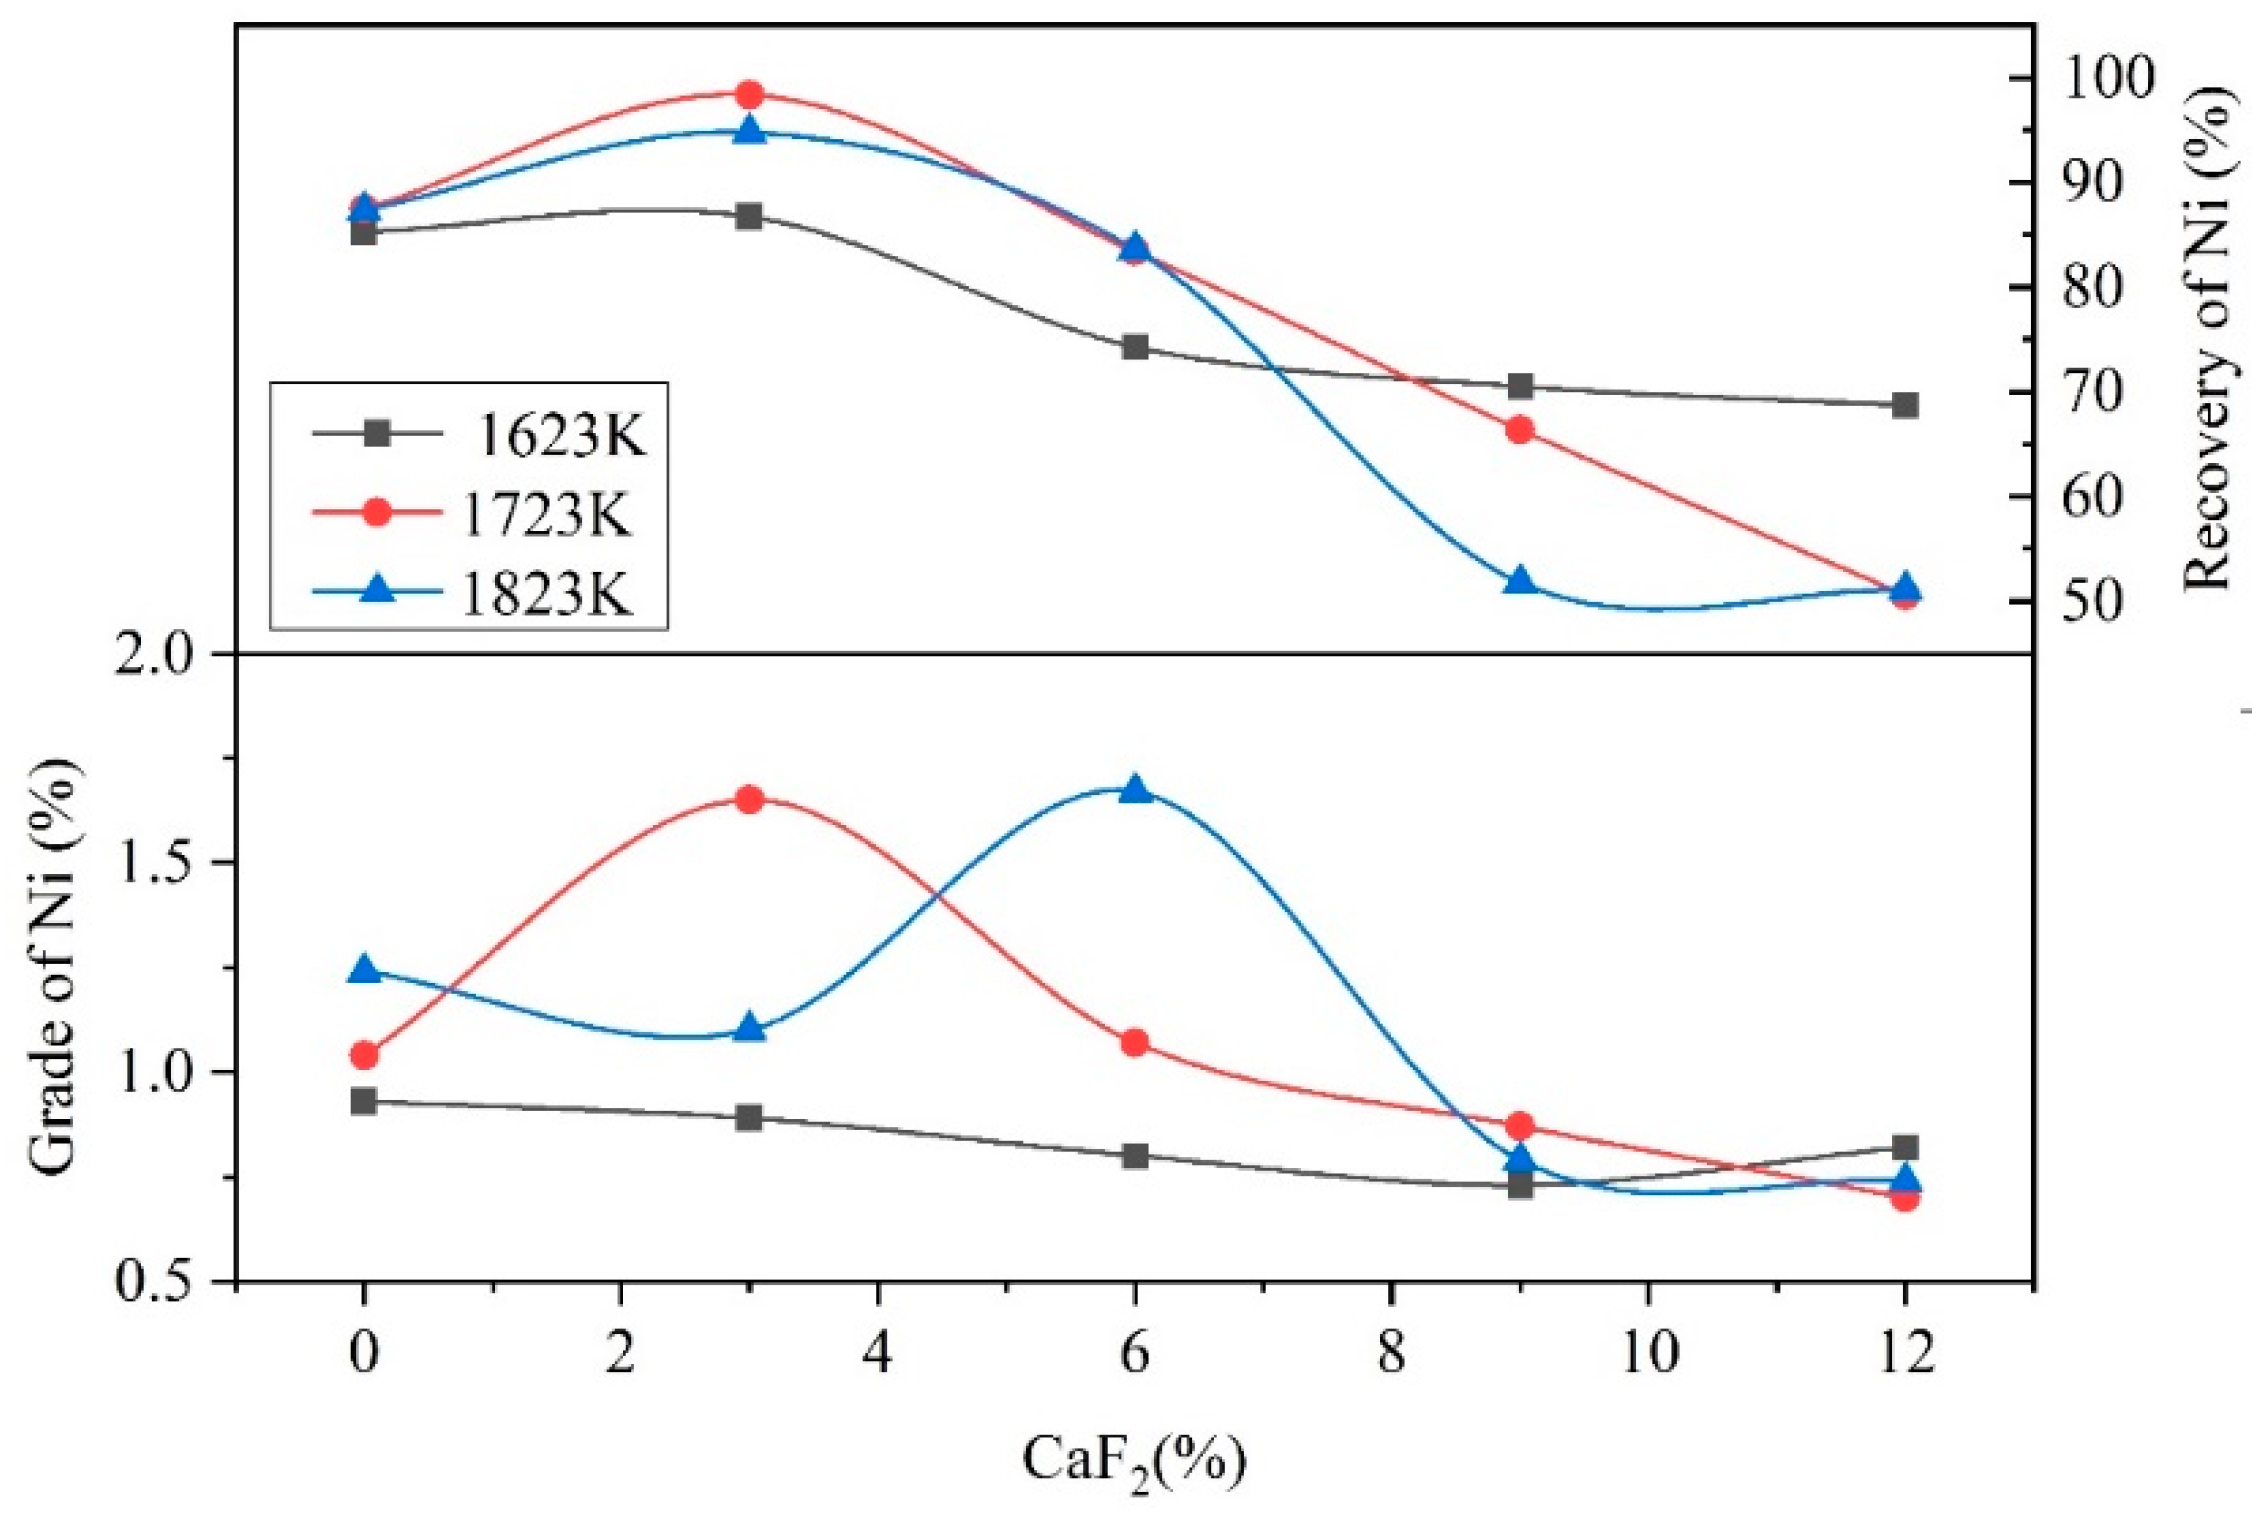
After the vacuum carbothermal reduction, chemical analysis was performed on the Fe–Ni-rich residue. According to the calculation, we obtained the direct recovery of Fe and Ni, which is plotted in Figure 13 and Figure 14, respectively. The figures indicate that with the increase in CaF2, the grades and direct recovery of Fe and Ni first rose and then fell, with maximal grades and direct recovery achieved at 3% CaF2. With increasing temperature, the curves in the figures divided into two parts. The addition of CaF2 at less than or equal to 3% was the first part, in which the grades and direct recovery of Fe and Ni first rose and then fell, with the best grades and direct recovery achieved at 1723 K. The addition of CaF2 at more than 3% was the second part, in which the grades and direct recovery of Fe and Ni showed a downward trend.
The reasons for these results are as follows:
(1)
When the addition of CaF2 was 0%, low-melting-point compounds did not form in the raw materials, and the reactions struggle to occur in the solid state in the reduction process, which caused the low grades and direct recovery of Fe and Ni.
(2)
When the addition of CaF2 was 3%, the CaF2 could react with the raw materials to form low-melting-point compounds, such as FeF2, NiF2, and MgF2. The reduction process transformed from a solid–solid reaction to a solid–liquid reaction, which accelerated the heat transfer and the mass transfer of the materials. The Fe and Ni aggregated and grew easily in the molten materials and formed small visible Fe–Ni particles on the surface of the Fe–Ni-rich residue. The raw materials were not completely melted in the reduction process due to the low addition of CaF2. Therefore, Fe and Ni were sufficiently reduced in the raw materials, which results in high grades and direct recovery of Fe and Ni.
(3)
When the addition of CaF2 was more than 3%, a large amount of the low-melting-point compounds formed in the raw materials, which caused the raw materials to change from a solid–solid reaction to a liquid–liquid reaction. This in turn caused the reduction of Fe and Ni to aggregate and grow into large metal particles with diameters of 20 mm. However, the coking coal would not melt at the experimental temperature due to its high melting point, and the density of the coking coal was low, which caused stratification of the molten materials and floating in the upper layer. This resulted in the reducing agent being unable to fully contact the raw materials, preventing the reduction process from occurring, which drastically reduced the grades and direct recovery of Fe and Ni.
(4)
Due to excessively high temperatures during the reduction process, the raw materials melted completely at temperature of 1823 K with 3% CaF2, hindering the reduction process, which reduced the grades and the direct recovery of Fe and Ni. Therefore, the grades and direct recovery of Fe and Ni were lower than 1723 K with 3% CaF2.
Our analyses demonstrate that the addition of 3% CaF2 at 1723 K is the optimal condition.
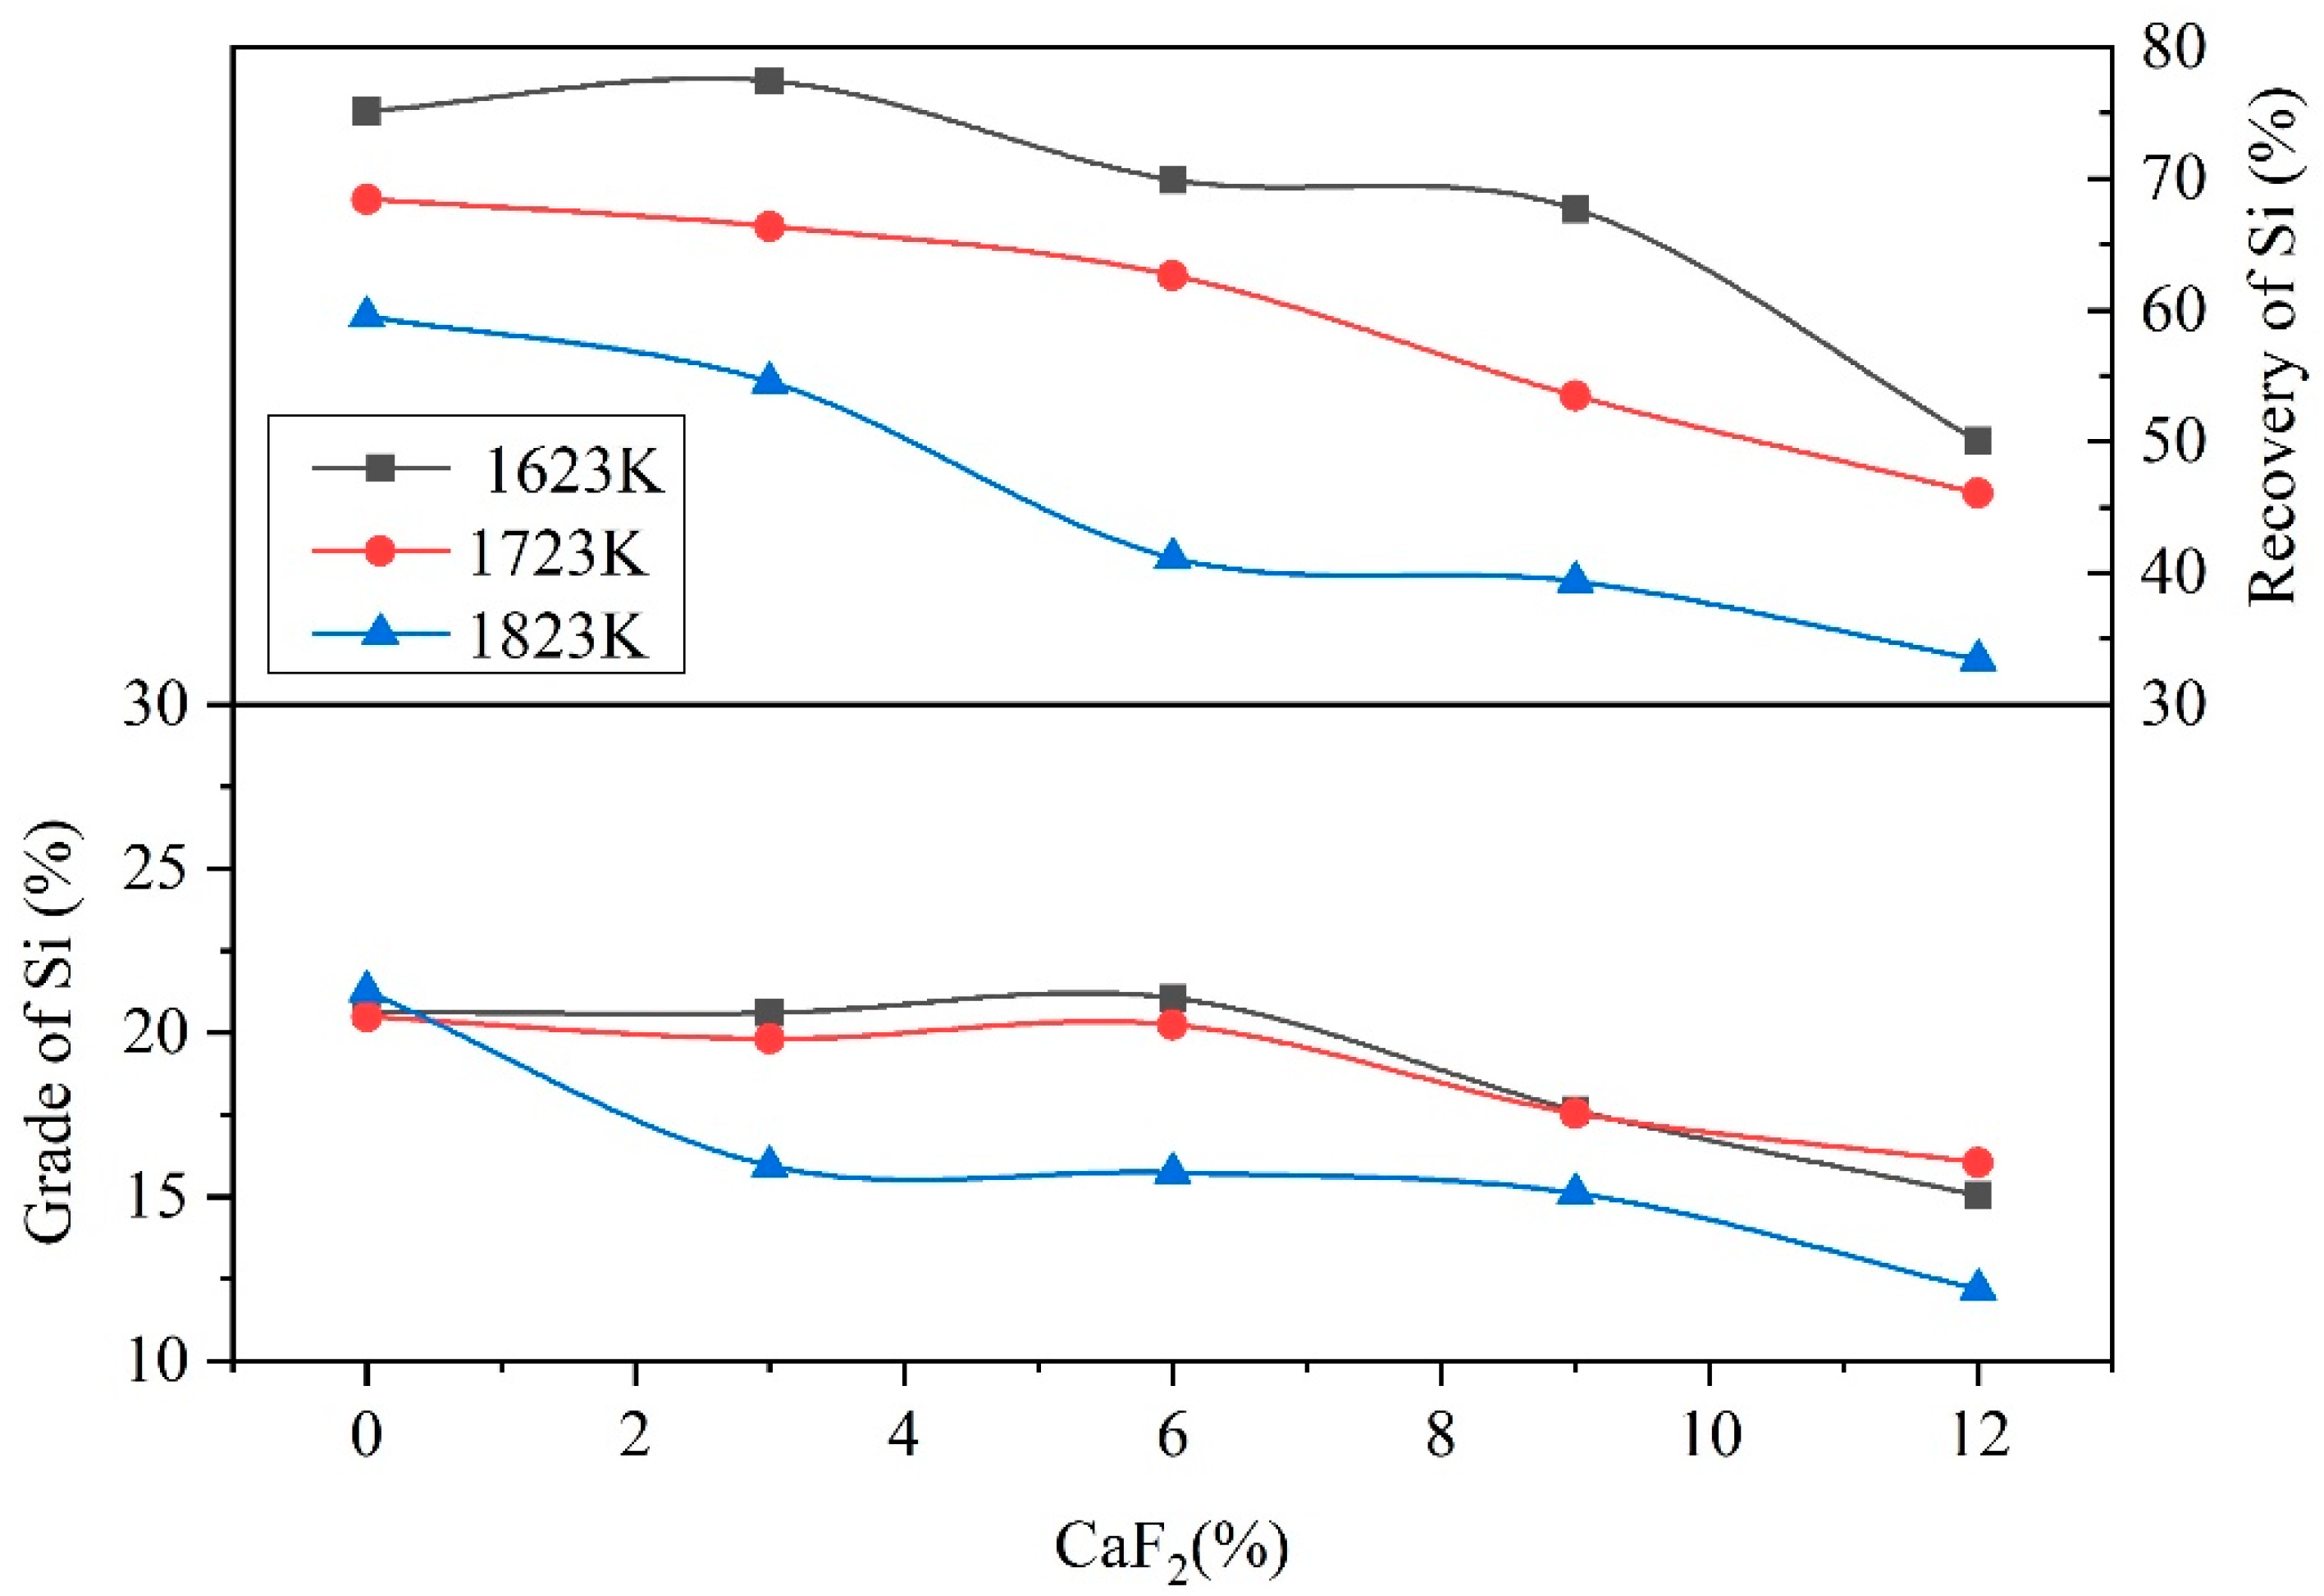
According to Figure 15, with increasing temperature and CaF2, the grades and recovery of Si showed a downward trend because Si would volatilize in the form of SiO and SiF4 at high temperature, which resulted in low grades and direct recovery of Si. The equations are expressed in Equations (7)–(9) and (11)–(13).
According to Equations (7)–(9) and (11)–(13), the initial temperatures of these reactions were 1472, 808, 618, 1086, 961, and 1432 K, respectively. All the reactions could occur under experimental conditions. These analysis results were consistent with the above four explanations.
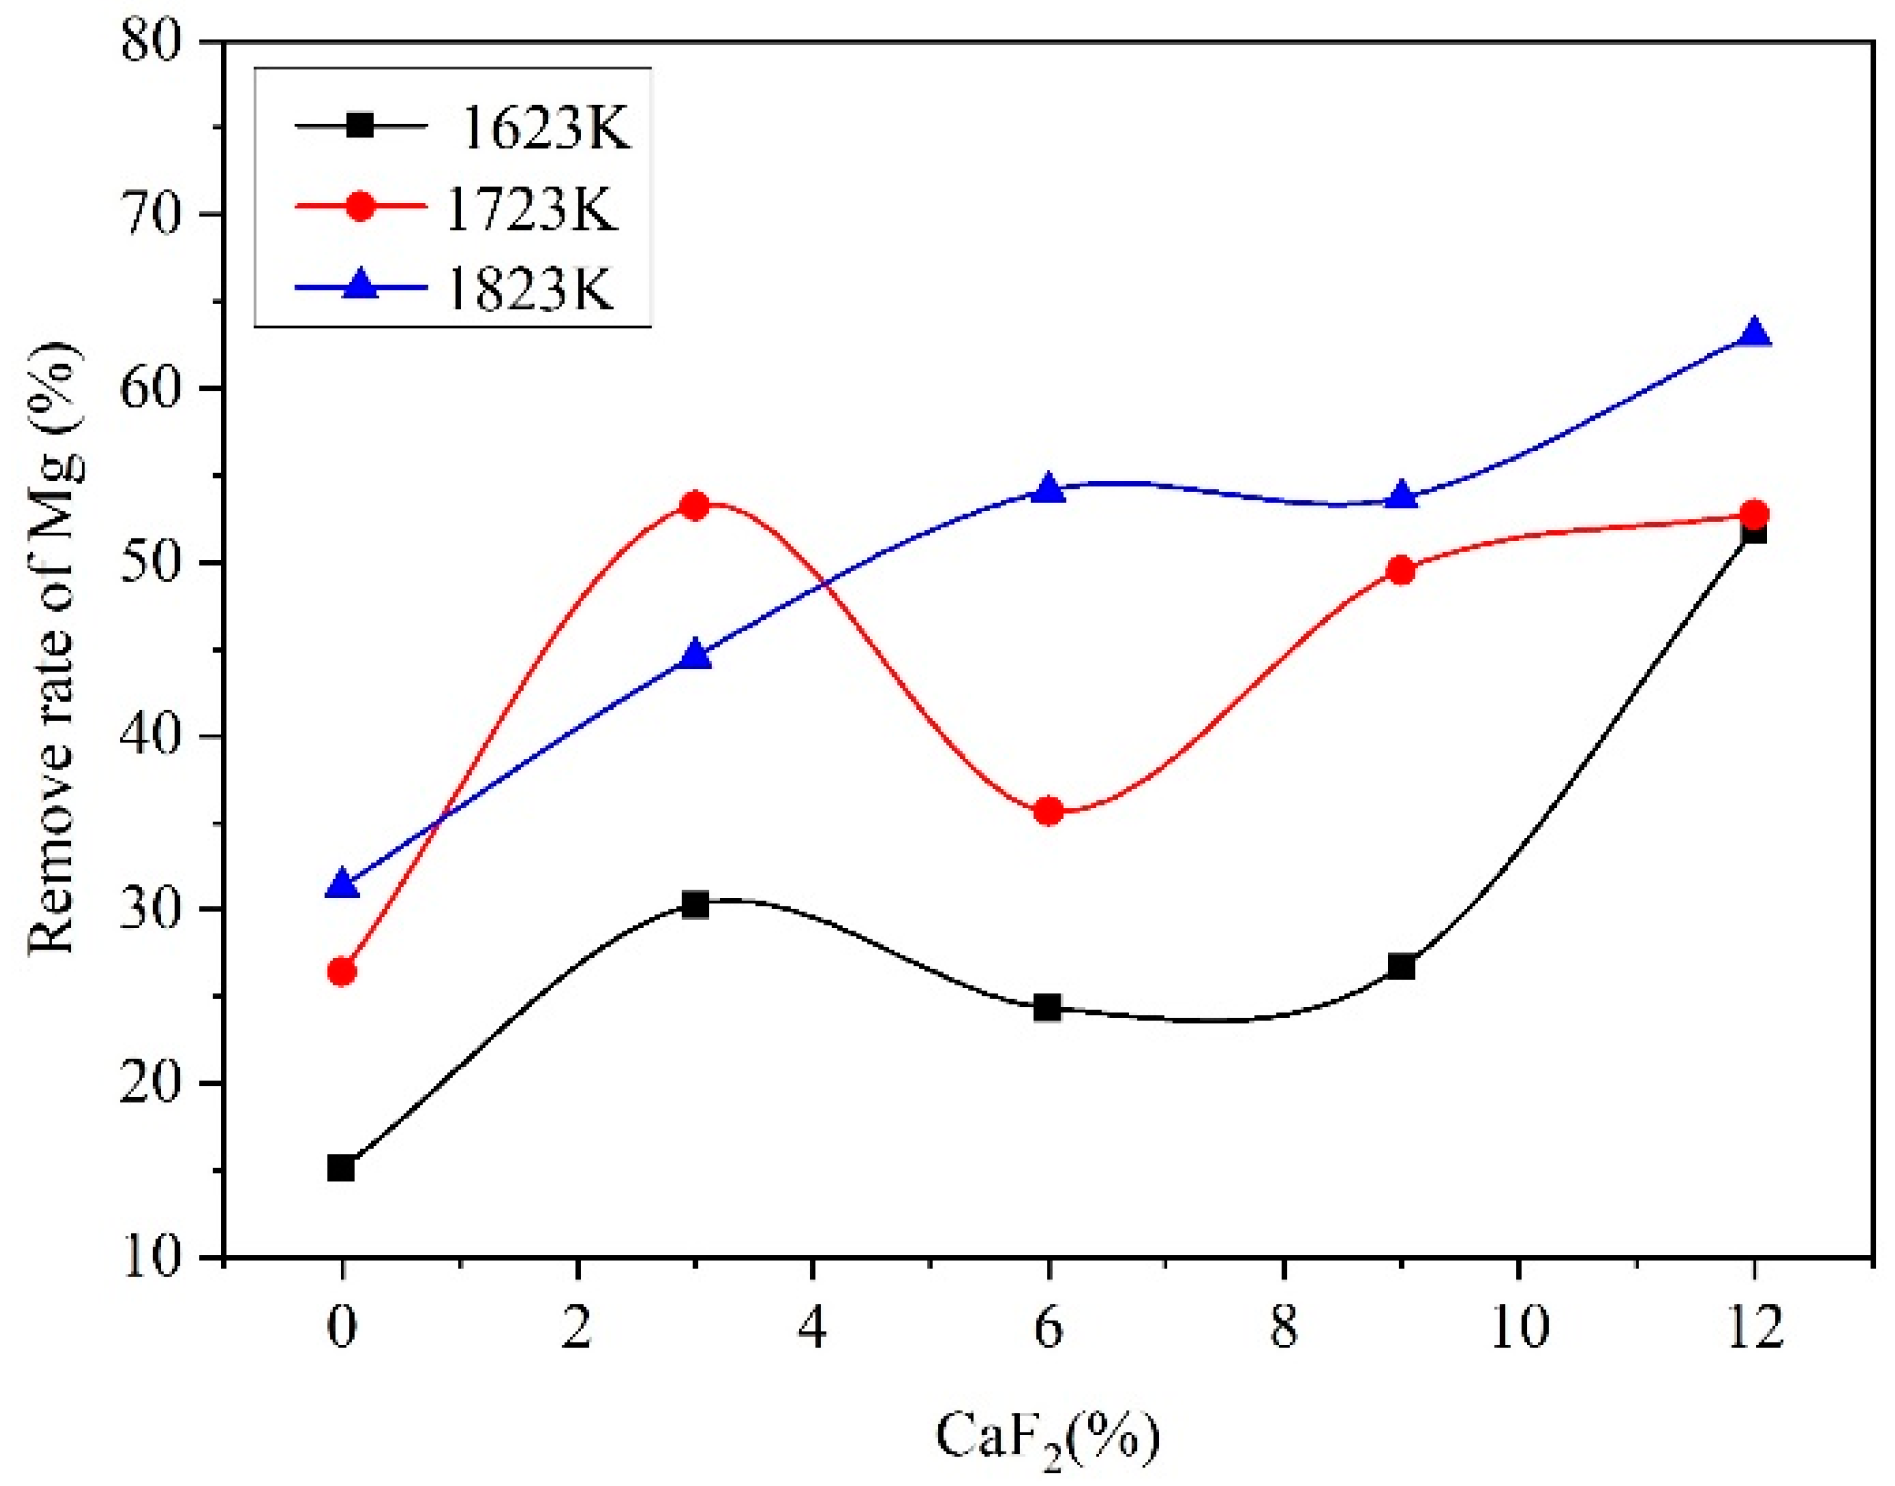
Figure 16 shows that the removal rate of Mg increased with increasing temperature and CaF2 content. However, the removal rate was low because the raw materials changed from a solid–solid reaction to a liquid–liquid reaction with increasing CaF2 content, which caused the reduction of Mg to only occur in the early period. However, after the materials melted completely, the coking coal and the raw materials were stratified, which preventing the coking coal from contacting the raw materials. The steam of the Mg could not pass through the transition layer, resulting in the removal rate of Mg increasing slowly. The best example of this was at a temperature of 1823 K with 3% CaF2, where the removal rate of Mg was significantly lower than 1723 K with 3% CaF2. These analysis results were consistent with the findings in Section 3.2.
As seen in Figure 13, Figure 14, Figure 15 and Figure 16, we can conclude that adding 3% CaF2 is beneficial to the recovery of Ni and Fe, however, the recovery of Si and Mg are not good enough. At 1723 K, the recovery of Si is less than 45% and the recovery of Mg is less than 55%. The effect of temperature and the adding amount of CaF2 on the recovery of Si and Mg showed the opposite trend, that is, with the increase of temperature and the amount of CaF2, the recovery of Si showed a downward trend, while the recovery of Mg showed an upward trend. This become a contradiction point for recovering of garnierite comprehensively, therefore, the recovery of Si and Mg will not be ideal if only adding CaF2. Our previous research [29] has proved that CaO can greatly enhance the recovery of Si and Mg. We could consider the mixture of CaF2–CaO as an additive to achieve the purpose of comprehensive recovery of valuable metals from garnierite.

3.4. Phase Analysis of Fe–Ni-Rich Residue

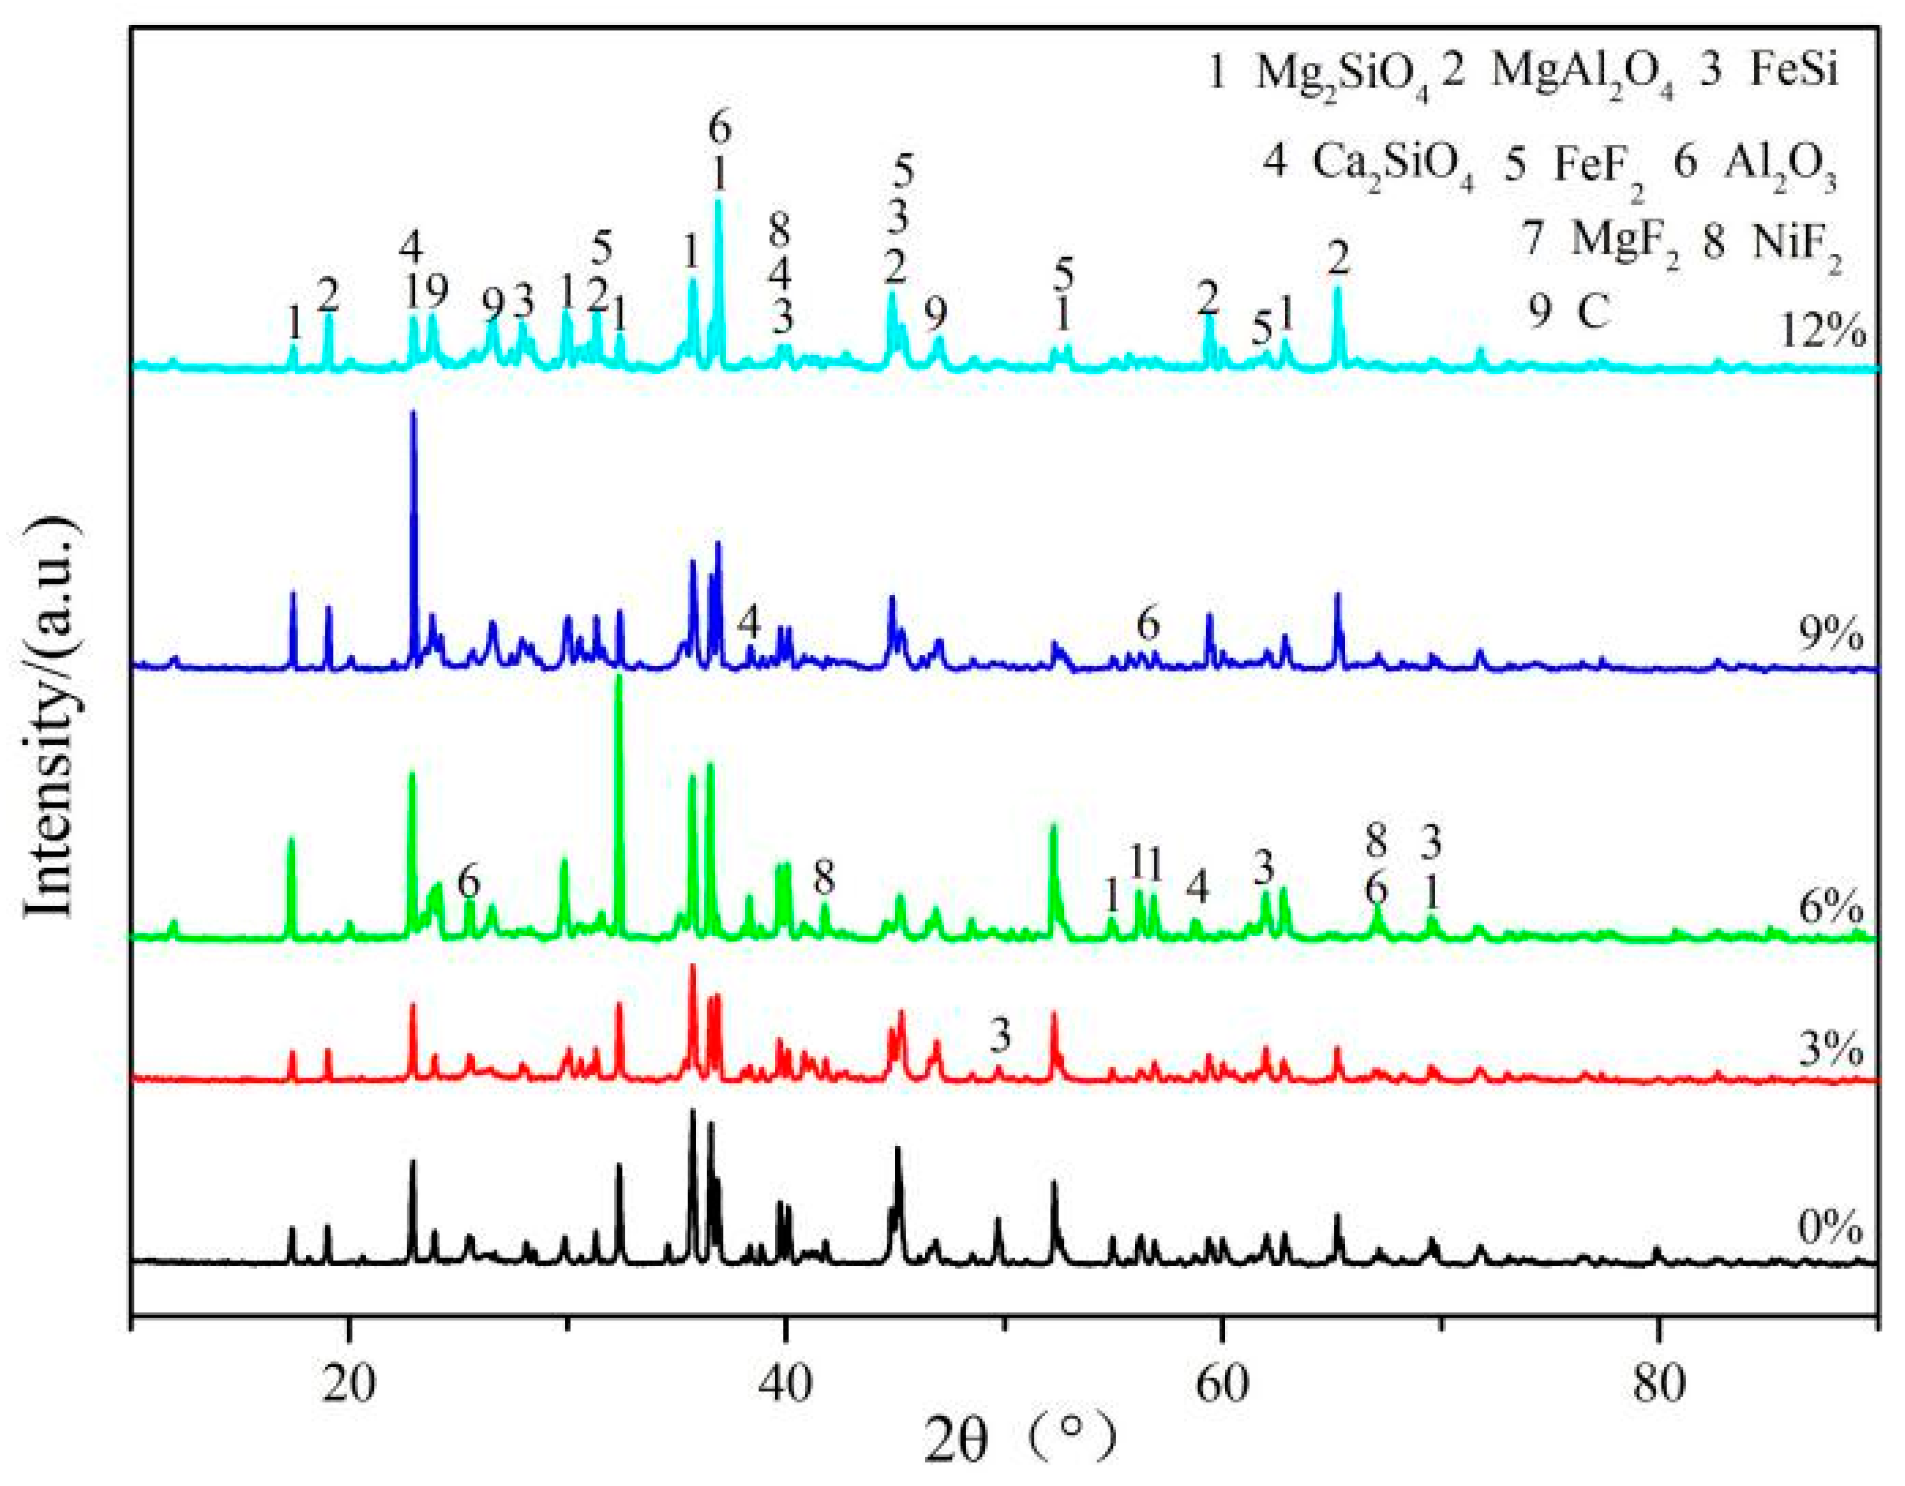
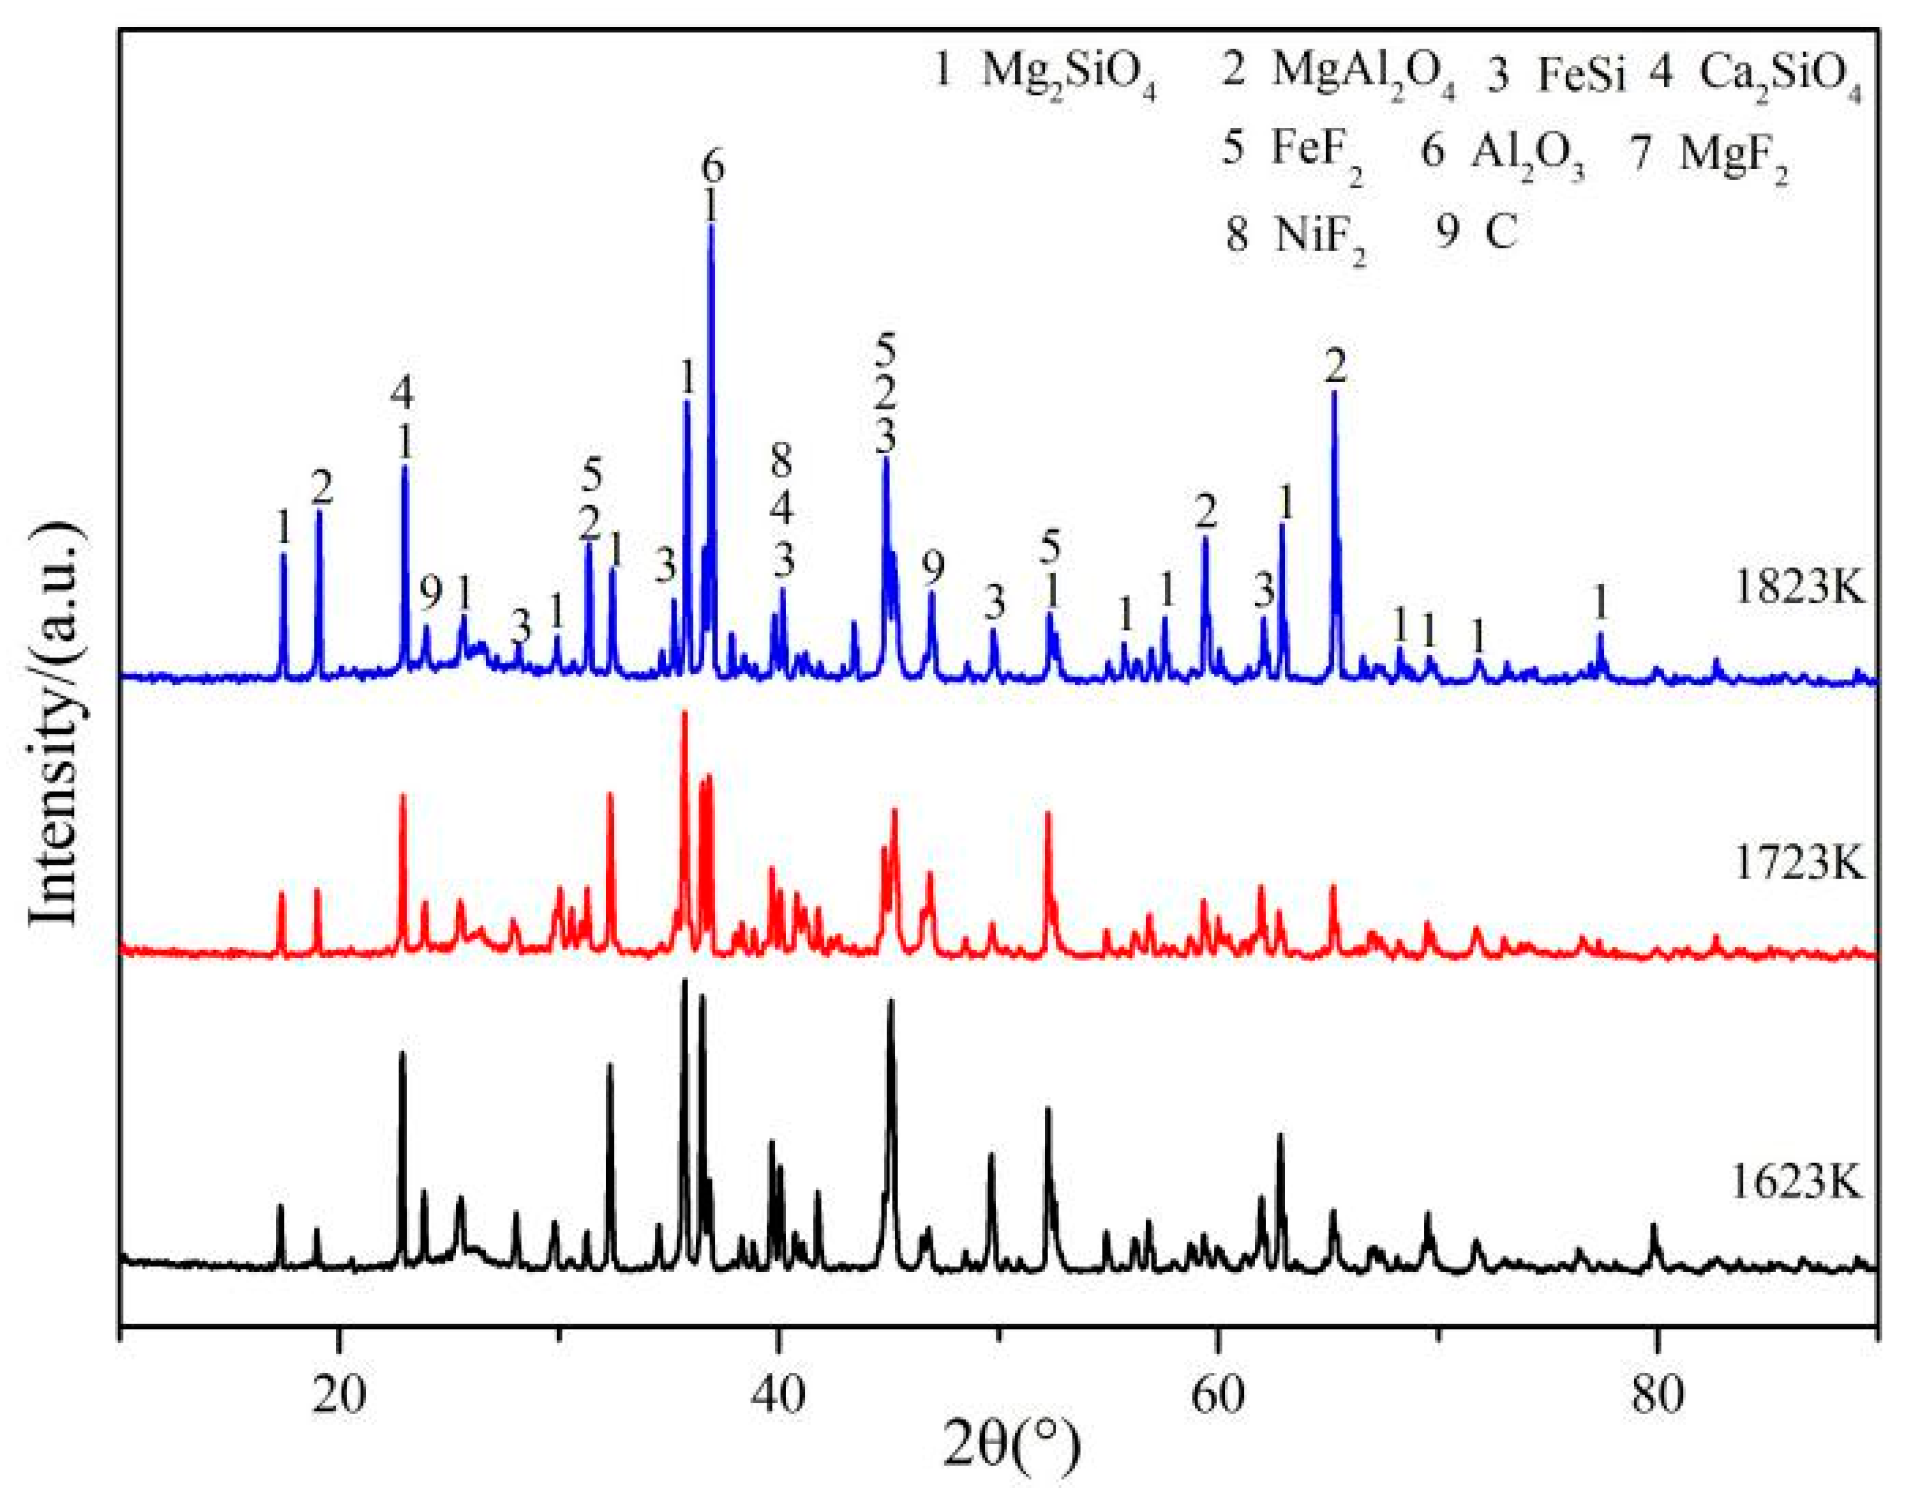
Figure 17 and Figure 18 show that the main phases of the Fe–Ni-rich residue were forsterite, spinel, and FeSi, as well as a small amount of CaSiO3 and low-melting-point compounds (FeF2, NiF2, and MgF2). According to the literature, forsterite, Fe2SiO4, and Ni2SiO4 are mainly produced after the dehydroxylation of lizardite. Forsterite can react with coking coal to form Mg steam at high temperatures. However, the Fe–Ni-rich residue was mainly forsterite in this experiment, which indicated that most of the forsterite did not participate in the reduction reaction.
After the lizardite decomposed, the CaF2 reacted with Fe2SiO4 and Ni2SiO4 to form low-melting-point compounds (FeF2, NiF2, and MgF2), as shown in Figure 17. With increases in CaF2 and temperature, the raw materials changed from the solid to the liquid state. This caused some of the forsterite to react with the coking coal during the melting process, although a large part of forsterite could not react with coking coal due to the stratification after the raw materials melted completely, which caused a large amount of the forsterite to remain in the Fe–Ni-rich residue. The proportion of Ca in the raw materials was less than that of Si, the reduction of Fe and Ni could have combined with Si to form Si–Fe–Ni ternary alloy particles, and the proportion of Ni was low. Therefore, the Si–Fe–Ni ternary alloy showed up as an Fe–Si peak in the XRD pattern. The forsterite and the Al2O3 could have reacted to form spinel, which caused a spinel peak to be found in the Fe–Ni-rich residue. The equations were expressed as Equations (5) and (6) in Section 3.1.
According to Equations (5) and (6), the initial temperatures of the two reactions were 875 K and 1691 K. These results indicate that the reaction in Equation (5) more easily occurred than that in Equation (6), which meant the spinel could be produced under experimental conditions.
As shown in Figure 18, at 1723 K with 3% CaF2, the forsterite peak was weakest and the Fe–Si peak was strongest, which indicates that the reduction of the raw materials was effective under these conditions.

3.5. Mechanism of CaF2 in the Reduction Process

TG-DSC and thermodynamic analysis indicated that the solid materials began to melt at 1315 K and 1400 K and produced low melting point eutectic materials (NiF2 and FeF2) as heating progressed. In the reduction progress, the raw materials reacted with CaF2 to produce SiF4, and forsterite reacted with SiF4 to form another low melting point eutectic material, MgF2, which further accelerated the melting of the materials, causing the materials to transition from solid to liquid. The melting point of NiF2 is 1653 K at 1 atm, the boiling point is 1772 K, the melting point of FeF2 is 1243 K, the boiling point is 1373 K, and FeF2 undergoes sublimation at 1373 K. At 50 Pa, the melting points of NiF2 and FeF2 decrease, therefore, once FeF2 is formed, it undergoes sublimation and NiF2 volatilizes simultaneously. According to the thermodynamics calculations, the initial temperature where MgF2 forms is 1227 K, the melting point of MgF2 is 1534 K, and the boiling point is 2533 K, therefore, MgF2 would not have volatilized under the experimental conditions.
The 20-mm-diameter Fe–Ni–Si ternary alloy collected in the experiment showed that the melted materials accelerated the heat transfer and the mass transfer of Fe and Ni, promoting the FeNi particles to aggregate and grow. With increasing temperature and the increase in addition of CaF2, the volatility of Si in the form of SiO and SiF4 were promoted, causing a sharp drop in the recovery of Si. Due to the density of coking coal being less than that of MgAl2O4, MgAl2O4 being less dense than Mg2SiO4, and Mg2SiO4 being less dense than Fe–Ni–Si ternary alloy, the materials stratified. The stratification of the raw materials and coking coal hindered the reduction of Mg, causing a slow increase in the removal rate of Mg, as shown in Figure 19.

3.6. Magnetic Separation Process

Table 4 shows that after the magnetic separation, the grades of Fe were low, probably because Fe was present in the forsterite and spinel during the reduction process, which resulted in a low chemical analysis result. At the optimal conditions, the direct recoveries of Fe and Ni were 82.97% and 98.21%, respectively, in the vacuum carbothermal reduction–magnetic separation process, and the enrichment ratios were 3.18 and 9.35, respectively, as shown in Table 5. The data in the tables indicate that adding a proper amount of CaF2 could effectively improve the grades and recovery of Fe and Ni.

4. Conclusions

A vacuum carbothermal reduction–magnetic separation method to recover Ni, Fe, and Mg from garnierite was proposed, and the experiments indicated that the optimal conditions for this method for the recovery of Fe and Ni are 1723 K, a molar ratio of ore/C of 1:1.2, and the addition of CaF2 at 3%. The recovery of Fe and Ni reached 82.97% and 98.21%, respectively, in the vacuum carbothermal reduction–magnetic separation process, and the enrichment ratios of Fe and Ni reached a maximum of 3.18 and 9.35, respectively.
The CaF2 in the vacuum carbothermal process formed low-melting-point compounds (FeF2 and NiF2) at 1315 K and 1400 K, respectively, to transform the raw materials from solid to liquid, which accelerated the mass transfer and the heat transfer of Fe–Ni particles, and formed Si–Ni–Fe alloy particles with diameters of approximately of 20 mm. Simultaneously, the smelting materials appeared stratified, hindering the reduction of magnesium.
The removal rate of Mg increased and the maximal recovery only reached 74.12%. The reason for this low Mg removal rate is the stratification of the coking coal and the molten materials, which limited the increase in the recovery of Mg. However, the recovery of Si and the removal rate of Mg showed the opposite trend, this becomes a contradiction point for recovering garnierite comprehensively. Previously, we used this method to recover Ni, Fe, Si, and Mg with CaO as an additive, achieved some good experiment results, especially for the removal rate of Mg [29]. Subsequently, we could consider the mixture of CaF2–CaO as an additive to solve the contradiction of Si and Mg, and achieve the purpose of comprehensive recovery of valuable metals from garnierite.
The method used in this article can solve the problem of the large amounts of slag produced and the inability to recycle the magnesium in the traditional pyrometallurgical process. For the future industrial application, it is necessary to solve the problem of magnesium condensation technology. If magnesium can be recycled in a reduction process, not only can it increase the economic benefits of enterprises, but it can also solve the problem of environment pollution, therefore, it has a certain industrialization significance. In addition, this article clarifies the behavior mechanism of CaF2 in the reduction process of garnierite, it can be used for reference in guiding industrial production.

Author Contributions

Conceptualization, T.Q.; writing—original draft preparation, Q.W.; writing—review and editing, X.G., M.L. and L.S.; funding acquisition, B.Y. and Y.D. All authors have read and agree to the published version of the manuscript.

Funding

This work was funded by the National Nature Science Foundation of China (No. 51604133) and the Academician Free Exploration Fund of Yunnan Province, China (No. 2019HA006).

Conflicts of Interest

The authors declare no conflict of interest.

References

  1. Esmaeili, N.; Ojo, O.A. Analysis of Brazing Effect on Hot Corrosion Behavior of a Nickel-Based Aerospace Superalloy. Metall. Mater. Trans. B 2018, 49, 912–918. [Google Scholar] [CrossRef]
  2. Zhang, L.N.; Szpunar, J.A.; Dong, J.X.; Ojo, O.A.; Wang, X. Dependence of Crystallographic Orientation on Pitting Corrosion Behavior of Ni-Fe-Cr Alloy 028. Metall. Mater. Trans. B 2018, 49, 919–925. [Google Scholar] [CrossRef]
  3. Saad, E.A.; Hassanien, M.M.; Ellban, F.W. Nickel(II) diacetyl monoxime-2-pyridyl hydrazone complex can inhibit Ehrlich solid tumor growth in mice: A potential new antitumor drug. Biochem. Biophys. Res. Commun. 2017, 484, 579–585. [Google Scholar] [CrossRef] [PubMed]
  4. Nasab, M.B.; Hassan, M.R. Metallic Biomaterials of Knee and Hip—A Review. Trends Biomater. Artif. Organs 2010, 24, 69–82. [Google Scholar]
  5. Babić, M.M.; Božić, B.Đ.; Božić, B.Đ.; Filipović, J.M.; Ušćumlić, G.S.; Tomić, S.L. Evaluation of novel antiproliferative controlled drug delivery system based on poly(2-hydroxypropyl acrylate/itaconic acid) hydrogels and nickel complex with Oxaprozin. Mater. Lett. 2016, 163, 214–217. [Google Scholar] [CrossRef]
  6. Setcos, J.C.; Mahani, A.B.; Silvio, L.D.; Mjor, I.A.; Wilson, N.H.F. The safety of nickel containing dental alloys. Dent. Mater. 2006, 22, 1163–1168. [Google Scholar] [CrossRef] [PubMed]
  7. Zhang, L.; Yang, H.P.; Cao, F.; Feng, A.S.; Zhao, J.W. Study on Current Situation and Analysis of Supply and Demand of Global Nickel Resource. Conser. Utilizat. Miner. Resour. 2016, 1, 64–69. [Google Scholar]
  8. Zong, K.; Zhou, J.Y.; Fu, S.X. Study on global market allocation of Chinese nickel metal resources. Miner. Explor. 2015, 6, 86–91. [Google Scholar]
  9. Valix, M.; Tang, J.Y.; Cheung, W.H. The effects of mineralogy on the biological leaching of nickel laterite ores. Miner. Eng. 2001, 14, 1629–1635. [Google Scholar] [CrossRef]
  10. Myagkiy, A.; Truche, L.; Cathelineau, M.; Golfier, F. Revealing the conditions of Ni mineralization in the laterite profiles of New Caledonia: Insights from reactive geochemical transport modelling. Chem. Geol. 2017, 466, 274–284. [Google Scholar] [CrossRef]
  11. Alfantazi, A.M.; Moskalyk, R.R. Nickel laterite processing and electrowinning practice. Miner. Eng. 2002, 15, 593–605. [Google Scholar]
  12. Ma, B.Z.; Wang, C.Y.; Yang, W.J.; Chen, Y.Q.; Yang, B. Comprehensive utilization of Philippine laterite ore, part 1: Design of technical route and classification of the initial ore based on mineralogical analysis. Int. J. Miner. Process. 2013, 124, 42–49. [Google Scholar] [CrossRef]
  13. Khoo, J.Z.; Haque, N.; Bhattacharya, S. Process simulation and exergy analysis of two nickel laterite processing technologies. Int. J. Miner. Process. 2017, 161, 83–93. [Google Scholar] [CrossRef]
  14. Elliott, R.; Pickles, C.A.; Forster, J. Thermodynamics of the Reduction Roasting of Nickeliferous Laterite Ores. J. Miner. Mater. Charact. Eng. 2016, 4, 320–346. [Google Scholar] [CrossRef] [Green Version]
  15. Kursunoglu, S.; Ichlas, Z.T.; Kaya, M. Solvent extraction process for the recovery of nickel and cobalt from Caldag laterite leach solution: The first bench scale study. Hydrometallurgy 2017, 169, 135–141. [Google Scholar] [CrossRef]
  16. Leonardou, S.A.; Tsakiridis, P.E.; Oustadakis, P.; Karidakis, T.; Katsiapi, A. Hydrometallurgical process for the separation and recovery of nickel from sulphate heap leach liquor of nickeliferrous laterite ores. Miner. Eng. 2009, 22, 1181–1192. [Google Scholar] [CrossRef]
  17. Ma, B.Z.; Wang, C.Y.; Yang, W.J.; Yang, B.; Zhang, Y.L. Selective pressure leaching of Fe (II)-rich limonitic laterite ores from Indonesia using nitric acid. Miner. Eng. 2013, 45, 151–158. [Google Scholar] [CrossRef]
  18. Kaya, S.; Topkaya, Y.A. High pressure acid leaching of a refractory lateritic nickel ore. Miner. Eng. 2011, 24, 1188–1197. [Google Scholar] [CrossRef]
  19. Johnson, J.A.; Cashmore, B.C.; Hockridge, R.J. Optimisation of nickel extraction from laterite ores by high pressure acid leaching with addition of sodium sulphate. Miner. Eng. 2005, 18, 1297–1303. [Google Scholar] [CrossRef]
  20. Muir, B.I.; Whittington, D. Pressure acid leaching of nickel laterites: A review. Miner. Process. Extr. Metall. Rev. 2000, 21, 527–599. [Google Scholar]
  21. Dodbiba, G.; Kim, J.; Tanno, H.; Okaya, K.; Matsuo, S.; Fujita, T. Calcination of low-grade laterite for concentration of Ni by magnetic separation. Miner. Eng. 2010, 23, 282–288. [Google Scholar]
  22. Li, G.H.; Shi, T.M.; Rao, M.J.; Zhang, Y.B. Beneficiation of nickeliferous laterite by reduction roasting in the presence of sodium sulfate. Miner. Eng. 2012, 32, 19–26. [Google Scholar] [CrossRef]
  23. Zhu, D.Q.; Cui, Y.; Vining, K.; Hapugoda, S.; Douglas, J.; Pan, J.; Zheng, G.L. Upgrading low nickel content laterite ores using selective reduction followed by magnetic separation. Int. J. Miner. Process. 2012, 106–109, 1–7. [Google Scholar] [CrossRef]
  24. Ma, B.Z.; Xing, P.; Yang, W.J.; Wang, C.Y.; Chen, Y.Q.; Wang, H. Solid-State Metalized Reduction of Magnesium-Rich Low-Nickel Oxide Ores Using Coal as the Reductant Based on Thermodynamic Analysis. Metall. Mater. Trans. B 2017, 48, 2037–2046. [Google Scholar] [CrossRef]
  25. Cao, C.; Xue, Z.L.; Duan, H.J. Making Ferronickel from Laterite Nickel Ore by Coal-Based Self-Reduction and High Temperature Melting Process. Int. J. Nonfer. Metall. 2016, 5, 9–15. [Google Scholar] [CrossRef] [Green Version]
  26. Li, J.H.; Chen, Z.F.; Shen, B.P.; Xu, Z.F.; Zhang, Y.F. The extraction of valuable metals and phase transformation and formation mechanism in roasting-water leaching process of laterite with ammonium sulfate. J. Clean. Prod. 2017, 140, 1148–1155. [Google Scholar] [CrossRef]
  27. Xu, C.; Cheng, H.W.; Li, G.S.; Lu, C.Y.; Lu, X.G.; Zou, X.L.; Xu, Q. Extraction of metals from complex sulfide nickel concentrates by low-temperature chlorination roasting and water leaching. Int. J. Miner. Metall. 2017, 24, 377–385. [Google Scholar] [CrossRef]
  28. Zhou, S.W.; Wei, Y.G.; Li, B.; Ma, B.Z.; Wang, C.Y.; Wang, H. Kinetics study on the dehydroxylation and phase transformation of Mg3Si2O5(OH)4. J. Alloys Compd. 2017, 713, 180–186. [Google Scholar] [CrossRef]
  29. Wang, Q.; Qu, T.; Gu, X.P.; Shi, L.; Yang, B.; Dai, Y.N. The effect of CaO on the recovery of Fe and Ni in a vacuum carbothermal reduction of garnierite. J. Min. Metall. Sect. B Metall. 2019, 55, 351–358. [Google Scholar] [CrossRef] [Green Version]
Figure 1. Work flow of the experimental procedure.
Metals 10 00129 g001
Figure 2. X-ray diffraction (XRD) patterns of garnierite.
Metals 10 00129 g002
Figure 3. Schematic model of the vacuum distillation furnace: 1, high vacuum valve; 2, release valve; 3, bypass valve; 4, main valve; 5, rotary vane pump; 6, diffusion pump; 7, inflation valve; 8, vacuum pipe; 9, raw materials; 10, graphite crucible; 11, graphite heater; 12, heat shield; 13, water cooled walls; 14, graphite condensing pipe; and 15, condensation.
Metals 10 00129 g003
Figure 4. The reduced slag at (a) 1623 K, (b) 1723 K, and (c) 1823 K with 3% CaF2.
Metals 10 00129 g004
Figure 5. Phenomena of stratification for the residue after reduction at the experimental temperature with more than 3% CaF2.
Metals 10 00129 g005
Figure 6. XRD pattern and energy-dispersive X-ray spectroscopy (EDS) analysis of Layer 1.
Metals 10 00129 g006
Figure 7. XRD pattern and EDS analysis of Layer 2.
Metals 10 00129 g007
Figure 8. XRD pattern and EDS analysis of Layer 3.
Metals 10 00129 g008
Figure 9. XRD pattern and EDS analysis of Layer 4.
Metals 10 00129 g009
Figure 10. XRD pattern and EDS analysis of the condensate on the graphite crucible lid.
Metals 10 00129 g010
Figure 11. Thermogravimetry-differential scanning calorimetry (TG and DSC) curves of the raw materials.
Metals 10 00129 g011
Figure 12. TG and DSC curves of the raw materials in presence of CaF2.
Metals 10 00129 g012
Figure 13. The effect of additives and temperature on Fe enrichment (%), the upper three lines in the figure represents the recovery of Fe, and the lower three lines in the figure represents the grade of Fe.
Metals 10 00129 g013
Figure 14. The effect of additives and temperature on Ni enrichment (%), the upper three lines in the figure represents the recovery of Ni, and the lower three lines in the figure represents the grade of Ni.
Metals 10 00129 g014
Figure 15. The effect of additives and temperature on Si enrichment (%). The upper three lines in the figure represents the recovery of Si, and the lower three lines in the figure represents the grade of Si.
Metals 10 00129 g015
Figure 16. The effect of additives and temperature of Mg removal rate (%).
Metals 10 00129 g016
Figure 17. XRD patterns of the Fe–Ni-rich residue at 1723 K with 0–12% CaF2.
Metals 10 00129 g017
Figure 18. XRD patterns of the Fe–Ni-rich residue at different temperatures with 3% CaF2.
Metals 10 00129 g018
Figure 19. The influence and behavior of CaF2 on the reduction process.
Metals 10 00129 g019
Table 1. The composition of the garnierite (wt. %).
ComponentSiO2MgOFeNiCoAl2O3Others
Content38.8222.8312.660.720.034.5720.37
Table 2. The composition of the CaF2 (wt. %).
ComponentCaF2SiFeHeavy MetalChlorideSulfateNitride
Content≥98.5≤0.01≤0.003≤0.003≤0.01≤0.05≤0.005
Table 3. The composition of the coking coal (wt %).
ComponentCAshMoistureVolatileK (g)
Content85.8312.020.142.017187.2
Table 4. The content and recovery of Fe and Ni using the magnetic separation process and using the vacuum carbothermal reduction–magnetic separation process.
Temperature (K)CaF2 (wt. %)Quality of Magnetic Material (g)Chemical Analysis of Fe, Ni in Magnetic Materials (%)Quality of Non-Magnetic Material (g)Chemical Analysis of Fe, Ni in Non-Magnetic Materials (%)
FeNiFeNi
1623324.4932.465.1835.660.420.04
1823330.2938.175.9921.710.330.05
1723050.5414.951.0450.540.000.00
1723311.1640.206.7321.750.180.03
1723623.6138.306.6950.570.230.07
1723923.0637.306.2249.730.260.06
17231219.0334.755.1149.130.380.02
Table 5. Enrichment ratio of Fe and Ni with different dosages of CaF2 at different temperature and Recovery of Fe and Ni during the vacuum carbothermal reduction–magnetic separation process.
Temperature (K)1623182317231723172317231723
CaF2 (wt %)33036912
Enrichment ratio of Fe (%)2.563.021.183.183.032.952.75
Enrichment ratio of Ni (%)7.198.321.449.359.298.647.10
Recovery of Fe (%)73.1973.8771.5082.9754.0351.5540.90
Recovery of Ni (%)84.8993.6287.4598.2181.1964.6448.69