Article

Effect of Process Parameters in Copper-Wire Drawing

by
Gustavo Aristides Santana Martinez
1,
Wei-Liang Qian
1,2,
Leonardo Kyo Kabayama
3 and
Umberto Prisco
4,*
1
Engineering School of Lorena, University of São Paulo-USP, Lorena 12602-810, Brazil
2
College of Physics and Electric Engineering, Qilu Normal University, Jinan 250300, China
3
Institute of Mechanical Engineering, Federal University of Itajubá-UNIFEI, Itajubá 37500-903, Brazil
4
Department of Chemical, Materials and Production Engineering, University of Napoli Federico II, piazzale Tecchio 80, 80125 Napoli, Italy
*
Author to whom correspondence should be addressed.
Metals 2020, 10(1), 105; https://doi.org/10.3390/met10010105
Submission received: 29 November 2019 / Revised: 2 January 2020 / Accepted: 6 January 2020 / Published: 9 January 2020

Abstract

:
The efforts to increase the operating speed of the wire drawing process play a crucial role regarding the industrial productivity. The problem is closely related to various features such as heat generation, material plastic deformation, as well as the friction at the wire/die interface. For instance, the introduction of specific lubricants at the interface between the die and the wire may efficiently reduce the friction or in another context, induce a difference in friction among different regimes, as for the case of hydrodynamic lubrication. The present study systematically explores various aspects concerning the drawing process of an electrolytic tough pitch copper wire. To be specific, the drawing speed, drawing force, die temperature, lubricant temperature, and stress distributions are analysed by using experimental as well as numerical approaches. The obtained results demonstrate how the drawing stress and temperature are affected by the variation of the friction coefficient, die geometry, and drawing speed. It is argued that such a study might help in optimizing the operational parameters of the wire drawing process, which further leads to the improvement of the lubrication conditions and product quality while minimizing the energy consumption during the process.

1. Introduction

Wire drawing is a metal forming process characterized by a high deformation rate. During the process, a significant amount of heat is generated, mainly by the friction at the wire/die interface [1]. In [2], Haddi et al. showed that the capability of a drawing process depends primarily on three features: (a) the properties of the raw material, (b) the die geometries, inclusively the die angle and die length and, (c) the processing conditions such as the drawing speed and friction at the interface between the die and the wire. Regarding the last factor, heat is generated by the friction associated with the pressure generated by the plastic deformation. By definition, the friction is proportional to the normal tension at the wire/die interface. This friction produces heat because of the relative movement between the material and the die. Thus, a classic tribological setup arises [3]. This is characterized by friction at the wire/die interface and by the subsequent wear on both the surfaces in contact [4,5,6]. For specific die geometry, the friction at the interface might bring about a non-uniform heating of the wire. Indeed, the associated thermal effect is known to carry relevant consequences for the drawing process, as several authors in the related scientific literature have proved [7,8,9,10]. For instance, the temperature affects the lubrication conditions, the tool life, and the properties of the final product. This occurs mainly due to the delay in the heat dissipation, as pointed out by El-Domiaty et al. [11]. To alleviate the undesired effects, a lubricant is usually utilized [12]. The tribological problems concerning the wire drawing process have been studied both experimentally [13,14,15] and theoretically [6,16,17,18,19,20,21,22]. In particular, numerical analyses, such as the finite element method, have been extensively employed in previous researches [6,16,17,18,19,20,21,22]. A sketch of the finite element setup used for the study of the tribological problem is presented in
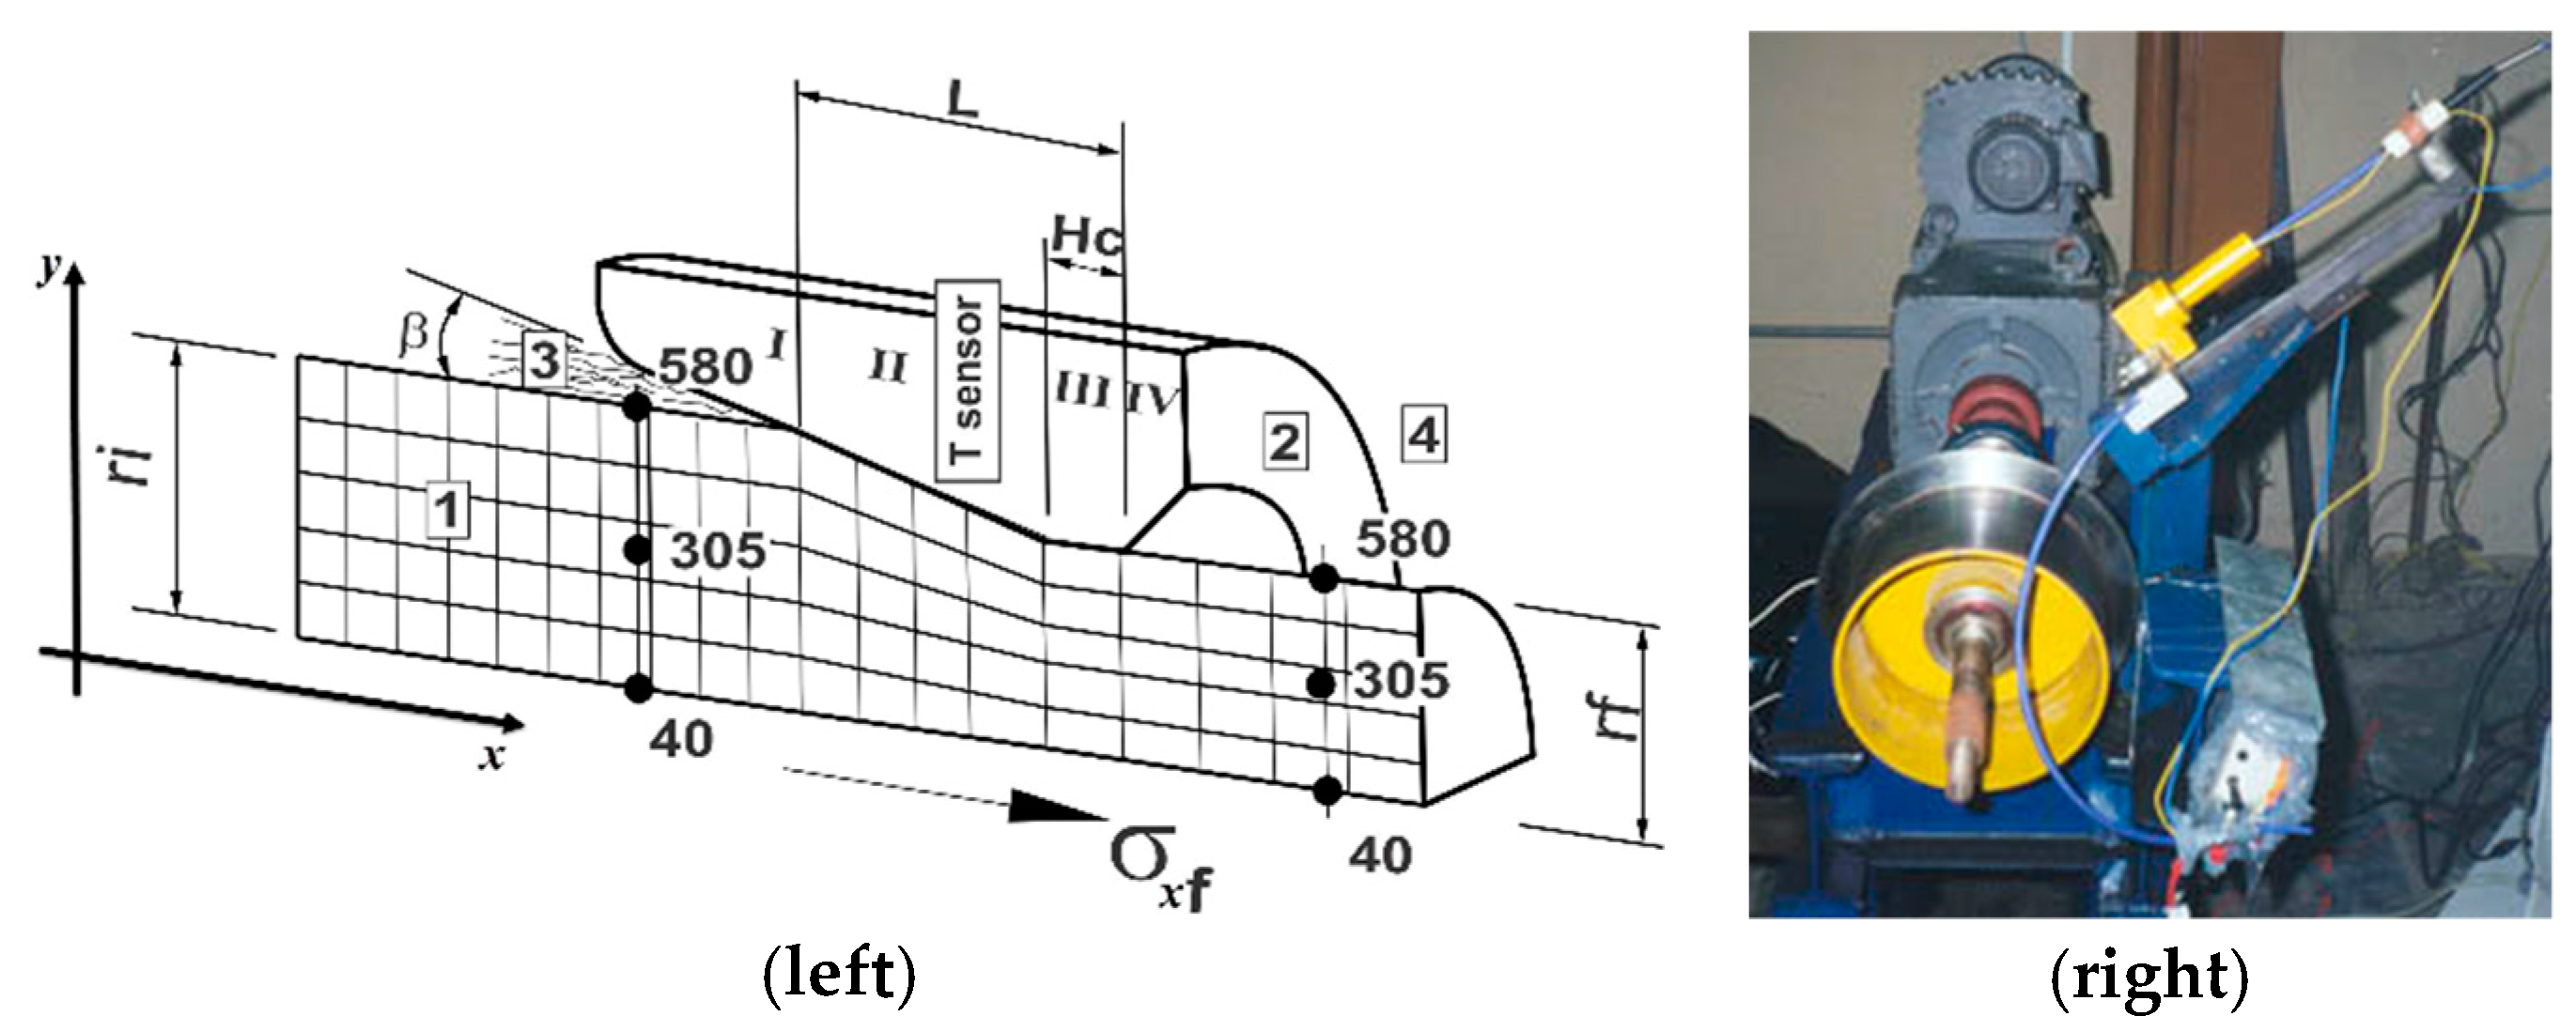
 Figure 1.
As indicated in Figure 1, from a tribological point of view, the die is the stationary triboelement, whose primary purpose is to ensure the most homogenous deformation of the wire. To achieve a uniform straining process, it is necessary to develop the best combination of the die area reduction and the yield stress [23]. In other words, one seeks for the optimized redundant work, ϕ factor (Equation (1)), which is shown to be related to the ∆ parameter (Equations (2) and (3)). The latter is closely related to the fact that one has to minimize the wear of tools [13]. In practice, tool wear causes not only direct expense, but also indirect costs associated with additional procedures such as tool replacement and/or regeneration [13,14,24].
ϕ ≈ 1 + 0.27∆
Δ = β r [ 1 + 1 r ] 2
r = 1 A f A i
where Ai is the cross-section of the wire before its drawing process, Af indicates that after the drawing process, thus r represents the reduction ratio.
One of the most notable contributions was proposed by Avitzur [25], who introduced the so-called upper-bound method (Equation (4)). By using such an approach, according to Bitkov [26], allows for a reasonable estimation of the ratio of wire drawing stress to the yield stress during the process as follows
σ x f σ 0 = σ x b σ 0 + 2 · f ( β ) · ln r i r f + 2 3 ( β sin 2 β cot β ) + 2 μ { cot β · [ 1 σ x b σ o ln r i r f ] · ln r i r f + H c r f } 1 + 2 μ · H c r f
where σ0 is the yield stress, σxb indicates the backward stress, and σxf represents the wire-drawing stress. Here the backward stress is exerted by the capstan which is in the opposite direction of the wire-drawing stress.
As discussed above, however, the lubrication plays an essential role in terms of the coefficient of friction µ in Equation (4). In practice, as shown in Figure 1, a suitable lubricant film thickness has to be applied along the contact length (L). To be specific, the particular measure of the interface triboelement directly affects the heat generated, the die wear, and the mechanical properties of the wire [14,27,28]. The contact length L is a function of the die angle (2β) and of the effective length of the bearing zone (Hc) as determined geometrically in Equation (5).
L = [ ( r i r f tan β ] + H c
Suliga [22] showed that the geometry of the reduction zone, for instance, the die angle 2β, influences the temperature in the top layer of the wire considerably. The decrease in the die angle implies an increase of the wire/die contact length. This, in turn, leads to a higher temperature on the wire surface. The main reason for using the wire drawing lubricants is to reduce die friction, and subsequently, the power required for drawing and the heat generation. In practice, liquid lubricants are also known for their efficiency in heat dissipation, and therefore the wire is kept at a moderate temperature. The quantity of lubricant, in part, defines the regime of lubrication established during the drawing process. According to Wilson [3] and Wright [29], three regimes can be achieved under different conditions, namely, hydrodynamic lubrication, mixed (quasi-hydrodynamic) lubrication, and boundary lubrication. To reach a hydrodynamic or quasi-hydrodynamic regime, it is necessary to feed and maintain the lubricant at the wire/die interface at a prevailing pressure throughout the process. It is worth mentioning that from the point of view of the wire drawing industry, among the triboelements shown in Figure 1, the die is often the most crucial variable. The latter must be optimized in order to achieve the desired cost efficiency ratio concerning a given wire drawing process. This is due to the fact that the material and the lubricant are usually supplied by third parties, while the manipulation of the middle triboelement also implies a substantial cost.
The present work carried out a comprehensive study concerning the experimental as well as numerical analyses of the wire drawing process. Various aspects are investigated in order to seek the desired wire drawing operational parameters. It is a meaningful effort because the appropriate wire drawing condition implies reduced energy consumption, better product quality, and improved productivity. The rest of the paper is organized as follows. In the next section, we describe the specific wire drawing setup carried out in the present study. The results from empirical as well as finite element method (FEM) simulations are presented in Section 3, accompanied by discussions. Concluding remarks are given in the last section.

2. Materials and Methods

Specimens of annealed electrolytic tough pitch 99.94% copper (Cu-ETP) with an initial diameter of 0.5 mm (Di) were wire drawn to a final diameter of 0.45 mm (Df) with a true strain equal to 0.211. The process was performed in a single block drawing measuring the drawing force and the die and lubricant temperatures. The measurements are carried out for steady states where the temperature of the material does not vary in time. In practice, the drawing forces are determined using a load cell system mounted on the polycrystal diamond (PCD) die. The die was fully immersed in the lubricant. The experiments were performed with a drawing speed varying from 1 to 23 m/s. The internal geometry of die is determined in terms of the die angle (2β) and the bearing zone length. For the present study, the die angle takes the values of 14° and 18° degrees, while the bearing zone length assumes 20%, 35%, and 50% of Df (also see Figure 1). The above quantities are measured by a contourgraph apparatus. The temperatures are obtained using two thermocouples. These thermocouples are attached to the inner surface of the die and immersed in the mineral lubricant. On the other hand, the drawing stresses are measured by using the sensors mounted on the die.
Instead of online measurement, the friction coefficient (µ) is calculated by using the upper-bound method [25], together with the experimental data of the wire drawing force. The evaluated friction coefficient is then used to define the regime of lubrication, according to Wilson [3]. Regarding the mechanical properties of wire, tensile testing in the annealed condition is performed for commercial Cu-ETP with 0.5 mm and a length of 200 mm. The wire drawing process is also performed for specimens with respect to dynamic viscosity of lubricant. The latter is aimed at investigating the performance of mineral lubricants currently used in industrial at moderate temperatures.
On the other hand, numerical calculations have also been carried out by employing FEM to simulate the copper wire drawing process. In particular, Marc/Mentat, a program based on quasi-static formulation, is utilized. The model consists of isoperimetric elements, which are quadrilateral as suitable for the present axisymmetric layout. In other words, the three-dimensional system is modelled effectively in a two-dimensional fashion in terms of longitudinal as well as radial coordinates. Subsequently, each element makes use of a multilinear (10 pairs of plastic stress-strain values) function for the interpolation, and therefore, the deformations tend to be constant along with the element. As the wire is considered as an isotropic deformable-body that changes its shape in an elastic-plastic manner, the simulation is implemented in terms of 10 four-node-elements in the radial direction and 52 elements in the axial direction. The die is treated as a rigid body, and the values of calculated friction coefficients adapt those from the experimental measurements. The procedure is formulated in terms of a Lagrangian algorithm for the analysis of, particularly, large deformations. The latter correspond to those that exist in plastic deformations whose magnitude cannot be considered as infinitesimal. The contact between the die and the wire is frictional and modeled by Coulomb´s coefficient. This is implemented into the FEM model by using different values of friction coefficient. We note that the backward tension and the thermal phenomenon generated during the process are not taken into account in the present approach.
The simulations are carried out for different die geometries to explore the effect on the axial and radial stress distribution and the regime of lubrication. In particular, the passage of the points on the surface (node 580), in the intermediate region (node 305), and at the centre (node 40) of the wire is analysed as shown in Figure 1.

3. Results

In this section, the results regarding the measurements made on a single block drawing machine are presented together with those of FEM simulations. The experimental results are presented in Table 1, Table 2 and Table 3, Figure 2, Figure 3 and Figure 4, and those from the numerical simulations are shown in Figure 5 and Figure 6.
In Table 1, one shows the obtained tensile stress limit (σr), yield strength (σe,0.2%), Young modulus (E) and Poisson’s ratio (n) from the uniaxial tensile tests performed in room temperature on the Cu-ETP. The material model (FEM) was built up by 10 plastic stress-strain point.
In Table 2, we present and discuss the results of dynamic viscosity tests regarding the mineral lubricants (interface triboelement) at various temperatures commonly encountered in practice. One finds a 48.1% reduction in dynamic viscosity as the temperature increases from 25 to 70 degrees. The above result strongly indicates the temperature dependence of the dynamic viscosity regarding the mineral lubricants used in wire drawing.
In Table 3, one summarizes the operational parameters of the system of the present study. The values of L, , and Φ of the dies are determined by the specific 2β and Hc used in this work.
It is noted since L is the length of the wire/die contact zone, the lubricant must be concentrated in the contact zone to form a layer of an adequate thickness which prevents direct contact between the die and wire. A poor lubrication of the contact zone might lead to mixed lubrication, multiple asperity contacts, as well as severe wear [14]. Naively, if one only considers how the lubricant is distributed in the contact zone, according to the values given in Table 3, the dies 1420 and 1820 seem to be better options as they possess minor values of L.
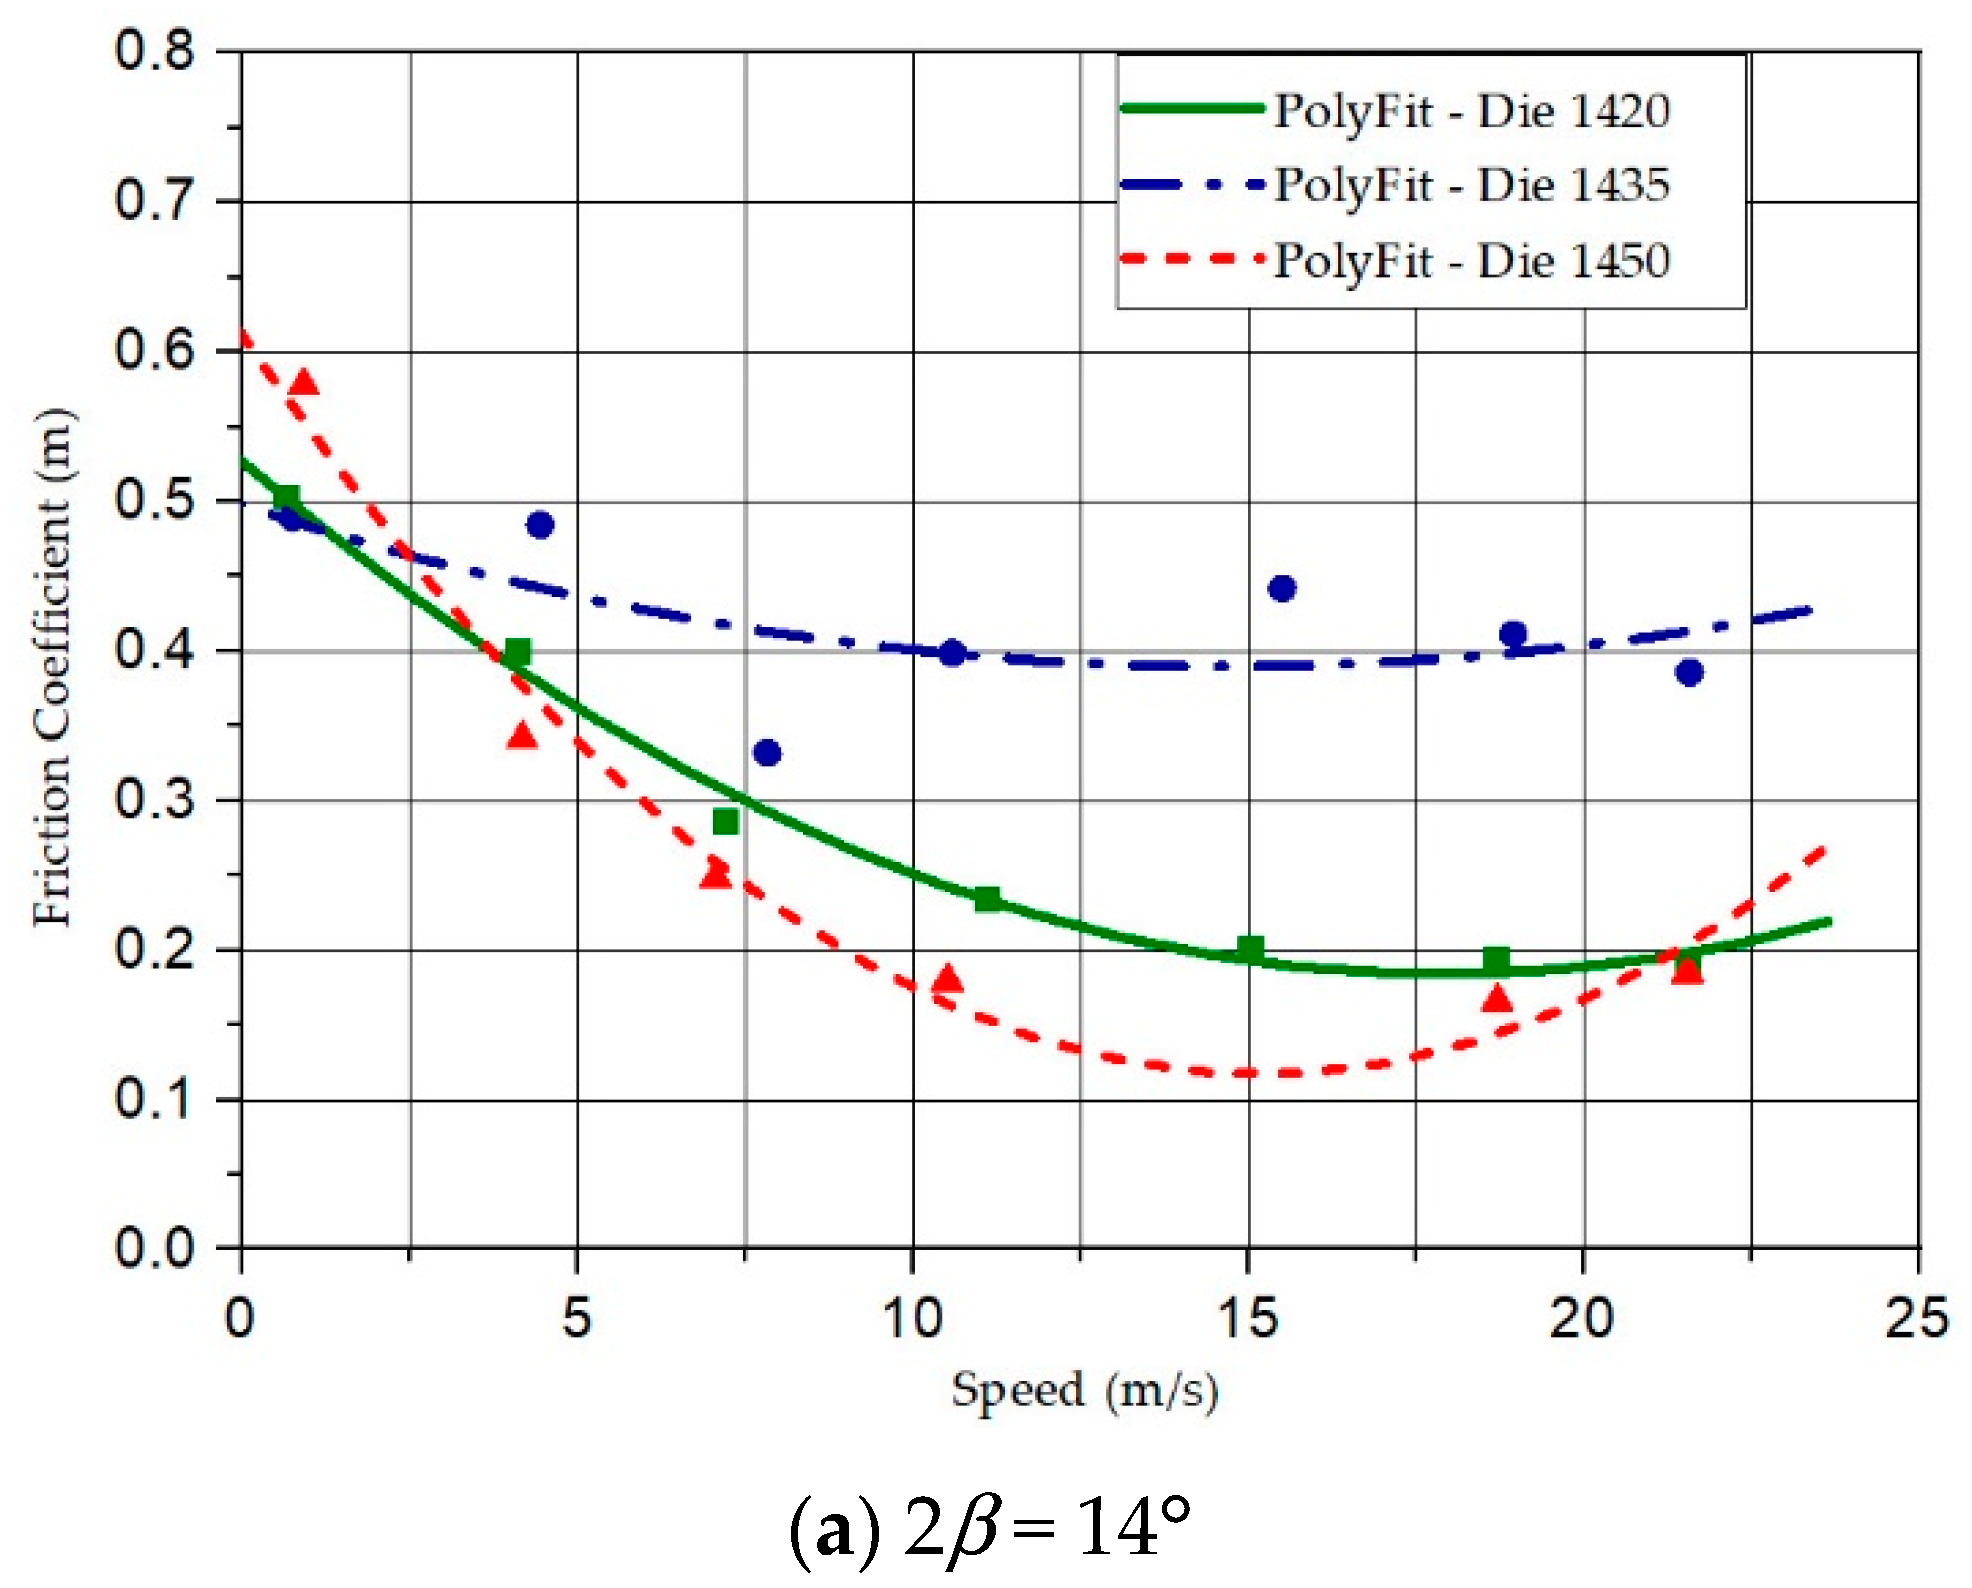
Figure 2 gives the friction coefficients obtained for different drawing speeds. Here, the values of the friction coefficients are obtained from the measurements of the wire drawing force and employing Equations (6) and (7) according to Equation (4) of Avitzur’s [25] upper-bound method.
μ = σ 0 · ( σ x b σ 0 + 2 · f ( β ) · ln r i r f + 2 3 · ( β sin 2 β cot β ) ) σ x f 2 · ( ( H c r f · σ x f ) { σ 0 · [ cot β · ( 1 σ x b σ 0 ln r i r f ) · ln r i r f + H c r f ] } )
f ( β ) = { 1 cos β · 1 11 12 · sin 2 β + 1 11 × 12 · ln 1 + 11 12 11 12 · cos β + 1 11 12 sin 2 β } sin 2 β
The key feature of the classical Stribeck curve is observed in the plots of Figure 2 [29,30,31]. To be more specific, the results shown in Figure 2 indicate a reduction of friction as the wire drawing speed increases until a critical value, approximately 15 m/s. It is understood that the increase of speed causes a higher cartage of lubricants owing to the surface effect of the wedge formed at the wire/die interface [31]. Beyond the critical value, however, excess of lubricant dragging in the wire/die interface eventually causes the fluid friction to increase again.
The results also demonstrate that, by itself, a smaller contact length L does not always guarantee better performance. For instance, the bearing zone length Hc, and the wire drawing speed also affect the outcome. To be more specific, it is found that the dies with die angle 2β = 18° reach the minimal friction coefficients at the most significant speed (20.6~24.2 m/s). On the contrary, those with die angles 2β = 14° reach the minima at smaller speeds (14.4~18.7 m/s). Such a difference is due to the difficulty in dragging the lubricant at a higher ∆ (2.98) associated with the larger Φ (1.48), despite the smaller contact length L (0.25~0.38). These results are in agreement with those of Nowotynska et al. [24], where the authors affirm that the internal geometry of a drawing die is a part of the operational parameters which significantly affect the drawing process. According to Dixit and Dixit [32], an increase in die angle cause the die pressure to increase but reduces the separation forces. Their results were based on the assumption that the operational parameters, as well as the material properties, possess constant values, and do not change as the temperature increases during the process. Hollinger [14] asserts that not only mechanical but also a tribological approach of the system should be used to obtain better results.
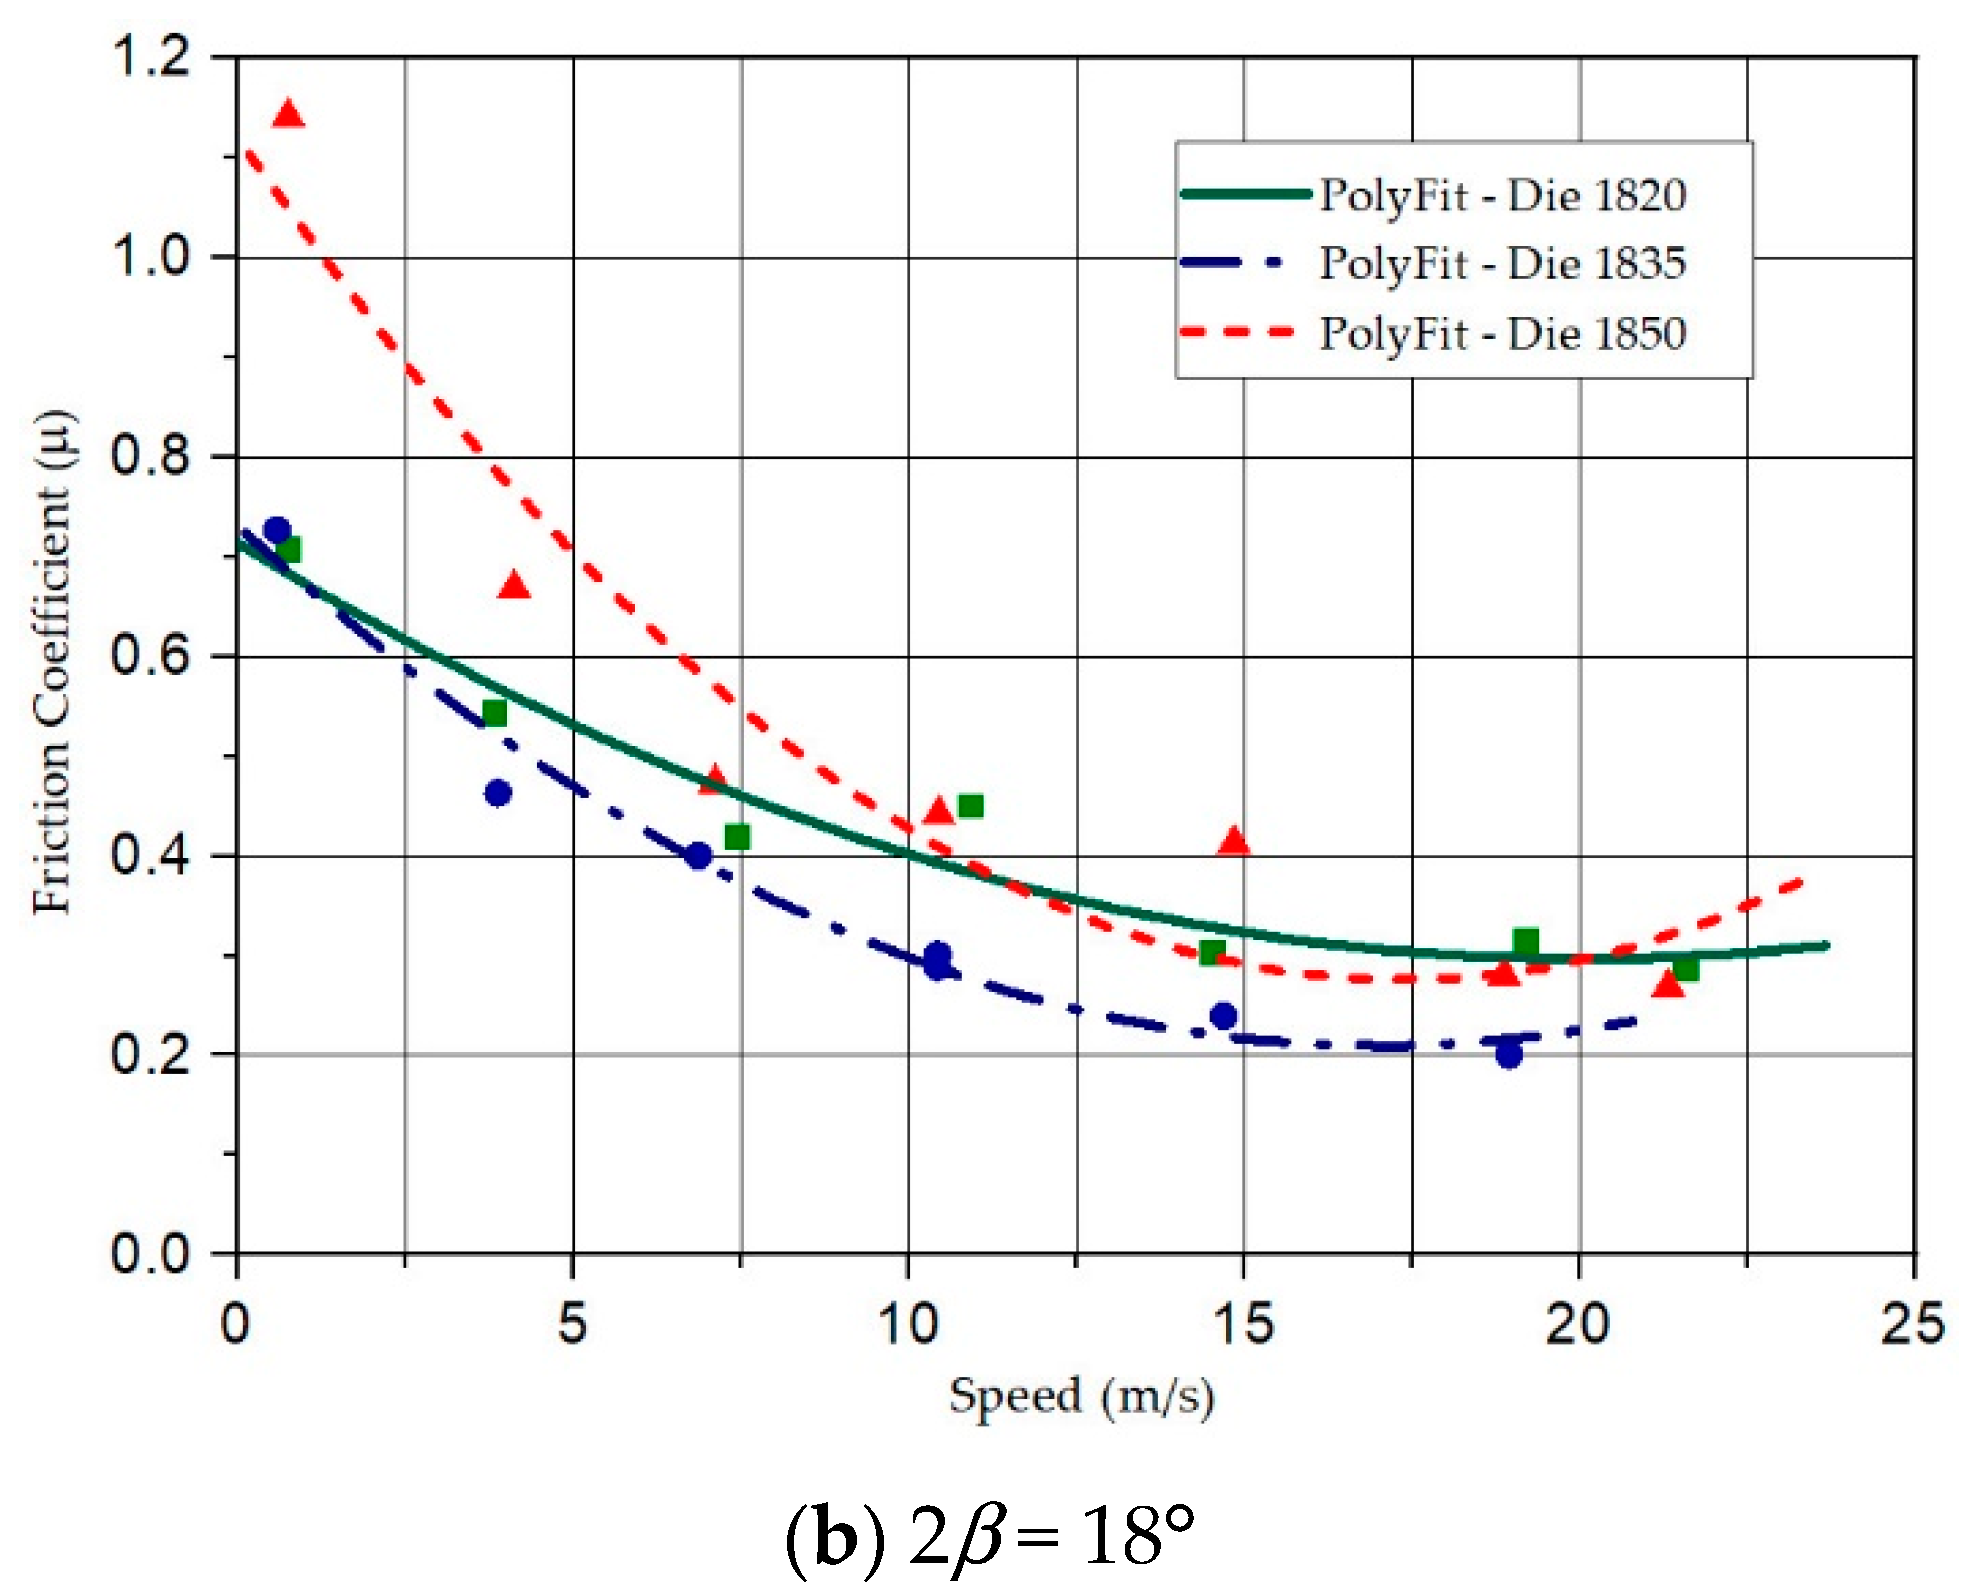
In Figure 3, one presents the friction coefficients as functions of drawing speed for the dies 1450 and 1835. The latter are considered as better options. The two horizontal lines outline the mixed lubrication regime (µ ≤ 0.4) and the hydrodynamic (µ ≤ 0.1), as discussed in the literature [3]. The intermediate regime is encountered between the two lines can be identified as the quasi-hydrodynamic regime. The die 1450 reaches the vicinity of the hydrodynamic lubrication due to its higher drag (2β = 14°) and maintenance (Hc = 50% Df) of lubricant in the wire/die interface. This results are in agreements with those obtained by Tintelecan [33] who found that the lowest values of force and, consequently, of friction coefficient are obtained for die angles ranging between 12° and 15° and for a length of the bearing zone Hc equal to ~40% of the Df. Furthermore, according to Suliga [22], the selection of the appropriate die geometry in the process of drawing at high speeds is likely to find more favourable lubrication conditions.
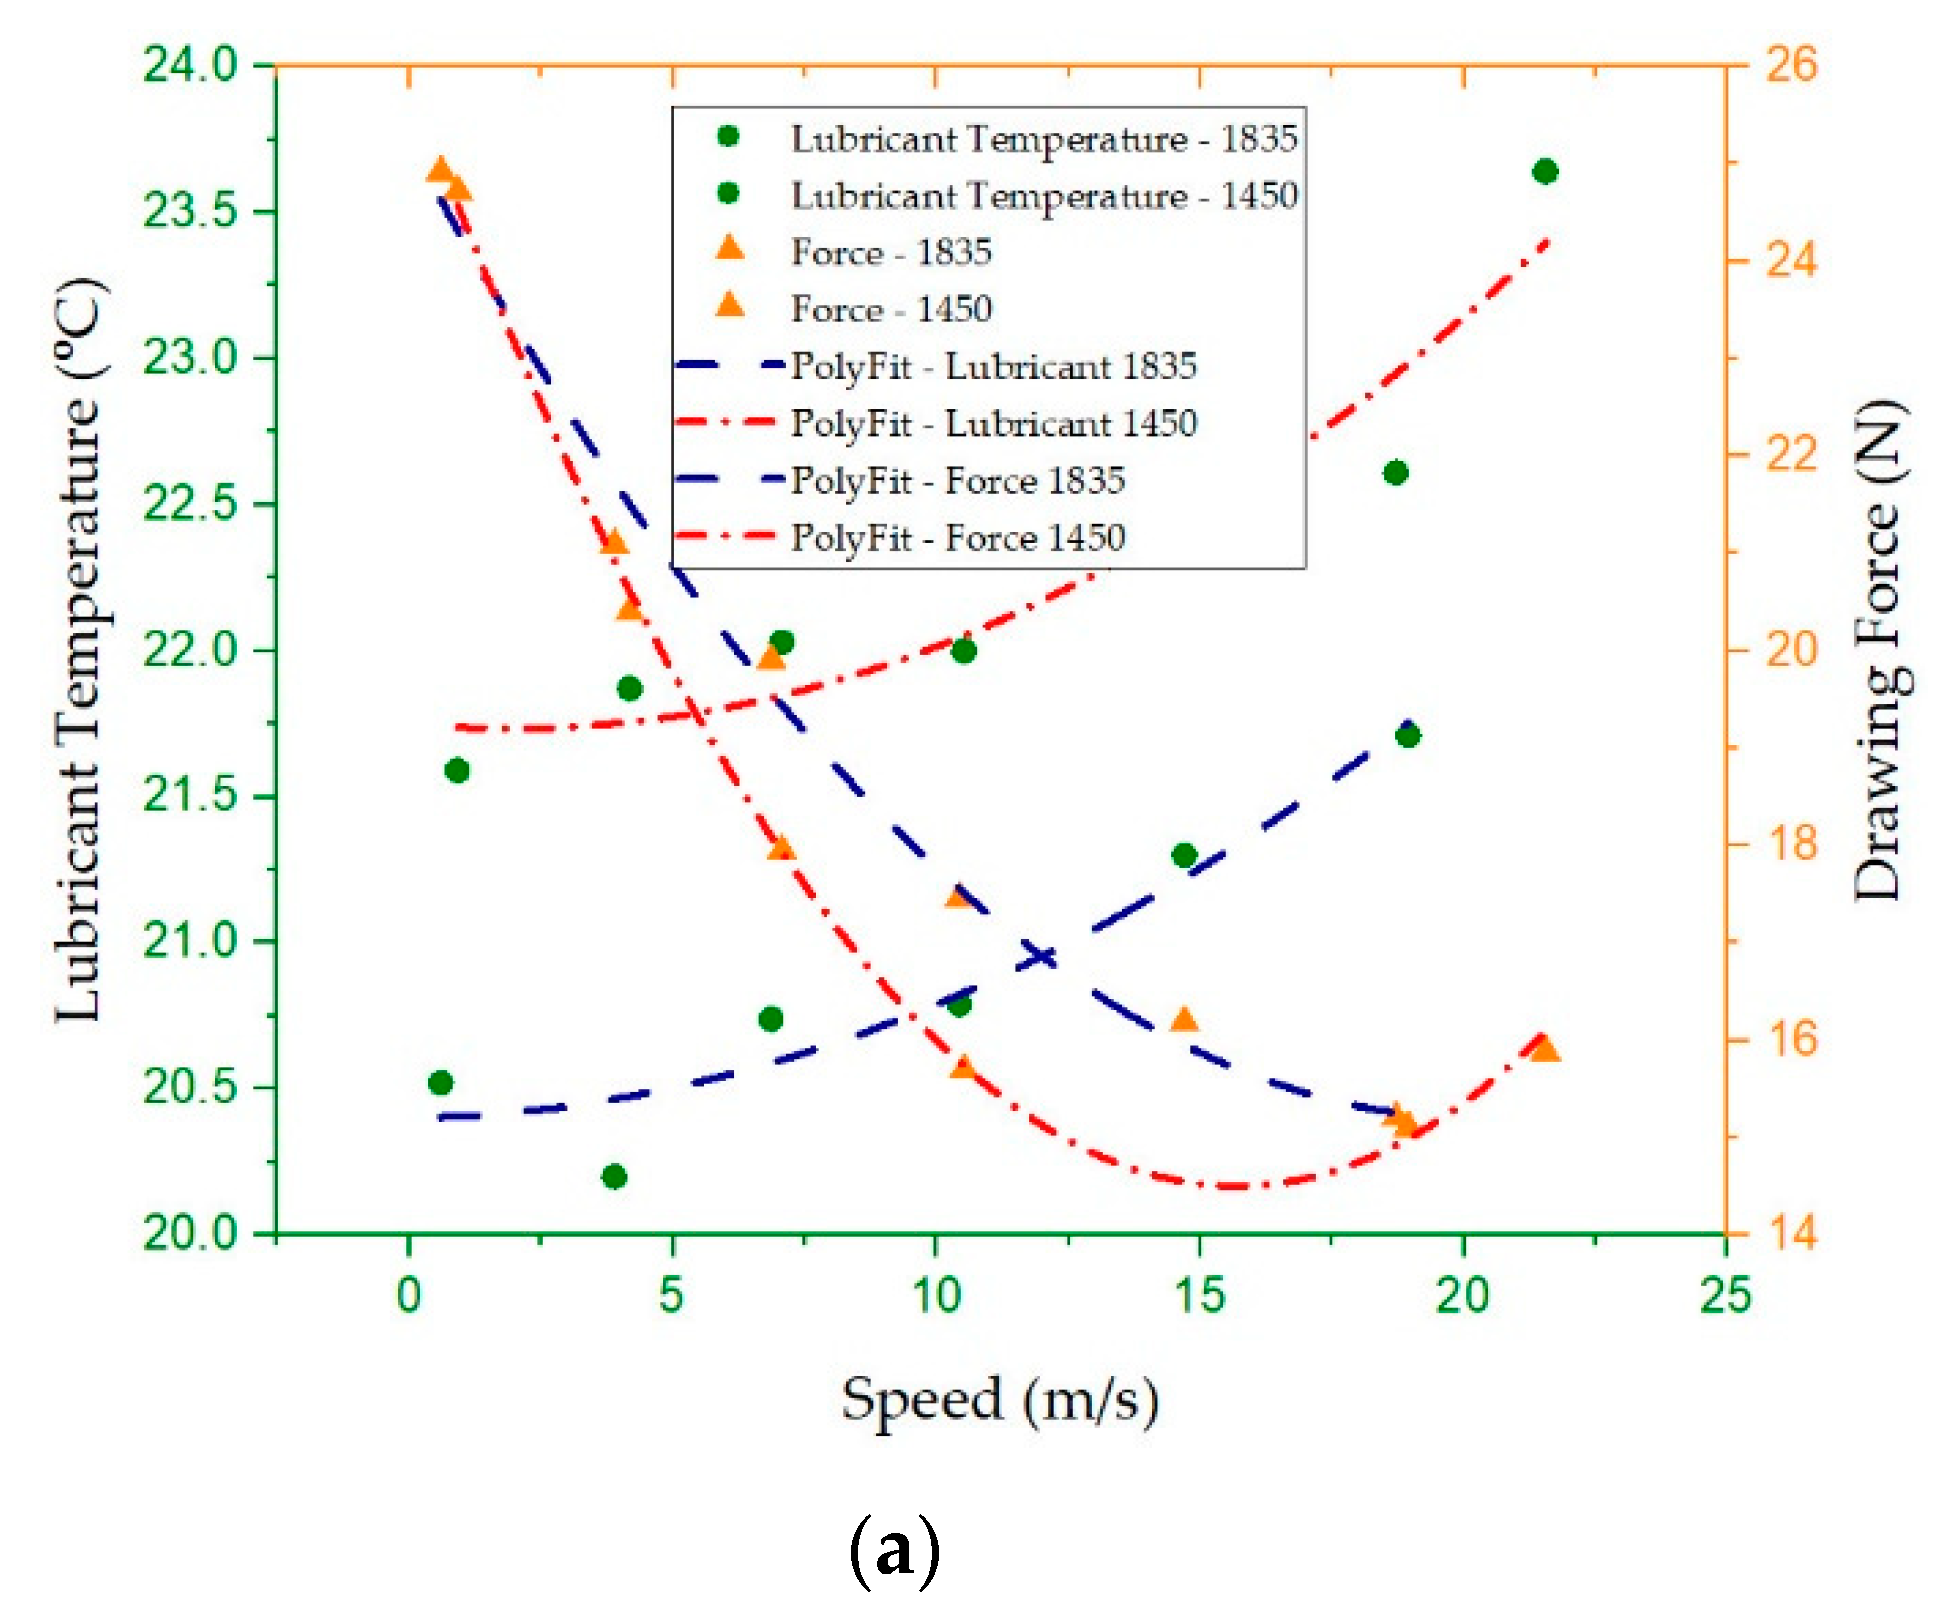
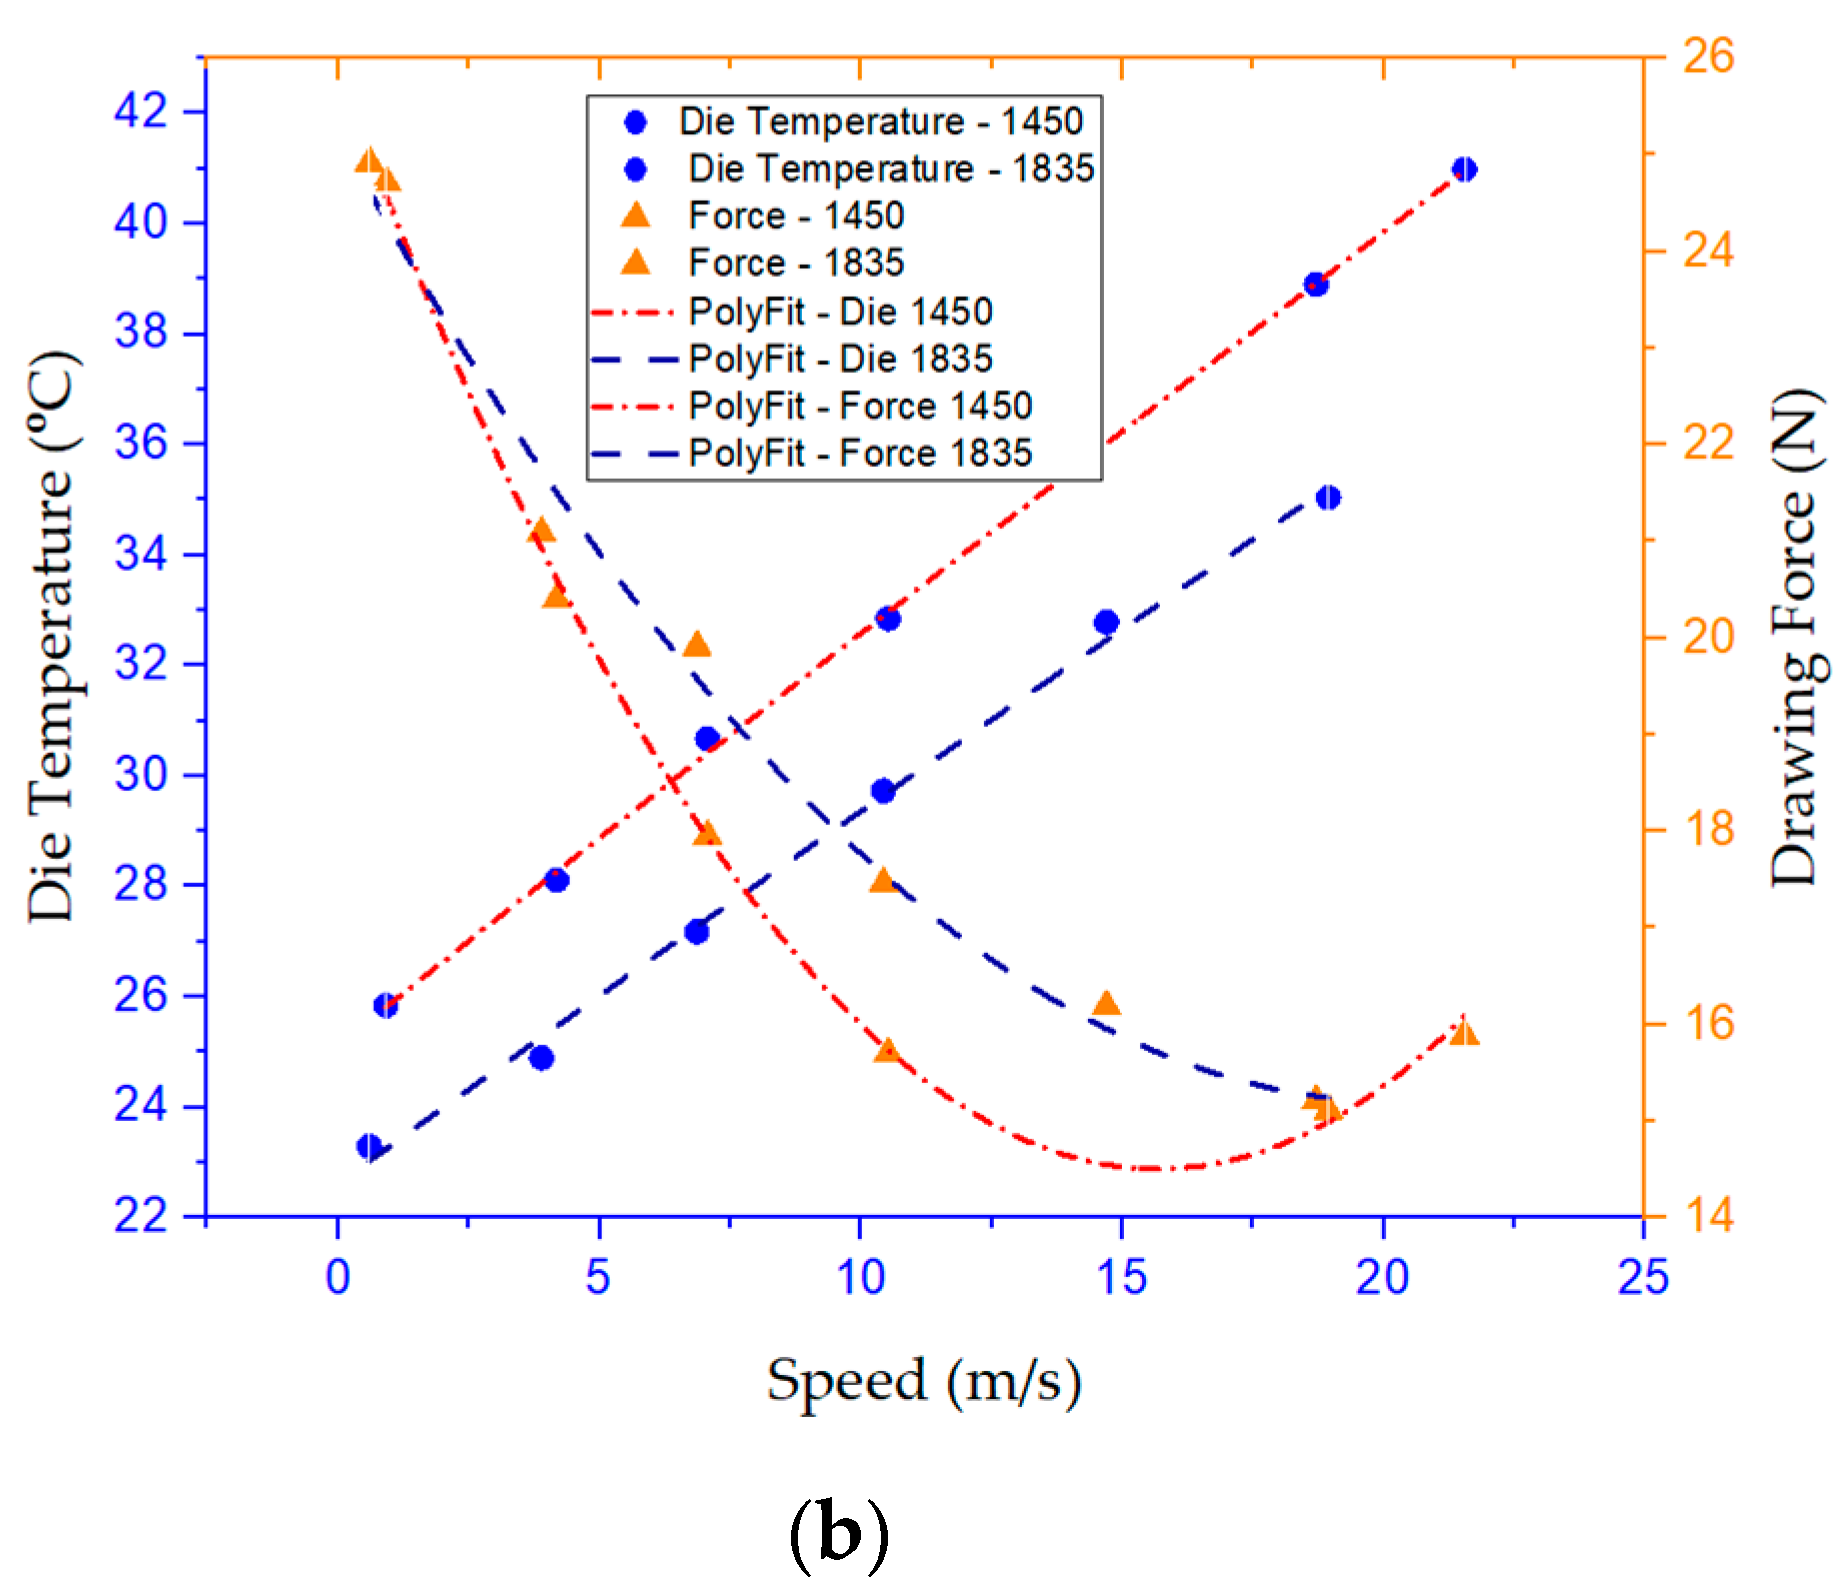
Figure 4 presents the measured temperatures as well as the drawing forces of the lubricant and die as functions of the drawing speed. Overall, it is found that the drawing force decreases, and the temperatures increases with increasing the drawing speed. The change rates of drawing force and temperature are rather substantial. It is noted that as the drawing speed increase, the thickness of the lubricant film at the wire/die interface also increases. As shown in Figure 4, for the die 1835, the quantity, as well as the associated maintenance time of the lubricant, is smaller. Therefore, the lubricant temperature is less significant. To be specific, the more substantial contact length (L = 0.43 mm) of the die 1450 explains, the higher temperature in comparison to the die 1835 (L = 0.32 mm). Also, the die temperature is higher than that of the lubricant due to its retention in the metallic die mount body.
Indeed, Chen and Huang [18] have shown that the die semi-angle, the friction coefficient, the length of the bearing part of the die, and the temperature have a significant impact on the drawing process. Recent developments have proven that changes in lubricants’ chemical composition and rheology could also substantially improve the die life. The above results are in accordance with the works of Haddi [2] and Suliga [22] that investigate the temperature dependence of the process concerning the initial temperature of a material, die geometry, heat generation due to deformation, among others. It is worth noting that for the present study, as the measurements are carried out for steady states, heat dissipation is in balance with its generation.
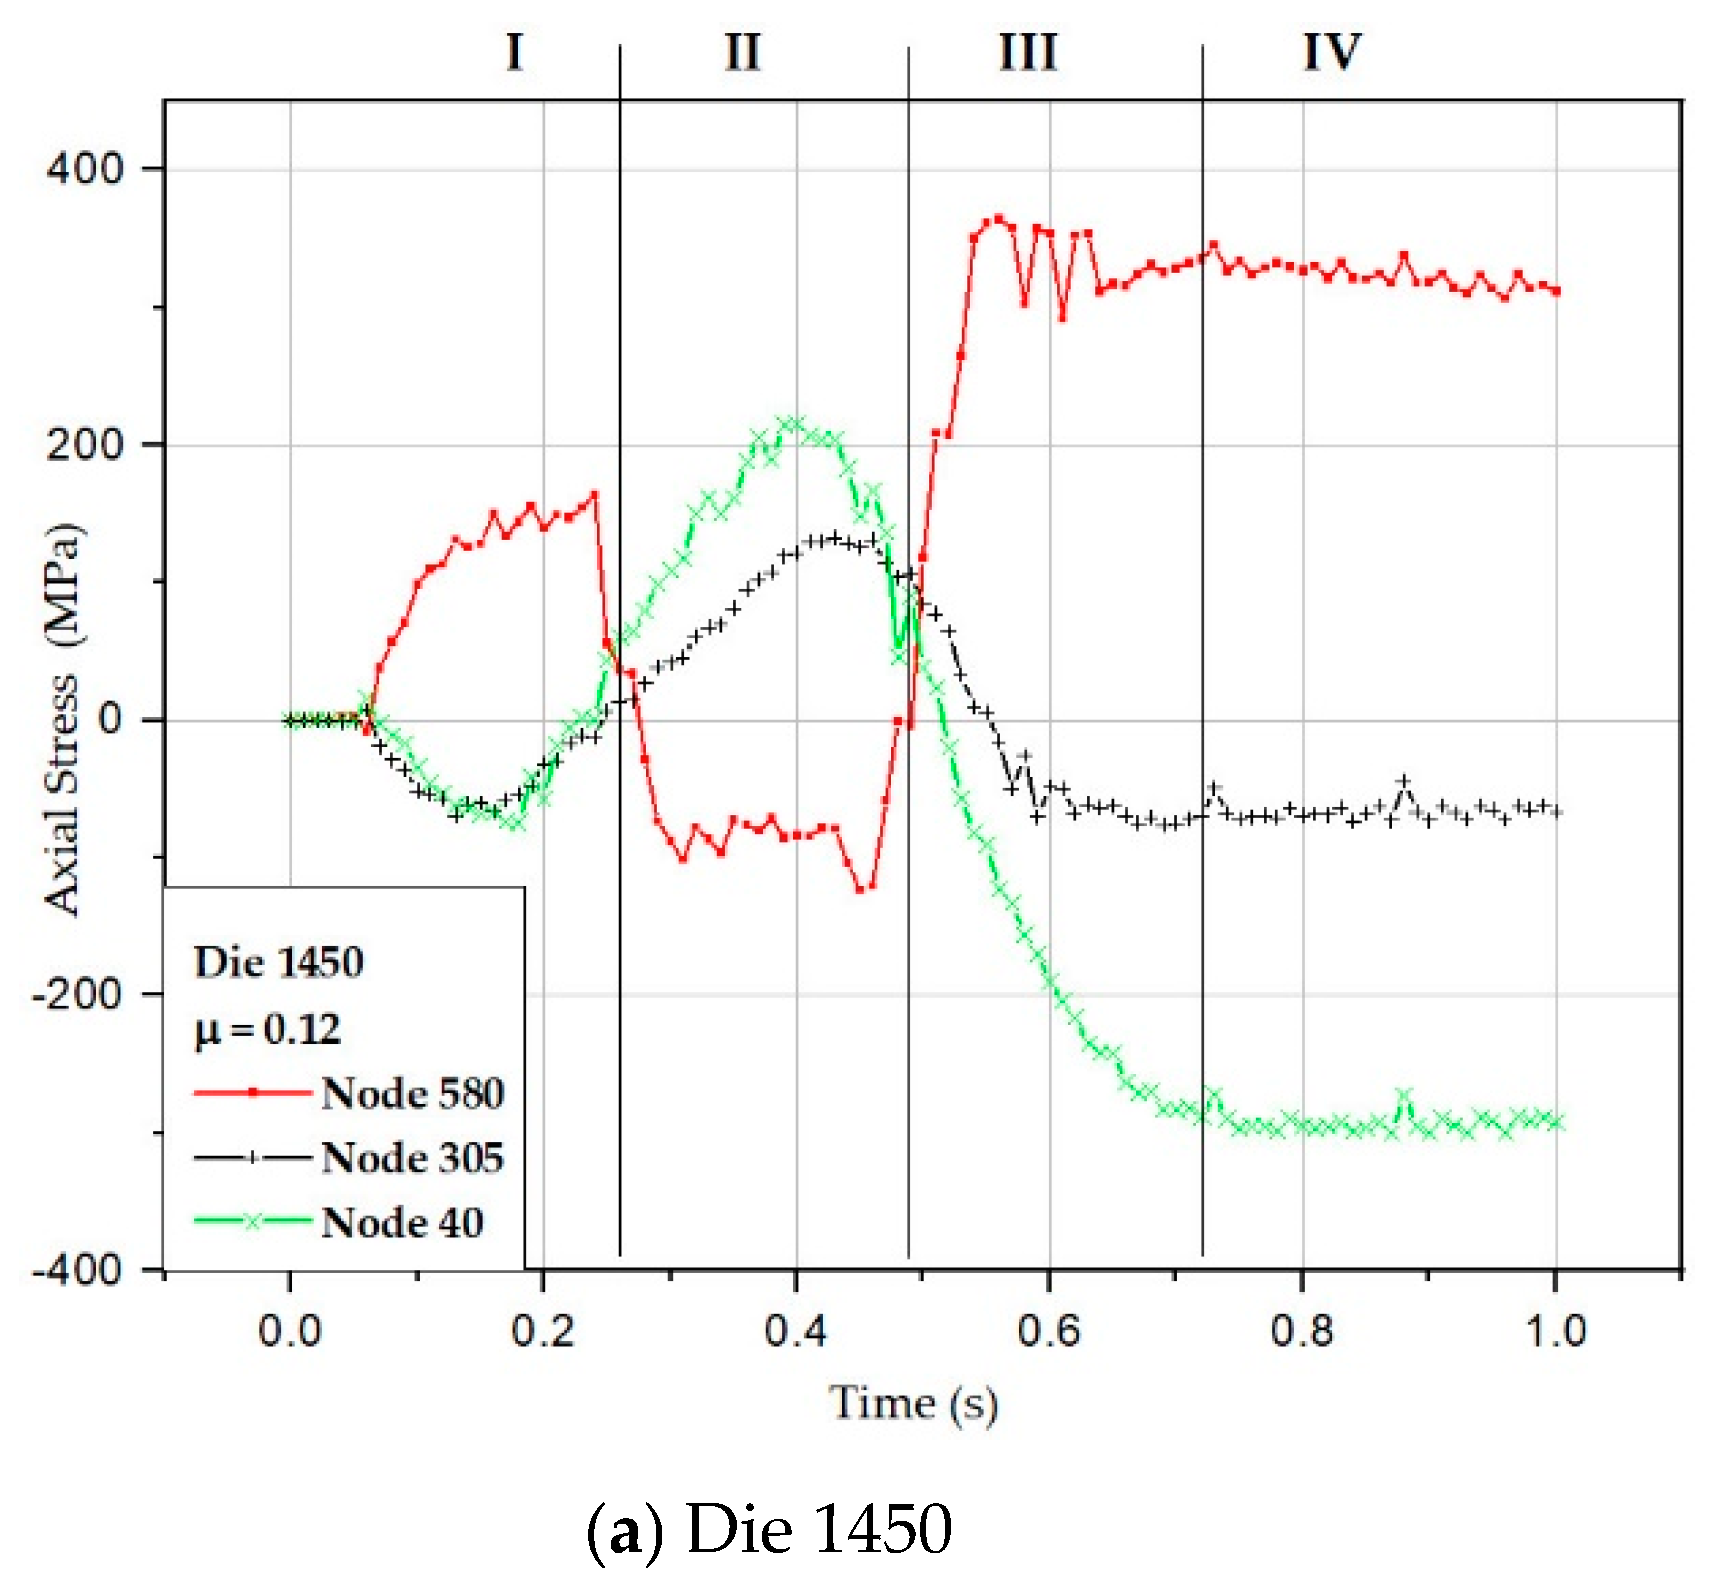
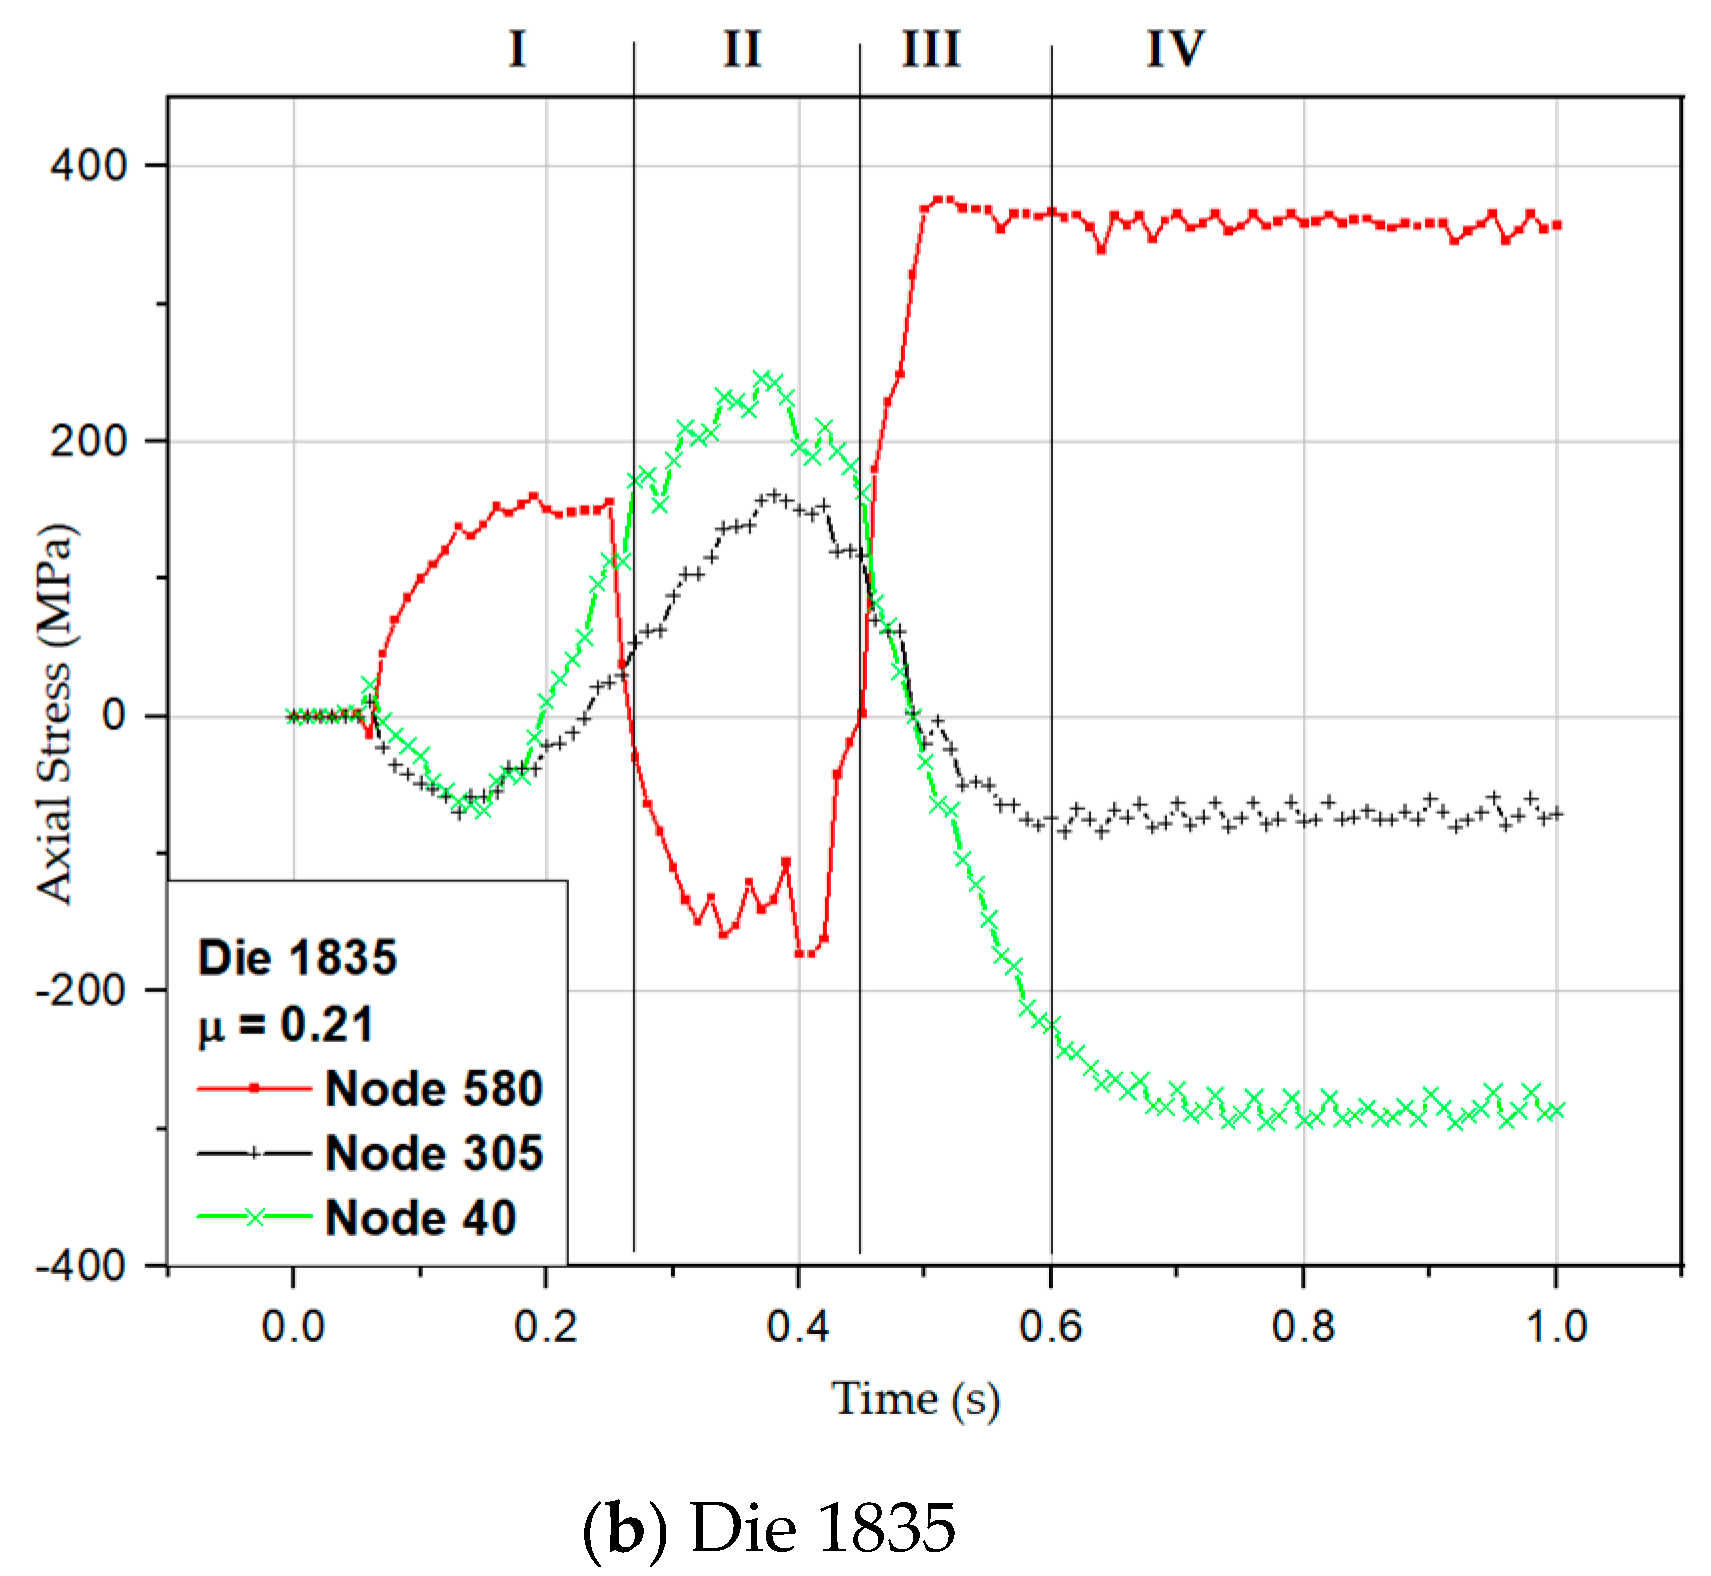
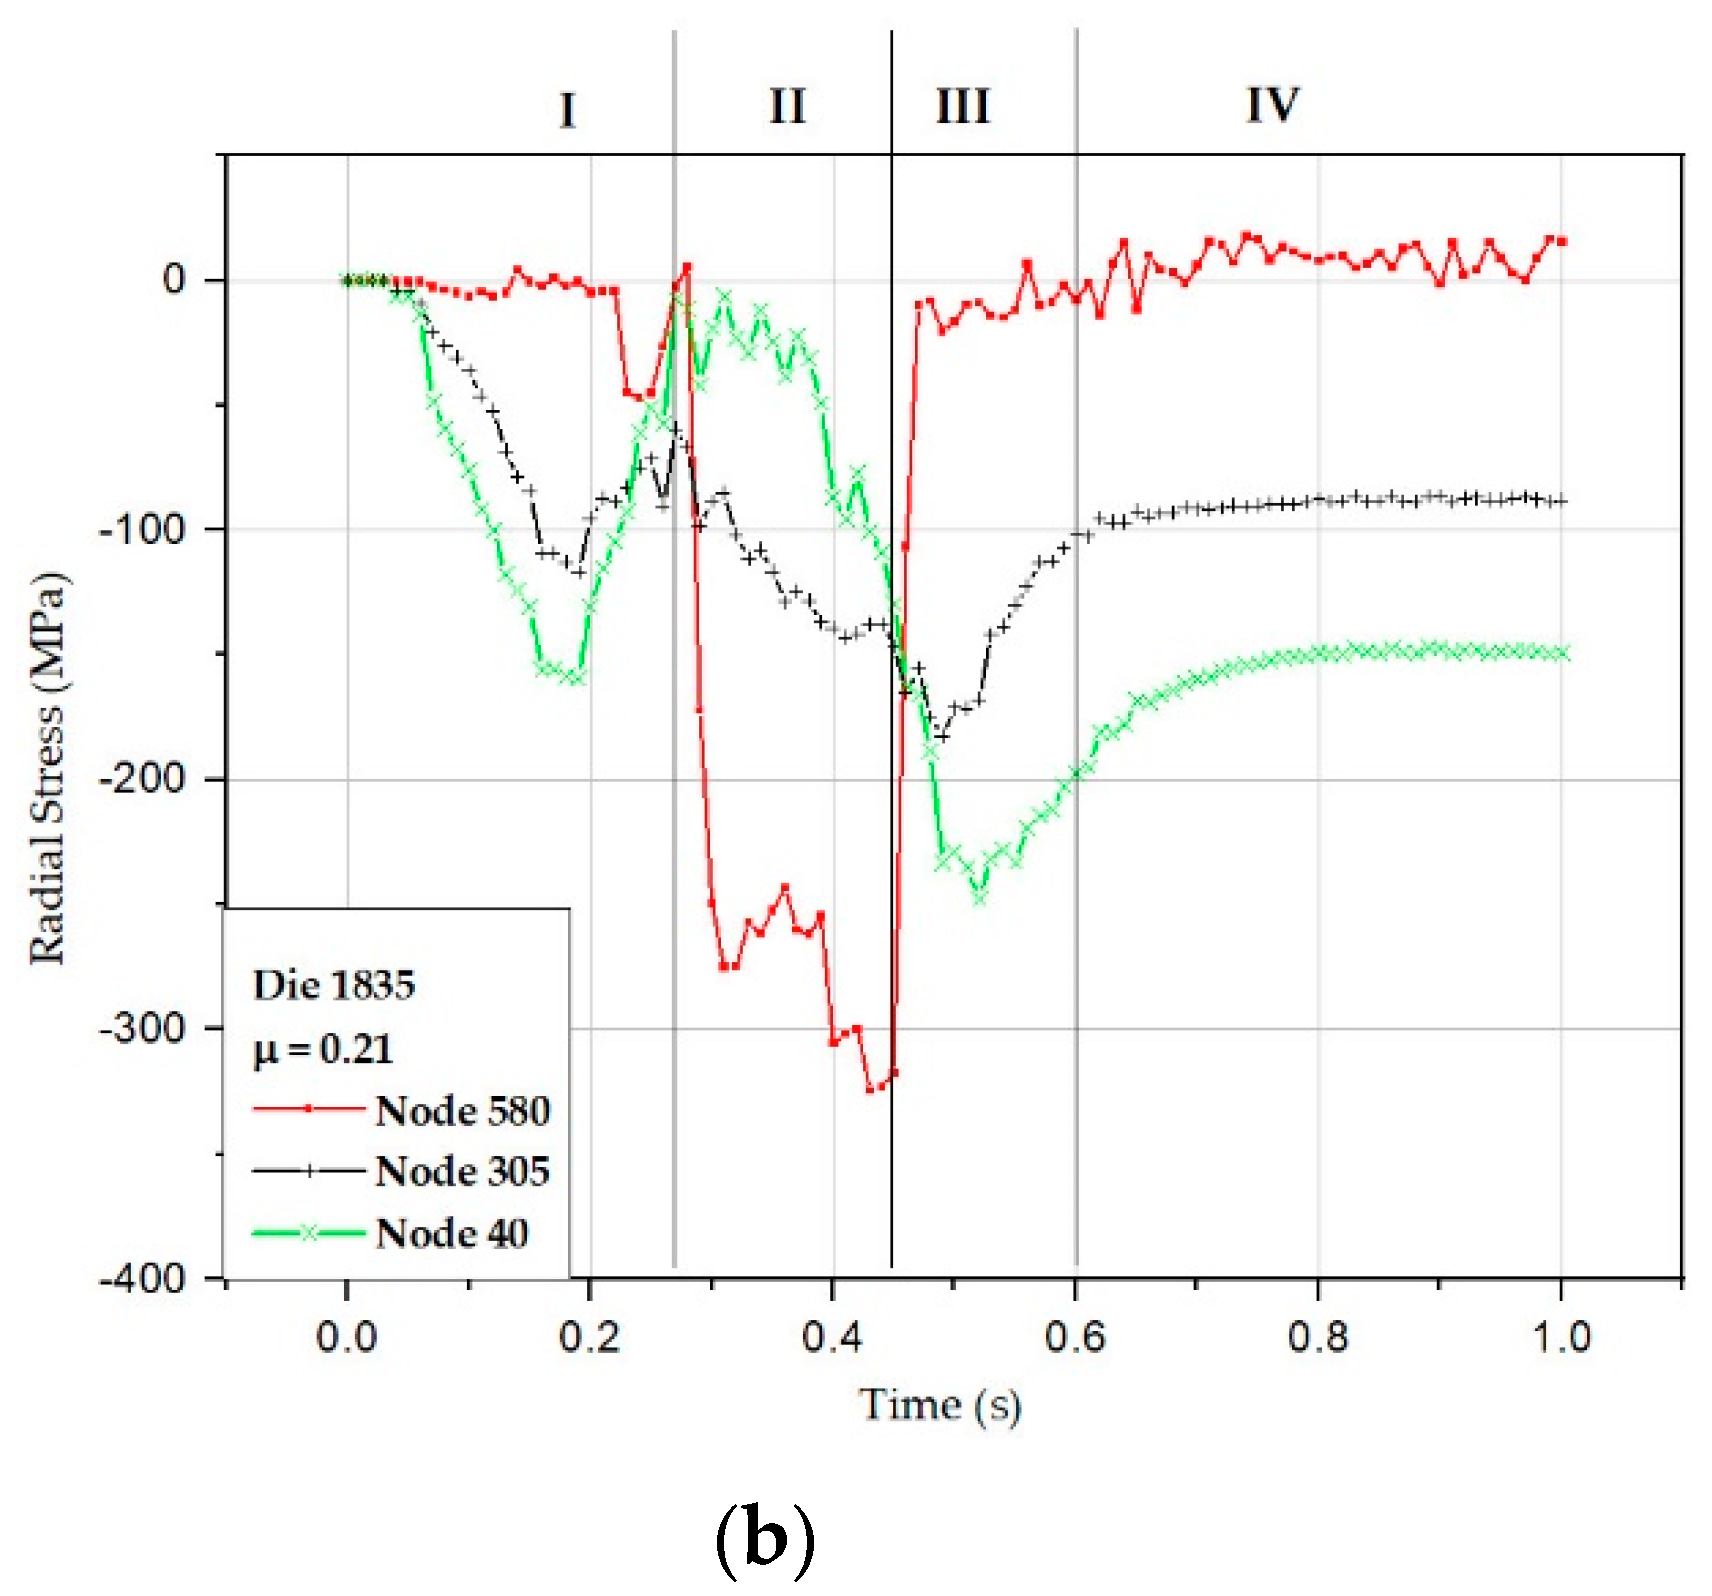
In order to further explore the effect of the die geometry on the process, numerical simulations are also performed with the minimal values of the fraction coefficients. To be specific, one assumes µ = 0.12 (15.19 m/s, 14.5 N) for the die 1450 and µ = 0.21 (17.03 m/s, 15.17 N) for the die 1835. These values correspond to the minimal tool wear at the optimized drawing speed, as discussed above regarding Figure 3. The calculations are carried out for the axial and radial stresses, as functions of time, for three distinct positions of the wire. As shown in Figure 1, nodes 580, 305, and 40 are studied, which correspond to the surface, intermediate, and centre regions. The results are presented in Figure 5 and Figure 6.
It can be observed that in the reduction zone (region II), the surface stress of the wire, represented by node 580, is compression. This is due to the pressure exerted by the die on the wire. On the other hand, the stress in the centre and interior of the wire, shown by nodes 305 and 40 respectively, are traction. This is likely due to the resistance exerted by the surface to the passive movement of the wire. The stress found in the bearing zone (region III) is also traction, as indicated by node 580. This is understood as due to the wire friction with the die. The compression in the nodes 305 and 40 of wire is caused by targeting of the flow of material squeezed by the die angle toward the centre of the wire. Further, increasing the die angle results in an increase of stress in region II. This is due to the larger redundant work, related to more significant tool wear, in the wire deformation in addition to a remarkable change of the stress in region III.
Figure 6 shows the results of radial stress. It is interesting to note that in region II, the most significant compression stress is observed on the surface of the wire, represented by node 580. In region III, the largest compression stress is located in internal regions of the wire, shown by nodes 305 and 40. This is due to the direction of flow toward the central region of the wire caused by the die angle. The change of bearing zone length in the region III leads to the variations of both surface and centre stresses, indicated by the nodes 580 and 40 respectively.
Vega et al. [34], Martínez et al. [35], and other authors [2,22,24] have shown that the die angle, friction coefficient, and bearing zone length significantly affect the stress during the drawing process. We note that the above findings are consistent with previous studies.

4. Conclusions

The effects of the drawing speed, drawing force, die temperature, lubricant temperature, and tension distribution on the wire drawing have been analyzed and discussed.
The reduction of the friction coefficient, as the wire drawing speed increases, causes a more substantial drag of the lubricant from the contact zone, associated with the effect of the wedge formed at the wire/die interface. The temperature of the process depends on the initial temperature of the material, die geometry, type of lubricant, and heat generated by the deformation of the material. Due to the flow of the material toward the central axis of the die, axial stresses on the outer zone of the wire changes from compression to tensile. This is caused by the external extraction force applied by the drawing capstan while the wire is under compression in the reduction zone. Tensile stresses on the wire surface attain larger values when the length of contact is smaller; this produces heterogeneity in the deformation process. Intuitively, it is related to the more significant spatial gradient of internal stress. Compressive stresses on the surface and at the centre of the wire are larger for dies with larger die angles. On the other hand, dies with a smaller die angle show a more homogenous flow as regard as to the distribution of radial stresses. The results obtained can be used to select the process parameters, which satisfy the conditions of maximum energy saving with a significant improvement of lubrication conditions and product quality.

Author Contributions

G.A.S.M. was developed the general conceptualization and experimental approach; W.-L.Q. and U.P. performed the interpretation of the results; L.K.K. did the simulations with the finite element solver. All authors have read and agreed to the published version of the manuscript.

Funding

This research received no external funding

Conflicts of Interest

The authors declare no conflict of interest.

References

  1. Prisco, U. Strain hardening of carbon steel during wire drawing. Mater. Res. 2017, 21, 3. [Google Scholar] [CrossRef] [Green Version]
  2. Haddi, A.; Imad, A.; Vega, G. Analysis of temperature and speed effects on the drawing stress for improving the wire drawing process. Mater. Des. 2011, 32, 4310–4315. [Google Scholar] [CrossRef]
  3. Wilson, W.R.D. Friction and lubrication in bulk metal—forming processes. J. Appl. Metalwork. 1979, 1, 7–9. [Google Scholar] [CrossRef]
  4. Yust, C.S. Tribology and wear. Int. Met. Rev. 1985, 30, 141–154. [Google Scholar] [CrossRef]
  5. Czichos, H. Design of friction and wear experiments. Tribol. Int. 1992, 18, 476–479. [Google Scholar]
  6. Shemenski, R.M. Wiredrawing by computer simulation. Wire J. Int. 1999, 32, 166–183. [Google Scholar]
  7. Wright, R.N. Secondary recrystallization in heavily drawn ETP copper wire. Metall. Trans. A 1976, 7, 1891–1896. [Google Scholar] [CrossRef]
  8. Snidle, R.W. Contribution on the theory of frictional heating and the distribution of temperature in wire and strip drawing. Wear 1977, 44, 279–294. [Google Scholar] [CrossRef]
  9. Flanders, N.A.; Alexander, E.M. Analysis of wire temperature and power requirements on multipass drawing productivity. Wire J. 1979, 29, 60–69. [Google Scholar]
  10. Lucca, D.A.; Wright, R.N. Heating effect in the drawing of wire and strip under hydrodynamic lubrication conditions. J. Manuf. Sci. Eng. 1996, 118, 628–638. [Google Scholar] [CrossRef]
  11. El-Domiaty, A.; Kassab, S.Z. Temperature rise in wiredrawing. J. Mater. Process. Technol. 1998, 83, 72–83. [Google Scholar] [CrossRef]
  12. Jost, H.P. Tribology, origin and future. Wear 1990, 36, 1–17. [Google Scholar] [CrossRef]
  13. Wistreich, J.G. The fundamentals of wire drawing. Metall. Rev. 1958, 3, 97–142. [Google Scholar]
  14. Hollinger, S.; Depraetere, E.; Giroux, O. Wear mechanism of tungsten carbide dies during wet drawing of steel tyre cords. Wear 2003, 255, 1291–1299. [Google Scholar] [CrossRef]
  15. Suliga, M. The influence of drawing speed on surface topography of high carbon steel wires. Metalurgija 2017, 56, 182–184. [Google Scholar]
  16. Luis, C.J.; Leon, J.; Luri, R. Comparison between finite element method and analytical methods for studying wire drawing processes. J. Mater. Process. Technol. 2005, 164, 1218–1225. [Google Scholar] [CrossRef]
  17. Celentanoa, D.J.; Palacios, M.A.; Rojas, E.L.; Cruchaga, M.A.; Artigas, A.A.; Monsalve, A.E. Simulation and experimental validation of multiple step wiredrawing processes. Finite Elem. Anal. Des. 2009, 45, 163–180. [Google Scholar] [CrossRef]
  18. Chen, D.C.; Huang, J.Y. Design of brass alloy drawing process using Taguchi method. Mater. Sci. Eng. 2007, 464, 135–140. [Google Scholar] [CrossRef]
  19. Majzoobi, G.H.; Fereshteh, S.F.; Aghili, A. An investigation into the effect of redundant shear deformation in bar drawing. J. Mater. Process. Technol. 2008, 201, 133–137. [Google Scholar] [CrossRef]
  20. Heng-Sheng, L.; Yuan-Chuan, H.; Chia-Chow, K. Inhomogeneous deformation and residual stress in skin-pass axisymmetric drawing. J. Mater. Process. Technol. 2008, 201, 128–132. [Google Scholar]
  21. Vega, G.; Haddi, A.; Imad, A. Investigation of process parameters effect on the copper-wire drawing. Mater. Des. 2009, 30, 3308–3312. [Google Scholar] [CrossRef]
  22. Suliga, M.; Wartacz, R.; Michalczyk, J. The influence of the angle of the working part of the die on the high speed drawing process of low carbon steel wires. Arch. Metall. Mater. 2017, 62, 483–487. [Google Scholar] [CrossRef] [Green Version]
  23. Backofen, W.A. Deformation Processing; Addison-Wesley Reading: Boston, MA, USA, 1972. [Google Scholar]
  24. Nowotynska, I.; Kut, S. The Influence of die shape Back Tension force on its wear in the process of wire drawing. Arch. Metall. Mater. 2019, 3, 1131–1137. [Google Scholar]
  25. Avitzur, B. Handbook of Metal Forming; John Wiley and Sons: New York, NY, USA, 1983. [Google Scholar]
  26. Bitkov, V.V. Minimization of breaks during drawing thin wire of nonferrous metals. Russ. J. Non-Ferrous Met. 2010, 51, 134. [Google Scholar] [CrossRef]
  27. Godfrey, H.J. The benefits of using wiredrawing dies with smaller included angles and longer nibs. Wire J. Int. 2000, 33, 102–113. [Google Scholar]
  28. Kesavulu, P.; Ravindrareddy, G. Analysis and optimization of wire drawing process. Int. J. Eng. Res. Technol. 2014, 3, 635–638. [Google Scholar]
  29. Wright, R.N. Physical conditions in the lubricant layer. Wire J. Int. 1997, 30, 88–92. [Google Scholar]
  30. Christopherson, D.G.; Naylor, H. Promotion of fluid lubrication in wire drawing. Proc. Inst. Mech. Eng. 1955, 169, 643–653. [Google Scholar] [CrossRef]
  31. Cheng, H.S. Lubrication Regimes. In ASM Handbook Vol.18, Friction, Lubrication, and Wear Technology; ASM International: West Conshohocken, PA, USA, 1992; pp. 89–97. [Google Scholar]
  32. Dixit, U.S.; Dixit, P.M. An analysis of the steady-state wiredrawing of strain-hardening materials. J. Mater. Process. Technol. 1995, 47, 201–229. [Google Scholar] [CrossRef]
  33. Tintelecan, M.; Sas-Boca, I.M.; Ilutiu-Varvara, D.A. The influence of the dies geometry on the drawing forcefor steel wires. Procedia Eng. 2017, 181, 193–199. [Google Scholar] [CrossRef]
  34. Vega, G.; Haddi, A.; Imad, A. Temperature effects on wiredrawing process: Experimental investigation. Int. J. Mater. Form. 2009, 2, 229–231. [Google Scholar] [CrossRef]
  35. Martínez, G.A.S.; Santos, E.F.; Kabayama, L.K.; Guidi, E.S.; Silva, F.A. Influences of different die bearing geometries on the wire-drawing process. Metals 2019, 9, 1089. [Google Scholar]
Figure 1. (left): A scheme of the adopted single block wire drawing process: 1: Mobile triboelement—Wire, 2: Stationary triboelement—Die, 3: Interface triboelement—Lubricant, 4: Middle triboelement: Atmosphere, I: Entrance zone, II: Reduction zone (die angle equal to 2β), III: Hc-Bearing zone (with a die length of Hc), IV: Exit zone, T sensor: the location of the thermocouple, L: contact length, node 580—on the surface of wire, node 305—intermediate region, node 40—center of the wire, β is the semi-angle reduction, σxf the wiredrawing stress, while ri and rf indicate the initial and final radii of the wire, respectively. (right): A snapshot of the experimental setup.
Metals 10 00105 g001
Figure 2. The coefficient of friction as a function of the drawing speed for different die geometries in terms of bearing zones and die angles.
Metals 10 00105 g002aMetals 10 00105 g002b
Figure 3. The friction coefficient as a function of the drawing speed for the dies 1450 and 1835. The different regimes of lubrication are separated by horizontal lines.
Metals 10 00105 g003
Figure 4. Temperatures of lubricant (a) and die (b) and drawing force as functions of drawing speed for the dies 1450 and 1835.
Metals 10 00105 g004aMetals 10 00105 g004b
Figure 5. Axial stress as a function of time for the three nodes 580, 305, and 40. The calculations are carried out for the dies 1450 (a), and 1835 (b).
Metals 10 00105 g005aMetals 10 00105 g005b
Figure 6. Radial stress as a function of time for the three nodes 580, 305, and 40. The calculations are carried out for the dies 1450 (a) and 1835 (b).
Metals 10 00105 g006aMetals 10 00105 g006b
Table 1. Mechanic properties of the 0.5 mm Cu-ETP wire.
σr (MPa)σe,0.2% (MPa)E (GPa)n
342.8138.81120.34
Table 2. The effect of temperature on the dynamic viscosity of the used mineral lubricant.
Temperature (°C)Dynamic Viscosity (Pa·s)
250.0077
500.0043
700.0040
Table 3. Internal geometry parameters of the polycrystal diamond (PCD) dies.
Die2β (°)Hc (%Df)L (mm)ΔΦ
142014200.292.321.33
143514350.36
145014500.43
182018200.252.981.48
183518350.32
185018500.38

