Abstract
The purpose of this study was to compare the throwing kinematics and kinetics of youth catchers and pitchers. It was hypothesized that catchers and pitchers would exhibit differences throughout the throwing motion. Descriptive statistics were used to investigate kinematics during the four events of throwing: foot contact (FC), maximum shoulder external rotation (MER), ball release (BR) and maximum shoulder internal rotation (MIR). Additionally, kinetics were investigated within phases of the events: Phase 1 (cocking; FC to MER), Phase 2 (acceleration; MER to BR) and Phase 3 (deceleration; BR to MIR). Results revealed significant difference in torso flexion, lateral flexion, pelvis lateral flexion and segment velocities between the catchers and pitchers. Based on data from the current study, it appears that the youth catchers execute their throw as they have been instructed. It is unclear if the throwing mechanics displayed by these youth are efficient for a catcher, thus further investigation is needed to determine long-term injury susceptibility.
1. Introduction
Biomechanical analysis of youth throwing continues to evolve and has taken on a new resurgence with the focus on injury prevention. To date, a majority of the available data dedicated to biomechanics of throwing has focused on youth pitchers [1,2,3,4]. However, there is another position that requires more throws than the pitcher, the catcher [5]. Additionally, the catcher often has to make all their throws coming up from a squatted position. The catcher not only throws the ball back to the pitcher after every non-hit pitch, but may also throw to any of the three bases as required by a variety of circumstances. Though a majority of the catcher’s throws may be submaximal, the throws to hold a runner on base are maximum effort.
The catcher’s effectiveness is based on his or her ability to catch the ball, quickly transfer the ball to their throwing hand and throw the ball to another positioned player to make a play. However, when a catcher is attempting to throw out a runner, they may be required to catch, transfer and throw in a rapidly unfolding play; those throws are not as common. Thus, as a catcher more frequently makes that throw to second base to prevent a runner from stealing, it has been speculated that the catcher’s throwing mechanics are altered because of the necessity to rush their throw, thus possibly contributing to long-term injury susceptibility [5,6,7].
2. Context
Recently, due to the increased awareness of injury in youth baseball, the position of catcher has gained interest. In 2011, Fleisig et al. published prospective injury data on youth baseball pitchers, and though not statistically significant, those athletes playing dual roles (catcher and pitcher) during the same game were of concern to the authors [2]. Additionally, it was thus recommended that youth who play the position of pitcher not concomitantly play the position of catcher. Thus, with the current recommendations for youth not to play dual positions, in addition to the limited data regarding the catcher’s throwing mechanics, it was the purpose of this study to not only examine the mechanics of catchers, but also to compare the throwing kinematics and kinetics of youth catchers and pitchers. It was hypothesized that catchers and pitchers would exhibit differences throughout the throwing motion.
3. Materials and Methods
3.1. Experimental Approach to the Problem
The goal of the experiment was to determine kinematic and kinetic differences in the throwing motion of youth baseball catchers and pitchers. Descriptive statistics were used to investigate kinematics during the four events of throwing: foot contact (FC), maximum shoulder external rotation (MER), ball release (BR) and maximum shoulder internal rotation (MIR). Ball release was estimated as the midpoint between maximum elbow flexion and maximum elbow extension. This estimate was required because we did not have the capability to track the movement of the ball. This method to estimate ball release has been used previously in the throwing literature using electromagnetic tracking, but has yet to be validated [4,5,8]. Additionally, kinetics were investigated within the phases of the events: Phase 1 (cocking; FC to MER), Phase 2 (acceleration; MER to BR) and Phase 3 (deceleration; BR to MIR). Kinetics were averaged within each phase. A mixed-factorial ANOVA was conducted to examine the differences between positions (catcher and pitchers) and throwing events.
3.2. Participants
A total of 50 youth baseball catchers (N = 25; 12.0 ± 2.2 years; 150.3 ± 11.7 cm; 44.9 ± 11.7 kg) and pitchers (N = 25; 11.0 ± 1.3 years; 153.0 ± 8.5 cm; 47.2 ± 8.9 kg) participated. The inclusion criterion was freedom from injury within the past six months; however, none of the participants reported they had ever suffered an injury that prevented them from throwing. Participants were tested during the fall baseball season and had not performed any throwing 24 h prior to arrival into the lab on the day of testing. The Institutional Review Board of the University approved all testing protocols. Prior to data collection, all testing procedures were explained to each participant, as well as to parent(s)/legal guardian(s), and informed consent and participant assent were obtained.
3.3. Procedures
Participants reported to the laboratory on a day that they had abstained from physical activity, as well as any type of throwing. Upon arrival, participants were instructed on the testing protocol. Catchers, dressed in full gear (helmet, chest protector and shin guards), were instructed to catch a pitched ball and throw with maximum effort to a position player on second base at regulation distance (84.85 feet, 25.86 m) as they would if throwing out a runner trying to steal second. The catchers were instructed to catch and throw as quick as possible at maximum effort. Catchers were to throw three maximum effort throws, with the fastest throw being selected for analysis. The pitchers were instructed to throw maximum effort four-seam fastballs, from a regulation mound, for a strike to a catcher regulation distance (46 feet, 14.02 m). The fastest of the three four-seam fastballs for strikes was selected for analysis. The throwing surface was constructed so that the participant’s stride would land on top of the 40 cm × 60 cm Bertec force plate (Bertec Corp, Columbus, OH, USA) that was anchored into the floor. Following instruction, participants were given an unlimited time to perform their own specified pre-competition warm-up. Average warm-up time was ten minutes. A JUGS radar gun (OpticsPlanet, Inc., Northbrook, IL, USA) positioned in the direction of the throw determined ball speed.
Kinematic data were collected with The MotionMonitor™ (Innovative Sports Training, Chicago, IL, USA) synched with an electromagnetic tracking system (Flock of Birds Ascension Technologies Inc., Burlington, VT, USA). The Flock of Birds Ascension system has been validated for tracking humeral movements, producing trial-by-trial interclass correlation coefficients for axial humerus rotation in both loaded and non-loaded conditions in excess of 0.96 [9]. The field distortion has been shown to be the cause of error in excess of 5° at a distance of 2 m from an extended range transmitter [10], but increases in instrumental sensitivity have reduced this error to near 10° prior to system calibration and 2° following system calibration [11,12]. Previously-established techniques were used to calibrate the system prior to data collection [10,11,12]. Following calibration, pilot data collected prior to testing indicated that the magnitude of error in determining the position and orientation of the electromagnetic sensors within the calibrated world axes system was less than 0.01 m and 3°, respectively.
Electromagnetic sensors were affixed to the participant’s skin using PowerFlex cohesive tape (Andover Healthcare, Inc., Salisbury, MA, USA) to ensure that the sensors remained secure throughout testing. Sensors were attached to the following locations: (1) the posterior/medial aspect of the torso at C7; (2) posterior/medial aspect of the pelvis at S1; (3–4) bilateral distal/posterior aspect of the upper arm; (5) the flat, broad portion of the acromion of the scapula; (6–7) bilateral distal/posterior aspect of the forearm; (8–9) bilateral distal/posterior aspect of the lower leg; and (10–11) bilateral distal/posterior aspect of the upper leg [4,13,14,15,16]. A twelfth sensor was attached to a stylus that was used for digitization of the bony landmarks described by the International Shoulder Group of the International Society of Biomechanics [17]. Two points described the longitudinal axis of the segment, and a third point described the plane. Participants stood in anatomical position during digitization to guarantee accurate bony landmark identification. The digitization of the bony landmarks allowed transformation of the sensor data from the global coordinate system to the anatomically-based local coordinate system (Table 1).

Table 1.
Description of bony landmarks palpated and digitized.
| Bony Landmark | Bony Process Palpated and Digitized |
|---|---|
| Thorax | |
| Seventh Cervical Vertebra (C7) | Most dorsal aspect of the spinous process |
| Eighth Thoracic Vertebra (T8) | Most dorsal aspect of the spinous process |
| Suprasternal Notch | Most cranial aspect of sternum |
| Humerus | |
| Medial Epicondyle | Medial/distal aspect of condyle |
| Lateral Epicondyle | Lateral/distal aspect of condyle |
| Glenohumeral Joint Center of Rotation | Rotation method * |
| Forearm | |
| Radial Styloid Process | Lateral/distal aspect of radial styloid |
| Ulnar Styloid Process | Medial/ distal aspect of ulnar styloid |
* The center of glenohumeral rotation was not digitized. The rotation method estimated joint center using the least squares algorithm for the point moving the least during a series of short rotational movements.
Data describing the position and orientation of electromagnetic sensors were collected at 100 Hz. Raw data were independently filtered along each global axis using a 4th order Butterworth filter with a cutoff frequency of 13.4 Hz [4,15]. Neutral stance was the Y-axis in the vertical direction; horizontal and to the right of Y was the X-axis; and posterior was the X-axis [16].
Euler angle decompositions were used to determine humeral and scapular orientation with respect to the thorax. Humeral orientation was determined as rotation about the Y-axis of the humerus (plane of elevation), rotation about the Z-axis (elevation) and rotation about the y-axis (axial rotation) (Table 2). Rotations were based on the recommendations of the International Shoulder Group [17]. Elbow and shoulder kinetics were computed using a linked chain “bottom-up” model as previously described [18]. Force and moment data are normalized by dividing joint forces and moments by the participant’s body weight (mass * gravity).
Table 2.
Angle orientation decomposition sequences.
| Segment | Axis of Rotation | Angle |
|---|---|---|
| Torso | ||
| Rotation 1 | Z | Flexion (−)/Extension (+) |
| Rotation 2 | X′ | Left Lateral Tilt (−)/Right Lateral Tilt (+) |
| Rotation 3 | Y″ | Right Rotation (+)/Left Rotation (−) |
| Shoulder | ||
| Rotation 1 | Y | Plane of Elevation (0 = Abduction; 90 = Flexion) |
| Rotation 2 | X′ | Elevation |
| Rotation 3 | Y″ | Internal Rotation (+)/External Rotation (−) |
| Elbow | ||
| Rotation 1 | Z | Flexion (+)/Hyperextension (−) |
| Rotation 2 | X′ | Carrying Angle |
| Rotation 3 | Y″ | Pronation (+)/Supination (−) |
Prime (′) and double prime (″) notations represent previously-rotated axes due to the rotation of the local coordinate system resulting in all axes within that system being rotated. Rotation about the X-axis also results in rotation of both Y- and Z-axes, resulting in a new system of X′, Y′, Z′. Subsequent rotations are then about those axes.
3.4. Statistical Analysis
Statistical analyses were conducted using IBM SPSS Statistics 22. All kinematic variables were analyzed using a mixed-factorial ANOVA that included event (FC, MER, BR, MIR) as a within-subject factor and position (pitcher versus catcher) as a between-subject factor. The analysis of velocity included an additional within-subject factor of segment (hip, torso, humerus or forearm), and the analysis of knee flexion included an additional within-subject factor of side (left versus right).
The kinetic variables of the Y-axis force and Z-axis moments were analyzed using a mixed-factorial ANOVA that included phase (Phase 1, Phase 2, Phase 3) and joint (shoulder versus elbow) as within-subject factors and position (pitcher versus catcher) as a between-subject factor.
Mauchly’s test of sphericity was conducted prior to all analyses, and a Greenhouse–Geisser correction was imposed when sphericity was violated. Quantile-quantile plots were constructed at each event/phase for each dependent variable to ensure that data at all time-points were approximately normally distributed. As phase × position interactions were largely exploratory, rather than multiple post hoc tests, we have presented 95% confidence intervals for each position at each time point in the figures [19].
4. Results
4.1. Analysis of Kinematic Measures
The results for the kinematic variables of catchers and pitchers are supplied in Table 3. Results revealed a significant difference between catchers and pitchers averaging across the different events/phases (as a main effect, ME) for: torso flexion, torso lateral flexion, pelvic lateral flexion and segment velocity (Figure 1, Figure 2, Figure 3 and Figure 4, respectively). In addition, significant event by position interactions for torso flexion, pelvis lateral flexion and segmental velocity were also revealed. The meaning of the difference between catchers and pitchers changes over time and may only be statistically significant for a subset of the events. For velocity, there was also a significant main effect of segment, F(1.67,80.32) = 1851.0, p < 0.001, ε = 0.56, and a segment by phase interaction, F(3.47,166.68) = 385.4, p < 0.001, ε = 0.38, such that the change in velocity over time was dependent on the segment; see Figure 4a,b.
Table 3.
Summary of ANOVA results for kinematic variables. ME, main effect.
| Variable | ME of Event | ME of Position | Event × Position Interaction |
|---|---|---|---|
| Torso Flexion | F(1.28, 61.59) = 115.18, | F(1,48) = 19.51, | F(1.28, 61.59) = 13.08, |
| p < 0.01, ε = 0.43 | p < 0.01 | p < 0.01, ε = 0.43 | |
| Torso Lateral Flexion | F(1.36, 65.16) = 202.06, | F(1,48) = 14.90, | F(1.36, 65.16) = 0. 13, |
| p < 0.01, ε = 0.45 | p < 0.01 | p = 0.79, ε = 0.45 | |
| Torso Rotation | F(1.99, 95.56) = 1081, | F(1,48) = 0.38, | F(1.99, 95.56) = 2.55, |
| p < 0.01, ε = 0.66 | p = 0.54 | p = 0.08, ε = 0.66 | |
| Pelvic Lateral Flexion | F(1.33, 63.76) = 14.03, | F(1,48) = 6.61, | F(1.33, 63.76) = 3.86, |
| p < 0.01, ε = 0.44 | p = 0.01 | p = 0.04, ε = 0.44 | |
| Pelvic Rotation | F(1.65, 78.87) = 1060.08, | F(1,48) = 0.97, | F(1.65, 78.87) = 2.86, |
| p < 0.01, ε = 0.55 | p = 0.33 | p = 0.07, ε = 0.55 | |
| Elbow Flexion | F(1.38, 66.19) = 20. 83, | F(1,48) = 1.84, | F(1.38, 66.19) = 1.88, |
| p < 0.01, ε = 0.46 | p = 0.18 | p = 0.17, ε = 0.46 | |
| Plane of Elevation | F(2.01, 96.35) = 153.38, | F(1,48) = 0.77, | F(2.01, 96.35) = 0.02, |
| p < 0.01, ε = 0.67 | p = 0.38 | p = 0.97, ε = 0.67 | |
| Humeral Elevation | F(2.13, 102.08) = 13.83, | F(1,48) = 0.56, | F(2.13, 102.08) = 1.59, |
| p < 0.01, ε = 0.71 | p = 0.46 | p = 0.97, ε = 0.71 | |
| Humeral External Rotation | F(2.43, 116.64) = 476.33, | F(1,48) = 0.23, | F(2.43, 116.64) = 1.29, |
| p < 0.01, ε = 0.81 | p = 0.63 | p = 0.28, ε = 0.81 | |
| Velocity * | F(2.57, 123.43) = 273.04, | F(1,48) = 8.37, | F(2.57, 123.43) = 5.88, |
| p < 0.01, ε = 0.86 | p < 0.01 | p < 0.01, ε = 0.81 |
* Velocity included an additional factor of segment (hip, torso, humerus, forearm). See the main text for the main effects and interactions of these factors.
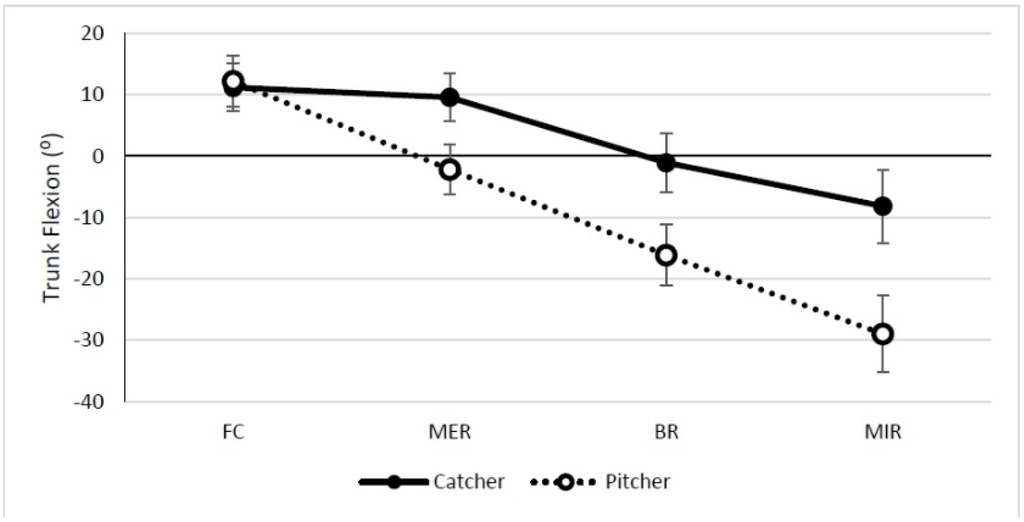
Figure 1.
Torso flexion. (+) = extension; (−) = flexion. Flexion expressed as torso relative to the world axis. FC, foot contact; MER, maximum shoulder external rotation; BR, ball release; MIR, maximum shoulder internal rotation.
Figure 1.
Torso flexion. (+) = extension; (−) = flexion. Flexion expressed as torso relative to the world axis. FC, foot contact; MER, maximum shoulder external rotation; BR, ball release; MIR, maximum shoulder internal rotation.


Figure 2.
Torso lateral flexion. (+) = toward throwing arm side; (−) = toward glove side. Lateral flexion expressed as torso relative to the world axis.
Figure 2.
Torso lateral flexion. (+) = toward throwing arm side; (−) = toward glove side. Lateral flexion expressed as torso relative to the world axis.
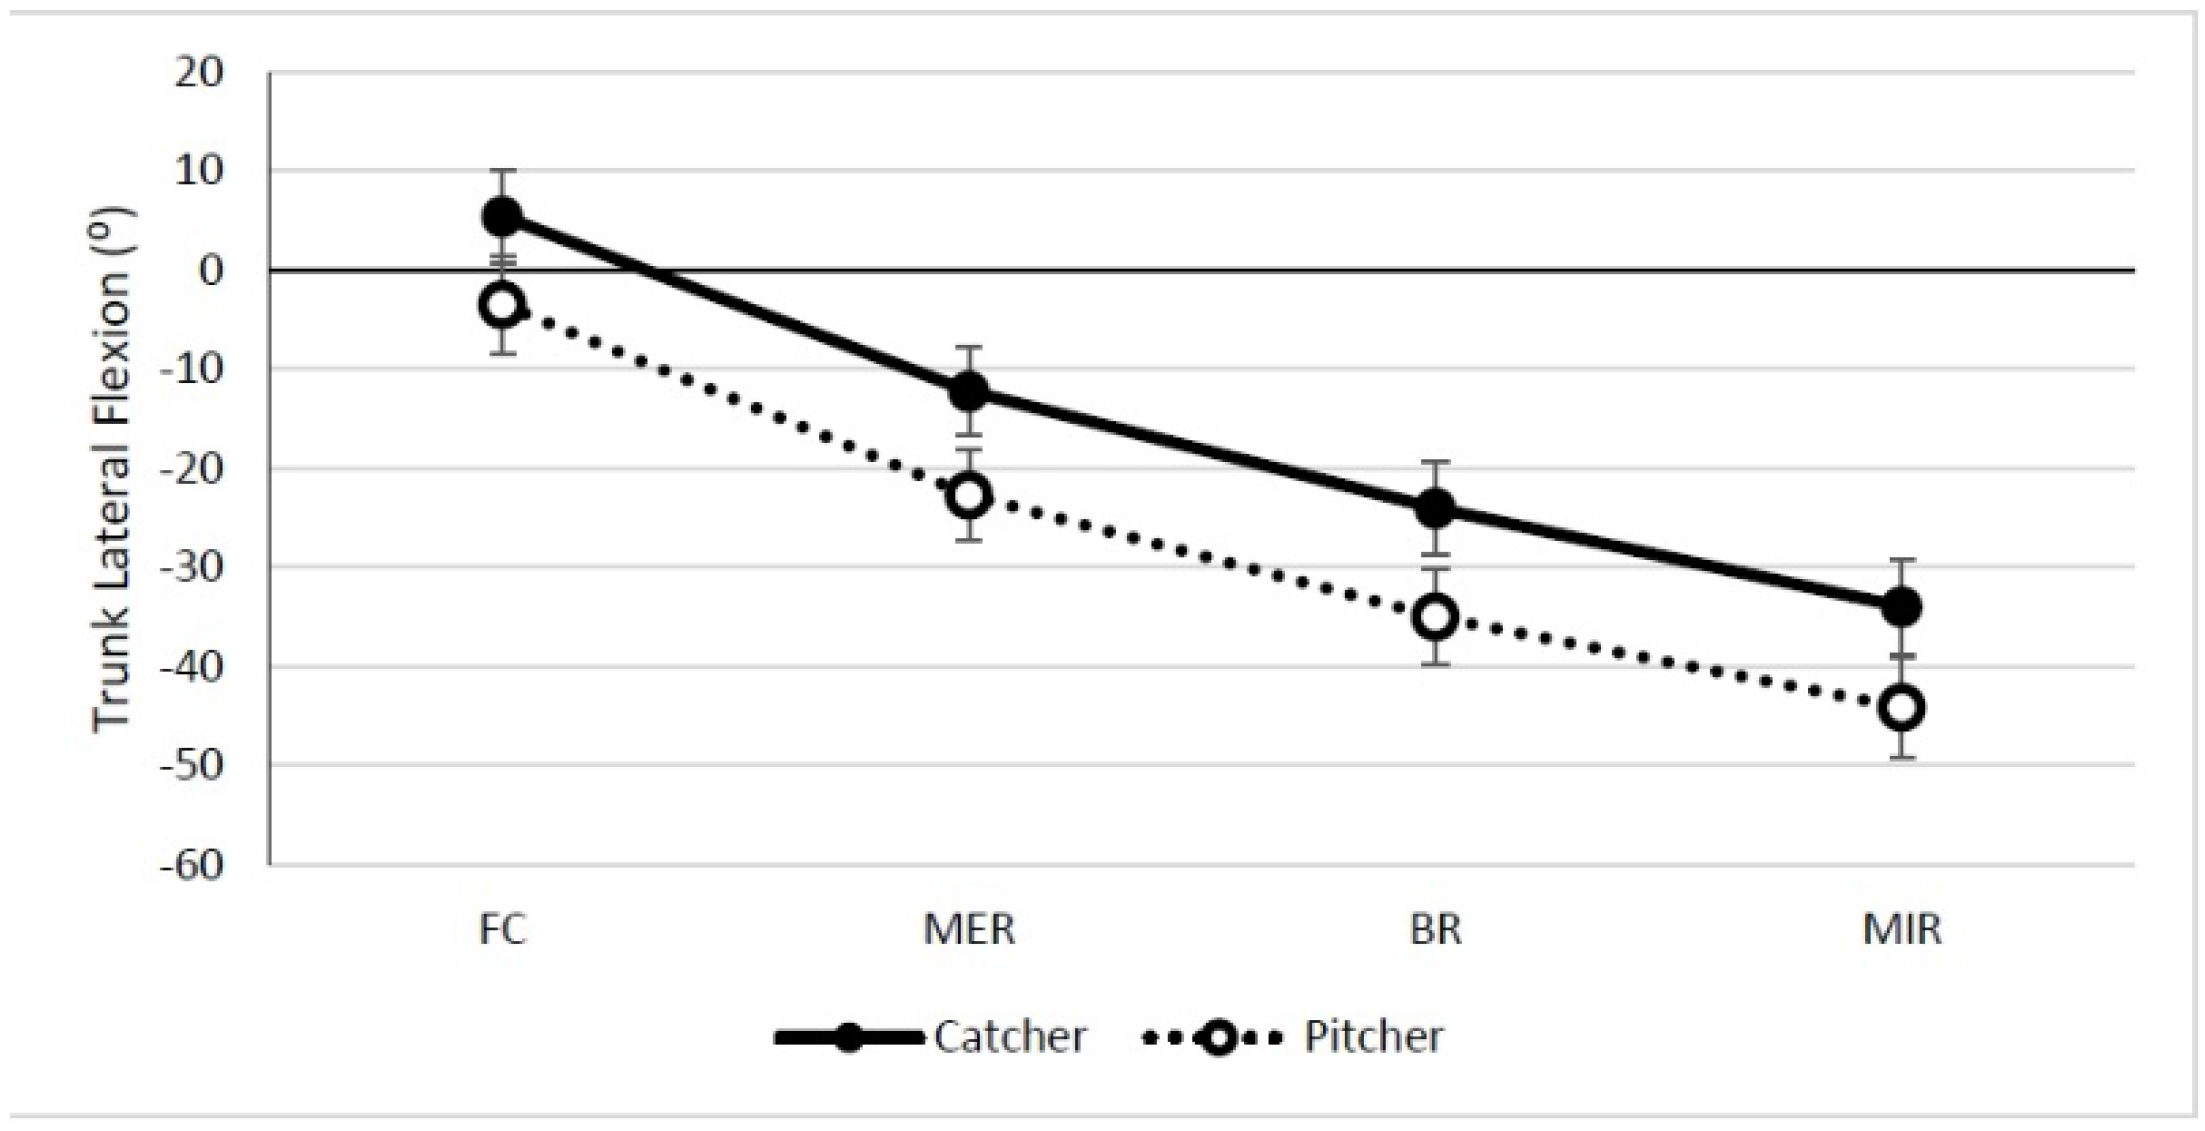
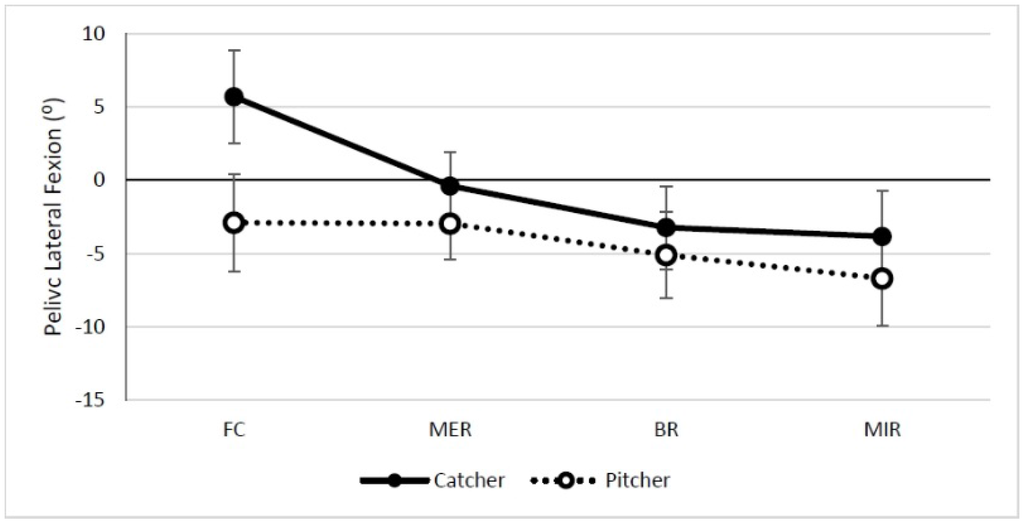
Figure 3.
Pelvis lateral flexion. (+) = toward throwing arm side; (−) = toward glove side. Lateral flexion expressed as torso relative to the world axis.
Figure 3.
Pelvis lateral flexion. (+) = toward throwing arm side; (−) = toward glove side. Lateral flexion expressed as torso relative to the world axis.

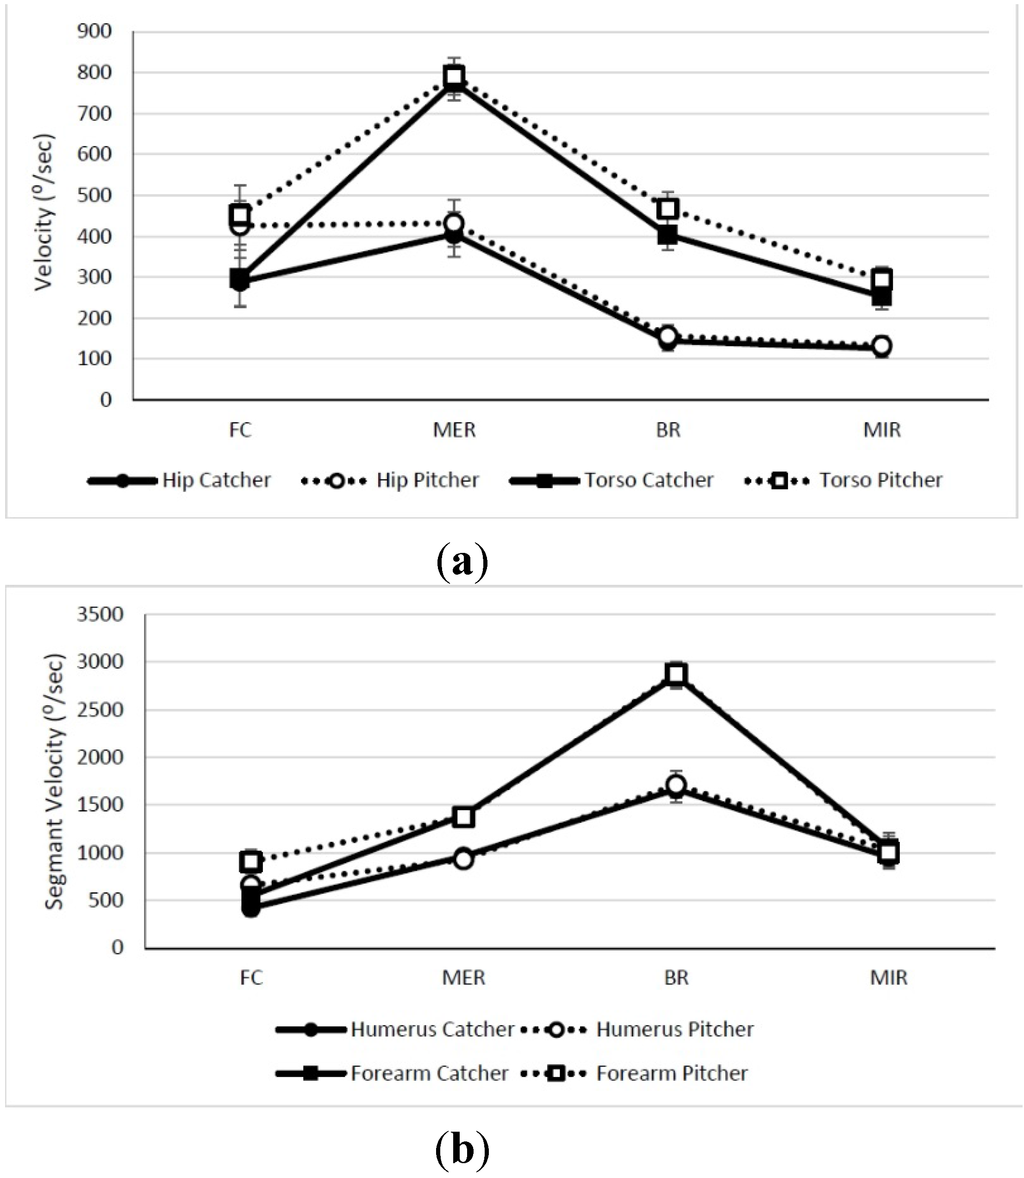
Figure 4.
(a) Velocity of hip and torso; (b) velocity of humerus and forearm.
Figure 4.
(a) Velocity of hip and torso; (b) velocity of humerus and forearm.

4.2. Analysis of Kinetic Measures
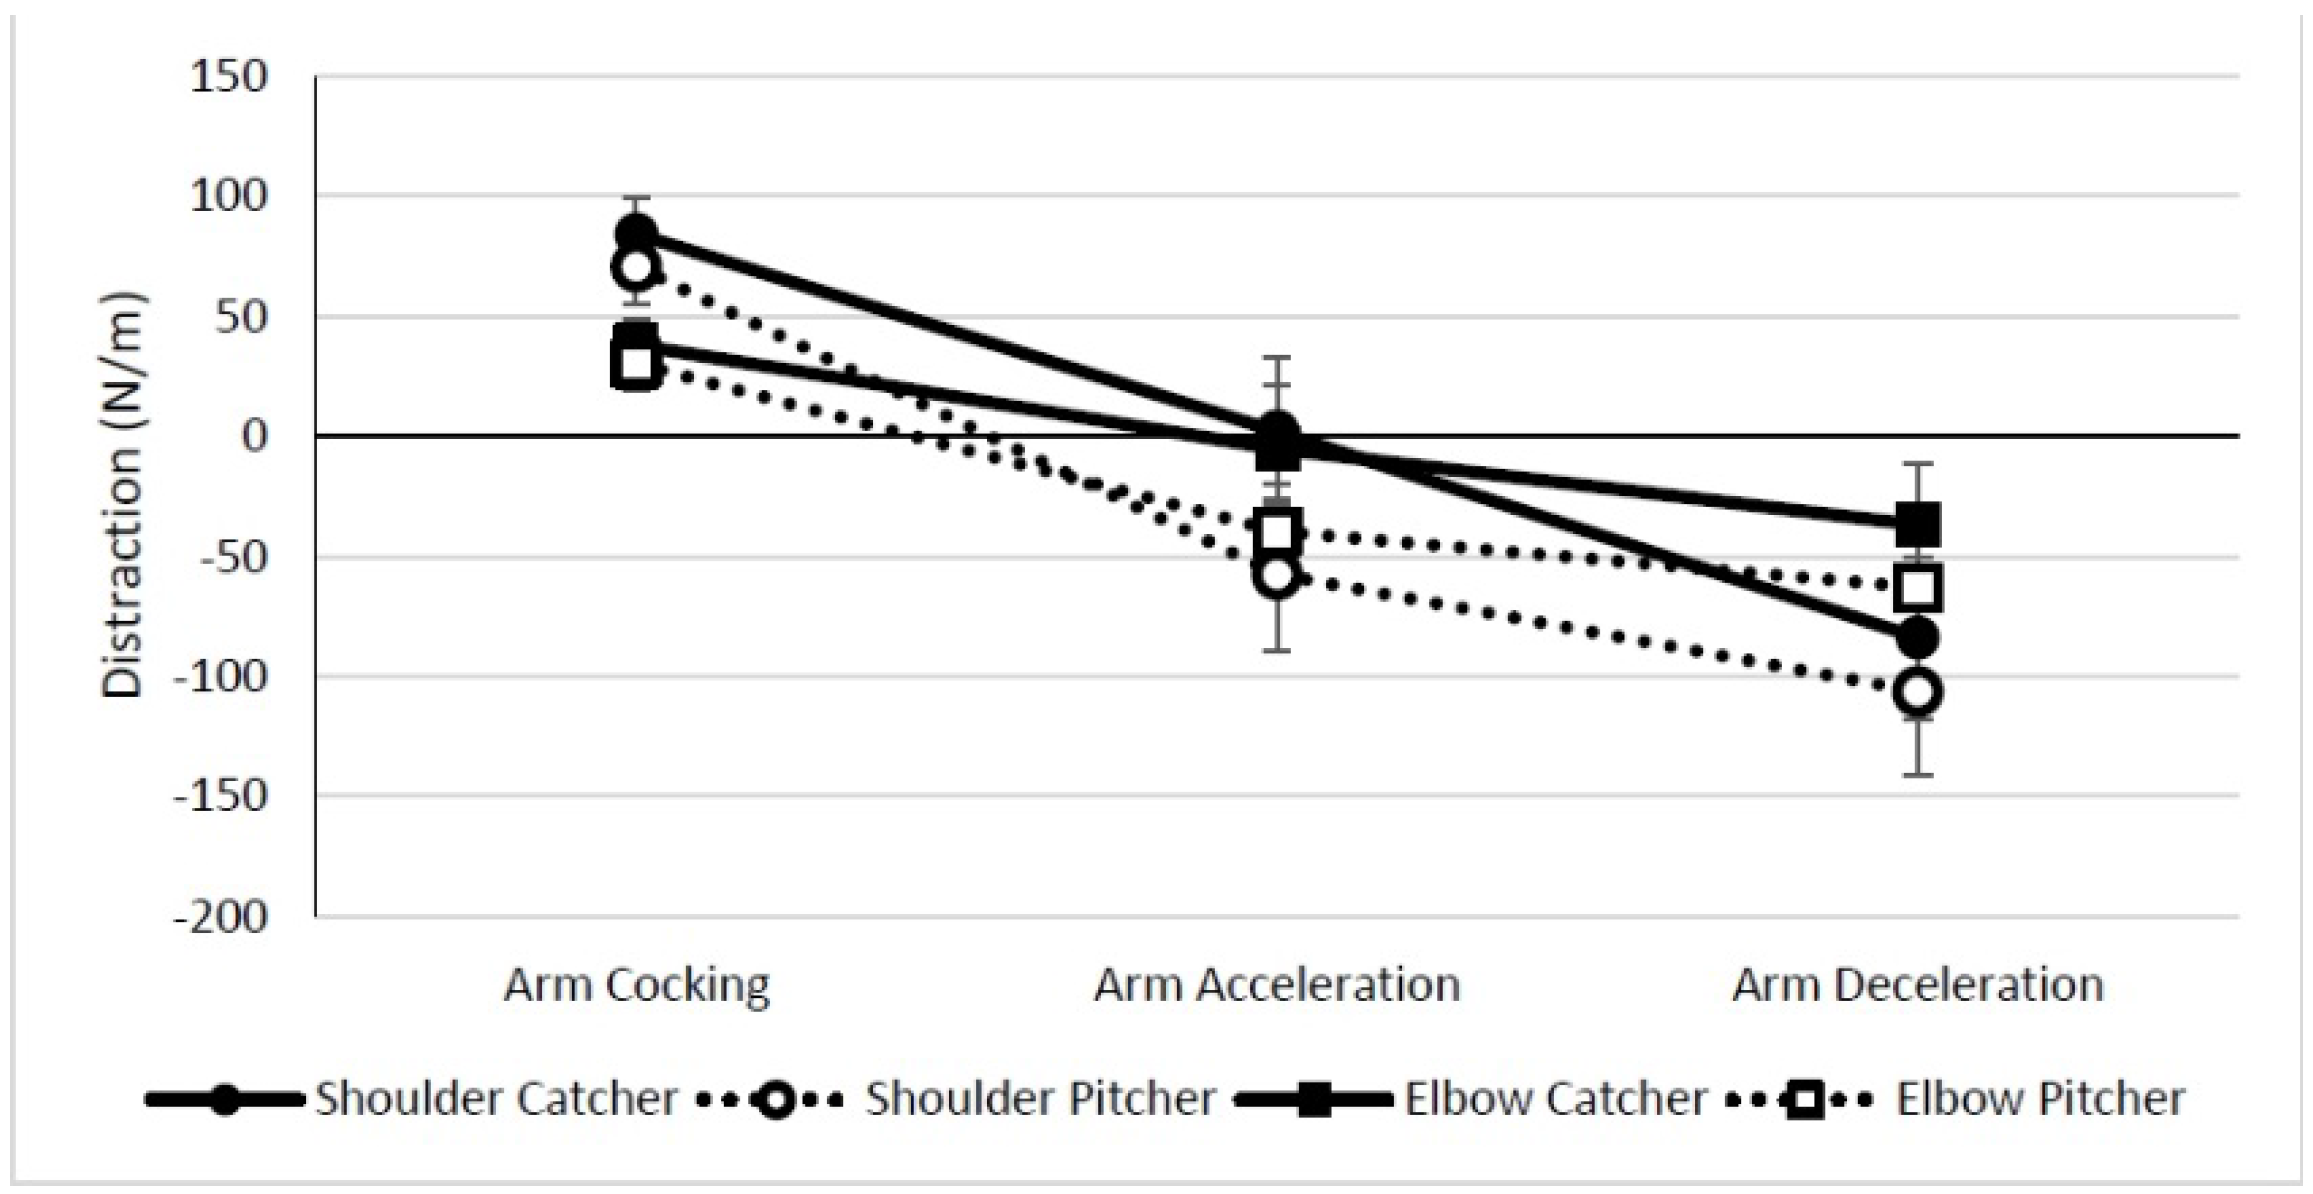
For Y-axis force (distraction force), there were significant main effects of phase and position (Table 4). Although the main effect of joint was not significant, there was a significant joint by phase interaction, F(1.70,81.52) = 63.76, p < 0.001, ε = 0.85, such that shoulder forces decreased more from the arm cocking though arm deceleration phase than did elbow forces (Figure 5).
Table 4.
Summary of ANOVA results for kinetic variables.
| Variable | ME of Phase | ME of Position | Phase × Position Interaction |
|---|---|---|---|
| Y Force * | F(2, 96) = 61.34, | F(1,48) = 6.76, | F(2, 96) = 1.29, |
| p < 0.01 | p = 0.01 | p = 0.30 | |
| Z Moment * | F(1.60, 75.26) = 31.27, | F(1,47) = 0.45, | F(1.60, 75.26) = 0.37, |
| p < 0.01, ε = 0.80 | p < 0.51 | p = 0.64, ε = 0.80 |
* Y force and Z moment analyses also included an additional factor of joint (shoulder versus elbow). See the main text for the main effects and interactions of these factors.

Figure 5.
Shoulder and elbow distraction force. (+) = compressive force; (−) = distraction force.
Figure 5.
Shoulder and elbow distraction force. (+) = compressive force; (−) = distraction force.
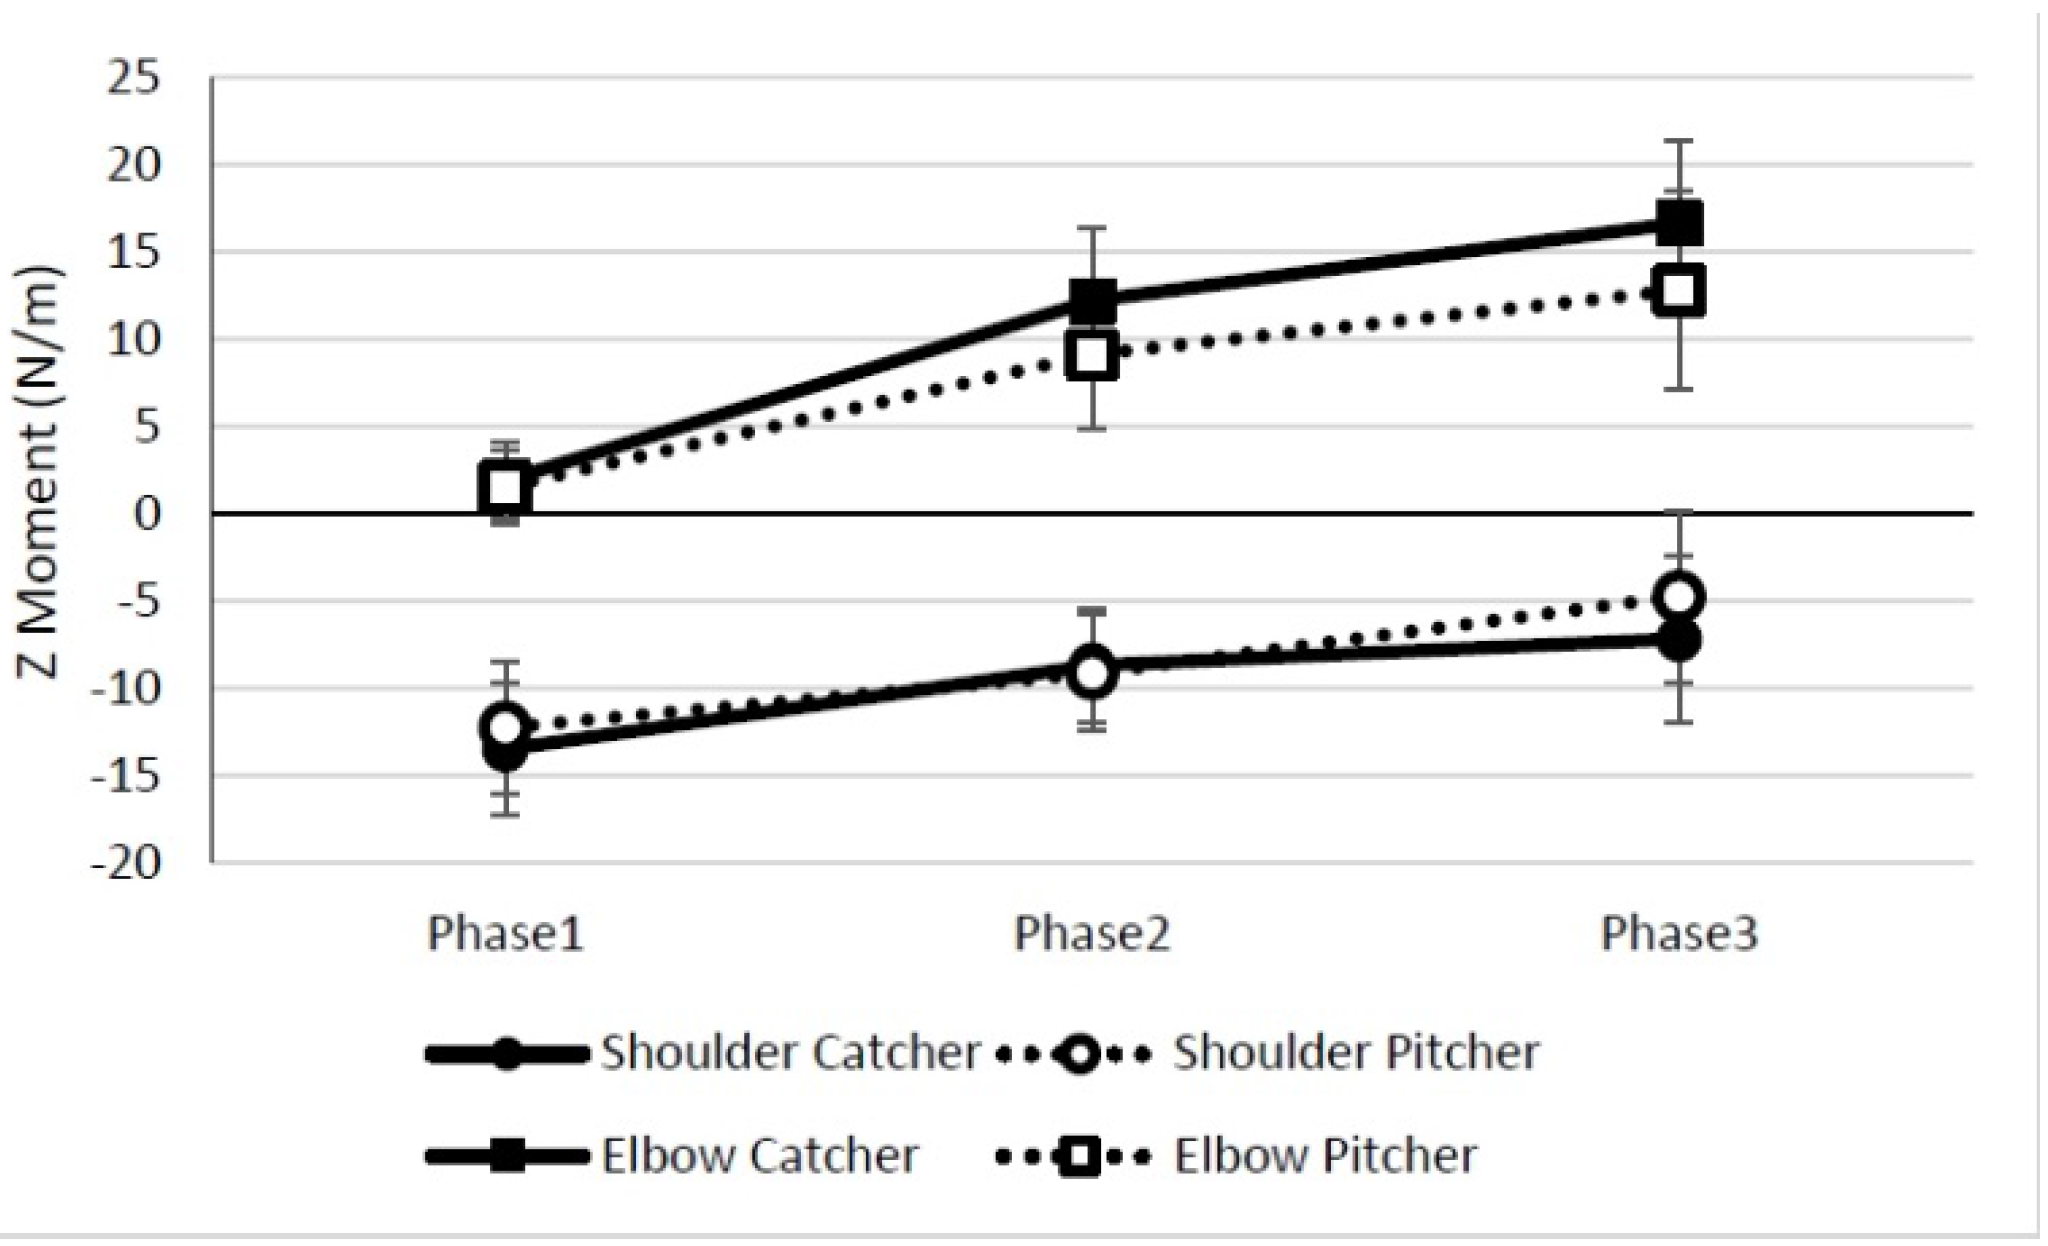
For Z-axis moments (adduction moment at the shoulder and varus moment (resists valgus opening) at elbow), there was a significant main effect of phase (Table 4) and joint. These main effects were complicated by a significant joint by phase interaction, F(1.39, 65.58) = 3.78, p = 0.04, ε = 0.70. As shown in Figure 6, this interaction reflects the fact that elbow moments tended to change more over time than did shoulder moments.
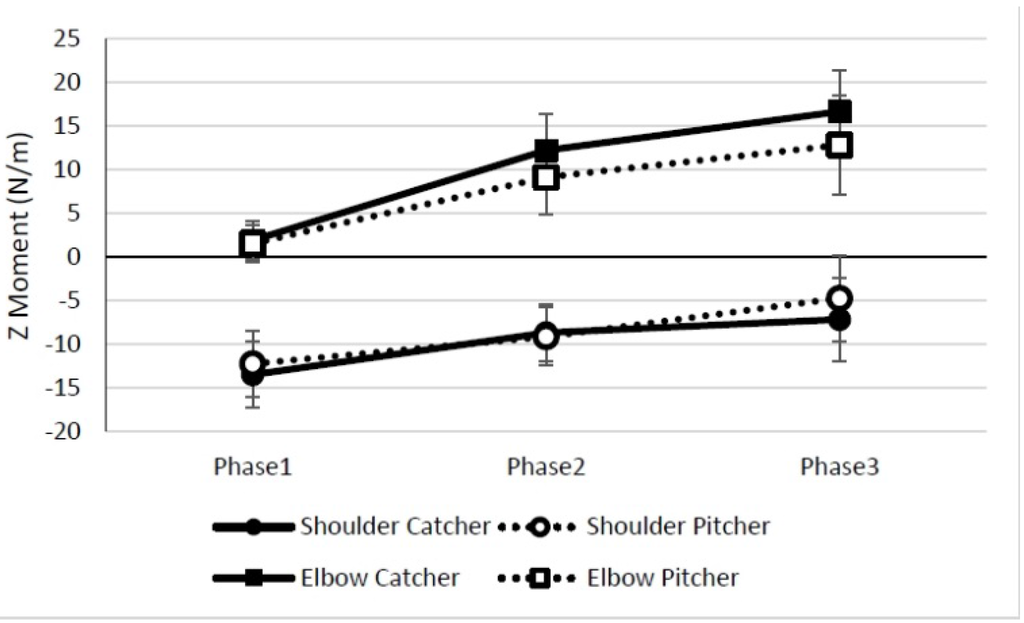
Figure 6.
Z axis moments. (+) = varus moment; (−) = valgus moment.
Figure 6.
Z axis moments. (+) = varus moment; (−) = valgus moment.
5. Discussion
As many youth are involved in baseball, the need for understanding the throwing motion is important. The literature has documented the mechanics of youth pitchers [1,2,3,4,8,20,21]; however, data regarding the mechanics of catchers is only beginning to become available [5]. With both the catcher and pitcher performing multiple throws throughout the course of a game, it is important to understand not only the mechanics of the throw, but also to determine if differences exist. It was hypothesized that catchers having to make a longer throw as quickly as possible would exhibit mechanical differences from those of the pitchers.
Based on the results of the current study, the catchers displayed significant difference in their mechanics, particularly at the pelvis and torso, throughout the throwing motion. This finding of both pelvis and torso differences reiterates the effect of how the body moves as a series of interdependent links working proximal to distal for ball propulsion [22]. As the pelvis laterally flexes, so does the torso in a sequential fashion. Thus, the results of pelvis and torso differences are not surprising; however, if only torso or only pelvic differences were exhibited, then it would be a more alarming find. However, as the body works as a linked system and the pelvis and torso are working in the same plane of movement, differences exhibited at both segments are expected. The youth catchers in the current study exhibited greater pelvis and torso lateral flexion than the pitchers. The greatest difference in pelvis lateral flexion occurred at FC, and then the motion progressed to MER, BR and MIR; their torso flexion continued to increase. These results are in opposition to what has previously been published; however, those data were of collegiate catchers and pitchers [7]. In the previously-published proceeding of catchers and pitchers, it was the pitchers who displayed the greater pelvis and torso lateral flexion. Conversely, the forward flexion of the catchers in the current study was in agreement with the previously-mentioned study [7]. It should be mentioned that other than the experience level of the participants in the current and previously-mentioned study, the catchers in the Fortenbaugh [7] study were not in their catching gear while throwing [7]. The protective gear of a catcher is a part of their position; thus for the current study, we feel that youth wearing gear that could possibly not fit as well as desired could definitely factor into the throwing mechanics.
The decreased torso flexion displayed in the current study could possibly be indicative of the catcher trying to rush their throwing release and keeping their torso more upright toward the target versus continuing forward in their throw; however, further investigation is needed to make this assumption. The current study did note that as the catcher’s progressed through the throwing motion, they were able to rotate about their hip forward and over their stride leg for completion of the throw. This technique is often see in long toss [7] and is considered correct.
When examining the segmental velocities of the catchers and pitchers, the main difference occurred at the event of FC for the hip and torso, as well as humerus and forearm. This finding was not unexpected, as it has previously been reported with collegiate-level catchers and pitchers [7] with the exception that our youth had a greater difference in velocities of the pitchers at FC. This could be a result of the catcher’s technique of ball transfer up from their squat to the position for FC versus already being more vertical as pitchers position into FC with pitching off the mound. Once a catcher receives the pitch, they quickly strive to get the ball out of their glove and into throwing position for the best opportunity for a quick and efficient throw; while a pitcher typically begins in his or her optimal throwing position. Thus, the discrepancies in segmental velocity could be attributed to the catcher having to come up out of a squat to initiate the throw.
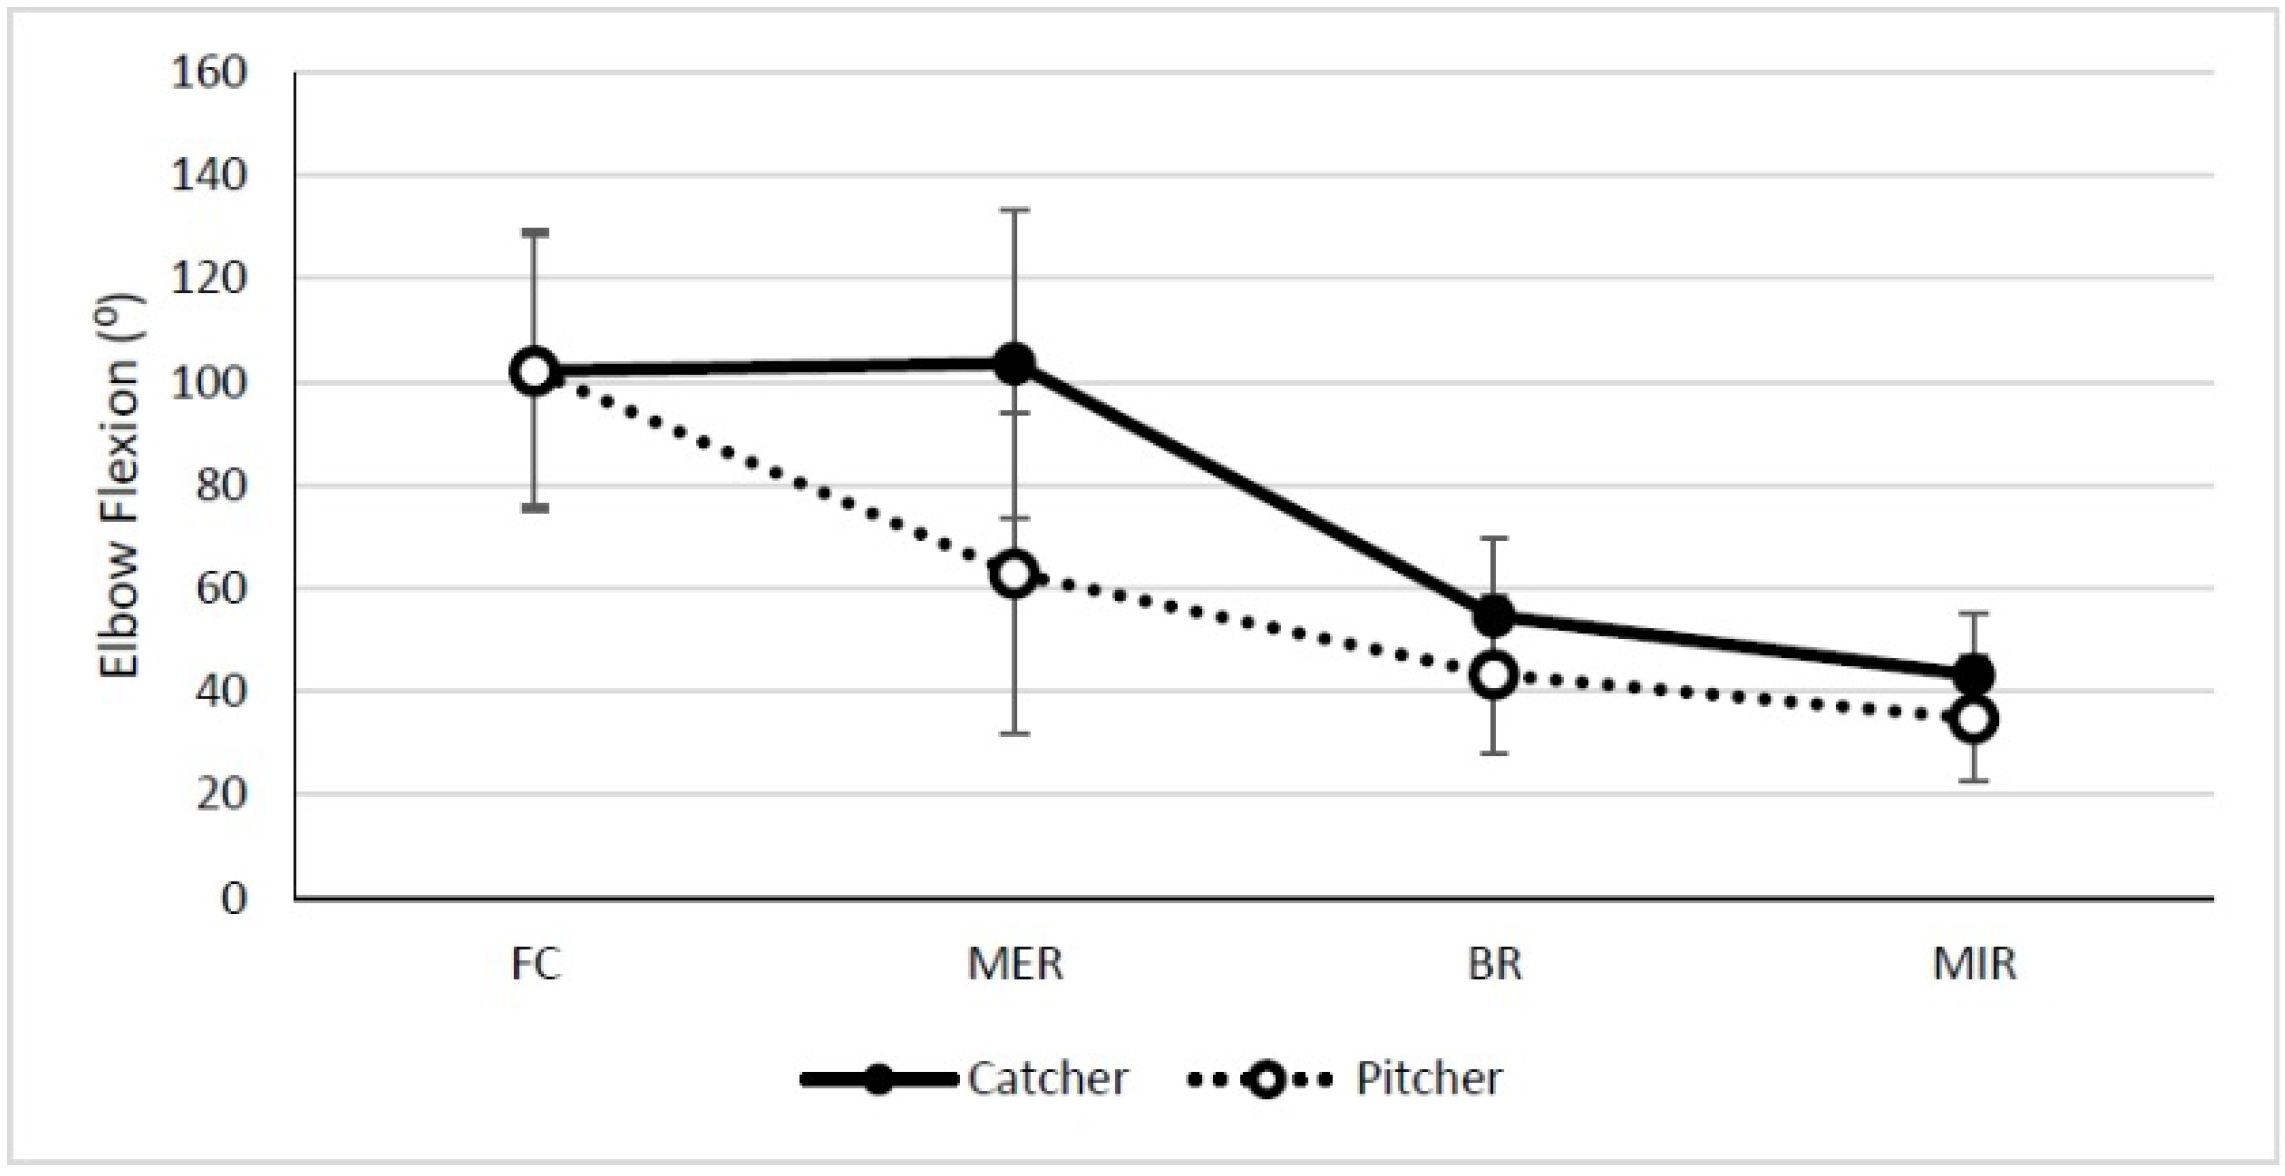
Though not statistically significant, the authors thought it was important to discuss elbow flexion (Figure 7). The catchers in the current study displayed extreme ranges of elbow flexion. It should be noted that exaggerated elbow flexion coincides with how catchers are typically taught to transfer the ball from the glove to a throwing position of MER [6]. Ideally, a catcher wants to have the ball out of their glove and approaching MER when they make FC. As in the current study, it was the position of MER where the youth catchers displayed maximum elbow flexion, similar to what has been reported in collegiate catchers [7].

Figure 7.
Elbow flexion.
Figure 7.
Elbow flexion.
Examining the kinetic data, the stresses about the shoulder and elbow in the current study were similar in magnitude, as well as comparable to those previously reported [7]. Additionally, it has been reported that elbow varus moments are lower when the elbow is more flexed [20,23]. As displayed in the current data, our findings also reiterate lower varus moments when the elbow is more flexed, and then, as the motion progresses through the phases, the moment increases. These findings of equivalent magnitudes are not surprising as there was no significant difference in the ball velocity between the catchers and pitchers (45.3 ± 8.2 mph and 48.4 ± 5.9 mph, respectively). However, it should be noted that ball velocity is not the only variable affecting upper extremity kinetics.
6. Conclusions
Based on data from the current study, it appears that the youth catchers execute their throw as they have been instructed [6]. It is unclear if the throwing mechanics displayed by these youth are efficient for a catcher or if catchers should try to throw with mechanics similar to pitching or long tossing. However, the implementation of long toss throwing mechanics is not known, since those mechanics are similar to pitching, sacrificing the quick ball release that a catcher is trying to employ. Additionally, further research should examine if the altered mechanics that catchers are utilizing predispose them to injury after prolonged throwing.
Supplementary Materials
Additional data are available in the supplementary file.
Author Contributions
G.O. conceived of and designed the experiments. G.O and S.G. performed the experiments. G.O. analyzed the data. G.O and K.L. contributed reagents/materials/analysis tools. G.O. and S.G. wrote the paper.
Conflicts of Interest
The authors declare no conflict of interest.
References
- Dun, S.; Loftice, J.; Fleisig, G.; Kingsley, D.; Andrews, J. A biomechanical comparison of youth baseball pitches is the curveball potentially harmful? Am. J. Sports Med. 2008, 36, 686–692. [Google Scholar] [CrossRef] [PubMed]
- Fleisig, G.S.; Andrews, J.R.; Cutter, G.R.; Weber, A.; Loftice, J.; McMichael, C.; Hassell, N.; Lyman, S. Risk of serious injury for young baseball pitchers: A 10-year prospective study. Am. J. Sports Med. 2011, 39, 253–257. [Google Scholar] [CrossRef] [PubMed]
- Dun, S.; Fleisig, G.S.; Loftice, J.; Kingsley, D.; Andrews, J.R. The relationship between age and baseball pitching kinematics in professional baseball pitchers. J. Biomech. 2007, 40, 265–270. [Google Scholar] [CrossRef] [PubMed]
- Oliver, G.D.; Keeley, D.W. Pelvis and torso kinematics and their relationship to shoulder kinematics in high-school baseball pitchers. J. Strength Cond. Res. 2010, 24, 3241–3246. [Google Scholar] [CrossRef] [PubMed]
- Plummer, H.; Oliver, G.D. Quantitative analysis of kinematics and kinetics of catchers throwing to second base. J. Sports Sci. 2013, 31, 1108–1116. [Google Scholar] [CrossRef] [PubMed]
- Stallings, J. Chapter 16: Stopping opponents with solid defense. In The baseball coaching bible; Kindall, J., Winkin, J., Eds.; Human Kinetics: Champaign, IL, USA, 2000. [Google Scholar]
- Fortenbaugh, D.; Fleisig, G.; Bolt, B. Coming down: Throwing mechanics of baseball catchers. In Conference Proceedings of the International Society of Biomechaincs in Sports, Marquette, WI, USA, 19–23 July, 2010; Volume 28.
- Oliver, G.D.; Keeley, D.W. Gluteal muscle group activation and its relationship with pelvis and torso kinematics in high-school baseball pitchers. J. Strength Cond. Res. 2010, 24, 3015–3022. [Google Scholar] [CrossRef] [PubMed]
- Ludewig, P.M.; Cook, T.M. Alterations in shoulder kinematics and associated muscle activity in people with symptoms of shoulder impingement. Phys. Ther. 2000, 80, 276–291. [Google Scholar] [PubMed]
- Day, J.; Murdoch, D.; Dumas, G. Calibration of position and angular data from a magnetic tracking device. J. Biomech. 2000, 33, 1039–1045. [Google Scholar] [CrossRef]
- Meskers, C.; Fraterman, H.; Helm, F.; Vermeulen, H. Calibration of the flock of birds electromagnetic tracking device and its application in shoulder motion studies. J. Biomech. 1999, 32, 629–633. [Google Scholar] [CrossRef]
- Perie, D.; Tate, A.J.; Cheng, P.L.; Dumas, G.A. Evaluation and calibration of an electromagnetic tracking device for biomechanical analysis of lifting task. J. Biomech. 2002, 35, 293–297. [Google Scholar] [CrossRef]
- Myers, J.B. Scapular position and orientation in throwing athletes. Am. J. Sports Med. 2005, 33, 263–271. [Google Scholar] [CrossRef] [PubMed]
- Myers, J.B.; Oyama, S.; Hibberd, E.E. Scapular dysfunction in high school baseball players sustaining throwing-related upper extremity injury: A prospective study. J. Shoulder Elb. Surg. 2013, 22, 1154–1159. [Google Scholar] [CrossRef] [PubMed]
- Oliver, G.D. Relationship between gluteal muscle activation and upper extremity kinematics and kinetics in softball position players. Med. Biol. Eng. Comput. 2013. [Google Scholar] [CrossRef] [PubMed]
- Oliver, G.D.; Plummer, H. Ground reaction forces, kinematics, and muscle activations during the windmill softball pitch. J. Sports Sci. 2011, 29, 1071–1077. [Google Scholar] [CrossRef] [PubMed]
- Wu, G.; van der Helm, F.C.T.; Veeger, H.E.J.; Makhsous, M.; Van Roy, P.; Anglin, C.; Nagels, J.; Karduna, A.R.; McQuade, K.; Wang, X.; et al. Isb recommendation on definitions of joint coordinate systems of various joints for the reporting of human joint motion—Part II: Shoulder, elbow, wrist and hand. J. Biomech. 2005, 38, 981–992. [Google Scholar] [CrossRef] [PubMed]
- Gagnon, D.; Gagnon, M. The influence of dynamic factors on tri-axial net muscular moments at the l5/s1 joint during asymmetrical lifting and lowering. J. Biomech. 1992, 25, 891–901. [Google Scholar] [CrossRef]
- Cummings, G. Understand the New Statistics: Effect Sizes, Confidence Intervals and Meta-Analysis; Routledge Taylor and Francis Group: New York, NY, USA, 2013. [Google Scholar]
- Sabick, M.B.; Kim, Y.K.; Torry, M.R.; Keirns, M.A.; Hawkins, R.J. Biomechanics of the shoulder in youth baseball pitchers: Implications for the development of proximal humeral epiphysiolysis and humeral retrotorsion. Am. J. Sports Med. 2005, 33, 1716–1722. [Google Scholar] [CrossRef] [PubMed]
- Fleisig, G.S.; Barrentine, S.W.; Zheng, N.; Escamilla, R.F.; Andrews, J.R. Kinematic and kinetic comparison of baseball pitching among various levels of development. J. Biomech. 1999, 32, 1371–1375. [Google Scholar] [CrossRef]
- Kibler, W.B.; Wilkes, T.; Sciascia, A. Mechanics and pathomechanics in the overhead athlete. Clin. Sports Med. 2013, 32, 637–651. [Google Scholar] [CrossRef] [PubMed]
- Werner, S.L.; Murray, T.A.; Hawkins, R.J.; Gill, T.J. Relationship between throwing mechanics and elbow valgus in professional baseball pitchers. J. Shoulder Elb. Surg. 2002, 11, 151–155. [Google Scholar] [CrossRef]
© 2015 by the authors; licensee MDPI, Basel, Switzerland. This article is an open access article distributed under the terms and conditions of the Creative Commons Attribution license (http://creativecommons.org/licenses/by/4.0/).