Article

Assessing High-Intensity Acceleration Efforts Using Local Positioning System—Introducing the Concept of the Relative Acceleration Threshold to Ice Hockey


by
Christian Bielmann
1,2,*,
Karin Fischer-Sonderegger
1,
Quirin Söhnlein
3,
Wolfgang Taube
2 and
Markus Tschopp
1
1
Department of Elite Sport, Swiss Federal Institute of Sport Magglingen SFISM, 2532 Magglingen, Switzerland
2
Department of Neurosciences and Movement Science, University of Fribourg, 1700 Fribourg, Switzerland
3
Lausanne Hockey Club, 1000 Lausanne, Switzerland
*
Author to whom correspondence should be addressed.
Sports 2026, 14(2), 62; https://doi.org/10.3390/sports14020062
Submission received: 16 October 2025 / Revised: 19 January 2026 / Accepted: 26 January 2026 / Published: 4 February 2026

Abstract

Current methods for assessing acceleration efforts (accefforts) in ice hockey do not account for the influence of initial skating speed on maximal voluntary acceleration capacity, which may lead to a biased evaluation of acceffort intensity. In this study, we introduce the conceptual approach of the relative acceleration threshold (relthreshold) to ice hockey and outline its potential benefits for the assessment of accefforts. Locomotion data derived from observations of 17 players across 10 official games were used to model the initial-skating-speed-dependent maximal voluntary acceleration capacity (amax–vinit capacity), from which a team-specific relthreshold was determined (relthreshold_75% = 3.23 − 0.365vinit), and, subsequently, applied to assess accefforts alongside a fix threshold set at 2 m·s−2 (fixthreshold_2). Differences in accefforts depended on the method used (relthreshold_75% vs. fixthreshold_2) as well as the playing position when using the relthreshold_75%. The fixthreshold_2 reported 89.1 ± 35.8% more accefforts than the relthreshold_75%. However, only one-third of these accefforts exceeded relthreshold_75%, which is considered indicative of neuromuscularly intense accefforts according to the modeled amax–vinit capacity. Moreover, at skating speeds above 4 m·s−1, the fixthreshold_2 only assessed a negligible number of accefforts, whereas the relthreshold_75% assessed 27.2 ± 9.3% of all its accefforts. In line with established theoretical rationales, the observational findings of this study suggest that an acceleration threshold adapted to the initial skating speed offers a conceptually more valid approach to assessing accefforts in ice hockey.

1. Introduction

Local positioning systems (LPSs) enable the objective quantification of players’ on-ice external kinematic loads using various indicators. LPSs have recently gained popularity in applied research and training monitoring in ice hockey due to their increased availability and affordability [1,2,3]. However, selecting the most appropriate and pertinent sport-specific indicators to meaningfully describe activity profiles is challenging [2,4,5,6]. In this context, to capture the frequently occurring metabolically and mechanically demanding acceleration activities, which are not well represented by the use of distance- and speed-based measures alone, an increased focus on tracking-system-derived acceleration measures has been highlighted in team sports in general [7,8,9]. Within tracking-system-derived acceleration measures, acceleration activities are generally operationalized using different approaches, such as the distance covered or time spent in predefined acceleration zones, the averaging of instantaneous acceleration values over time, or the number of discrete acceleration efforts performed above a set acceleration threshold, with the latter representing the most frequently reported approach in the literature [10,11].
Specifically in ice hockey, where the gliding mode of locomotion allows distances to be covered with reduced physical strain, the importance of quantifying acceleration activities has been suggested to be even more important for comprehensively assessing the external kinematic load [6,12,13,14,15]. Nevertheless, there is currently no consensus on how acceleration activities should be operationally defined. In contemporary ice hockey research using LPSs, acceleration activities have been assessed exclusively by quantifying discrete acceleration efforts (accefforts) using the traditional fixed acceleration threshold method (fixthreshold method, often also referred to as absolute threshold) set at 2 m·s−2 [2,16,17,18] and, on a single occasion, at 2.41 m·s−2 and 2.78 m·s−2 [6].
However, the use of a fixthreshold to assess accefforts leads to a systematic methodological bias, as the conclusions of several studies have empirically indicated that the maximal voluntary acceleration capacity progressively decreases with increasing locomotion speed [19,20]. Simply put, the greater the locomotion speed from which an acceffort is initiated, the lower the maximal voluntary acceleration capacity; up to the point when the peak locomotion speed is reached, the acceleration capacity is equal to zero because no more force can be applied [21,22]. To overcome this issue and improve the validity of accefforts evaluation, Sonderegger et al. [19] proposed the ‘relative acceleration threshold method’ (relthreshold method) by accounting for the influence of initial speed on the maximal voluntary acceleration capacity. This method relies on identifying discrete accefforts using the acceleration zero-crossings as the start and endpoint of an acceffort. As such, in soccer, initial-speed-dependent maximal voluntary acceleration capacities have been modeled first, using isolated linear sprint testing [19,23] and, more recently, using training locomotion [24] and game data [25]. Subsequently, the peak acceleration measured for each discrete acceffort is evaluated against the maximal voluntary acceleration capacity that can be achieved from that particular initial locomotion speed. Any effort exceeding the 75% threshold is classified as an intense acceffort [19].
Accounting for the influence of the initial speed on the maximal voluntary acceleration capacity appears particularly relevant in ice hockey. As an intermittent team sport played on ice with unlimited substitutions, ice hockey has a unique game structure characterized by repetitive brief periods of intense activity, typically lasting 30 to 90 s, followed by passive recovery phases of 3 to 5 min on the bench [26,27,28]. Approximately half of the distance covered in a game is spent skating at speeds exceeding 17 km·h−1. This results in average game speeds ranging from 12 to 17 km·h−1 [16,26,29,30,31], depending on various factors such as playing position, tactical system, opposing team, competition standard, and the number of power-play (numerical advantage) and penalty-kill (numerical disadvantage) situations. This is notably higher than the average game locomotion speeds observed in other team sports (e.g., soccer: 6.7 km·h−1 [4]; rugby league: 5.1 km·h−1 [32]). Therefore, ice hockey players may engage in more frequent accefforts initiated from higher locomotion speeds, accentuating the relevance of contextualizing acceffort magnitudes based on the underlying locomotion speed. This may be particularly relevant for forwards, as previous studies have shown that they cover more distance in high-speed skating zones than defensemen [2,16,30,31], which provides a basis for hypothesizing that they may perform accefforts more frequently from higher locomotion speeds.
The purpose of this study was to introduce the concept of the relative acceleration threshold to ice hockey. Specifically, rather than aiming to establish a fully validated methodological approach, this study seeks to outline the potential advantages of applying a relative acceleration threshold to assess accefforts using LPS. Accordingly, the first part of the study aims to determine a team-specific relative acceleration threshold by modeling the initial-skating-speed-dependent maximal voluntary acceleration capacity (amax–vinit capacity) using official game locomotion data. The aims of the second part of the study are (i) to explore differences in the number of accefforts captured by the traditional fixthreshold and the proposed relthreshold, and (ii) to investigate positional differences using the relthreshold, thus evaluating the approach’s ability to discriminate between positions based on expected differences. Forwards are hypothesized to perform more accefforts initiated from higher skating speeds than defensemen.

2. Materials and Methods

2.1. Design and Subjects

This applied research study was observational in design and included pre-existing in-game locomotion data initially collected as part of a regular monitoring routine of a professional team competing in the highest tier of Swiss Ice Hockey (National League) during the 2023–2024 season. Game locomotion data were collected from all rostered field players during ten consecutive regular-season home games played over a period of 48 days. The total sample included 25 players, who were designated as defensemen (n = 9; age: 27.5 ± 3.9 years; stature: 185.1 ± 7.6 cm; body mass. 88.2 ± 7.1 kg) or forwards (n = 16; age: 27.5 ± 3.8 years; stature: 181.7 ± 5.4 cm; body mass. 85.8 ± 6.3 kg). The inclusion criterion for Part 1 of the study—the threshold determination analyses—was a minimum of 100 cumulative effective playing minutes throughout the observational phase, resulting in n = 17 athletes (n = 6 defensemen; n = 11 forwards). This criterion was applied to ensure that enough accefforts were captured throughout the whole skating speed spectrum accelerating maximally or close to maximally, which represents an important methodological prerequisite for building robust and valid models. The inclusion criteria for Part 2 of the study were (i) players with match-files with a minimum of 10 min of effective playing time, in order to limit possible biases from low-minute-playing players inflating relative values, and (ii) players who played a minimum of two games throughout the observational phase, resulting in a total of n = 22 players (n = 8 defensemen; n = 14 forwards) with an average of 8.77 ± 2.36 (range: 2–10) games per player. The games were played on an International Ice Hockey Federation (IIHF) European-sized hockey rink (60 m × 30 m; 1800 m2). The study was approved by the Institutional Review Board of the Swiss Federal Institute of Sport Magglingen (245_LSP_09_2024) and was conducted in accordance with the Declaration of Helsinki.

2.2. Measurement System

Players’ in-game locomotion data were collected using an ultra-wideband local positioning system (LPS) operating at a sampling rate of 20 Hz (Kinexon, Munich, Germany, software version: 11.4.11; firmware version: release/6.11.0-sports-lps). In compliance with the manufacturer’s guidelines, the LPS sensor was tightly secured in a patch on the posterior side of the players’ shoulder pads, near the superior one-third of the scapula, to avoid unnecessary device movement. The manufacturer’s software-derived speed and acceleration data was used for analyses. This data was based on their latest proprietary postprocessing filtering methods at the time of data retrieval (September 2024), which consisted of an unscented Kalman filter and a second-order Butterworth low-pass filter with a cut-off frequency of 1 Hz. Recently, a study confirmed the validity and reliability of the Kinexon LPS [33]: the peak speed and acceleration demonstrated acceptable intersensor reliability (CV < 10%) when comparing two sensors worn by the same player, and they showed near-perfect correlations in instantaneous speed, peak speed, and acceleration (all r’s > 0.892) compared to a previously validated robotic sprint device [33]. Data were trimmed to only include the effective playing time for each player through the synchronization of the LPS with the game clock. Once downloaded, acceleration and speed data traces were subsequently processed using a custom-written MATLAB script (Version R2020a, MathWorks Inc., Natick, MA, USA).

2.3. Method for Detecting Players’ Discrete acceffort

Players’ discrete accefforts were detected from the acceleration trace using the zero-crossing method [34]. The start of an acceffort was defined as the moment the acceleration signal turned positive and ended when the signal returned 0 m·s−2 (i.e., the velocity stopped increasing). The acceffort duration (aduration), speed increase (vdelta), peak acceleration magnitudes attained during the effort (amax) and skating speed from which the acceleration was initiated (vinit) were retrieved for each effort. In cases where the acceleration trace fell below 0.5 m·s−2 for more than five consecutive data points without turning negative, and then subsequently increased again, the velocity preceding the second rise was considered vinit. This criterion was applied because it has been shown that, during abrupt deceleration phases immediately followed by re-acceleration, the instantaneous acceleration trace may be filtered in such a way that the actual short deceleration phase is obscured, potentially merging two or even several distinct accefforts misleadingly into a single zero-crossing [35]. Accordingly, this dip-rule was implemented to correct for this potential artifact and to ensure the proper alignment of vinit with the corresponding amax. Subsequently, for a zero-crossing to finally be considered an acceffort, the following criteria had to be satisfied: First, aduration had to last at least 1.15 s, corresponding to approximatively two skating cycles according to Kaartinen et al. [36]. Secondly, the player needed to gain a minimum speed increase of 3.6 km·h−1 (vdelta). Only accefforts fulfilling the above-mentioned criteria were retained for analysis. Accefforts that did not meet the criteria were considered either (i) a representation of a negligible mechanical load to the player—negligible when considered in isolation but indeed contributing cumulatively to the player’s overall load, an effect not addressed in the present study—or (ii) signal noise.

2.4. Modeling Initial-Skating-Speed-Dependent Maximal Voluntary Acceleration Capacity

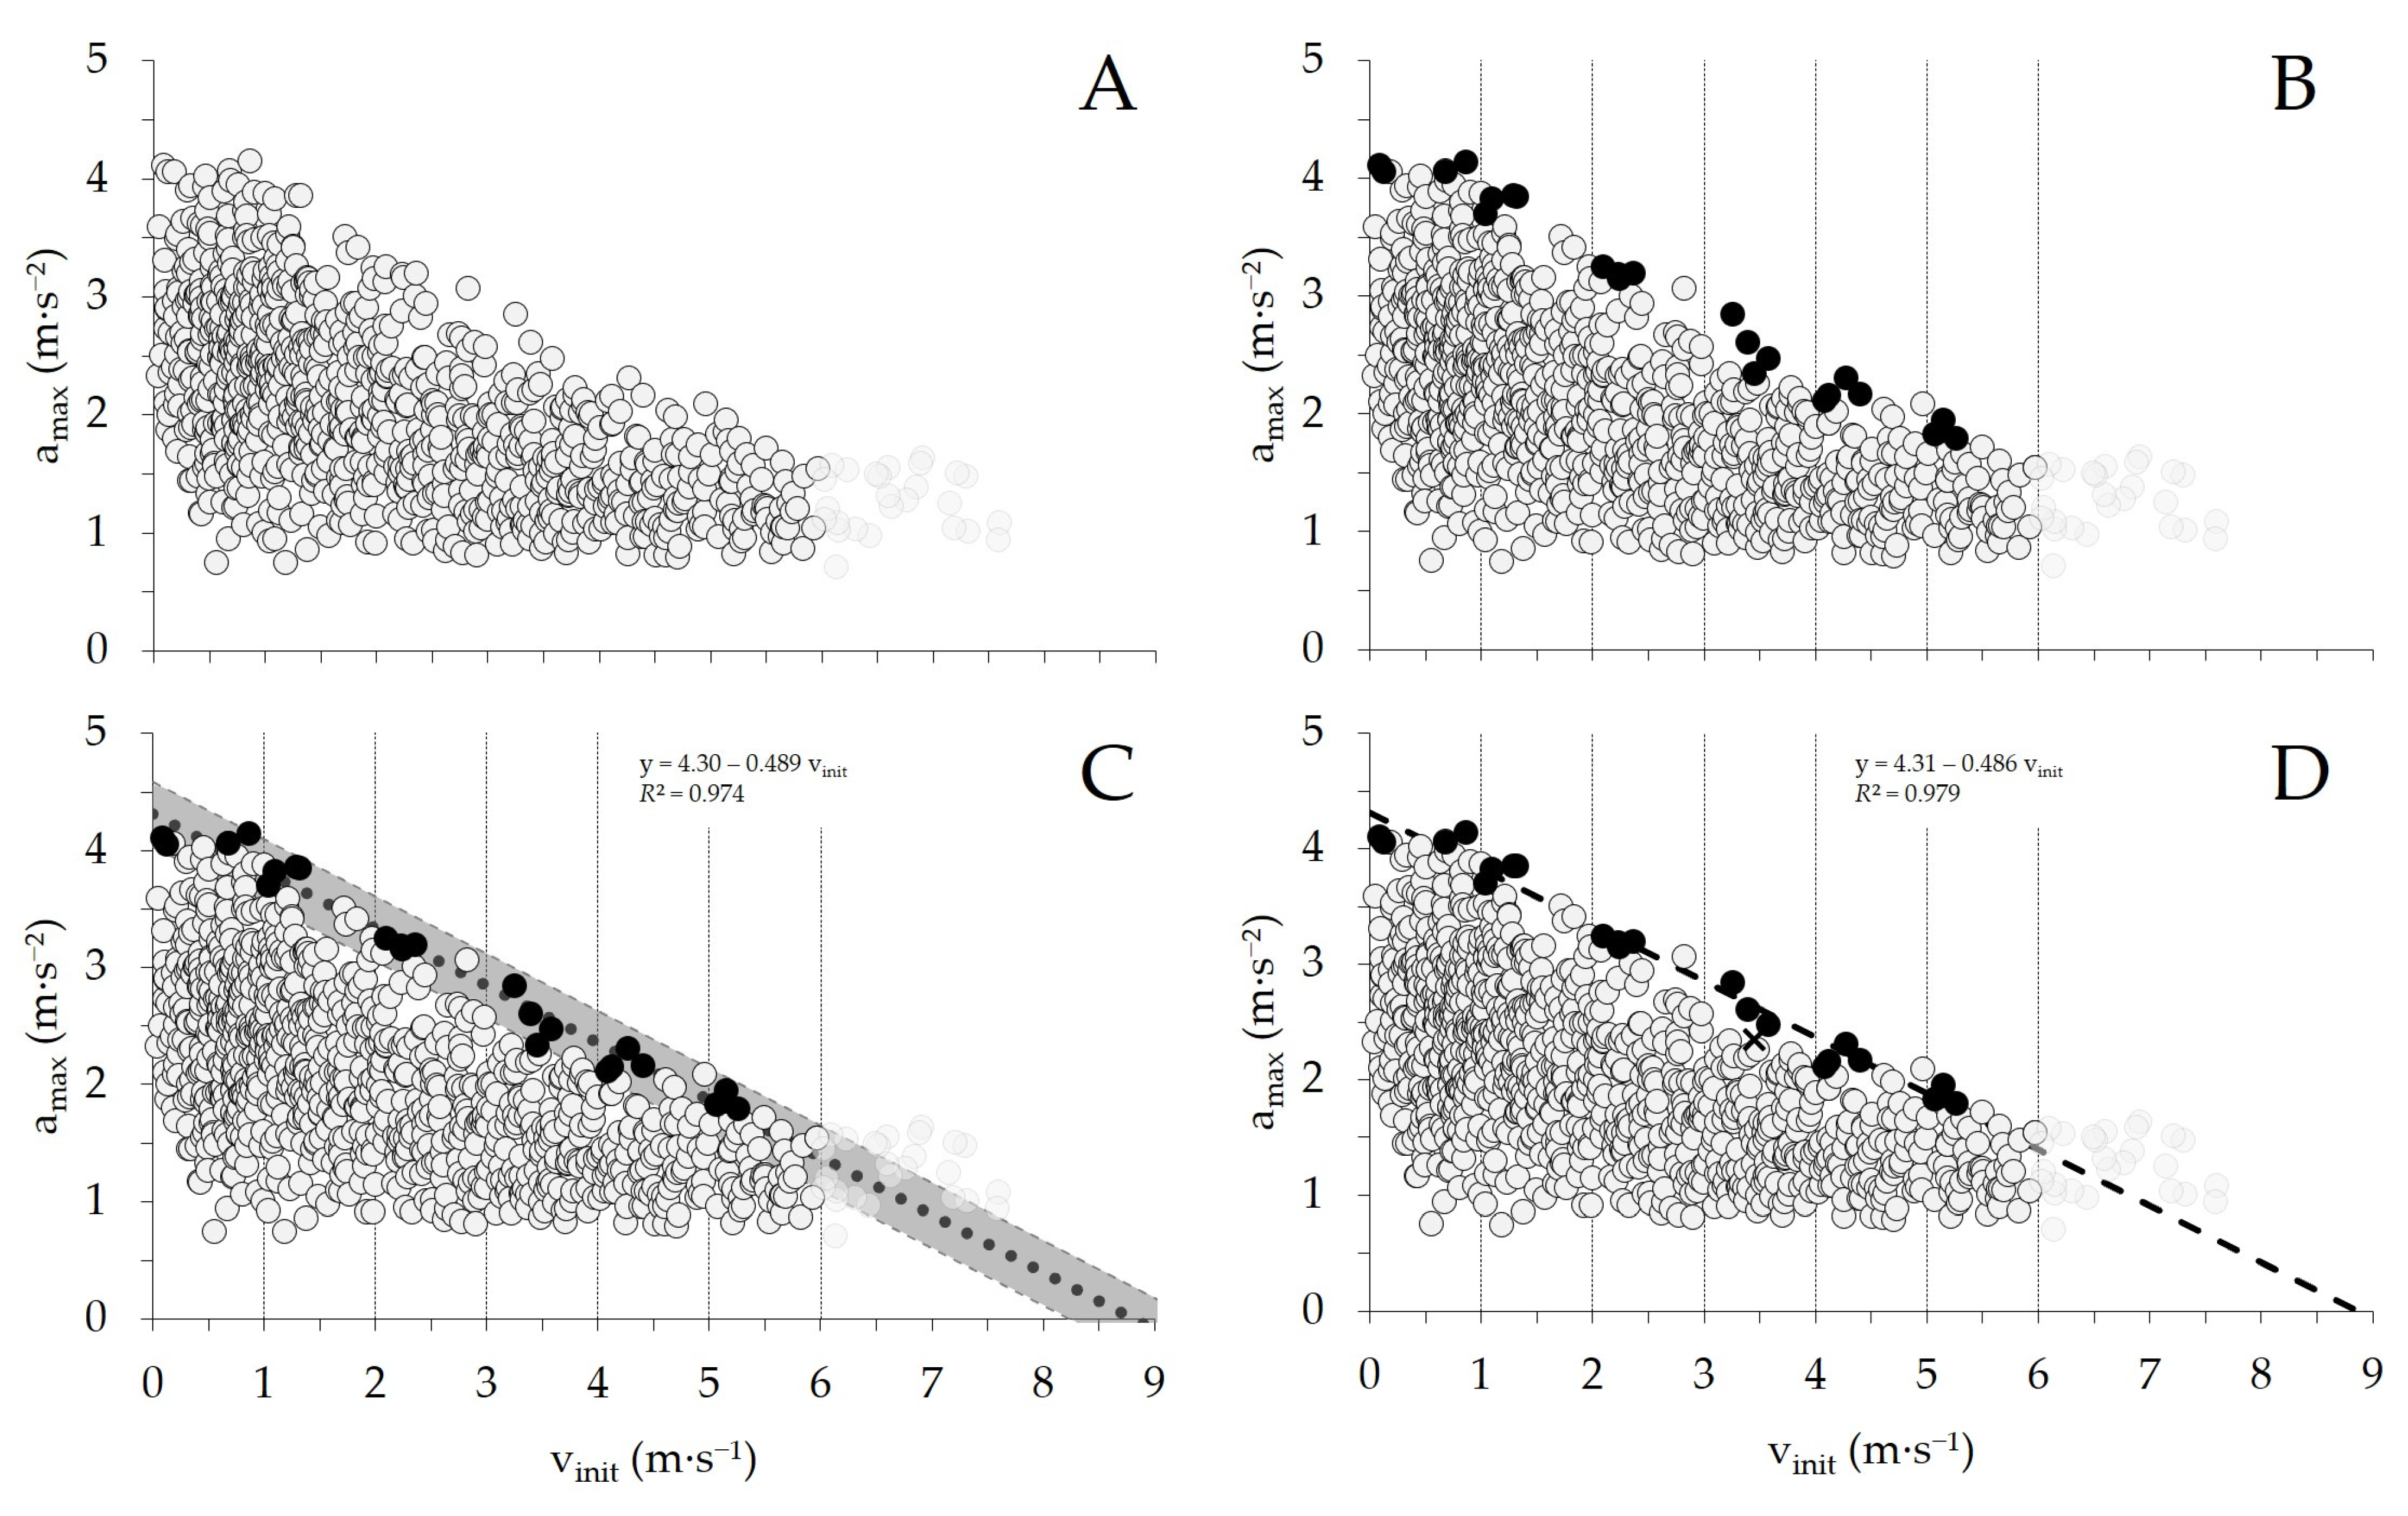
The endpoint of the first part of the study was to determine a team-specific relative acceleration threshold. This threshold was derived from the in-game modeled initial-speed-dependent maximal voluntary acceleration capacity (amax–vinit capacity), which was obtained by linear regression analysis of game locomotion data and was used as an operational marker for the external mechanical limits of the neuromuscular system to accelerate at different initial skating speeds. As such, each subject’s individual amax–vinit capacity regression line was determined using the following procedure (see Figure 1, A–D for a graphical illustration using one representative player): First, all their accefforts performed throughout the observation phase were compiled and plotted in a two-dimensional diagram with the amax (the maximal acceleration reached for each effort) on the y-axis and the vinit (the speed from which the action was initiated) on the x-axis (Figure 1A). Next, the four accefforts with the highest acceleration values detected within each 1 m·s−1 speed subinterval up to 6 m·s−1 (e.g., 0–1, 1–2, 2–3 m·s−1) were selected (black dots, Figure 1B). This procedure was limited to vinit subintervals up to 6 m·s−1 because not all players or positions consistently accelerated from higher initial speeds. Accordingly, data above 6 m·s−1 were excluded from the threshold determination procedure. Then, a first simple linear regression was fitted to the selected accefforts and the 95% prediction intervals were calculated (Figure 1C). Finally, accefforts outside of the 95% prediction interval were removed and a second and final regression equation, which excluded the outliers, was calculated to improve the overall accuracy of the model (Figure 1D). The resulting regression equation characterizes the subjects’ individually modeled amax–vinit capacity, where the y-intercept describes the theoretical maximal acceleration when starting at rest and the slope indicates the decrease in amax as a function of increasing vinit.
In contrast to previous studies in soccer, which typically included the selection of the highest available accefforts to compute amax–vinit capacity regression lines, we opted for a more conservative amax–vinit capacity regression line determination. The rationale behind this decision is that the selection of relevant accefforts from the cloud of points to determine the amax–vinit capacity regression lines has been shown to be challenging and prone to measurement errors [25]. We therefore argue that a more conservative amax–vinit capacity regression line determination provides a more robust and less error-prone basis for anchoring the relative acceleration threshold. Two key methodological decisions were made to approximate the true unknown amax–vinit capacity regression line: First, based on the number of games compiled, we opted for 1 m·s−1 speed subintervals. Narrower speed intervals might have resulted in certain intervals not containing accefforts located at or in close proximity to the true unknown amax–vinit capacity regression line, i.e., they may have included accefforts that are too low to represent maximal efforts, thereby inevitably increasing the deviation from the true unknown amax–vinit capacity regression line. However, broader speed intervals would have reduced the total number of accefforts, which would have made the regression parameters less robust and increased the uncertainty associated with the prediction intervals, ultimately compromising the ability to identify outliers [25]. The second decision concerned the number of accefforts within the subintervals. Similarly, we reasoned that a higher count of accefforts would yield more robust regression parameters and reduce the uncertainty associated with the prediction intervals used for outlier detection. However, too many accefforts within the subinterval could negatively affect regression parameter accuracy, as an increasingly large number of submaximal accefforts would have been accounted for, thus increasing the deviation from the true unknown amax–vinit capacity regression line [25]. In an unpublished preliminary study, we compared various configurations and found that four data points per 1 m·s−1 speed subinterval resulted in the highest coefficient of determination (R2) for this observational timeframe. Therefore, this configuration was adopted for the current study. However, it should be noted that different configurations tested during preliminary internal analysis did not substantially influence the regression parameters (not published).
Subjects’ individual amax–vinit capacity regression line coefficients (i.e., y-intercept and slope) were then averaged to calculate a team-level grand mean regression line (by adding up the individual regression coefficients and dividing the total by the number of subjects). The relative acceleration threshold (relthreshold_75%) was subsequently derived as 75% of the grand mean. A summary of the modeled individual- and team-level amax–vinit capacity regression lines, coefficient of variation in the regression coefficients (CV%), and the resulting team-specific relthreshold_75%, which was further used for Part 2 of the study, are reported at the beginning of the Results section.
Additionally, accefforts were assessed using the commonly used fixthreshold-method set at 2 m·s−2 (fixthreshold_2) using the same criteria (i.e., aduration, vdelta) for an acceffort to be included. Moreover, accefforts assessed using both computational methods were further categorized into initial-skating-speed bands from which they were initiated using a fixed bandwidth of 2 m·s−1 intervals (0–2 m·s−1, very low speed; 2–4 m·s−1, low speed; 4–6 m·s−1, moderate speed; >6 m·s−1, fast speed).

2.5. Statistical Analyses

Unless otherwise stated, all data are presented as mean ± standard deviation (SD) and were analyzed using SPSS Version 28.0.1.0 for Windows (SPSS Inc, Chicago, IL, USA). The goodness of fit (R2) was used to assess the quality of the linear fit of the individually modeled amax–vinit capacity regression lines. Descriptive statistics were calculated to indicate both the absolute and normalized number of accefforts assessed during official match play for both acceffort computational methods. The normalized number of accefforts is expressed relative to the effective playing time and scaled on a per minute basis to account for interindividual differences in playing time. To investigate differences between the two methods (fixthreshold_2 vs. relthreshold_75%) and between playing positions (forwards vs. defensemen), the mean individual number of accefforts across all matches played during the observation period was used for statistical analyses. Normalized values were used to assess differences, in order to ensure comparability across playing positions while accounting for interindividual differences in effective playing time. The Shapiro–Wilk test revealed that the number of accefforts assessed using both methods and their resulting differences were normally distributed (p > 0.05), allowing parametric tests to be applied. Paired-sample t-tests were used to assess differences between the two computational methods (fixthreshold_2 vs. relthreshold_75%) regarding the number of accefforts captured in total and across the various initial-skating-speed bands. Independent-sample t-tests were used to evaluate positional differences in the number of accefforts performed using the relthreshold_75%—again, in total and across the different initial-skating-speed bands. To interpret the meaningfulness of the differences, Cohen effect-size (d) statistics are reported, which can be interpreted as follows: <0.2, trivial; 0.2 to 0.6, small; 0.6 to 1.2, moderate; 1.2 to 2.0, large; and >2.0, very large [37]. Statistical significance was set at p ≤ 0.05.

3. Results

3.1. Team-Specific Relative Acceleration Threshold Determination

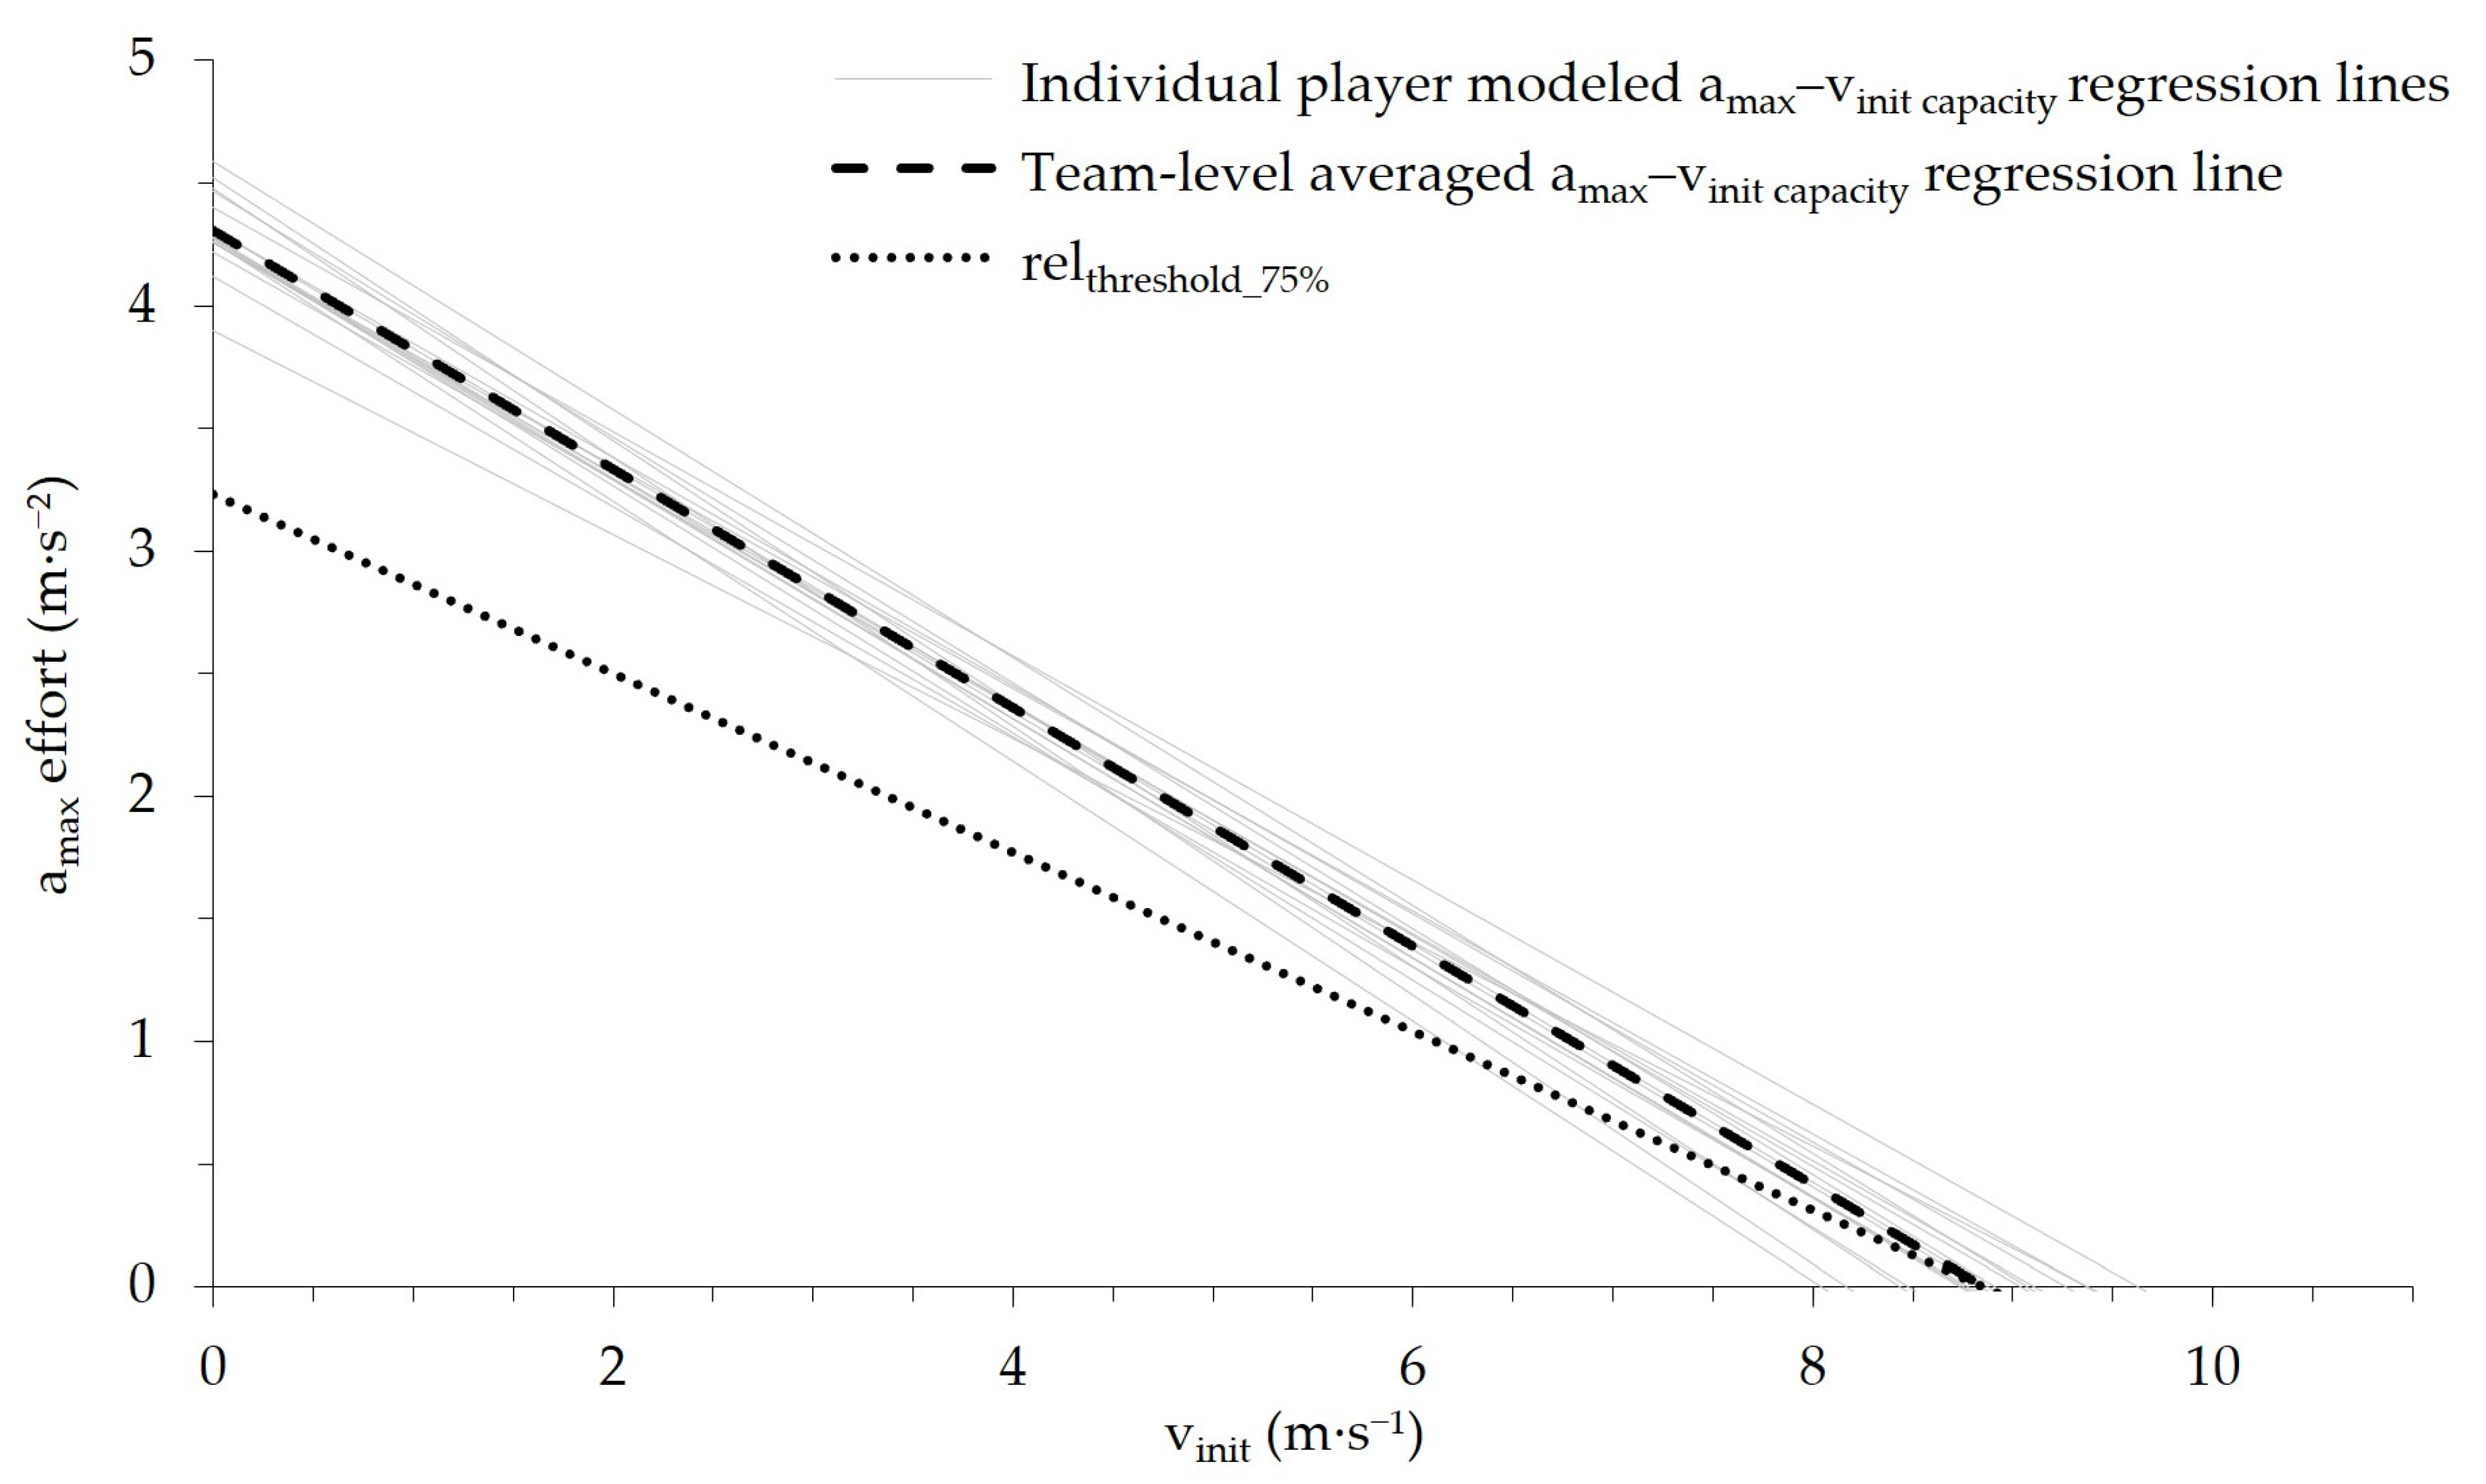
Part 1 of this study aimed to determine a team-specific relative acceleration threshold using the averaged, individually modeled amax–vinit capacity regression lines. The goodness of fit (R2) of the individually modeled amax–vinit capacity regression lines was 0.94 ± 0.02 (range: 0.89–0.98), with a corresponding standard error of the estimate of 0.21 ± 0.04 m·s−2. The resulting team-level mean y-intercept (i.e., theoretical maximal acceleration capacity from standing) was 4.31 ± 0.16 m·s−2 (95% confidence interval (CI) [4.22, 4.39]), with a coefficient of variation (%CV) of 3.72%, and the mean slope was 0.48 ± 0.03 (95% CI [0.47, 0.50]) with a CV of 6.17%. Figure 2 depicts the individual- and the team-level modeled amax–vinit capacity regression lines. Applying a margin of 75%, the resulting team-specific relative acceleration threshold (relthreshold_75% in m·s−2; vinit in m·s−1) was determined as follows, with values in parentheses indicating 95% CI:
relthreshold_75% = 3.23 (3.17 to 3.29) − 0.365 (−0.352 to −0.377)vinit

3.2. Descriptive Match Analysis

The average effective playing time was 16.0 ± 2.7 min per game. When using the relthreshold_75%-method, players performed 26.1 ± 6.5 accefforts per game, of which 50.2 ± 7.7%, 22.7 ± 3.2%, 19.9 ± 5.4%, and 7.2 ± 4.1% were initiated from ‘very low’, ‘low’, ‘moderate’, and ‘fast’ skating speeds, respectively. At the same time, using the fixthreshold_2 method, the number of accefforts performed was 47.9 ± 8.2 per game, of which 81.1 ± 3.5%, 17.7 ± 3.2%, 1.2 ± 0.7%, and 0.0% were initiated from ‘very low’, ‘low’, ‘moderate’, and ‘fast’ skating speeds, respectively.

3.3. Differences in the Number of Assessed accefforts Between the fixthreshold_2 and relthreshold_75% Method

Table 1 presents the mean number of assessed accefforts per effective playing minute for the two computational methods as well as the paired t-test statistics comparing the two methods. In total (i.e., all initial-skating-speed bands combined), the fixthreshold_2 method assessed, on average, 1.37 ± 0.32 (89.1 ± 35.8%) more accefforts per minute than the relthreshold_75% method. When analyzed using initial-skating-speed bands, the fixthreshold_2 method assessed significantly more accefforts in the two lowest speed bands, with mean differences of 1.63 ± 0.23 and 0.16 ± 0.05 accefforts per minute in the ‘very low’ and ‘low’ initial-skating-speed bands between the two methods, respectively. Conversely, in the ‘moderate’ and ‘fast’ initial-skating-speed bands, the relthreshold_75% method assessed significantly more accefforts, with mean differences of 0.30 ± 0.11 and 0.13 ± 0.08 accefforts per minute between the two methods, respectively. Notably, using the fixthreshold_2 method, accefforts initiated from a ‘moderate’ skating speed were only rarely detected, while no accefforts from a ‘fast’ skating speed were observed.
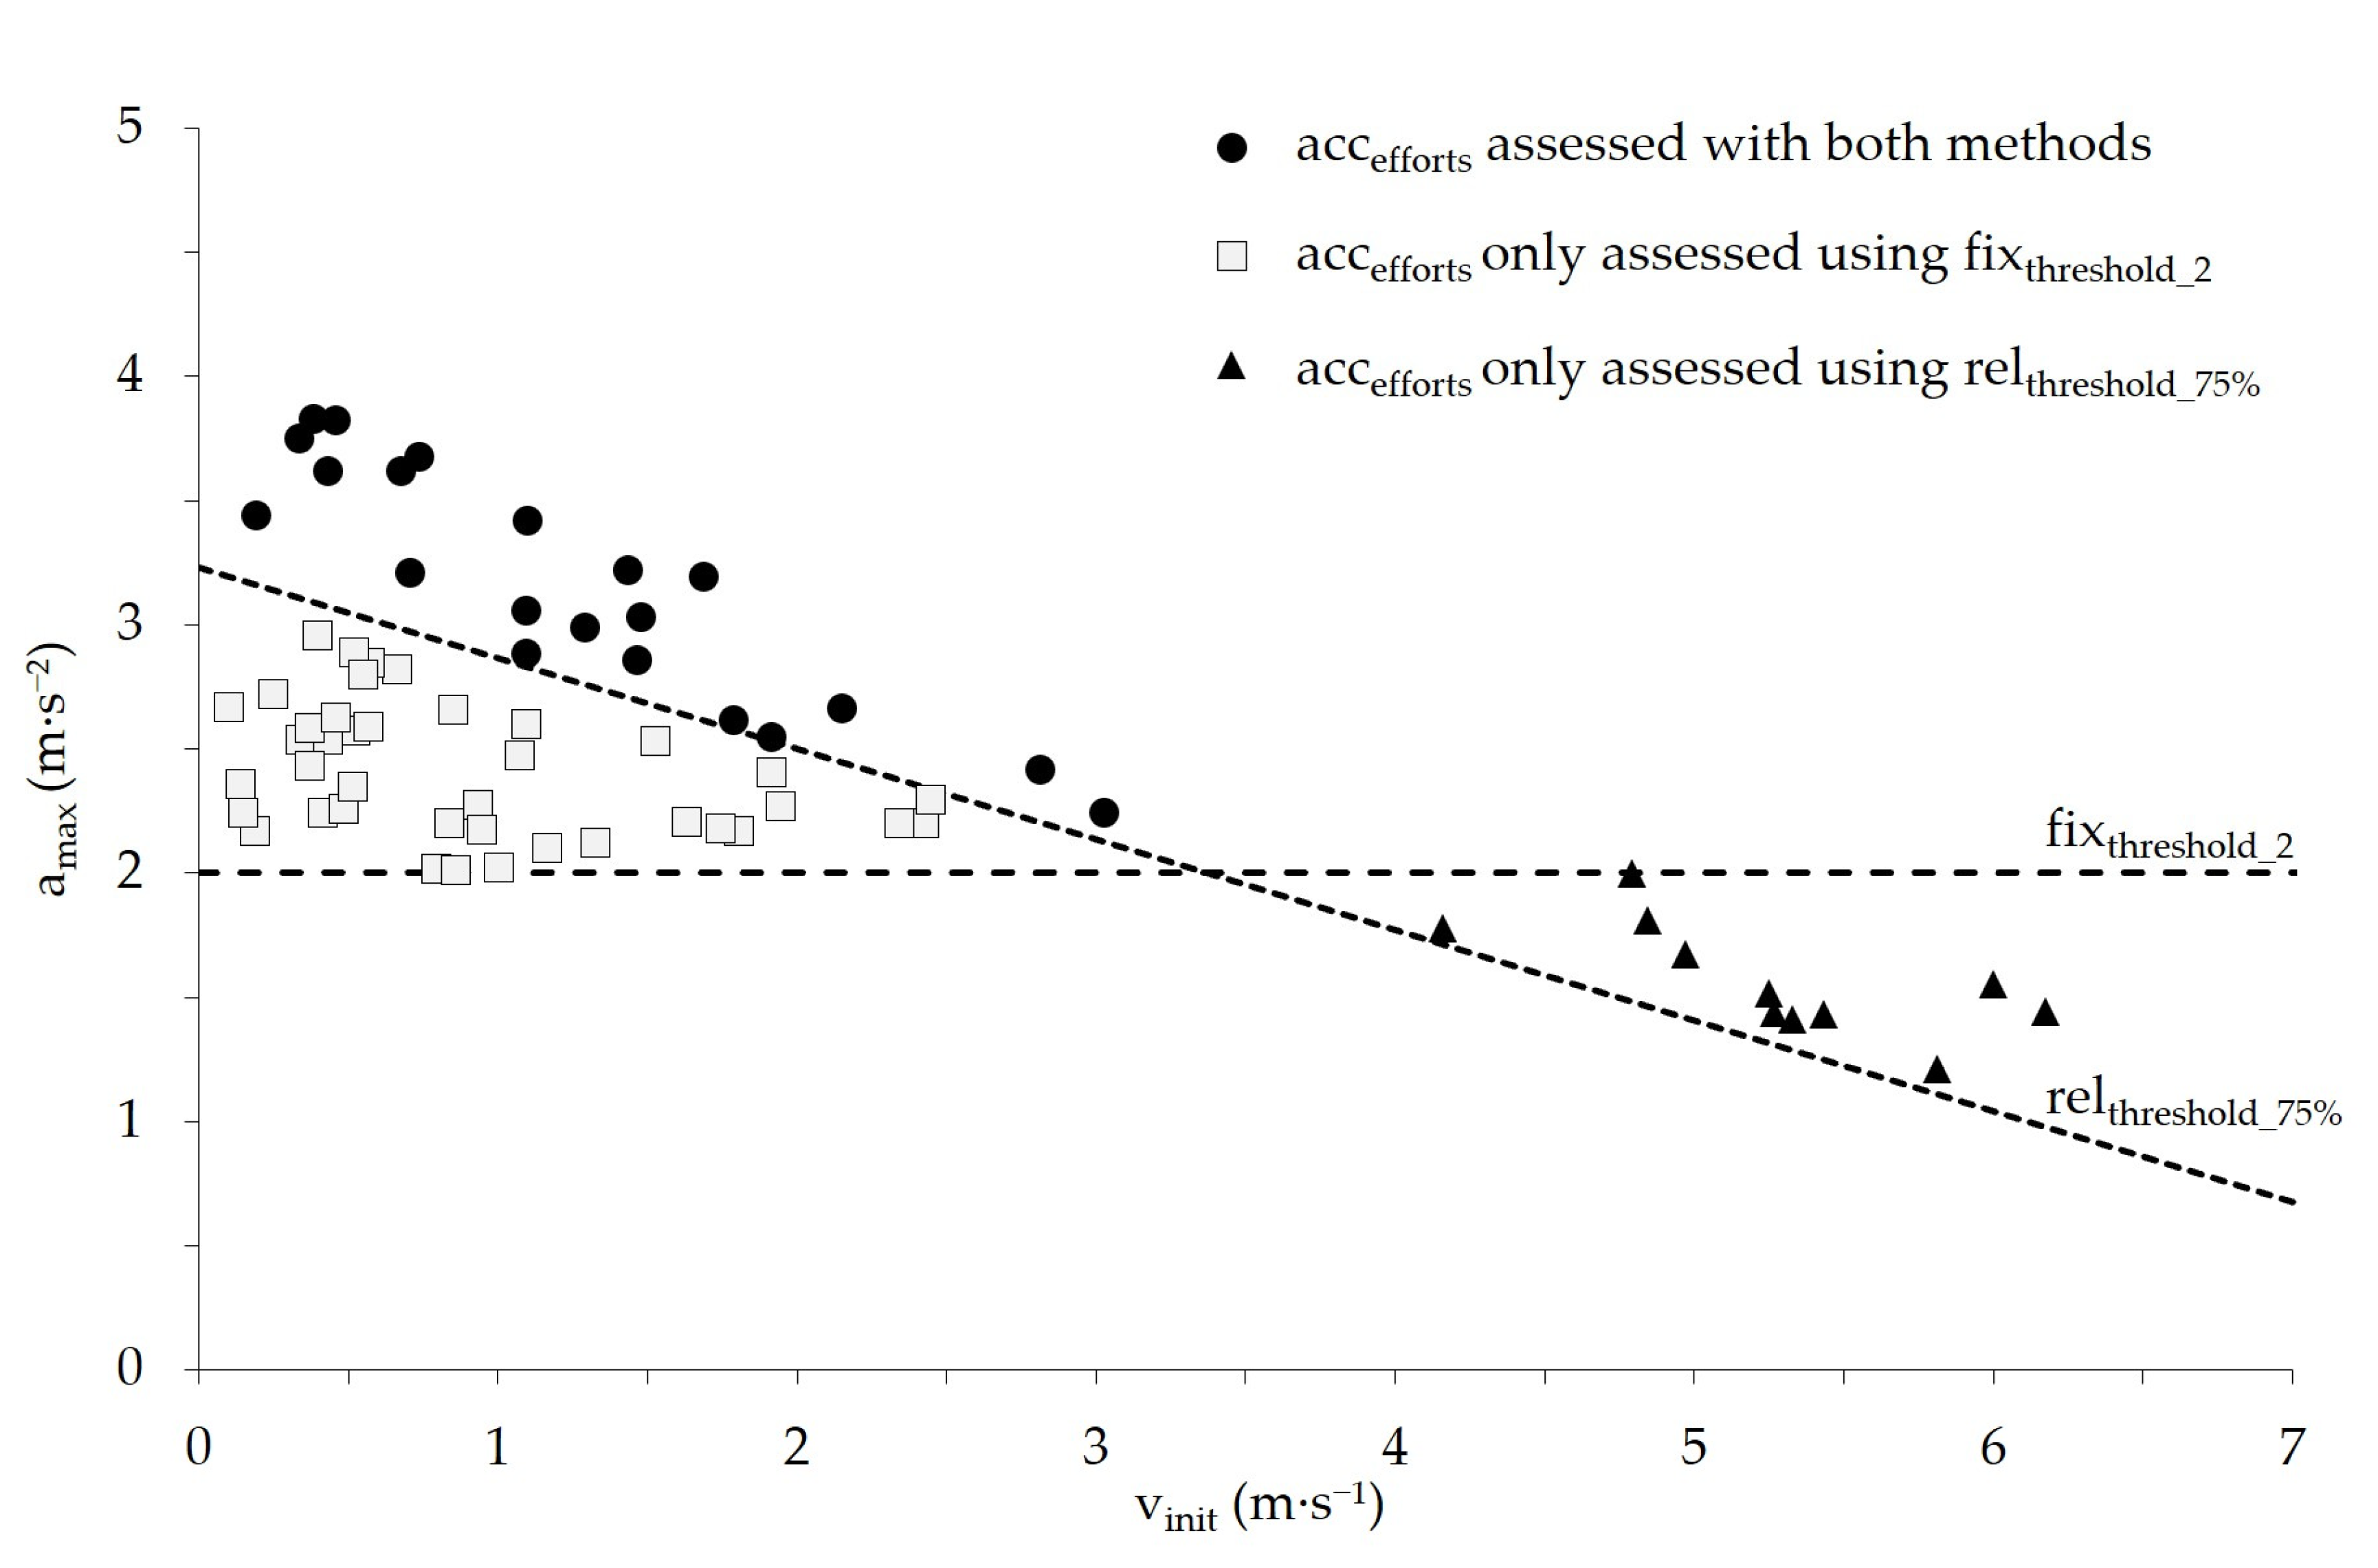
Figure 3 shows an example from one player during a single game, illustrating all accefforts identified using both computational methods. Of all the accefforts shown in this example (Figure 3), 55.6% were detected exclusively using fixthreshold_2 and located below the 75% margin of the team-level modeled amax–vinit capacity regression line (Figure 3; squares), whereas 15.3% were detected exclusively using relthreshold_75% and located below fixthreshold_2 (Figure 3; triangles).

3.4. Positional Differences Using relthreshold_75%

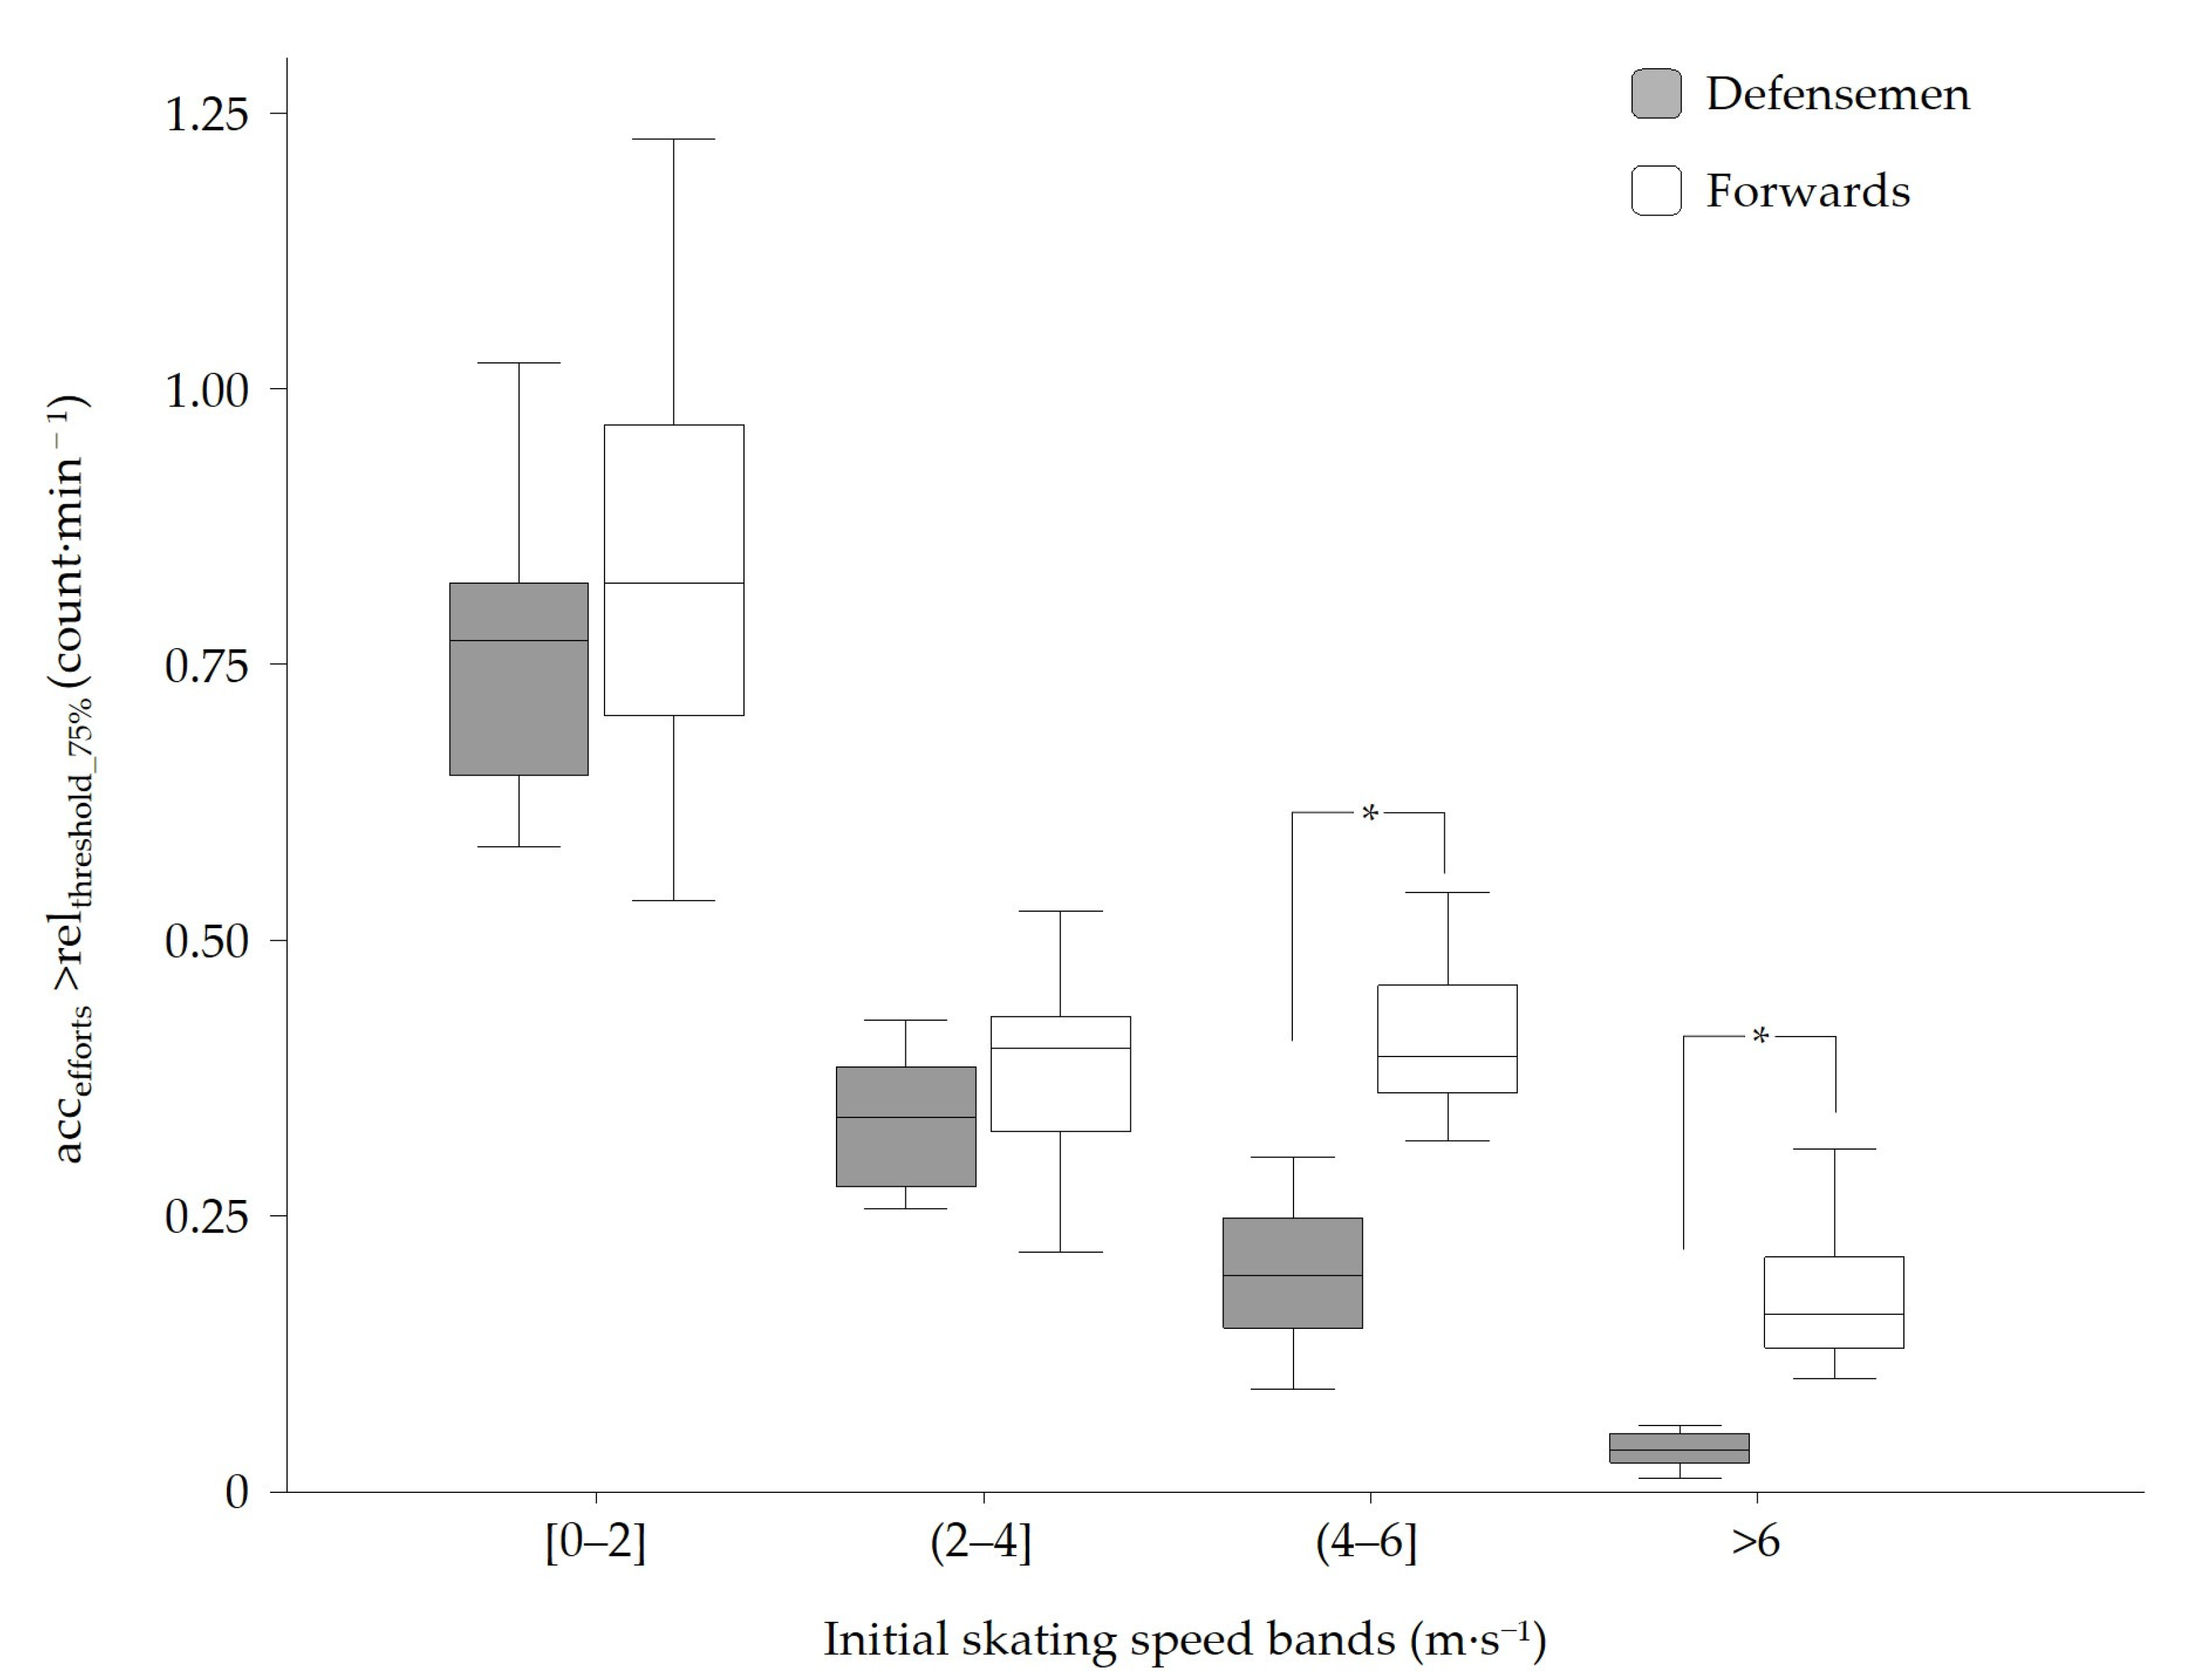
Exploring positional differences using the relthreshold_75% method revealed that, in total (i.e., all initial-skating-speed bands combined), forwards performed significantly more accefforts per minute played than defensemen (1.83 ± 0.33 vs. 1.34 ± 0.23, respectively, t(20) = −3.70, p < 0.001, d = 1.64). A further analysis within the four initial-skating-speed bands is displayed in Figure 4 and showed no statistically significant positional differences in the ‘very low’ (0–2 m·s−1; t(20)= −1.05; p = 0.307) and ‘low’ (2–4 m·s−1; t(20) = −1.45, p = 0.164) initial-skating-speed bands, but a medium-sized effect (d = 0.47 and 0.64, respectively). In the ‘moderate’ (4–6 m·s−1) initial-skating-speed band, forwards performed significantly more accefforts than defensemen (0.42 ± 0.07 vs. 0.20 ± 0.07, respectively; t(20) = −6.65; p <0.001; d = 2.95). In the ‘fast’ (>6 m·s−1) initial-skating-speed band, forwards (M = 0.17; SD = 0.05) also performed significantly more accefforts than defensemen (0.17 ± 0.05 vs. 0.04 ± 0.03, respectively; t(20) = −6.17; p < 0.001; d = 2.74).

4. Discussion

Currently, the influence of initial skating speed on maximal voluntary acceleration capacity is not accounted for when assessing accefforts in ice hockey—which, according to Sonderegger et al. [19] and in accordance with the widely accepted macroscopic inverse linear force–velocity relationship [22,38,39,40], confounds the evaluation of acceffort intensity. Against this background, the aim of the present study was to introduce an established approach from soccer—the relative acceleration threshold—to ice hockey. The gliding nature of ice hockey, as well as the flying and unlimited substitutions, result in a generally faster pace of play compared to other team sports. Thus, accounting for the influence of initial skating speed on maximal voluntary acceleration capacity may be particularly relevant when assessing accefforts using LPS.
In the first part of the study, the initial-skating-speed-dependent maximal voluntary acceleration capacity (amax–vinit capacity), which is considered indicative of the mechanical limit of the neuromuscular system to accelerate at different locomotion speeds, was modeled for the first time in ice hockey using game locomotion data. At the team level, the amax–vinit capacity regression line shows that the maximal voluntary acceleration capacity from a standing start reaches a magnitude of 4.31 ± 0.16 m·s−2 and progressively decreases by 0.48 ± 0.03 m·s−2 for each 1 m·s−1 increase in initial skating speed. The present study confirms the hypothesized influence of initial skating speed on maximal voluntary acceleration capacity in the context of ice hockey. From a theoretical perspective, the modeled amax–vinit capacity suggests that an acceleration magnitude of 2 m·s−2 can only be considered maximal when initiated at a skating speed of approximately 16.9 km·h−1. When initiated from a stationary start, the same acceleration magnitude corresponds to approximately 46.4% of the maximal voluntary acceleration capacity. This illustrates the importance of applying a relative acceleration threshold, as it contextualizes acceleration magnitudes with respect to the underlying skating speed, which in turn is suggested to enable a more valid assessment of acceffort intensity.
This empirical observation is theoretically grounded within the overarching and well-documented principle of the macroscopic force–velocity relationship which characterizes the external mechanical limits of the neuromuscular system to apply force and, consequently, accelerate at different movement speeds in multi-joint acyclic and cyclic ballistic tasks [38], such as pedaling [41,42], squatting [43], or sprinting [39].

4.1. Differences in the Number of Assessed accefforts Between the fixthreshold_2 and relthreshold_75%

In line with the theoretical rationale, differences were observed between the fixthreshold_2 and relthreshold_75% in the number of accefforts assessed. In the present study, the total number of accefforts assessed using the fixthreshold_2 was more than 1.8 times that assessed using the relthreshold_75% (47.9 ± 8.2 vs. 26.0 ± 6.5 per game). This difference was particularly evident in accefforts initiated from ‘very low’ and ‘low’ initial-skating-speeds, where, on average, 2.9 and 1.5 times more accefforts were assessed, respectively. While only a negligible number of accefforts initiated from speeds > 4 m·s−1 were assessed using the fixthreshold_2, the relthreshold_75% captured a considerable proportion of 27.8 ± 6.5% of all its accefforts assessed above this initial speed threshold. These accefforts, which would have been disregarded when applying fixthreshold_2, occurred at ‘moderate’ and ‘fast’ initial skating speeds and were located in close proximity to the modeled mechanical limits of the neuromuscular system. They may therefore be associated with high neuromuscular demands. The number of accefforts identified using the fixthreshold_2 was comparable to the values reported in previous ice hockey studies employing the same threshold [2,16,18]. However, the number of assessed accefforts using the relthreshold_75% was more closely aligned with findings from qualitative, semi-automated, video-based analyses in modern ice hockey, which may point towards greater ecological validity, although the operational definitions differ fundamentally and this interpretation requires caution. For instance, Brocherie et al. [26] evaluated five games using a structured, qualitative observational grid and reported an average of 14 “maximal efforts with drastic forward lean” in elite male international ice hockey. Similarly, but with a slightly different observational grid, Jackson et al. [44] identified an average of 12 “Forward start” and 5 “high/maximal intensity forward skating” per game in male collegiate-level ice hockey. The discrepancy between the number of accefforts reported using fixthreshold_2 and those identified by subjective evaluations could be attributed to the associated bias of the fixthreshold method, which is purported to overestimate the intensity of accefforts initiated from low initial skating speeds, while simultaneously underestimating those from higher speeds. Our data indicate that a considerable proportion of approximately 60% of the accefforts assessed using the fixthreshold_2 were below 75% of the team-level modeled amax–vinit capacity. Consequently, these accefforts were likely not identified by the raters as relevant and/or high-intensity accefforts, which may serve as a possible explanation for the discrepancies in the number of accefforts between fixthreshold_2 and subjective evaluations of trained experts.

4.2. Positional Differences Using relthreshold_75%

In a second step, this study investigated positional differences in the number of accefforts performed between defensemen and forwards when using the relative acceleration threshold. The aim was to evaluate the method’s ability to discriminate between playing positions based on expected positional differences. Previous studies have shown that forwards cover more distance in high-skating-speed zones (>17 km·h−1) [2,16,30,31] and reach higher peak speeds during gameplay [2,16], which provided a basis for hypothesizing that forwards may engage in more frequent accefforts initiated from higher locomotion speeds compared to defensemen. Our results were consistent with this assumption, as we observed only nonsignificant small-to-moderate positional differences in the two lowest initial-skating-speed bands (p = 0.307 and 0.164, respectively), while significant differences with very large effect sizes were identified in the ‘moderate’ and ‘fast’ initial-skating-speed bands. These neuromuscularly intense accefforts initiated at moderate-to-fast skating speed typically occur during forwards’ specific actions, such as forechecking, breakouts, breakaways, dumps in the offensive zone, and offensive rushes, which represent about 32% of the intense accefforts among forwards. Therefore, capturing these efforts is essential to more comprehensively assess players’ in-game acceleration demands and, moreover, to avoid overlooking positional differences.

4.3. Practical Implications and Limitations of the Descriptive Match Analysis Results

Practitioners using LPSs should consider integrating a relative acceleration threshold to assess accefforts into their monitoring routines, as it enables a more comprehensive assessment of the accefforts players are exposed to. As such, this approach supports player health and performance through improved training prescription and load management. Beyond reporting the prevalence of accefforts, this study also characterized the initial speeds from which these efforts were initiated, showing that a substantial proportion (32.2% in forwards and 17.9% in defensemen) were initiated from skating speeds above 14.4 km·h−1. This finding has direct practical relevance, as accefforts initiated from higher initial skating speeds likely result in different skating mechanics, such as altered push-off characteristics, stride frequency, and neuromuscular demands [36,45]; accordingly, practitioners should ensure sufficient exposure to such accefforts in training and consider incorporating more targeted drills to specifically develop this capacity.
The descriptive match analysis results discussed above are subject to several limitations. As the study used official game locomotion data from a single team’s home games, the reported results may have been influenced by the team’s tactical orientation in combination with opponent strength. Therefore, the findings may not generalize to other teams or competitive contexts. Moreover, averaging per-match accefforts across multiple games precluded an examination of match-to-match variability, potentially masking meaningful fluctuations between games. However, due to the highly intermittent character of the game, even when considered on a per-match basis, averaged values obscure the most demanding playing phases that players are subjected to (also known as the “worst-case scenario” [46]). Those conducting future studies should focus their attention on the most intense playing phases and their density to elucidate the games’ peak accefforts demands, which may be more informative and, thus, more adequately prepare athletes for the demands of the game [3] and/or serve as a variable for scientific investigations of the game at a finer level of granularity.

4.4. Methodological Challenges in Detecting Players’ Discrete acceffort and Modeling amax–vinit capacities Using Game Observations

Several methodological decisions related to data processing, discrete acceffort detection, and the modeling of amax–vinit capacitiy warrant consideration. For instance, to reduce noise in positioning data, which is often amplified during highly dynamic, multidirectional movements in team sports [47], data-cleaning techniques are commonly applied; however, different cleaning approaches can substantially alter the acceleration trace [11,48]. Soft filtering will maintain a high level of noise, whereas strong filtering could eliminate important characteristics of a signal [48]. In the present study, the manufacturer’s processed data was used, as it had recently been validated against a robotic sprint device. Furthermore, it is a simple and efficient way to obtain data, which potentially increases the practical use and replicability of the study results for researchers using the same tracking system. However, different filtering settings could have resulted in different acceleration traces, which would in turn influence the study results.
A second aspect concerns the application of the minimal effort duration (MED) for an acceffort to be considered (also known as the ‘dwell time’ [49]). The MED is typically used to avoid classifying measurement-error-related spikes as true efforts [49,50]. As the MED substantially influences the number and type of detected accefforts [49,50,51], its definition is critical. In contrast to the common approach of defining the MED as the time above a threshold, we applied it to the duration of the acceleration zero-crossing. The selected MED of 1.15 s was an assumption-based methodological choice, intended to represent approximately two skating cycles according to a recent biomechanical study [36], and may have resulted in the exclusion of shorter, yet potentially meaningful acceleration efforts.
A further aspect that is often overlooked is the method used to identify the end of an effort [49]. As shown by Fischer-Sonderegger et al. [35], abrupt deceleration phases followed by immediate reacceleration can obscure the acceleration zero-crossing when strong filtering is applied. In such cases, implementing a dip-rule may mitigate filter-induced artifacts and support a more robust discrete acceffort identification.
While the detection of discrete accefforts represents a necessary first step, the subsequent modeling approach for determining amax–vinit capacity based on these events entails additional methodological options, each associated with specific assumptions and trade-offs. One central aspect relates to the context in which the data were obtained. For practical reasons—specifically the availability of game locomotion data—we determined the amax–vinit capacity from game locomotion data rather than from dedicated sprint tests, as originally conducted by Sonderegger et al. [19]. In this regard, previous research in team sports suggested that in situ (i.e., game- or training-based) locomotion data offers a viable means to approximate peak neuromuscular capacities when sufficient exposure is considered. For example, Andrey et al. [25] demonstrated that at least 2–3 games are required in soccer to obtain valid in situ estimates of maximal capacities, whereas Maviel et al. [52] reported that approximately two matches are sufficient in rugby to achieve reliable estimates. However, the minimum exposure required to obtain valid and reliable in situ estimates is likely sport-specific and may additionally be influenced by broader contextual factors, including player motivation, opponent strength, and tactical orientation, among other factors. In the present study, amax–vinit capacities were only considered for players who accumulated at least 100 min of effective playing time—corresponding to approximately six full matches and thus representing a comparatively cautious exposure duration when interpreted relative to minimum exposure requirements reported in other team sports. This minimum exposure criterion was selected to increase the likelihood that the dataset contained a sufficiently broad and dense distribution of maximal accefforts across the relevant skating speed spectrum. In line with this rationale, players with lower playing time showed more variable model fits (i.e., lower R2 values) and larger residual errors, suggesting that insufficient exposure may lead to the incomplete representation of maximal accefforts and, thus, to less valid estimations of the amax–vinit capacity.
Relatedly, once sufficient exposure has produced a broad cloud of in-game accefforts, the estimation of amax–vinit capacity requires additional methodological decisions concerning data point selection for model fitting to reduce the risk of bias arising from positive random measurement error or the inclusion of submaximal accefforts [25]. Accordingly, in the present study, the modeling choices regarding the width of the skating speed subintervals, the number of acceleration efforts retained within each interval, and the exclusion of efforts initiated above 6 m·s−1 were made with the intention of approximating the true yet unknown amax–vinit capacity under in situ conditions. Notably, extrapolating the model beyond the skating speed range used for its derivation is associated with a certain degree of uncertainty.
Taken together, the methodological decisions made in the present study were guided by a combination of previous research in soccer (e.g., [25]) and sport-specific theoretical considerations, and therefore remain assumption-based rather than supported by prior empirical validation in ice hockey. While the concept of the relative acceleration threshold itself is supported by well-established theoretical reasoning and empirical evidence, the validity of the specific methodological approach used in the present study for discrete acceffort detection and the subsequent modeling of amax–vinit capacities remains to be validated in the context of ice hockey, which was beyond the scope of the present investigation. Future research should therefore seek to determine the most valid methodological approach to discrete acceffort detection and the subsequent modeling of amax–vinit capacities in ice hockey, ideally supported by validation against a gold-standard motion capture system or cross-referenced with synchronized video footage to qualitatively evaluate the accuracy of different methodological operationalizations.
Against this background, combined with the use of a convenience sample comprising 17 professional male ice hockey players from a single team, the relative acceleration threshold (Equation (1)) determined in the present study should be interpreted with caution. Its generalizability to other populations or contexts—particularly those employing different tracking technologies or data-processing procedures—remains unclear. Future studies should employ larger and more heterogeneous samples across multiple teams, leagues, and competitive levels to establish normative reference values. In the meantime, practitioners are advised to derive team-specific or individual thresholds where feasible, either through dedicated isolated sprint tests [19] or through systematic training and/or game observations, as applied in the present study.

5. Conclusions

This study provides additional empirical evidence, for the first time in the context of ice hockey, that maximal voluntary acceleration capacity is linearly affected by the locomotion speed preceding an acceffort and, therefore, underpins the importance of employing a relthreshold adjusted to the initial skating speed to assess accefforts. Accordingly, we suggest using a relative acceleration threshold to assess accefforts, as it provides a context-sensitive characterization of acceffort magnitude relative to the initial skating speed, which in turn enables high-intensity accefforts to be identified across a wide range of skating speeds, while avoiding a potential overestimation of submaximal accefforts initiated from ‘standing’ or ‘very low’ skating speeds. The ability to assess accefforts initiated at higher skating speeds is particularly relevant for forwards, as it reflects their typical in-game actions and reveals positional differences in accefforts demands that would otherwise remain undetected. In summary, our observations align with established theoretical frameworks and previous empirical evidence from soccer, suggesting that applying a relative acceleration threshold offers a conceptually more valid approach to assessing accefforts and is therefore of interest for both applied ice hockey research and training monitoring purposes. Nevertheless, the methodological approach adopted in the present study for detecting players’ discrete accefforts and for modeling amax–vinit capacities to derive the relative acceleration threshold should be regarded as exploratory, and further refinement and formal validation in ice hockey remain necessary.

Author Contributions

Conceptualization, C.B. and M.T.; methodology, C.B., K.F.-S., and M.T.; investigation, C.B. and Q.S.; resources, M.T. and W.T.; data curation, Q.S.; writing—original draft preparation, C.B.; writing—review and editing, M.T., K.F.-S., and W.T.; visualization, C.B.; supervision, W.T. and M.T.; project administration, M.T. All authors have read and agreed to the published version of the manuscript.

Funding

This research received no external funding.

Institutional Review Board Statement

The study was conducted in accordance with the Declaration of Helsinki, and the protocol was approved by the Institutional Review Board of the Swiss Federal Institute of Sport Magglingen (245_LSP_09_2024).

Informed Consent Statement

Informed consent was obtained from all subjects involved in the study.

Data Availability Statement

The data presented in this study are available on request from the corresponding author. Access is restricted for ethical and privacy reasons, as positional tracking data in conjunction with publicly available video material may enable the re-identification of participants.

Acknowledgments

We thank the Lausanne Hockey Club and their athletes for their collaboration. We would also like to thank Michael Elmer, Sport Science Collaborator at Kinexon, for his effort in providing an API (Application Programming Interfaces) that greatly facilitated the downloading of raw data from the manufacturer’s software for subsequent analyses. Special thanks are extended to Lionel Castella and Martin Rumo for programming the MATLAB code. During the preparation of this manuscript, the authors used ChatGPT (version 5.2; OpenAI, San Francisco, CA, USA) in order to improve clarity of writing and coherence before it was proofread by Ishbel Ingram, to whom we express our gratitude. The authors have reviewed and edited the output and take full responsibility for the content of this publication.

Conflicts of Interest

The authors declare no conflicts of interest.

Abbreviations

The following abbreviations are used in this manuscript:
LPSLocal Positioning System
acceffortsAcceleration efforts
relthresholdRelative acceleration threshold
fixthresholdFixed acceleration threshold
amax–vinitMaximal acceleration–initial velocity
adistanceAcceleration effort distance
adurationAcceleration effort duration
vdeltaSpeed increase during the acceleration effort
IIHFInternational Ice Hockey Federation
MEDMinimal effort duration

References

  1. Byrkjedal, P.T.; Bjørnsen, T.; Luteberget, L.S.; Lindberg, K.; Ivarsson, A.; Haukali, E.; Spencer, M. Association between Physical Performance Tests and External Load During Scrimmages in Highly Trained Youth Ice Hockey Players. Int. J. Sports Physiol. Perform. 2023, 18, 47–54. [Google Scholar] [CrossRef] [PubMed]
  2. Gamble, A.S.D.; Bigg, J.L.; Nyman, D.L.E.; Spriet, L.L. Local Positioning System-Derived External Load of Female and Male Varsity Ice Hockey Players During Regular Season Games. Front. Physiol. 2022, 13, 831723. [Google Scholar] [CrossRef] [PubMed]
  3. Staunton, C.A.; Björklund, G. A Framework for the Standardization of Game Analysis in Ice Hockey. Int. J. Sports Physiol. Perform. 2023, 18, 458–464. [Google Scholar] [CrossRef] [PubMed]
  4. Osgnach, C.; Di Prampero, P.E.; Zamparo, P.; Morin, J.B.; Pavei, G. Mechanical and Metabolic Power in Accelerated Running-Part II: Team Sports. Eur. J. Appl. Physiol. 2024, 124, 417–431. [Google Scholar] [CrossRef]
  5. Douglas, A.; Johnston, K.; Baker, J.; Rotondi, M.A.; Jamnik, V.K.; Macpherson, A.K. On-Ice Measures of External Load in Relation to Match Outcome in Elite Female Ice Hockey. Sports 2019, 7, 173. [Google Scholar] [CrossRef]
  6. Gamble, A.S.D.; Thompson, K.M.A.; Bigg, J.L.; Pignanelli, C.; Spriet, L.L.; Burr, J.F. Investigating the Relevance of Maximal Speed and Acceleration in Varsity-Level Female Ice Hockey Players. Int. J. Sports Physiol. Perform. 2024, 19, 496–504. [Google Scholar] [CrossRef]
  7. Harper, D.J.; Carling, C.; Kiely, J. High-Intensity Acceleration and Deceleration Demands in Elite Team Sports Competitive Match Play: A Systematic Review and Meta-Analysis of Observational Studies. Sports Med. 2019, 49, 1923–1947. [Google Scholar] [CrossRef]
  8. Akenhead, R.; Nassis, G.P. Training Load and Player Monitoring in High-Level Football: Current Practice and Perceptions. Int. J. Sports Physiol. Perform. 2016, 11, 587–593. [Google Scholar] [CrossRef]
  9. Cardinale, M.; Varley, M.C. Wearable Training-Monitoring Technology: Applications, Challenges, and Opportunities. Int. J. Sports Physiol. Perform. 2017, 12, S255–S262. [Google Scholar] [CrossRef]
  10. Delves, R.I.M.; Aughey, R.J.; Ball, K.; Duthie, G.M. The Quantification of Acceleration Events in Elite Team Sport: A Systematic Review. Sports Med. Open 2021, 7, 45. [Google Scholar] [CrossRef]
  11. Ellens, S.; Middleton, K.; Gastin, P.B.; Varley, M.C. Techniques to Derive and Clean Acceleration and Deceleration Data of Athlete Tracking Technologies in Team Sports: A Scoping Review. J. Sports Sci. 2022, 40, 1772–1800. [Google Scholar] [CrossRef]
  12. Rago, V.; Vigh-Larsen, J.F.; Deylami, K.; Muschinsky, A.; Mohr, M. Use of Rating of Perceived Exertion-Based Training Load in Elite Ice Hockey Training and Match-Play. J. Strength Cond. Res. 2022, 36, 2837–2843. [Google Scholar] [CrossRef]
  13. Allard, P.; Martinez, R.; Deguire, S.; Tremblay, J. In-Season Session Training Load Relative to Match Load in Professional Ice Hockey. J. Strength Cond. Res. 2022, 36, 486–492. [Google Scholar] [CrossRef] [PubMed]
  14. Rago, V.; Muschinsky, A.; Deylami, K.; Vigh-Larsen, J.F.; Mohr, M. Game Demands of a Professional Ice Hockey Team with Special Emphasis on Fatigue Development and Playing Position. J. Hum. Kinet. 2022, 84, 195–205. [Google Scholar] [CrossRef] [PubMed]
  15. Byrkjedal, P.T.; Luteberget, L.S.; Bjørnsen, T.; Ivarsson, A.; Spencer, M. Simulated Game-Based Ice Hockey Match Design (Scrimmage) Elicits Greater Intensity in External Load Parameters Compared with Official Matches. Front. Sports Act. Living 2022, 4, 822127. [Google Scholar] [CrossRef] [PubMed]
  16. Gamble, A.S.D.; Bigg, J.L.; Spriet, L.L. Maintenance of External and Internal Loads, and Physical Performance During an Overtime Championship Game in Men’s Varsity Ice Hockey. Ann. Sports Med. Res. 2021, 8, 1182. [Google Scholar]
  17. Nyman, D.L.E.; Gamble, A.S.D.; Bigg, J.L.; Boyd, L.A.; Vanderheyden, A.J.; Spriet, L.L. Carbohydrate Mouth-Rinsing Improves Overtime Physical Performance in Male Ice Hockey Players During on-Ice Scrimmages. Front. Nutr. 2022, 9, 792708. [Google Scholar] [CrossRef]
  18. Keiner, M.; Kierot, M.; Stendahl, M.; Brauner, T.; Suchomel, T.J. Maximum Strength and Power as Determinants of Match Skating Performance in Elite Youth Ice Hockey Players. J. Strength Cond. Res. 2024, 38, 1090–1094. [Google Scholar] [CrossRef]
  19. Sonderegger, K.; Tschopp, M.; Taube, W. The Challenge of Evaluating the Intensity of Short Actions in Soccer: A New Methodological Approach Using Percentage Acceleration. PLoS ONE 2016, 11, e0166534. [Google Scholar] [CrossRef]
  20. Morin, J.B.; Le Mat, Y.; Osgnach, C.; Barnabò, A.; Pilati, A.; Samozino, P.; Di Prampero, P.E. Individual Acceleration-Speed Profile in-Situ: A Proof of Concept in Professional Football Players. J. Biomech. 2021, 123, 110524. [Google Scholar] [CrossRef]
  21. Di Prampero, P.E.; Osgnach, C.; Morin, J.B.; Zamparo, P.; Pavei, G. Mechanical and Metabolic Power in Accelerated Running-Part I: The 100-M Dash. Eur. J. Appl. Physiol. 2023, 123, 2473–2481. [Google Scholar] [CrossRef]
  22. Rabita, G.; Dorel, S.; Slawinski, J.; Sàez-De-Villarreal, E.; Couturier, A.; Samozino, P.; Morin, J.B. Sprint Mechanics in World-Class Athletes: A New Insight into the Limits of Human Locomotion. Scand. J. Med. Sci. Sports 2015, 25, 583–594. [Google Scholar] [CrossRef] [PubMed]
  23. Martínez-Cabrera, F.I.; Núñez-Sánchez, F.J.; Losada, J.; Otero-Esquina, C.; Sánchez, H.; De Hoyo, M. Use of Individual Relative Thresholds to Assess Acceleration in Young Soccer Players According to Initial Speed. J. Strength Cond. Res. 2021, 35, 1110–1118. [Google Scholar] [CrossRef] [PubMed]
  24. Silva, H.; Nakamura, F.Y.; Serpiello, F.R.; Ribeiro, J.; Roriz, P.; Marcelino, R. Adapting the Percentage Intensity Method to Assess Accelerations and Decelerations in Football: Moving Beyond Absolute and Arbitrary Thresholds. Sports Biomech. 2024, 23, 3514–3525. [Google Scholar] [CrossRef] [PubMed]
  25. Andrey, P.; Fischer-Sonderegger, K.; Taube, W.; Tschopp, M. Determining Relative Population-Specific Acceleration Intensity Thresholds in Soccer Using Game Locomotion Data: Validation of a New Method Using Data from Male Youth Elite Players. PLoS ONE 2025, 20, e0321275. [Google Scholar] [CrossRef]
  26. Brocherie, F.; Girard, O.; Millet, G.P. Updated Analysis of Changes in Locomotor Activities across Periods in an International Ice Hockey Game. Biol. Sport 2018, 35, 261–267. [Google Scholar] [CrossRef]
  27. Perez, J.; Brocherie, F.; Couturier, A.; Guilhem, G. International Matches Elicit Stable Mechanical Workload in High-Level Female Ice Hockey. Biol. Sport 2022, 39, 857–864. [Google Scholar] [CrossRef]
  28. Vigh-Larsen, J.F.; Mohr, M. The Physiology of Ice Hockey Performance: An Update. Scand. J. Med. Sci. Sports 2024, 34, e14284. [Google Scholar] [CrossRef]
  29. Vigh-Larsen, J.F.; Ermidis, G.; Rago, V.; Randers, M.B.; Fransson, D.; Nielsen, J.L.; Gliemann, L.; Piil, J.F.; Morris, N.B.; De Paoli, F.V.; et al. Muscle Metabolism and Fatigue During Simulated Ice Hockey Match-Play in Elite Players. Med. Sci. Sports Exerc. 2020, 52, 2162–2171. [Google Scholar] [CrossRef]
  30. Douglas, A.S.; Kennedy, C.R. Tracking in-Match Movement Demands Using Local Positioning System in World-Class Men’s Ice Hockey. J. Strength Cond. Res. 2020, 34, 639–646. [Google Scholar] [CrossRef]
  31. Lignell, E.; Fransson, D.; Krustrup, P.; Mohr, M. Analysis of High-Intensity Skating in Top-Class Ice Hockey Match-Play in Relation to Training Status and Muscle Damage. J. Strength Cond. Res. 2018, 32, 1303–1310. [Google Scholar] [CrossRef] [PubMed]
  32. Johnston, R.D.; Gabbett, T.J.; Jenkins, D.G. Applied Sport Science of Rugby League. Sports Med. 2014, 44, 1087–1100. [Google Scholar] [CrossRef] [PubMed]
  33. Gamble, A.S.D.; Bigg, J.L.; Pignanelli, C.; Nyman, D.L.E.; Burr, J.F.; Spriet, L.L. Reliability and Validity of an Indoor Local Positioning System for Measuring External Load in Ice Hockey Players. Eur. J. Sport Sci. 2023, 23, 311–318. [Google Scholar] [CrossRef] [PubMed]
  34. Fischer-Sonderegger, K.; Taube, W.; Rumo, M.; Tschopp, M. Measuring Physical Load in Soccer: Strengths and Limitations of 3 Different Methods. Int. J. Sports Physiol. Perform. 2019, 14, 627–634. [Google Scholar] [CrossRef]
  35. Fischer-Sonderegger, K.; Taube, W.; Rumo, M.; Tschopp, M. How Far from the Gold Standard? Comparing the Accuracy of a Local Position Measurement (Lpm) System and a 15 Hz Gps to a Laser for Measuring Acceleration and Running Speed During Team Sports. PLoS ONE 2021, 16, e0250549. [Google Scholar] [CrossRef]
  36. Kaartinen, S.; Vartiainen, P.; Venojärvi, M.; Tikkanen, H.; Stenroth, L. Kinematic and Muscle Activity Patterns of Maximal Ice Hockey Skating Acceleration. Int. J. Perform. Anal. Sport 2025, 1–16. [Google Scholar] [CrossRef]
  37. Hopkins, W.G.; Marshall, S.W.; Batterham, A.M.; Hanin, J. Progressive Statistics for Studies in Sports Medicine and Exercise Science. Med. Sci. Sports Exerc. 2009, 41, 3–13. [Google Scholar] [CrossRef]
  38. Jaric, S. Force-Velocity Relationship of Muscles Performing Multi-Joint Maximum Performance Tasks. Int. J. Sports Med. 2015, 36, 699–704. [Google Scholar] [CrossRef]
  39. Samozino, P.; Rabita, G.; Dorel, S.; Slawinski, J.; Peyrot, N.; Saez De Villarreal, E.; Morin, J.B. A Simple Method for Measuring Power, Force, Velocity Properties, and Mechanical Effectiveness in Sprint Running. Scand. J. Med. Sci. Sports 2016, 26, 648–658. [Google Scholar] [CrossRef]
  40. Cross, M.R.; Brughelli, M.; Samozino, P.; Morin, J.B. Methods of Power-Force-Velocity Profiling During Sprint Running: A Narrative Review. Sports Med. 2017, 47, 1255–1269. [Google Scholar] [CrossRef]
  41. Vandewalle, H.; Peres, G.; Heller, J.; Panel, J.; Monod, H. Force-Velocity Relationship and Maximal Power on a Cycle Ergometer. Correlation with the Height of a Vertical Jump. Eur. J. Appl. Physiol. Occup. Physiol. 1987, 56, 650–656. [Google Scholar] [CrossRef] [PubMed]
  42. Dorel, S.; Couturier, A.; Lacour, J.R.; Vandewalle, H.; Hautier, C.; Hug, F. Force-Velocity Relationship in Cycling Revisited: Benefit of Two-Dimensional Pedal Forces Analysis. Med. Sci. Sports Exerc. 2010, 42, 1174–1183. [Google Scholar] [CrossRef] [PubMed]
  43. Rivière, J.R.; Rossi, J.; Jimenez-Reyes, P.; Morin, J.B.; Samozino, P. Where Does the One-Repetition Maximum Exist on the Force-Velocity Relationship in Squat? Int. J. Sports Med. 2017, 38, 1035–1043. [Google Scholar] [CrossRef]
  44. Jackson, J.; Snydmiller, G.; Game, A.; Gervais, P.; Bell, G. Investigation of Positional Differences in Fitness of Male University Ice Hockey Players and the Frequency, Time Spent and Heart Rate of Movement Patterns During Competition. Int. J. Kinesiol. Sports Sci. 2017, 5, 6–15. [Google Scholar] [CrossRef]
  45. Budarick, A.R.; Shell, J.R.; Robbins, S.M.K.; Wu, T.; Renaud, P.J.; Pearsall, D.J. Ice Hockey Skating Sprints: Run to Glide Mechanics of High Calibre Male and Female Athletes. Sports Biomech. 2020, 19, 601–617. [Google Scholar] [CrossRef]
  46. Whitehead, S.; Till, K.; Weaving, D.; Jones, B. The Use of Microtechnology to Quantify the Peak Match Demands of the Football Codes: A Systematic Review. Sports Med. 2018, 48, 2549–2575. [Google Scholar] [CrossRef]
  47. Rico-González, M.; Los Arcos, A.; Clemente, F.M.; Rojas-Valverde, D.; Pino-Ortega, J. Accuracy and Reliability of Local Positioning Systems for Measuring Sport Movement Patterns in Stadium-Scale: A Systematic Review. Appl. Sci. 2020, 10, 5994. [Google Scholar] [CrossRef]
  48. Ellens, S.; Carey, D.L.; Gastin, P.B.; Varley, M.C. Effect of Data-Processing Methods on Acceleration Summary Metrics of Gnss Devices in Elite Australian Football. Sensors 2024, 24, 4383. [Google Scholar] [CrossRef]
  49. Varley, M.C.; Jaspers, A.; Helsen, W.F.; Malone, J.J. Methodological Considerations When Quantifying High-Intensity Efforts in Team Sport Using Global Positioning System Technology. Int. J. Sports Physiol. Perform. 2017, 12, 1059–1068. [Google Scholar] [CrossRef]
  50. Ellens, S.; Carey, D.; Gastin, P.; Varley, M.C. Changing the Criteria Applied to Acceleration and Deceleration Efforts Changes the Types of Player Actions Detected. Sci. Med. Footb. 2024, 8, 52–59. [Google Scholar] [CrossRef]
  51. Silva, H.; Nakamura, F.Y.; Ribeiro, J.; Asian-Clemente, J.; Roriz, P.; Marcelino, R. Using Minimum Effort Duration Can Compromise the Analysis of Acceleration and Deceleration Demands in Football. Int. J. Perform. Anal. Sport 2023, 23, 125–137. [Google Scholar] [CrossRef]
  52. Maviel, C.; Couderc, A.; Duché, P.; Morin, J.B.; Vercruyssen, F. Establishing Reliable Acceleration-Speed Profiles: Minimum Data Requirements in Rugby Union Matches. J. Sports Sci. 2024, 42, 2451–2456. [Google Scholar] [CrossRef]
Figure 1. Determination of subjects’ individual initial-skating-speed-dependent maximal voluntary acceleration capacity (amax–vinit capacity) regression line. (A) All acceleration efforts (accefforts) plotted with maximal acceleration (amax) versus initial skating speed (vinit). (B) For each 1 m·s−1 vinit subinterval up to 6 m·s−1, the four highest accefforts were selected (black, dots). (C) First linear regression with 95% prediction intervals fitted to the selected accefforts. (D) Final linear regression after exclusion of outliers outside the 95% prediction interval (black, cross), yielding the subjects’ individual amax–vinit capacity regression line.
Sports 14 00062 g001
Figure 2. Individually modeled amax–vinit capacity regression lines of the n = 17 ice hockey players (gray solid lines), the corresponding team-level averaged amax–vinit capacity regression line (black, dashed line), and the resulting team-specific relthreshold_75% (black, dotted line).
Sports 14 00062 g002
Figure 3. Visualization of accefforts of one representative player assessed during a single game based on the applied computation methods. The player’s effective playing time in this game was 17:59 min. Accefforts concurrently assessed using both methods are shown as black circles (n = 21), accefforts only assessed using relthreshold_75% appear as triangles (n = 11), and accefforts assessed only using fixthreshold_2 appear as squares (n = 40).
Sports 14 00062 g003
Figure 4. Boxplots showing positional differences between forwards and defensemen in the number of accefforts above the relthreshold_75%. Values are expressed per minute across the four skating speed bands. Boxes indicate the medians and interquartile ranges; whiskers show the spread. * Significant positional difference (p < 0.05).
Sports 14 00062 g004
Table 1. Descriptive statistics for both computational methods showing the mean number of accefforts per effective playing minute, paired t-test results, and Cohen’s d (±95% confidence Interval) overall and across different initial-skating-speed bands.
fixthreshold_2relthreshold_75%
Initial-Skating-Speed Band
(m·s−1)
accefforts
(Count·min−1)
accefforts
(Count·min−1)
t(21)pCohen’s d
(±95% CI)
All3.03 ± 0.391.65 ± 0.38−20.100.0014.29 (2.93 to 5.63)
(0–2) very low2.45 ± 0.320.82 ± 0.19−33.030.0017.04 (4.88 to 9.19)
(2–4) low0.54 ± 0.120.37 ± 0.09−14.410.0013.07 (2.05 to 4.08)
(4–6) moderate0.04 ± 0.030.33 ± 0.1312.460.001−2.66 (−3.55 to −1.74)
>6 fast0.00 ± 0.000.13 ± 0.087.520.001−1.60 (−2.23 to −0.96)
Disclaimer/Publisher’s Note: The statements, opinions and data contained in all publications are solely those of the individual author(s) and contributor(s) and not of MDPI and/or the editor(s). MDPI and/or the editor(s) disclaim responsibility for any injury to people or property resulting from any ideas, methods, instructions or products referred to in the content.