


Exploring the Acute Effects of the Daily Mile™ vs. Shuttle Runs on Children’s Cognitive and Affective Responses


Abstract
1. Introduction
2. Materials and Methods
2.1. Study Design and Participants
2.2. Anthropometric Measures
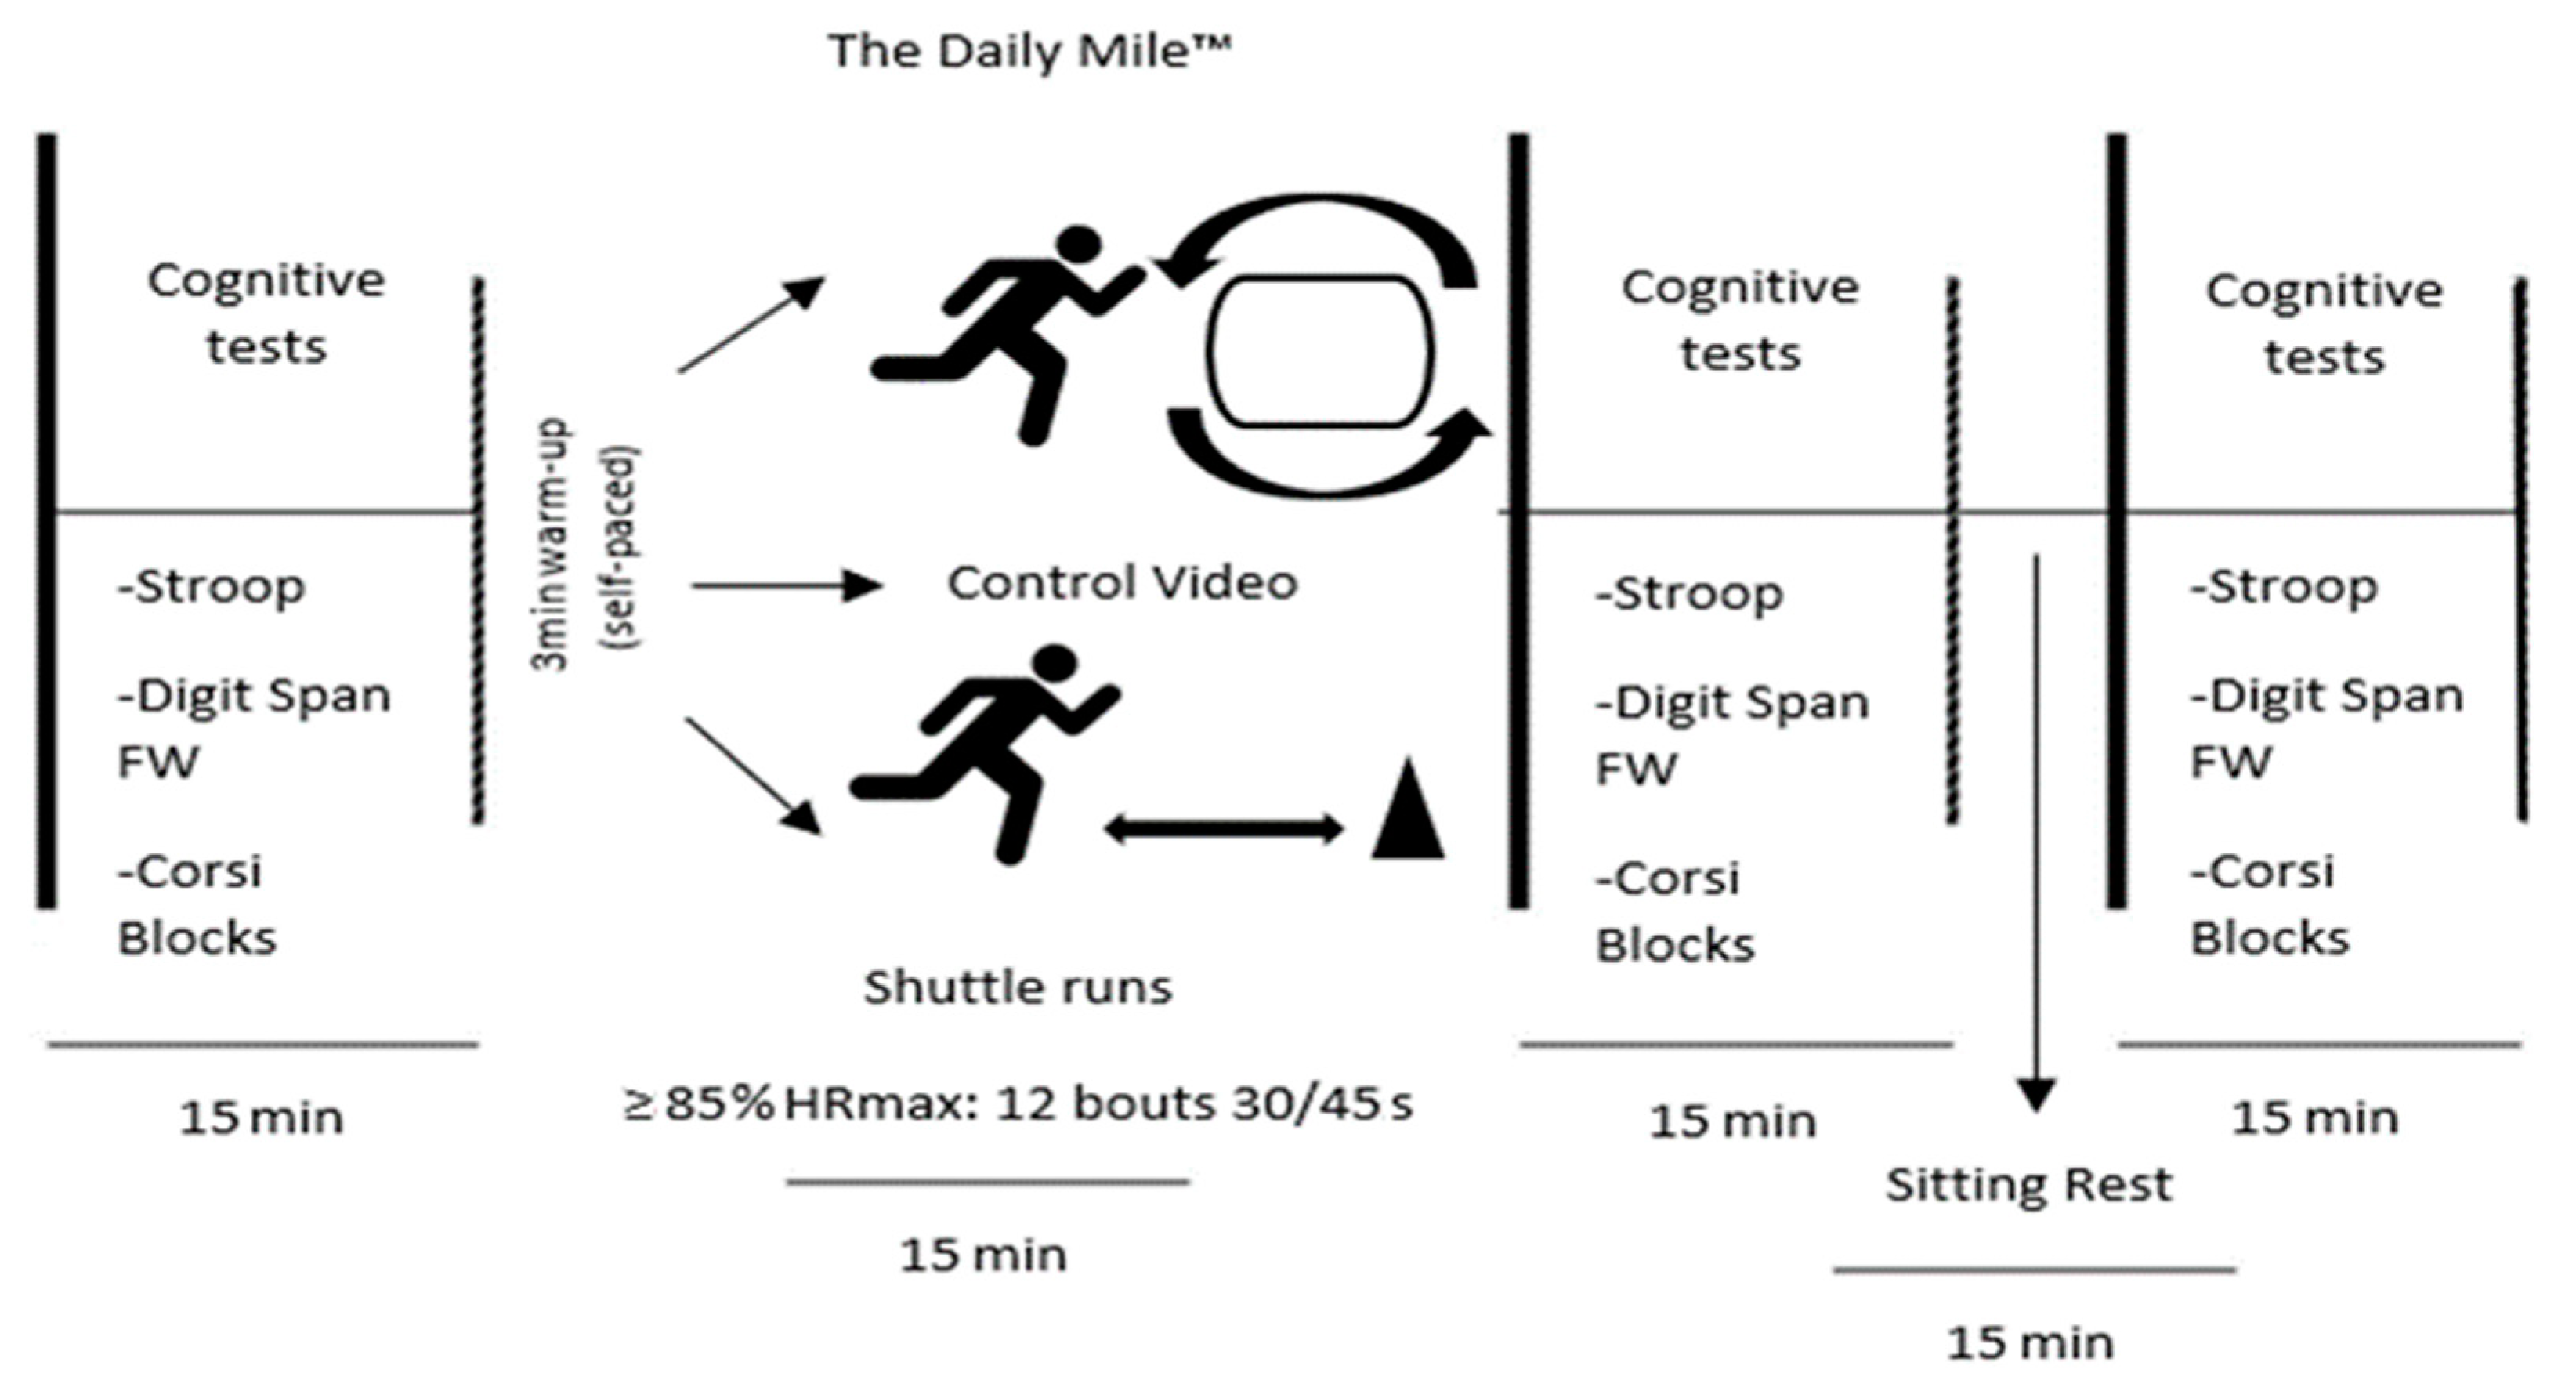
2.3. Procedures
2.4. PA Protocol
2.5. Assessment of Inhibitory Responses and Verbal and Visual Recall
2.5.1. Stroop Colour–Word Test
2.5.2. Digit Span
2.5.3. Corsi Block Test
2.6. Arousal, Affect, and Effort Scales (FAS, FS, and RPE)
2.6.1. FS and FAS Scales
2.6.2. RPE
2.7. Statistical Procedures
3. Results
3.1. Strop Test, Digit Span, and Corsi Blocks Outcomes
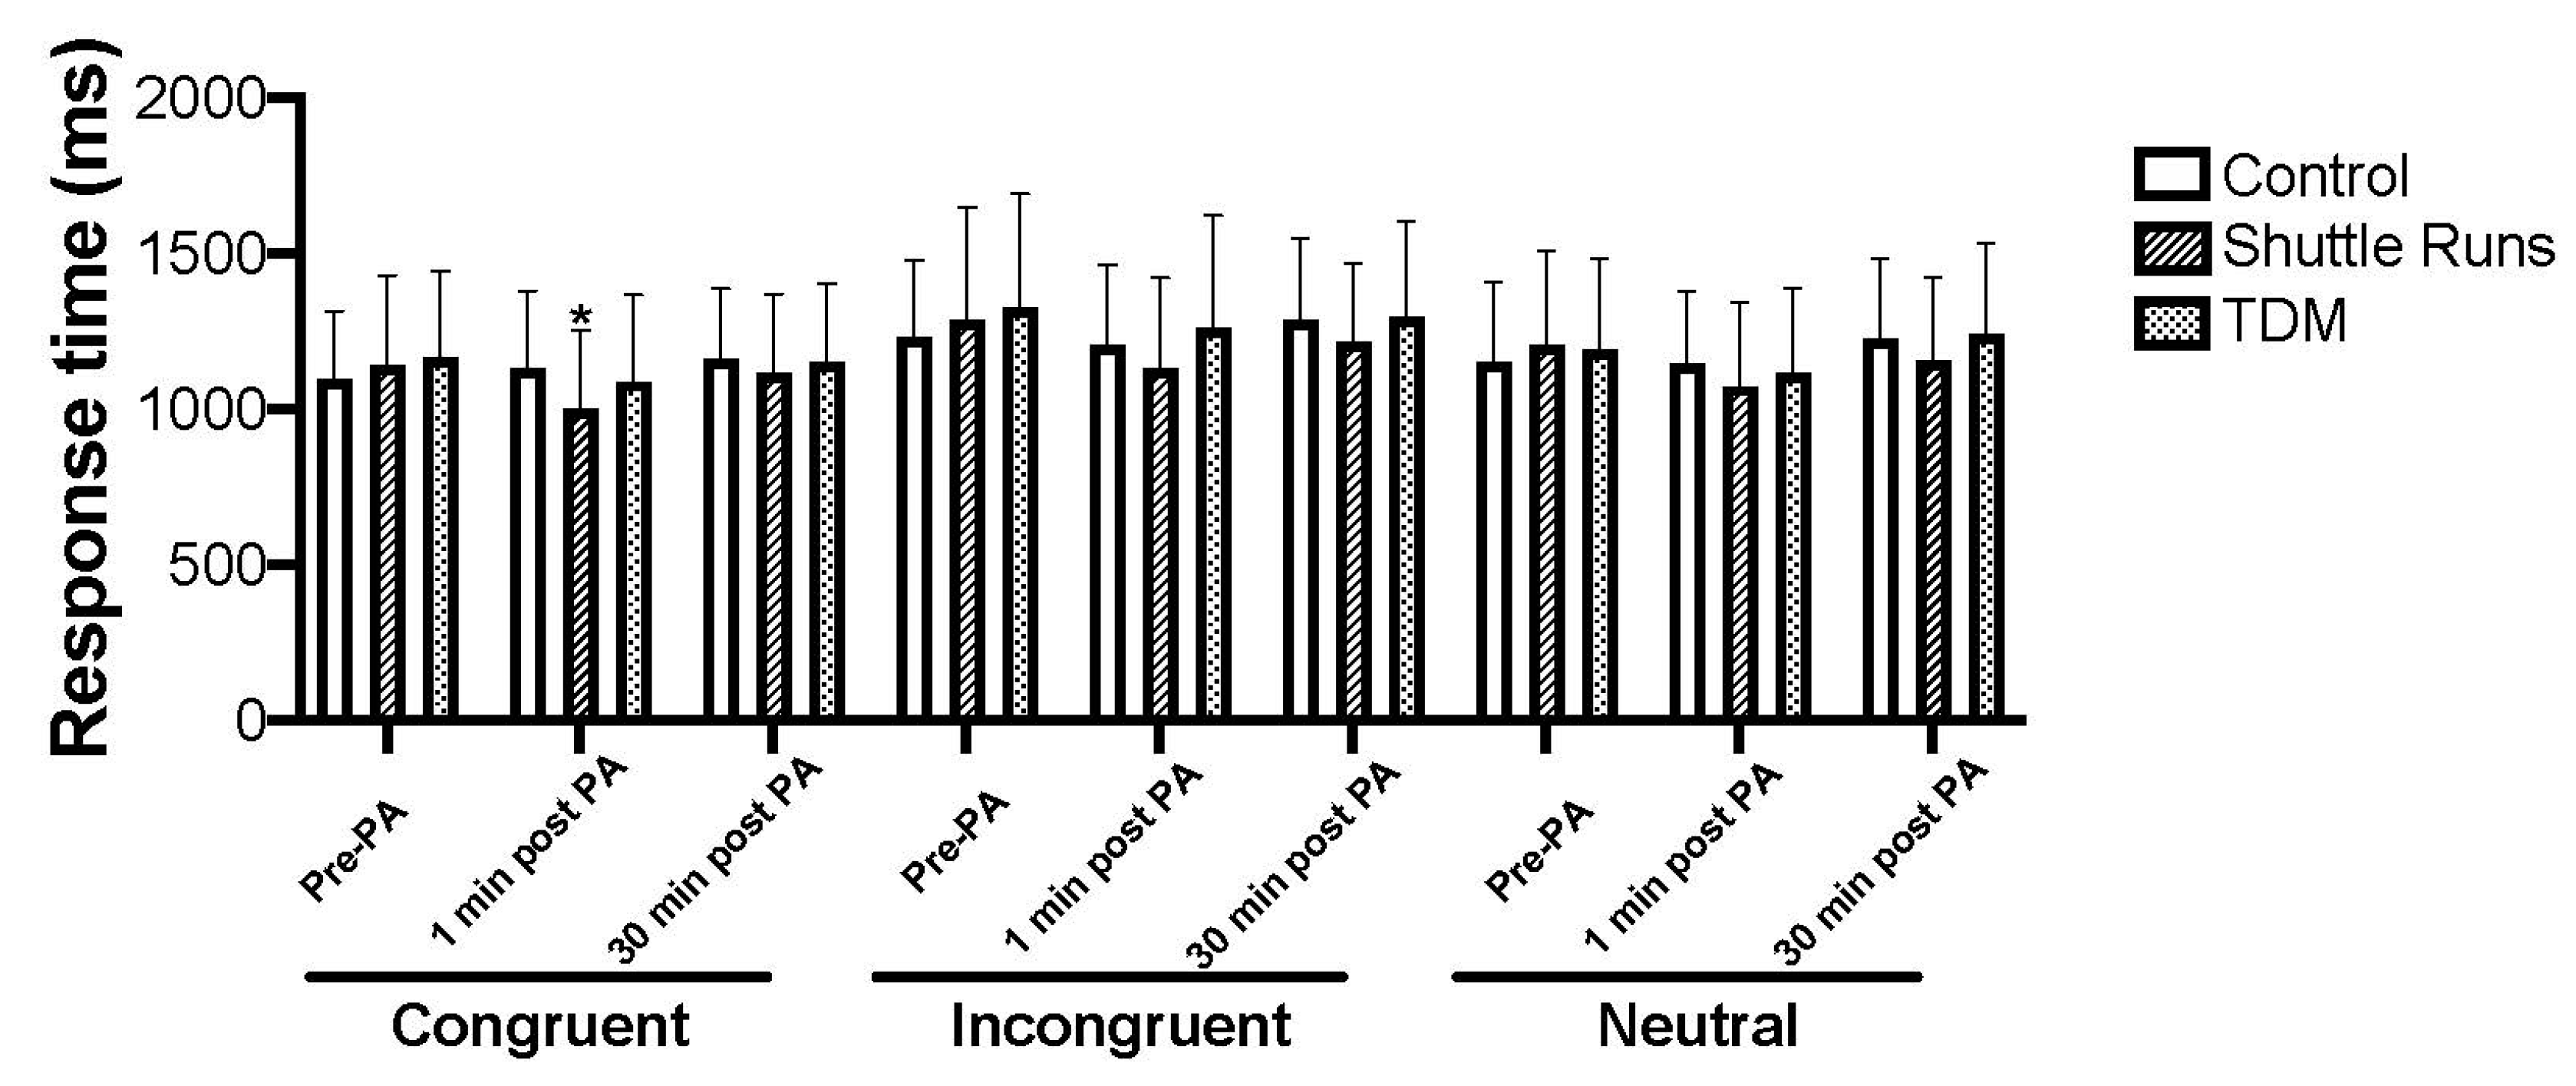
3.1.1. Stroop Test
3.1.2. Digit Span
3.1.3. Corsi Blocks

| Control | Shuttle Runs | TDM | |||||||
|---|---|---|---|---|---|---|---|---|---|
| Pre-PA | 1 min | 30 min | Pre-PA | 1 min | 30 min | Pre-PA | 1 min | 30 min | |
| Stroop test | |||||||||
| Congruent | 1097 (216) | 1130 (249) | 1158 (228) | 1118 (296) | *●991 (257) | ●1086 (255) | 1155 (279) | ●1072 (272) | 1125 (248) |
| Boys Girls | 1042 (185) 1150 (237) | 1052 (202) 1203 (273) | 1145 (255) 1171 (209) | 1036 (262) 1219 (310) | 936 (210) 1059 (286) | 1033 (208) 1153 (297) | 1098 (270) 1232 (283) | 1024 (232) 1136 (318) | 1075 (231) 1192 (265) |
| Accuracy | 0.90 (0.1) | 0.92 (0.1) | 0.89 (0.1) | 0.94 (0.1) | 0.93 (0.1) | 0.91 (0.1) | 0.93 (0.1) | 0.91 (0.1) | 0.93 (0.1) |
| Boys Girls | 0.90 (0.1) 0.90 (0.1) | 0.90 (0.1) 0.93 (0.1) | 0.88 (0.1) 0.92 (0.1) | 0.95 (0.1) 0.94 (0.1) | 0.93 (0.1) 0.94 (0.1) | 0.90 (0.1) 0.93 (0.1) | 0.92 (0.1) 0.93 (0.1) | 0.88 (0.1) 0.95 (0.1) | 0.91 (0.1) 0.94 (0.1) |
| Incongruent | 1231 (246) | 1207 (255) | 1284 (263) | 1269 (364) | 1109 (282) | 1186 (254) | 1306 (359) | 1234 (347) | 1272 (305) |
| Boys Girls | 1116 (161) 1337 (268) | 1166 (246) 1245 (267) | 1225 (259) 1338 (265) | 1181 (276) 1378 (437) | 1007 (211) 1235 (314) | 1117 (217) 1271 (279) | 1122 (305) 1417 (407) | 1165 (241) 1327 (447) | 1199 (228) 1370 (373) |
| Accuracy | 0.89 (0.1) | 0.90 (0.1) | 0.86 (0.1) | 0.90 (0.1) | 0.93 (0.1) | 0.90 (0.1) | 0.88 (0.1) | 0.89 (0.1) | 0.88(0.1) |
| Boys Girls | 0.87 (0.2) 0.92 (0.1) | 0.88 (0.1) 0.92 (0.1) | 0.85 (0.1) 0.88 (0.1) | 0.90 (0.1) 0.90 (0.1) | 0.91 (0.1) 0.94 (0.1) | 0.94 (0.1) 0.84 (0.1) | 0.90 (0.1) 0.86 (0.1) | 0.91 (0.1) 0.88 (0.1) | 0.89 (0.1) 0.87 (0.1) |
| Neutral | 1149 (257) | 1146 (233) | 1228 (257) | 1185 (307) | ●1059 (262) | ●1128 (264) | 1178 (285) | ●1108 (261) | ●1213 (285) |
| Boys Girls | 1138 (291) 1160 (233) | 1129 (243) 1162 (232) | 1178 (265) 1274 (260) | 1013 (255) 1282 (315) | 1013 (255) 1116 (269) | 1087 (215) 1181 (316) | 1114 (237) 1264 (330) | 1069 (214) 1159 (316) | 1144 (261) 1305 (300) |
| Accuracy | 0.90 (0.1) | 0.92 (0.1) | 0.87 (0.1) | 0.92 (0.1) | 0.94 (0.1) | 0.92 (0.1) | 0.92 (0.1) | 0.92 (0.1) | 0.91 (0.1) |
| Boys Girls | 0.87 (0.1) 0.93 (0.1) | 0.89 (0.1) 0.94 (0.1) | 0.86 (0.1) 0.88 (0.1) | 0.92 (0.1) 0.92 (0.1) | 0.93 (0.1) 0.95 (0.1) | 0.91 (0.1) 0.94 (0.1) | 0.92 (0.1) 0.93 (1) | 0.90 (0.1) 0.94 (0.1) | 0.90 (0.1) 0.92 (0.1) |
| Digit Span | |||||||||
| Correct sequences | 5.2 (2.4) | 5.2 (2.4) | 5.1 (2.3) | 4.9 (1.7) | 5.3 (1.9) | 5.2 (1.6) | 5.0 (1.9) | 5.5 (2.2) | 5.4 (2.1) |
| Boys Girls | 4.7 (2.1) 5.7 (2.6) | 4.8 (1.8) 5.7 (2.8) | 4.7 (2.2) 5.4 (2.5) | 4.3 (1.7) 5.6 (1.4) | 4.5 (1.6) 6.3 (1.7) | 5.2 (1.8) 5.2 (1.5) | 4.8 (2.0) 5.3 (1.9) | 5.6 (2.3) 5.4 (2.0) | 5.2 (2.4) 5.8 (1.7) |
| Memory span | 5 (1.2) | 5.1 (1.4) | 4.9 (1.4) | 4.8 (1) | 5.2 (1) | 5.2 (1) | 5.1 (1.2) | 5.4 (1.3) | 5.2 (1.2) |
| Boys Girls | 4.7 (1.1) 5.2 (1.4) | 4.9 (1.1) 5.3 (1.7) | 4.6 (1.3) 5.7 (2.6) | 4.3 (1) 5.2 (1) | 4.8 (1) 5.8 (1) | 5.2 (1) 5.1 (1) | 4.8 (1.2) 5.4 (1.2) | 5.4 (1.5) 5.3 (1.1) | 5.0 (1.4) 5.5 (1.0) |
| Corsi | |||||||||
| Block span | 5.1 (1) | 5 (1.1) | 4.6 (1.3) | 4.9 (1.1) | 4.9 (1.1) | 4.7 (0.8) | 4.9 (1.1) | 4.8 (1.0) | 4.8 (0.8) |
| Boys Girls | 5.3 (1) 5 (1) | 4.9 (1.4) 5 (1) | 4.5 (1.6) 4.6 (1) | 5.1 (1.2) 4.5 (0.78) | 5.1 (1.1) 4.7 (1) | 4.8 (1) 4.6 (1) | 4.9 (1.4) 4.8 (0.6) | 4.9 (1.1) 4.8 (1.0) | 4.9 (0.8) 4.8 (0.8) |
| Correct trials | 6.8 (1.7) | 6.5 (2) | 5.9 (2) | 6.4 (1.7) | 6.7 (1.8) | 6.5 (1.7) | 6.6 (1.8) | 6.5 (1.7) | 6.4 (1.7) |
| Boys Girls | 6.7 (1.9) 6.9 (1.6) | 6.6 (2.3) 6.5 (1.8) | 5.9 (2) 5.9 (2) | 6.9 (1.7) 5.6 (1.5) | 7.1 (1.9) 6.2 (1.6) | 6.8 (1.8) 6.2 (1.5) | 6.7 (2.1) 6.3 (1.5) | 6.7 (1.9) 6.2 (1.3) | 6.6 (1.7) 6.3 (1.7) |
| Memory span | 4.4 (0.8) | 4.3 (1) | 4 (1) | 4.2 (0.8) | 4.3 (0.9) | 4.2 (0.8) | 4.3 (1) | 4.2 (0.8) | 4.1 (0.8) |
| Boys Girls | 4.4 (1) 4.5 (1) | 4.3 (1.1) 4.3 (1) | 4 (1) 4 (1) | 4.5 (0.8) 3.9 (0.8) | 4.4 (0.9) 4 (0.8) | 4.4 (0.9) 4.0 (0.8) | 4.3 (1.1) 4.2 (0.7) | 4.4 (1.0) 4.1 (0.7) | 4.3 (0.8) 4.1 (0.8) |

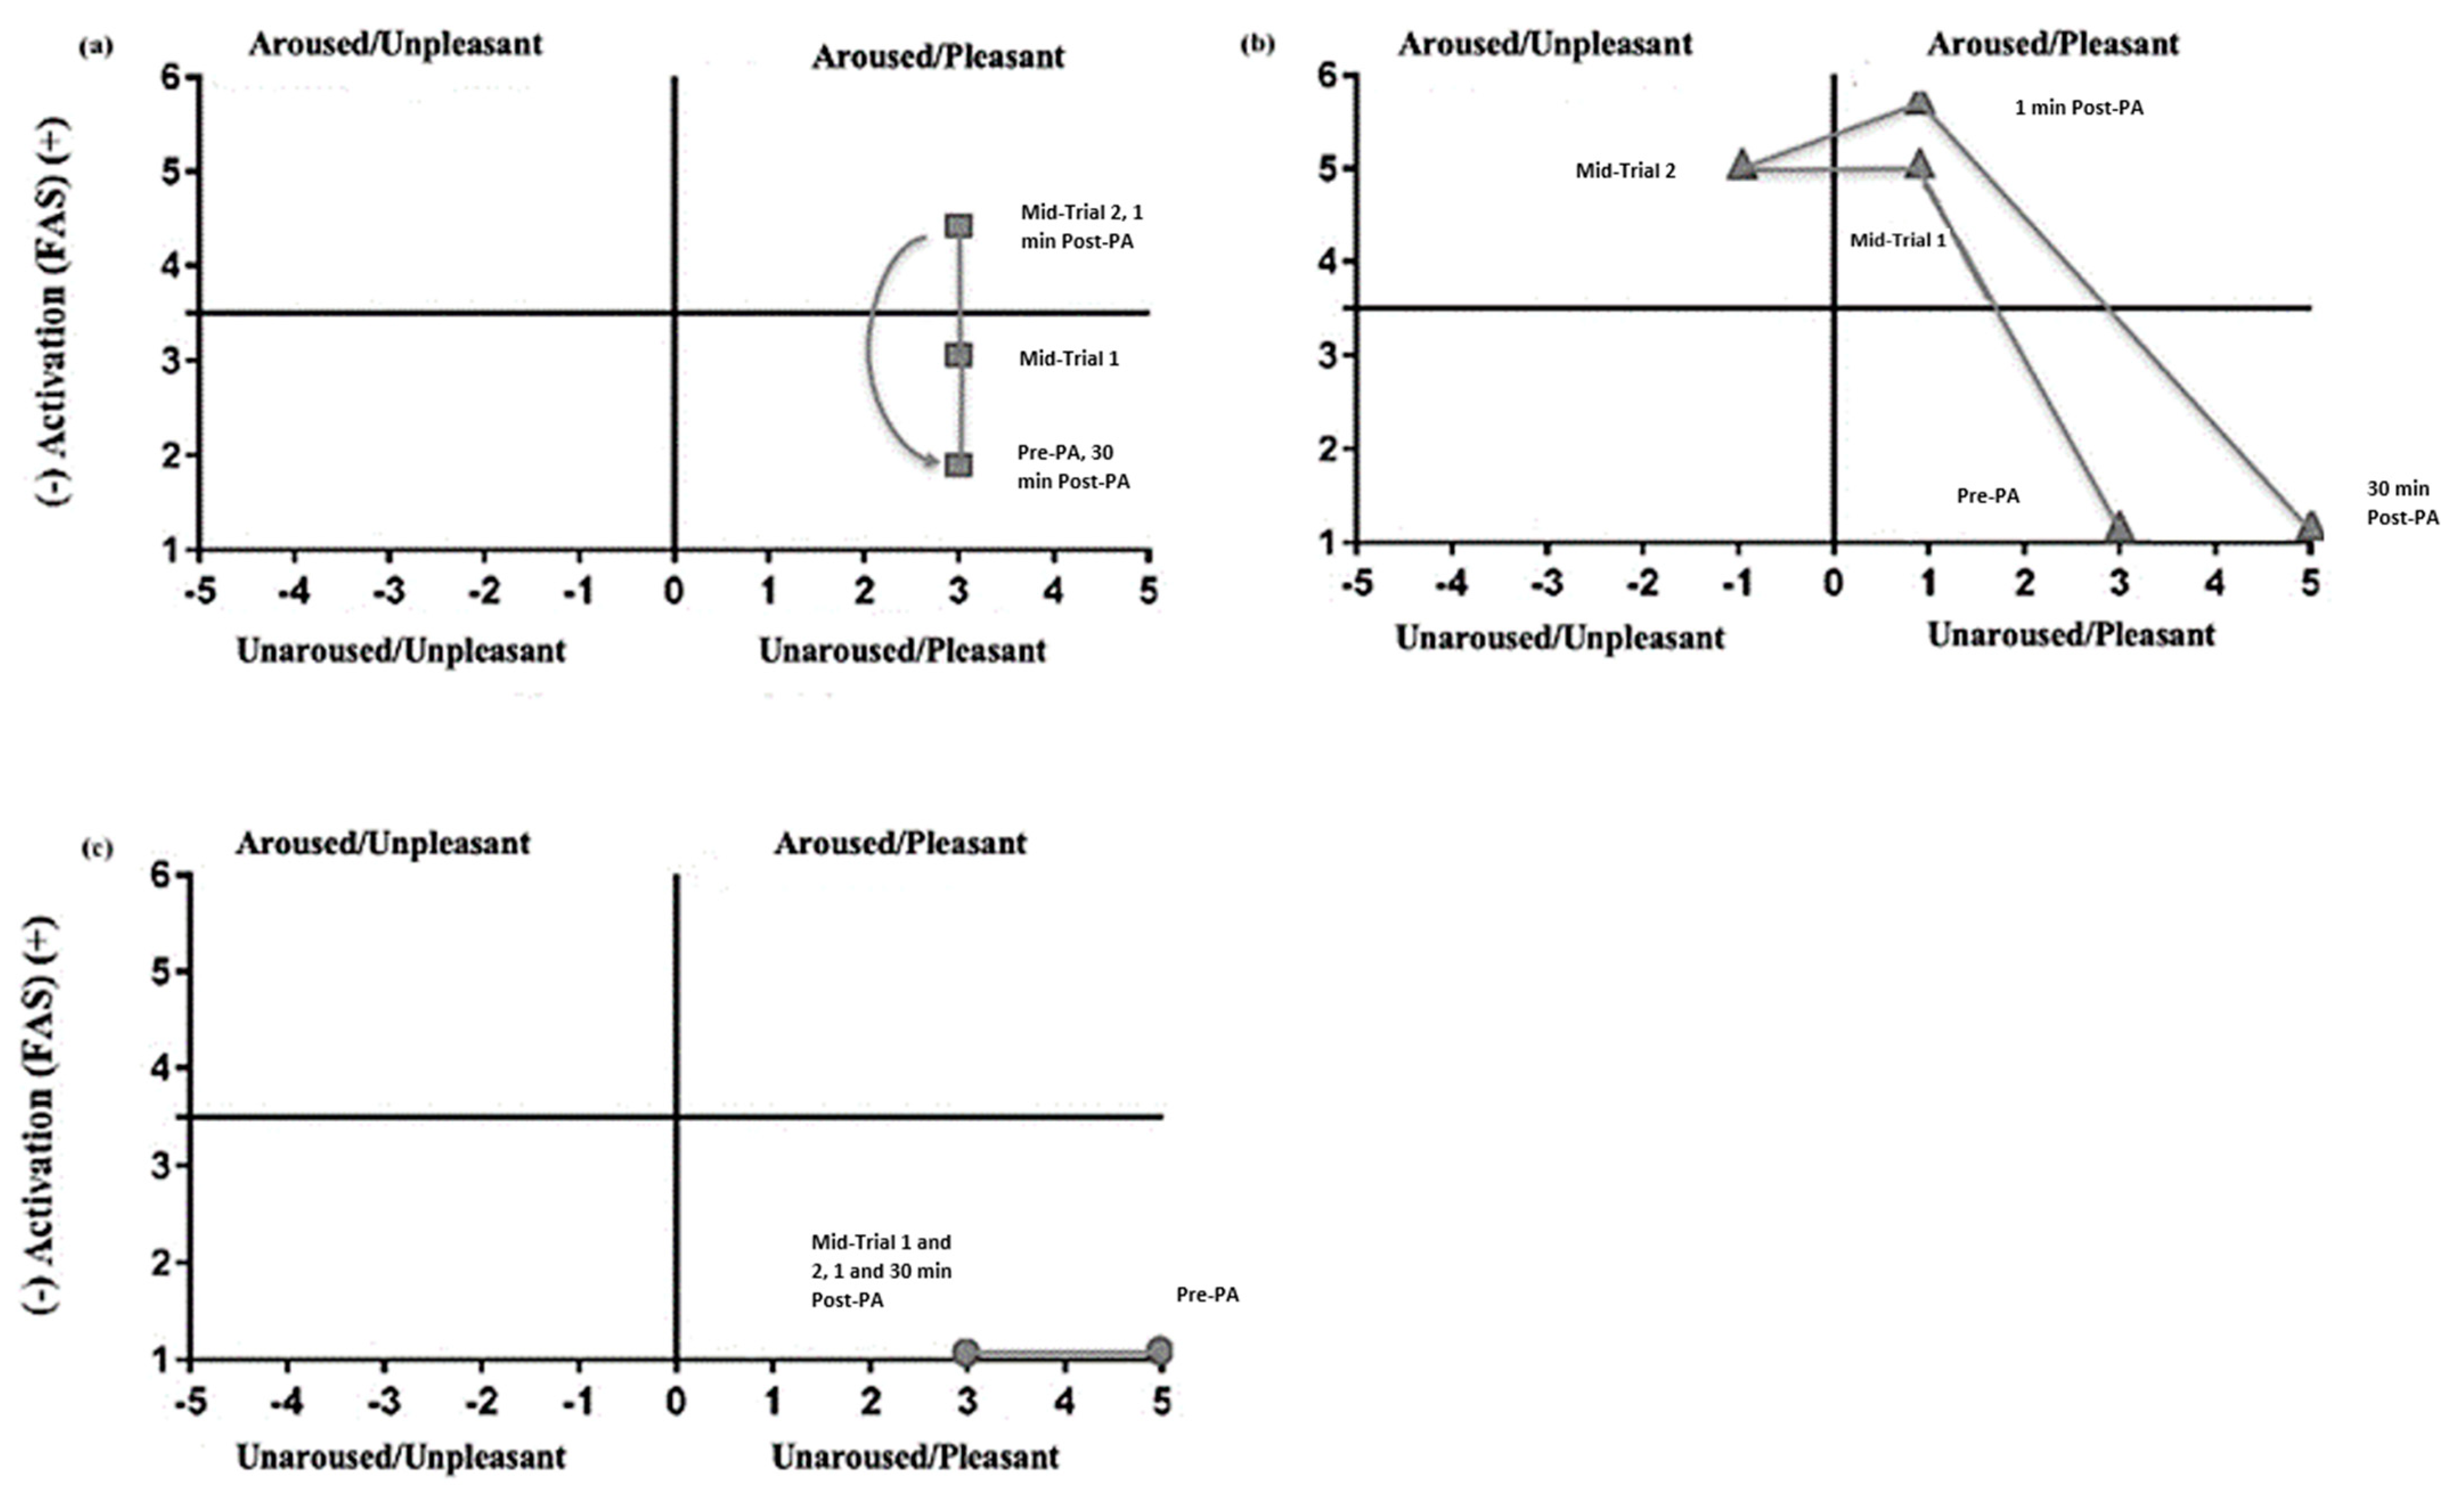
3.2. Affect Scales
3.2.1. Feeling Scale
3.2.2. Felt Arousal Scale
3.2.3. RPE
| Pre-PA | Mid-Trial 1 | Mid-Trial 2 | 1 min Post-PA | 30 min Post-PA | ||
|---|---|---|---|---|---|---|
| FS | Control | 5 (3–5) | 3 (2–5) * | 3 (3–5) * | 3 (3–4) * | 3 (3–5) |
| Shuttle runs | 3 (1–5) | 1 (0–3) * | −1 (−3–1) * | 1 (−4–3) * | 5 (3–5) * | |
| TDM | 3 (3–5) | 3 (1–3) * | 3 (1–3) * | 3 (1–4) * | 3 (3–5) | |
| FAS | Control | 1 (1–2) | 1 (1–1) | 1 (1–1) | 1 (1–2) | 1 (1–2) |
| Shuttle runs | 1 (1–2) | 5 (4–6) * | 5 (5–6) * | 6 (3–6) * | 1 (1–2) | |
| TDM | 2 (1–2) | 3 (3–4) * | 4.5 (3–6) * | 4.5 (1–6) * | 2 (1–3) | |
| OMNI | Control | 0 (0–0) | 0 (0–0) | 0 (0–0) | 0 (0–0) | 0 (0–0) |
| Shuttle runs | 0 (0–0) | 7 (4–8) * | 8 (7–9) * | 9 (8–10) * | 0 (0–2) * | |
| TDM | 0 (0–0) | 6 (4–6) * | 6 (6–8) * | 6 (4–8) * | 0 (0–1) * | |

4. Discussion
5. Strengths and Limitations
6. Conclusions
Author Contributions
Funding
Institutional Review Board Statement
Informed Consent Statement
Data Availability Statement
Conflicts of Interest
References
- Diamond, A. Executive functions. Annu. Rev. Psychol. 2013, 64, 135–168. [Google Scholar] [CrossRef] [PubMed]
- Howie, E.K.; Beets, M.W.; Pate, R.R. Acute classroom exercise breaks improve on-task behavior in 4th and 5th grade students: A dose–response. Ment. Health Phys. Act. 2014, 7, 65–71. [Google Scholar] [CrossRef]
- Tomporowski, P.D.; McCullick, B.; Pendleton, D.M.; Pesce, C. Exercise and children’s cognition: The role of exercise characteristics and a place for metacognition. J. Sport Health Sci. 2015, 4, 47–55. [Google Scholar] [CrossRef]
- Ai, J.; Chen, F.; Hsieh, S.; Kao, S.; Chen, A.; Hung, T.; Chang, Y.-K. The Effect of Acute High-Intensity Interval Training on Executive Function: A Systematic Review. Int. J. Environ. Res. Public Health 2021, 18, 3593. [Google Scholar] [CrossRef]
- Williams, R.A.; Hatch, L.; Cooper, S.B. A review of factors affecting the acute exercise-cognition relationship in children and adolescents. OBM Integr. Complement. Med. 2019, 4, 2573–4393. [Google Scholar] [CrossRef]
- Pontifex, M.B.; McGowan, A.L.; Chandler, M.C.; Gwizdala, K.L.; Parks, A.C.; Fenn, K.; Kamijo, K. A primer on investigating the after effects of acute bouts of physical activity on cognition. Psychol. Sport Exerc. 2019, 40, 1–22. [Google Scholar] [CrossRef]
- Chang, Y.; Labban, J.D.; Gapin, J.I.; Etnier, J.L. The effects of acute exercise on cognitive performance: A meta-analysis. Brain Res. 2012, 1453, 87–101. [Google Scholar] [CrossRef] [PubMed]
- De Greeff, J.W.; Bosker, R.J.; Oosterlaan, J.; Visscher, C.; Hartman, E. Effects of physical activity on executive functions, attention and academic performance in preadolescent children: A meta-analysis. J. Sci. Med. Sport 2018, 21, 501–507. [Google Scholar] [CrossRef] [PubMed]
- Hillman, C.H.; Logan, N.E.; Shigeta, T.T. A review of acute physical activity effects on brain and cognition in children. Transl. J. Am. Coll. Sports Med. 2019, 4, 132–136. [Google Scholar] [CrossRef]
- Ludyga, S.; Gerber, M.; Brand, S.; Holsboer-Trachsler, E.; Pühse, U. Acute effects of moderate aerobic exercise on specific aspects of executive function in different age and fitness groups: A meta-analysis. Psychophysiology 2016, 53, 1611–1626. [Google Scholar] [CrossRef] [PubMed]
- Chen, A.; Yan, J.; Yin, H.; Pan, C.; Chang, Y. Effects of acute aerobic exercise on multiple aspects of executive function in preadolescent children. Psychol. Sport Exerc. 2014, 15, 627–636. [Google Scholar] [CrossRef]
- Drollette, E.S.; Scudder, M.R.; Raine, L.B.; Moore, R.D.; Saliba, B.J.; Pontifex, M.B.; Hillman, C.H. Acute exercise facilitates brain function and cognition in children who need it most: An ERP study of individual differences in inhibitory control capacity. Dev. Cogn. Neurosci. 2014, 7, 53–64. [Google Scholar] [CrossRef] [PubMed]
- Ishihara, T.; Sugasawa, S.; Matsuda, Y.; Mizuno, M. Improved executive functions in 6–12-year-old children following cognitively engaging tennis lessons. J. Sports Sci. 2017, 35, 2014–2020. [Google Scholar] [CrossRef] [PubMed]
- Jäger, K.; Schmidt, M.; Conzelmann, A.; Roebers, C.M. The effects of qualitatively different acute physical activity interventions in real-world settings on executive functions in preadolescent children. Ment. Health Phys. Act. 2015, 9, 1–9. [Google Scholar] [CrossRef]
- Lambrick, D.; Stoner, L.; Grigg, R.; Faulkner, J. Effects of continuous and intermittent exercise on executive function in children aged 8–10 years. Psychophysiology 2016, 53, 1335–1342. [Google Scholar] [CrossRef] [PubMed]
- Pontifex, M.B.; Saliba, B.J.; Raine, L.B.; Picchietti, D.L.; Hillman, C.H. Exercise improves behavioral, neurocognitive, and scholastic performance in children with attention-deficit/hyperactivity disorder. J. Pediatr. 2013, 162, 543–551. [Google Scholar] [CrossRef] [PubMed]
- Vazou, S.; Smiley-Oyen, A. Moving and academic learning are not antagonists: Acute effects on executive function and enjoyment. J. Sport Exerc. Psychol. 2014, 36, 474–485. [Google Scholar] [CrossRef]
- Morris, J.L.; Daly-Smith, A.; Archbold, V.S.; Wilkins, E.L.; McKenna, J. The Daily Mile™ initiative: Exploring physical activity and the acute effects on executive function and academic performance in primary school children. Psychol Sport Exerc. 2019, 45, 101583. [Google Scholar] [CrossRef]
- Booth, J.N.; Chesham, R.A.; Brooks, N.E.; Gorely, T.; Moran, C.N. A citizen science study of short physical activity breaks at school: Improvements in cognition and wellbeing with self-paced activity. BMC Med. 2020, 18, 62. [Google Scholar] [CrossRef]
- Hatch, L.M.; Williams, R.A.; Dring, K.J.; Sunderland, C.; Nevill, M.E.; Sarkar, M.; Morris, J.G.; Cooper, S.B. The Daily Mile™: Acute effects on children’s cognitive function and factors affecting their enjoyment. Psychol. Sport Exerc. 2021, 57, 102047. [Google Scholar] [CrossRef]
- Lopes, V.P.; Vasques, C.; Pereira, B.; Maia, J.A.; Malina, R.M. Physical activity patterns during school recess: A study in children 6 to 10 years old. Int. Electron. J. Health Educ. 2006, 9, 192–201. [Google Scholar]
- Browne, R.A.V.; Costa, E.C.; Sales, M.M.; Fonteles, A.I.; de Moraes, J.F.V.N.; Barros, J.d.F. Acute effect of vigorous aerobic exercise on the inhibitory control in adolescents. Rev. Paul. Pediatr. Engl. Ed. 2016, 34, 154–161. [Google Scholar] [CrossRef] [PubMed]
- Janssen, M.; Toussaint, H.M.; van Mechelen, W.; Verhagen, E.A. Effects of acute bouts of physical activity on children’s attention: A systematic review of the literature. SpringerPlus 2014, 3, 1–10. [Google Scholar] [CrossRef] [PubMed]
- Niemann, C.; Wegner, M.; Voelcker-Rehage, C.; Holzweg, M.; Arafat, A.M.; Budde, H. Influence of acute and chronic physical activity on cognitive performance and saliva testosterone in preadolescent school children. Ment. Health Phys. Act. 2013, 6, 197–204. [Google Scholar] [CrossRef]
- Mirwald, R.L.; Baxter-Jones, A.D.; Bailey, D.A.; Beunen, G.P. An assessment of maturity from anthropometric measurements. Med. Sci. Sports Exerc. 2002, 34, 689–694. [Google Scholar] [PubMed]
- Bailey, D.A. The Saskatchewan Pediatric Bone Mineral Accrual Study: Bone mineral acquisition during the growing years. Int. J. Sports Med. 1997, 18, 191–194. [Google Scholar] [CrossRef]
- Cole, T.J.; Bellizzi, M.C.; Flegal, K.M.; Dietz, W.H. Establishing a standard definition for child overweight and obesity worldwide: International survey. BMJ 2000, 320, 1240. [Google Scholar] [CrossRef]
- Benzing, V.; Heinks, T.; Eggenberger, N.; Schmidt, M. Acute cognitively engaging exergame-based physical activity enhances executive functions in adolescents. PLoS ONE 2016, 11, e0167501. [Google Scholar] [CrossRef] [PubMed]
- Bartels, C.; Wegrzyn, M.; Wiedl, A.; Ackermann, V.; Ehrenreich, H. Practice effects in healthy adults: A longitudinal study on frequent repetitive cognitive testing. BMC Neurosci. 2010, 11, 118. [Google Scholar] [CrossRef] [PubMed]
- Calamia, M.; Markon, K.; Tranel, D. Scoring higher the second time around: Meta-analyses of practice effects in neuropsychological assessment. Clin. Neuropsychol. 2012, 26, 543–570. [Google Scholar] [CrossRef] [PubMed]
- Collie, A.; Maruff, P.; Darby, D.G.; McStephen, M. The effects of practice on the cognitive test performance of neurologically normal individuals assessed at brief test–retest intervals. J. Int. Neuropsychol. Soc. 2003, 9, 419–428. [Google Scholar] [CrossRef] [PubMed]
- Tanaka, H.; Monahan, K.D.; Seals, D.R. Age-predicted maximal heart rate revisited. J. Am. Coll. Cardiol. 2001, 37, 153–156. [Google Scholar] [CrossRef]
- Mahon, A.D.; Marjerrison, A.D.; Lee, J.D.; Woodruff, M.E.; Hanna, L.E. Evaluating the prediction of maximal heart rate in children and adolescents. Res. Q. Exerc. Sport. 2010, 81, 466–471. [Google Scholar] [CrossRef] [PubMed]
- Hamlin, M.J.; Fraser, M.; Lizamore, C.A.; Draper, N.; Shearman, J.P.; Kimber, N.E. Measurement of cardiorespiratory fitness in children from two commonly used field tests after accounting for body fatness and maturity. J. Hum. Kinet. 2014, 40, 83–92. [Google Scholar] [CrossRef] [PubMed][Green Version]
- Budde, H.; Voelcker-Rehage, C.; Pietraßyk-Kendziorra, S.; Ribeiro, P.; Tidow, G. Acute coordinative exercise improves attentional performance in adolescents. Neurosci. Lett. 2008, 441, 219–223. [Google Scholar] [CrossRef]
- Mueller, S.T.; Piper, B.J. The psychology experiment building language (PEBL) and PEBL test battery. J. Neurosci. Methods 2014, 222, 250–259. [Google Scholar] [CrossRef] [PubMed]
- Corsi, P. Memory and the Medial Temporal Region of the Brain; McGill University: Montreal, QB, Canada, 1972. [Google Scholar]
- Kessels, R.P.; Van Zandvoort, M.J.; Postma, A.; Kappelle, L.J.; De Haan, E.H. The Corsi block-tapping task: Standardization and normative data. Appl. Neuropsychol. 2000, 7, 252–258. [Google Scholar] [CrossRef]
- Wechsler, D. Wechsler Memory Scale; The Psychological Corporation: New York, NY, USA, 1945. [Google Scholar]
- Stroop, J.R. Studies of interference in serial verbal reactions. J. Exp. Psychol. 1935, 18, 643. [Google Scholar] [CrossRef]
- Lucas, S.J.; Ainslie, P.N.; Murrell, C.J.; Thomas, K.N.; Franz, E.A.; Cotter, J.D. Effect of age on exercise-induced alterations in cognitive executive function: Relationship to cerebral perfusion. Exp. Gerontol. 2012, 47, 541–551. [Google Scholar] [CrossRef]
- Cooper, S.B.; Bandelow, S.; Nute, M.L.; Dring, K.J.; Stannard, R.L.; Morris, J.G.; Nevill, M.E. Sprint-based exercise and cognitive function in adolescents. Prev. Med. Rep. 2016, 4, 155–161. [Google Scholar] [CrossRef]
- Martins, R.M.; Duncan, M.J.; Clark, C.C.; Eyre, E.L. The acute effects of continuous and intermittent cycling on executive function in children. Acta Psychol. 2021, 218, 103363. [Google Scholar] [CrossRef] [PubMed]
- Homack, S.; Riccio, C.A. A meta-analysis of the sensitivity and specificity of the Stroop Color and Word Test with children. Arch. Clin. Neuropsychol. 2004, 19, 725–743. [Google Scholar] [CrossRef] [PubMed]
- Hedge, C.; Vivian-Griffiths, S.; Powell, G.; Bompas, A.; Sumner, P. Slow and steady? Strategic adjustments in response caution are moderately reliable and correlate across tasks. Conscious. Cogn. 2019, 75, 102797. [Google Scholar] [CrossRef] [PubMed]
- Alloway, T.P.; Gathercole, S.E.; Kirkwood, H.; Elliott, J. Evaluating the validity of the automated working memory assessment. Educ. Psychol. 2008, 28, 725–734. [Google Scholar] [CrossRef]
- Flanagan, D.P.; Alfonso, V.C.; Mascolo, J.T.; Hale, J.B. The Wechsler Intelligence Scale for Children–Fourth Edition in Neuropsychological Practice. In Handbook of Pediatric Neuropsychology; Springer Publishing Company: Austin, TX, USA, 2010; pp. 397–414. [Google Scholar]
- Jahanshahi, M.; Saleem, T.; Ho, A.K.; Fuller, R.; Dirnberger, G. A preliminary investigation of the running digit span as a test of working memory. Behav. Neurol. 2008, 20, 17–25. [Google Scholar] [CrossRef] [PubMed]
- Woods, D.L.; Kishiyama, M.M.; Yund, E.W.; Herron, T.J.; Edwards, B.; Poliva, O.; Hink, R.F.; Reed, B. Improving digit span assessment of short-term verbal memory. J. Clin. Exp. Neuropsychol. 2011, 33, 101–111. [Google Scholar] [CrossRef] [PubMed]
- Svebak, S.; Murgatroyd, S. Metamotivational dominance: A multimethod validation of reversal theory constructs. J. Pers. Soc. Psychol. 1985, 48, 107. [Google Scholar] [CrossRef]
- Hardy, C.J.; Rejeski, W.J. Not what, but how one feels: The measurement of affect during exercise. J. Sport Exerc. Psychol. 1989, 11, 304–317. [Google Scholar] [CrossRef]
- Utter, A.C.; Robertson, R.J.; Nieman, D.C.; Kang, J. Children’s OMNI Scale of Perceived Exertion: Walking/running evaluation. Med. Sci. Sports Exerc. 2002, 34, 139–144. [Google Scholar] [CrossRef]
- Russell, J.A.; Lewicka, M.; Niit, T. A cross-cultural study of a circumplex model of affect. J. Pers. Soc. Psychol. 1989, 57, 848. [Google Scholar] [CrossRef]
- Malik, A.A.; Williams, C.A.; Weston, K.L.; Barker, A.R. Perceptual and Cardiorespiratory Responses to High-Intensity Interval Exercise in Adolescents: Does Work Intensity Matter? J. Sports Sci. Med. 2019, 18, 1. [Google Scholar] [PubMed]
- Russell, J.A.; Weiss, A.; Mendelsohn, G.A. Affect grid: A single-item scale of pleasure and arousal. J. Pers Soc. Psychol. 1989, 57, 493. [Google Scholar] [CrossRef]
- Van Landuyt, L.M.; Ekkekakis, P.; Hall, E.E.; Petruzzello, S.J. Throwing the mountains into the lakes: On the perils of nomothetic conceptions of the exercise-affect relationship. J. Sport Exerc. Psychol. 2000, 22, 208–234. [Google Scholar] [CrossRef]
- Byrne, B.M. Structural Equation Modeling with Mplus: Basic Concepts, Applications, and Programming; Routledge: London, UK, 2013. [Google Scholar]
- Hair, J.; Black, W.C.; Babin, B.J.; Anderson, R.E. Multivariate Data Analysis, 7th ed.; Pearson Education International: Upper Saddle River, NJ, USA, 2010. [Google Scholar]
- Howell, D. Statistical Methods for Psychology; Cengage Learning: Boston, MA, USA, 2012. [Google Scholar]
- Cohen, J. Statistical Power Analysis for the Social Sciences; Lawrence Erlbaum Associates: Hillsdale, NJ, USA, 1988. [Google Scholar]
- Pohlert, T.; Pohlert, M.T. Package ‘PMCMR’, R package Version 1.0; R Foundation: Vienna, Austria, 2018.
- Lambourne, K.; Tomporowski, P. The effect of exercise-induced arousal on cognitive task performance: A meta-regression analysis. Brain Res. 2010, 1341, 12–24. [Google Scholar] [CrossRef] [PubMed]
- Pesce, C.; Crova, C.; Cereatti, L.; Casella, R.; Bellucci, M. Physical activity and mental performance in preadolescents: Effects of acute exercise on free-recall memory. Ment. Health Phys. Act. 2009, 2, 16–22. [Google Scholar] [CrossRef]
- Howie, E.K.; Schatz, J.; Pate, R.R. Acute effects of classroom exercise breaks on executive function and math performance: A dose–response study. Res. Q. Exerc. Sport 2015, 86, 217–224. [Google Scholar] [CrossRef] [PubMed]
- Ekkekakis, P.; Hartman, M.E.; Ladwig, M.A. Affective responses to exercise. In Handbook of Sport Psychology; Wiley: Hoboken, NJ, USA, 2020; pp. 231–253. [Google Scholar]

| Variables | (Ms and SDs) | Run Variables | Control | Shuttle Runs | TDM |
|---|---|---|---|---|---|
| Age | 9.34 (0.48) | ||||
| Gender | 16 boys (55.2%); 13 girls (44.8%) ** | ||||
| Ethnicity (a) | 22 white British (76%); 7 BAME (24%) ** | Distance | - | 837 (234.30) | 1695.26 (246.14) |
| Height | 140.02 (6.38) | HR resting | 85 [10] | ||
| Weight | 36.34 (7.75) * | HR before | 87 [12] | 95 [8] | 93 [9] |
| PHV | 2.71 (1.23) | HR during | 92 [9] | - | 157 [29] |
| BMI | 18.42 (2.94) | HR active bouts | - | *** 186 [14] | - |
| 550 m Run | 2.56 (0.37) | HR rest bouts | - | 170 [10] | - |
| 550 m Score | 0.1 (0.99) | HR 30 min post | 95 ± 9 | 110 [15] | 102 [12] |
Publisher’s Note: MDPI stays neutral with regard to jurisdictional claims in published maps and institutional affiliations. |
© 2022 by the authors. Licensee MDPI, Basel, Switzerland. This article is an open access article distributed under the terms and conditions of the Creative Commons Attribution (CC BY) license (https://creativecommons.org/licenses/by/4.0/).
Share and Cite
Martins, R.M.G.; Duncan, M.J.; Clark, C.C.T.; Eyre, E.L.J. Exploring the Acute Effects of the Daily Mile™ vs. Shuttle Runs on Children’s Cognitive and Affective Responses. Sports 2022, 10, 142. https://doi.org/10.3390/sports10100142
Martins RMG, Duncan MJ, Clark CCT, Eyre ELJ. Exploring the Acute Effects of the Daily Mile™ vs. Shuttle Runs on Children’s Cognitive and Affective Responses. Sports. 2022; 10(10):142. https://doi.org/10.3390/sports10100142
Chicago/Turabian StyleMartins, Ricardo M. G., Michael J. Duncan, Cain C. T. Clark, and Emma L. J. Eyre. 2022. "Exploring the Acute Effects of the Daily Mile™ vs. Shuttle Runs on Children’s Cognitive and Affective Responses" Sports 10, no. 10: 142. https://doi.org/10.3390/sports10100142
APA StyleMartins, R. M. G., Duncan, M. J., Clark, C. C. T., & Eyre, E. L. J. (2022). Exploring the Acute Effects of the Daily Mile™ vs. Shuttle Runs on Children’s Cognitive and Affective Responses. Sports, 10(10), 142. https://doi.org/10.3390/sports10100142