
Differences across Playing Levels for Match-Play Physical Demands in Women’s Professional and Collegiate Soccer: A Narrative Review

 ,
,
Abstract
:1. Introduction
2. Materials and Methods
2.1. Search Strategy
2.2. Study Selection
2.3. Data Extraction
3. Results
3.1. Demands of Match-Play at Each Level
3.2. Positional Differences (Regardless of Playing Level)
3.3. The Influence of Time (Friday to Sunday Match) on Objective External Load
3.4. The Influence of Time (First Half to Second Half) on Objective External Load
4. Discussion
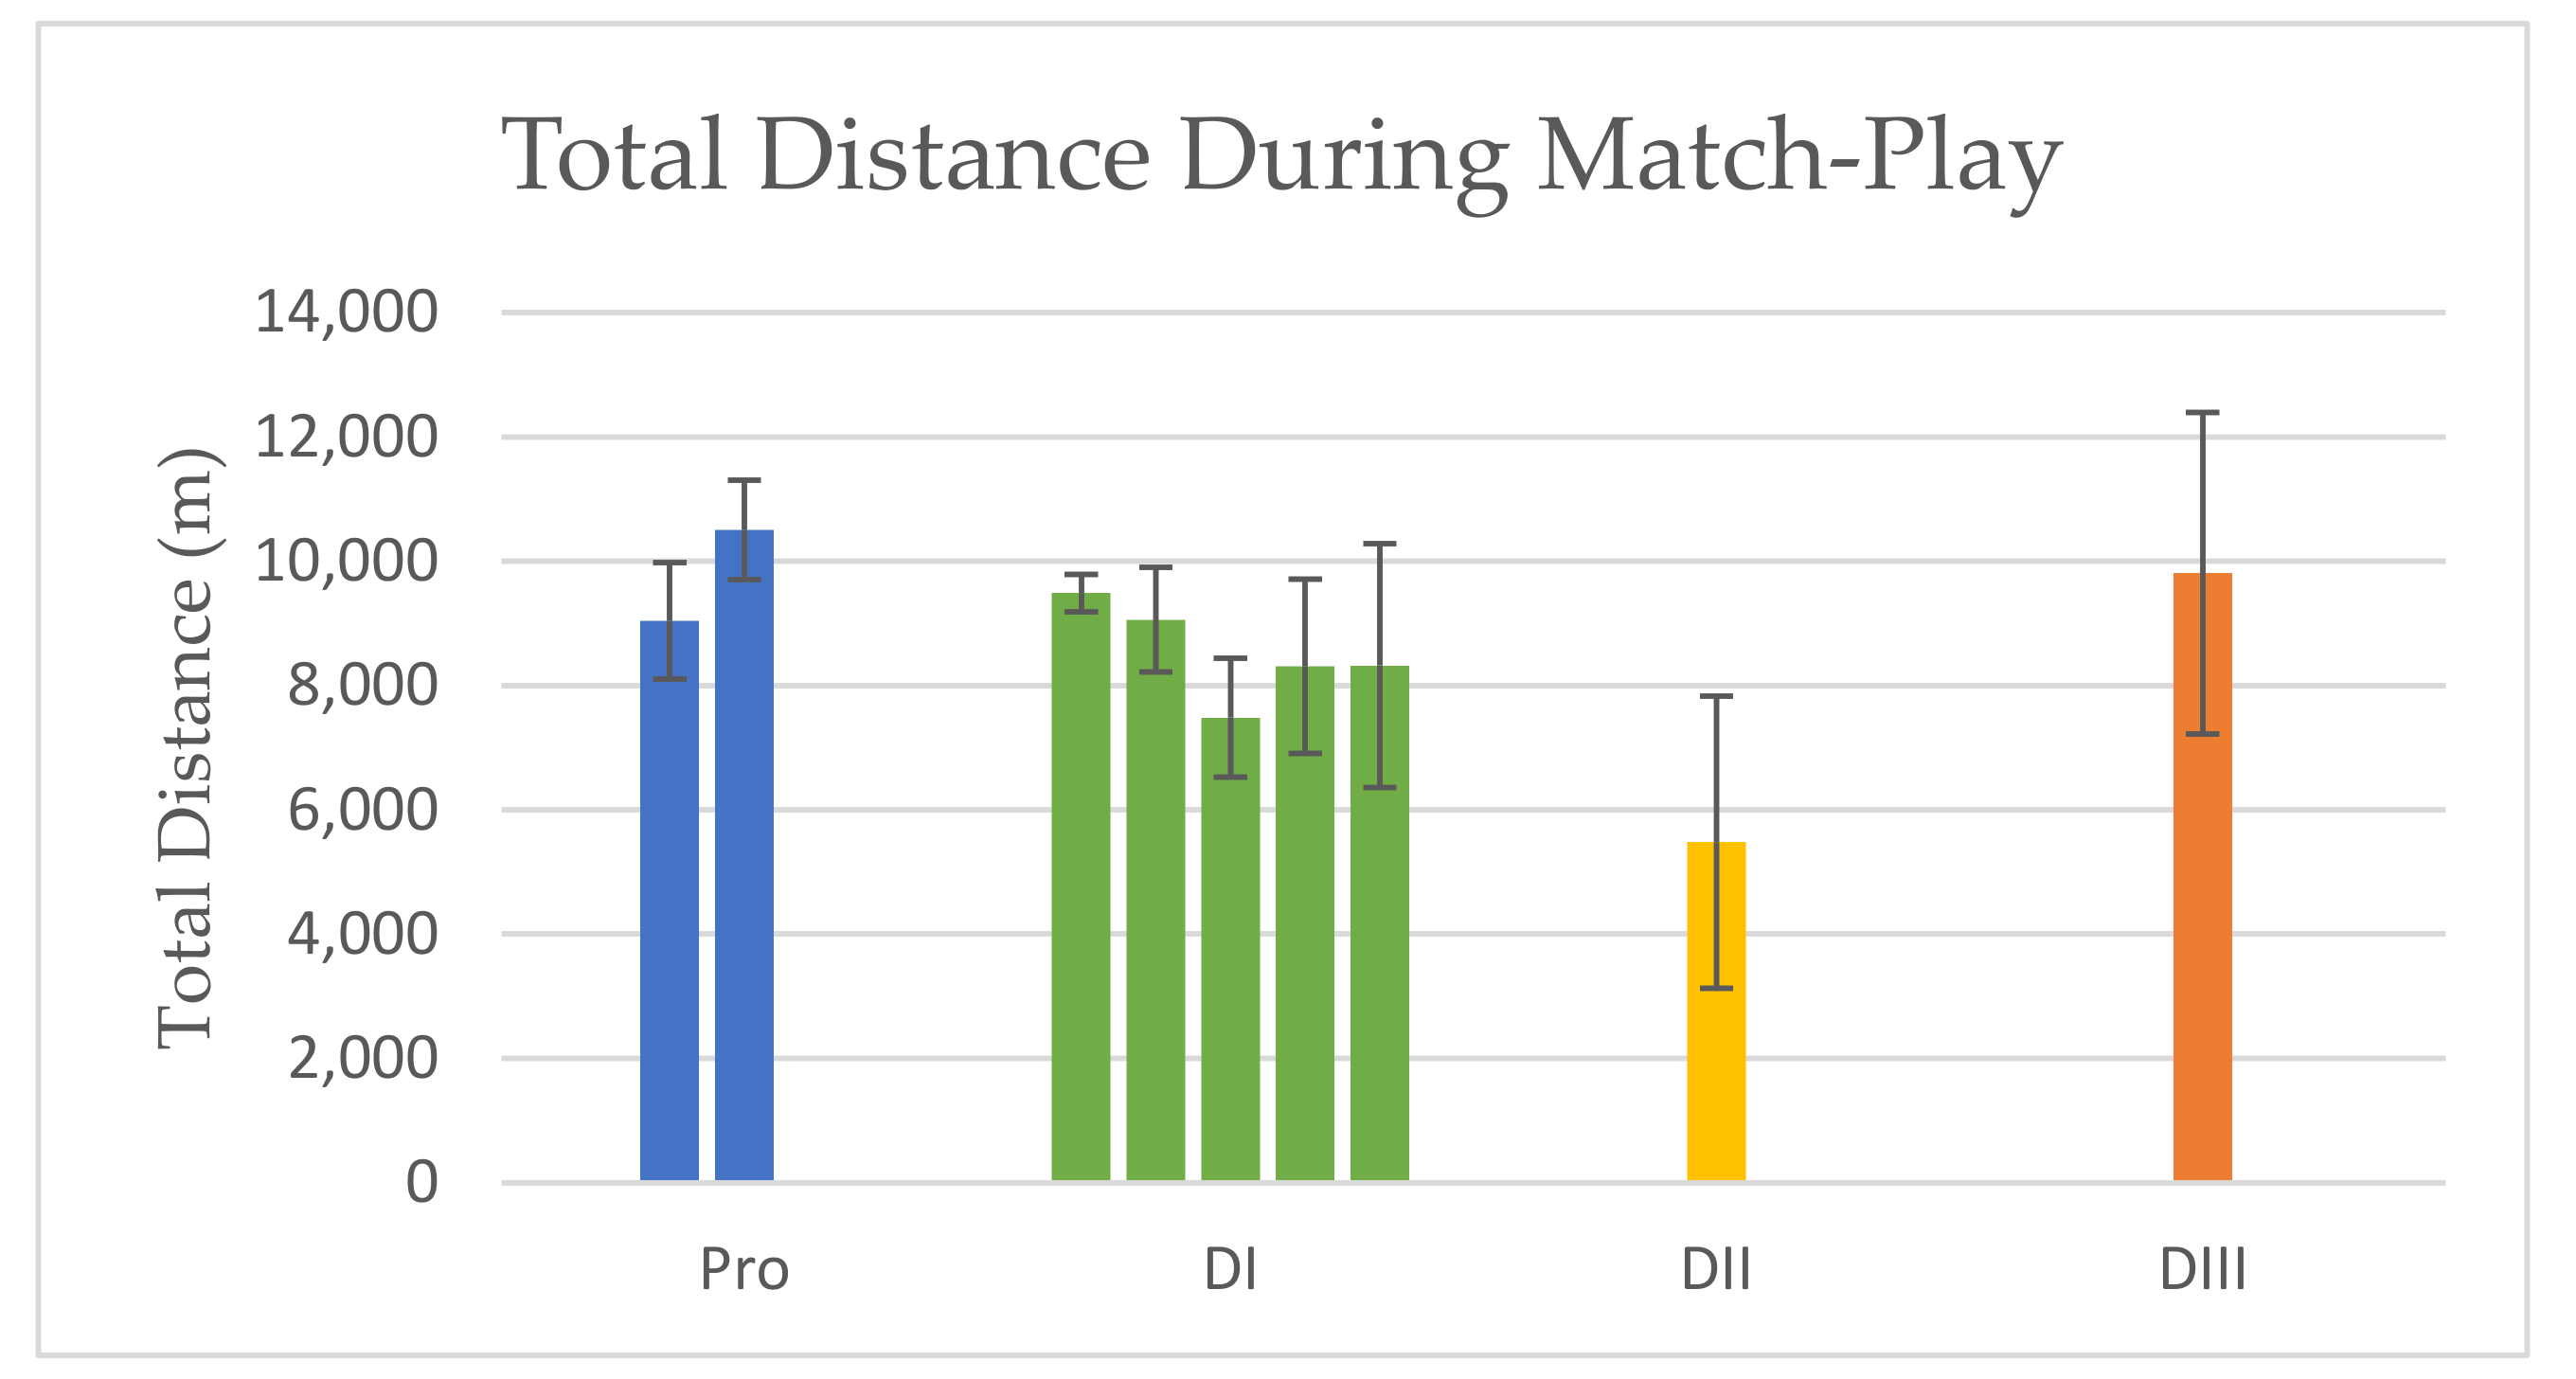
4.1. Total Distance
4.2. Positional Differences in Total Distance
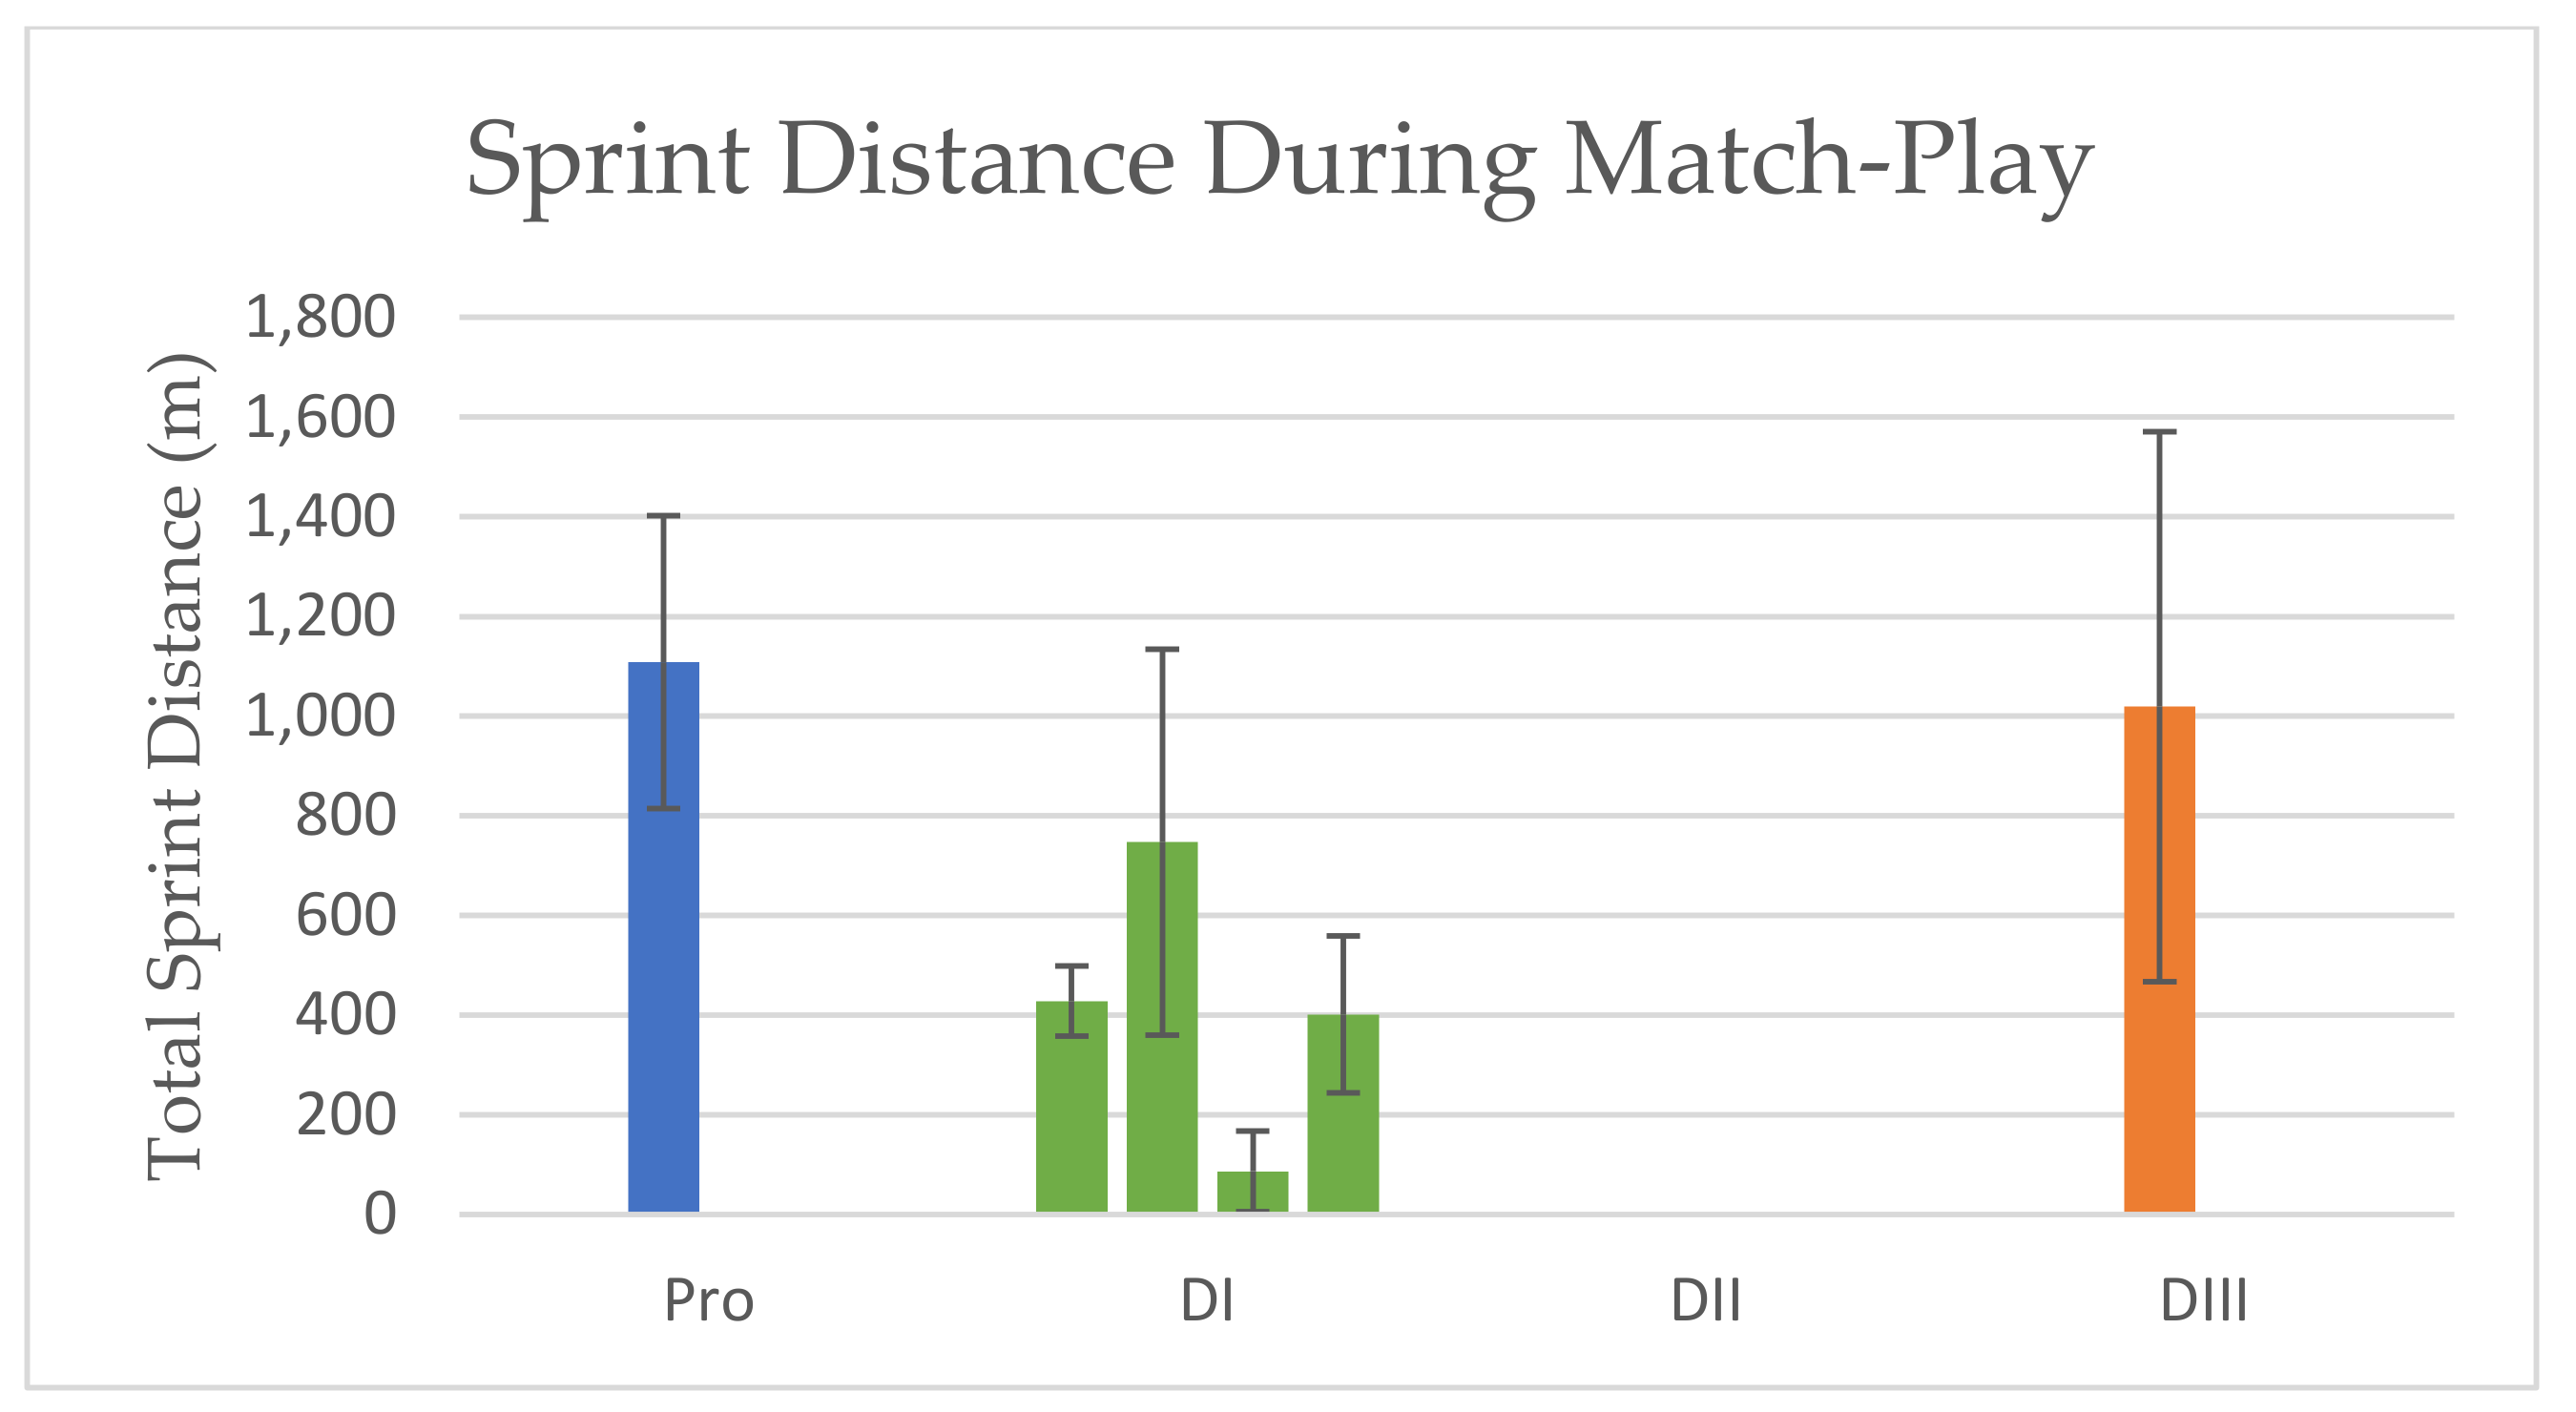
4.3. Sprint Distance
4.4. Changes across Time (Friday to Sunday and First Half to Second Half)
4.5. Summary and Limitations
4.6. Practical Application
5. Conclusions
Author Contributions
Funding
Institutional Review Board Statement
Informed Consent Statement
Acknowledgments
Conflicts of Interest
References
- Dalen, T.; Ingebrigtsen, J.; Ettema, G.; Hjelde, G.H.; Wisløff, U. Player Load, Acceleration, and Deceleration During Forty-Five Competitive Matches of Elite Soccer. J. Strength Cond. Res. 2016, 30, 351–359. [Google Scholar] [CrossRef] [PubMed]
- Gentles, J.A.; Coniglio, C.L.; Besemer, M.M.; Morgan, J.M.; Mahnken, M.T. The Demands of a Women’s College Soccer Season. Sports 2018, 6, 16. [Google Scholar] [CrossRef] [PubMed]
- Haff, G.; Triplett, N.T. Essentials of Strength Training and Conditioning; Human Kinetics: Champaign, IL, USA, 2021; ISBN 978-1-71821-086-8. [Google Scholar]
- Kaya, A. Decision Making by Coaches and Athletes in Sport. Procedia -Soc. Behav. Sci. 2014, 152, 333–338. [Google Scholar] [CrossRef]
- Mcgahan, J.; Burns, C.; Lacey, S.; Gabbett, T.; O’Neill, C. Variation in Training Load and Markers of Wellness. J. Aust. Strength Cond. 2020, 27, 6–14. [Google Scholar]
- Perri, E. Training Strategies to Maximise Recovery and Performance in Soccer Players. Ph.D. Dissertation, Università degli Studi di Milano, Milan, Italy, 2018. [Google Scholar]
- Scott, D.; Norris, D.; Lovell, R. Dose-Response Relationship between External Load and Wellness in Elite Women’s Soccer Matches: Do Customized Velocity Thresholds Add Value? Int. J. Sports Physiol. Perform. 2020, 15, 1245–1251. [Google Scholar] [CrossRef]
- Ishida, A.; Bazyler, C.D.; Sayers, A.L.; Stone, M.H.; Gentles, J.A. Evidence and Application of Athlete Monitoring Programs in National Collegiate Athletic Association Women’s Soccer: A Narrative Review. Strength Cond. J. 2022, 44, 33–45. [Google Scholar] [CrossRef]
- Vescovi, J.D.; Fernandes, E.; Klas, A. Physical Demands of Women’s Soccer Matches: A Perspective Across the Developmental Spectrum. Front. Sports Act. Living 2021, 3, 634696. [Google Scholar] [CrossRef] [PubMed]
- McFadden, B.A.; Walker, A.J.; Bozzini, B.N.; Sanders, D.J.; Arent, S.M. Comparison of Internal and External Training Loads in Male and Female Collegiate Soccer Players During Practices vs. Games. J. Strength Cond. Res. 2020, 34, 969–974. [Google Scholar] [CrossRef] [PubMed]
- Romero-Moraleda, B.; Nedergaard, N.J.; Morencos, E.; Casamichana, D.; Ramirez-Campillo, R.; Vanrenterghem, J. External and internal loads during the competitive season in professional female soccer players according to their playing position: Differences between training and competition. Res. Sports Med. 2021, 29, 449–461. [Google Scholar] [CrossRef]
- Ishida, A.; Travis, S.K.; Draper, G.; White, J.B.; Stone, M.H. Player Position Affects Relationship between Internal and External Training Loads during Division I Collegiate Female Soccer Season. J. Strength Cond. Res. 2022, 36, 513–517. [Google Scholar] [CrossRef]
- Rentz, L.E.; Hornsby, W.G.; Gawel, W.J.; Rawls, B.G.; Ramadan, J.; Galster, S.M. Contextual Variation in External and Internal Workloads across the Competitive Season of a Collegiate Women’s Soccer Team. Sports 2021, 9, 165. [Google Scholar] [CrossRef]
- Casamichana, D.; Castellano, J.; Castagna, C. Comparing the physical demands of friendly matches and small-sided games in semiprofessional soccer players. J. Strength Cond. Res. 2012, 26, 837–843. [Google Scholar] [CrossRef]
- Gaudino, P.; Iaia, F.M.; Strudwick, A.J.; Hawkins, R.D.; Alberti, G.; Atkinson, G.; Gregson, W. Factors influencing perception of effort (session rating of perceived exertion) during elite soccer training. Int. J. Sports Physiol. Perform. 2015, 10, 860–864. [Google Scholar] [CrossRef] [PubMed]
- Izzo, R.; Giovannelli, M. Session RPE and Speed High Intensity Distance in Meters (D_SHI mt): A Valid Method to Analyze Training Load in Soccer Players. J. Sports Sci. 2018, 6, 159–164. [Google Scholar] [CrossRef]
- Krustrup, P.; Mohr, M.; Nybo, L.; Jensen, J.M.; Nielsen, J.J.; Bangsbo, J. The Yo-Yo IR2 test: Physiological response, reliability, and application to elite soccer. Med. Sci. Sports Exerc. 2006, 38, 1666–1673. [Google Scholar] [CrossRef] [PubMed]
- Mayhew, S.R.; Wenger, H.A. Time-Motion Analysis of Professional Soccer. J. Hum. Mov. Stud. 1985, 11, 49–52. [Google Scholar]
- Mohr, M.; Krustrup, P.; Bangsbo, J. Match performance of high-standard soccer players with special reference to development of fatigue. J. Sports Sci. 2003, 21, 519–528. [Google Scholar] [CrossRef] [PubMed]
- Mohr, M.; Krustrup, P.; Bangsbo, J. Fatigue in soccer: A brief review. J. Sports Sci. 2005, 23, 593–599. [Google Scholar] [CrossRef] [PubMed]
- Reilly, T.; Lees, A.; Davids, K.; Murphy, W.J. The physiological load imposed on soccer players during real match-play. In Science and Football (Routledge Revivals); Routledge: London, UK, 1988; pp. 73–81. ISBN 978-0-203-72003-5. [Google Scholar]
- Slimani, M.; Znazen, H.; Miarka, B.; Bragazzi, N.L. Maximum Oxygen Uptake of Male Soccer Players According to their Competitive Level, Playing Position and Age Group: Implication from a Network Meta-Analysis. J. Hum. Kinet. 2019, 66, 233–245. [Google Scholar] [CrossRef] [PubMed]
- Araújo, M.; Baumgart, C.; Freiwald, J.; Hoppe, M. Contrasts in intermittent endurance performance and heart rate response between female and male soccer players of different playing levels. Biol. Sport 2019, 36, 323–331. [Google Scholar] [CrossRef] [PubMed]
- Krustrup, P.; Mohr, M.; Ellingsgaard, H.; Bangsbo, J. Physical demands during an elite female soccer game: Importance of training status. Med. Sci. Sports Exerc. 2005, 37, 1242–1248. [Google Scholar] [CrossRef]
- Vescovi, J.D. Sprint profile of professional female soccer players during competitive matches: Female Athletes in Motion (FAiM) study. J. Sports Sci. 2012, 30, 1259–1265. [Google Scholar] [CrossRef] [PubMed]
- Alexander, R. Physical and Technical Demands of Women’s Collegiate Soccer. Ph.D. Dissertation, East Tennessee State University, Johnson City, TN, USA, 2014. [Google Scholar]
- Corrales, I. The Physical Demands of Women’s Collegiate Soccer Matches Assessed Using GPS Devices. Master’s Thesis, California State University, Fullerton, CA, USA, 2020. [Google Scholar]
- Sausaman, R.W.; Sams, M.L.; Mizuguchi, S.; DeWeese, B.H.; Stone, M.H. The Physical Demands of NCAA Division I Women’s College Soccer. J. Funct. Morphol. Kinesiol. 2019, 4, 73. [Google Scholar] [CrossRef] [PubMed]
- Vescovi, J.D.; Favero, T.G. Motion characteristics of women’s college soccer matches: Female Athletes in Motion (FAiM) study. Int. J. Sports Physiol. Perform. 2014, 9, 405–414. [Google Scholar] [CrossRef]
- Wells, A.J.; Hoffman, J.R.; Beyer, K.S.; Hoffman, M.W.; Jajtner, A.R.; Fukuda, D.H.; Stout, J.R. Regular- and postseason comparisons of playing time and measures of running performance in NCAA Division I women soccer players. Appl. Physiol. Nutr. Metab. 2015, 40, 907–917. [Google Scholar] [CrossRef]
- Jagim, A.R.; Murphy, J.; Schaefer, A.Q.; Askow, A.T.; Luedke, J.A.; Erickson, J.L.; Jones, M.T. Match Demands of Women’s Collegiate Soccer. Sports 2020, 8, 87. [Google Scholar] [CrossRef]
- Smith, R.; Ford, K.R.; Myer, G.D.; Holleran, A.; Treadway, E.; Hewett, T.E. Biomechanical and performance differences between female soccer athletes in National Collegiate Athletic Association Divisions I and III. J. Athl. Train. 2007, 42, 470–476. [Google Scholar] [PubMed]
- Mohr, M.; Krustrup, P.; Andersson, H.; Kirkendal, D.; Bangsbo, J. Match activities of elite women soccer players at different performance levels. J. Strength Cond. Res. 2008, 22, 341–349. [Google Scholar] [CrossRef] [PubMed]
- Harkness-Armstrong, A.; Till, K.; Datson, N.; Myhill, N.; Emmonds, S. A Systematic Review of Match-Play Characteristics in Women’s Soccer. PLoS ONE 2022, 17, e0268334. [Google Scholar] [CrossRef]
- McCormack, W.P.; Hoffman, J.R.; Pruna, G.J.; Scanlon, T.C.; Bohner, J.D.; Townsend, J.R.; Jajtner, A.R.; Stout, J.R.; Fragala, M.S.; Fukuda, D.H. Reduced High-Intensity-Running Rate in College Women’s Soccer When Games Are Separated by 42 Hours. Int. J. Sports Physiol. Perform. 2015, 10, 436–439. [Google Scholar] [CrossRef]
- NCAA Soccer Rules of the Game. Available online: https://www.ncaa.org/sports/2013/12/2/soccer-rules-of-the-game.aspx (accessed on 21 November 2020).
- IFAB Laws of the Game. Available online: https://www.theifab.com/laws-of-the-game-documents/?language=all&year=2022%2F23 (accessed on 21 November 2020).
- NSCA Sports The Difference in the College Division Levels. Available online: https://www.ncsasports.org/recruiting/how-to-get-recruited/college-divisions (accessed on 21 November 2020).
- NCAA. NCAA Sports Sponsorship and Participation Rates Report 1981-82–2018-19. Available online: https://ncaaorg.s3.amazonaws.com/research/sportpart/2018-19RES_SportsSponsorshipParticipationRatesReport.pdf (accessed on 21 November 2020).
- McCormack, W.P.; Stout, J.R.; Wells, A.J.; Gonzalez, A.M.; Mangine, G.T.; Fragala, M.S.; Hoffman, J.R. Predictors of high-intensity running capacity in collegiate women during a soccer game. J. Strength Cond. Res. 2014, 28, 964–970. [Google Scholar] [CrossRef] [PubMed]
- Andersson, H.A.; Randers, M.B.; Heiner-Møller, A.; Krustrup, P.; Mohr, M. Elite female soccer players perform more high-intensity running when playing in international games compared with domestic league games. J. Strength Cond. Res. 2010, 24, 912–919. [Google Scholar] [CrossRef] [PubMed]
- Bradley, P.S.; Vescovi, J.D. Velocity thresholds for women’s soccer matches: Sex specificity dictates high-speed running and sprinting thresholds—Female Athletes in Motion (FAiM). Int. J. Sports Physiol. Perform. 2015, 10, 112–116. [Google Scholar] [CrossRef] [PubMed]
- Carling, C.; Dupont, G. Are declines in physical performance associated with a reduction in skill-related performance during professional soccer match-play? J. Sports Sci. 2011, 29, 63–71. [Google Scholar] [CrossRef] [PubMed]
- Kilian, J.; Snyman, K.; Miyashita, T. Comparison of In-game External Load Metrics Among Positions and Between Halves for Division I Collegiate Women’s Lacrosse Athletes. Int. J. Strength Cond. 2022, 2, 1–8. [Google Scholar] [CrossRef]

| Author | Sample | Design | Equipment | Results: Total Distance (m) | Results: Mean Sprint Distance (m) | Results: Number of Sprints | Results: Across Time | Conclusion Statement |
|---|---|---|---|---|---|---|---|---|
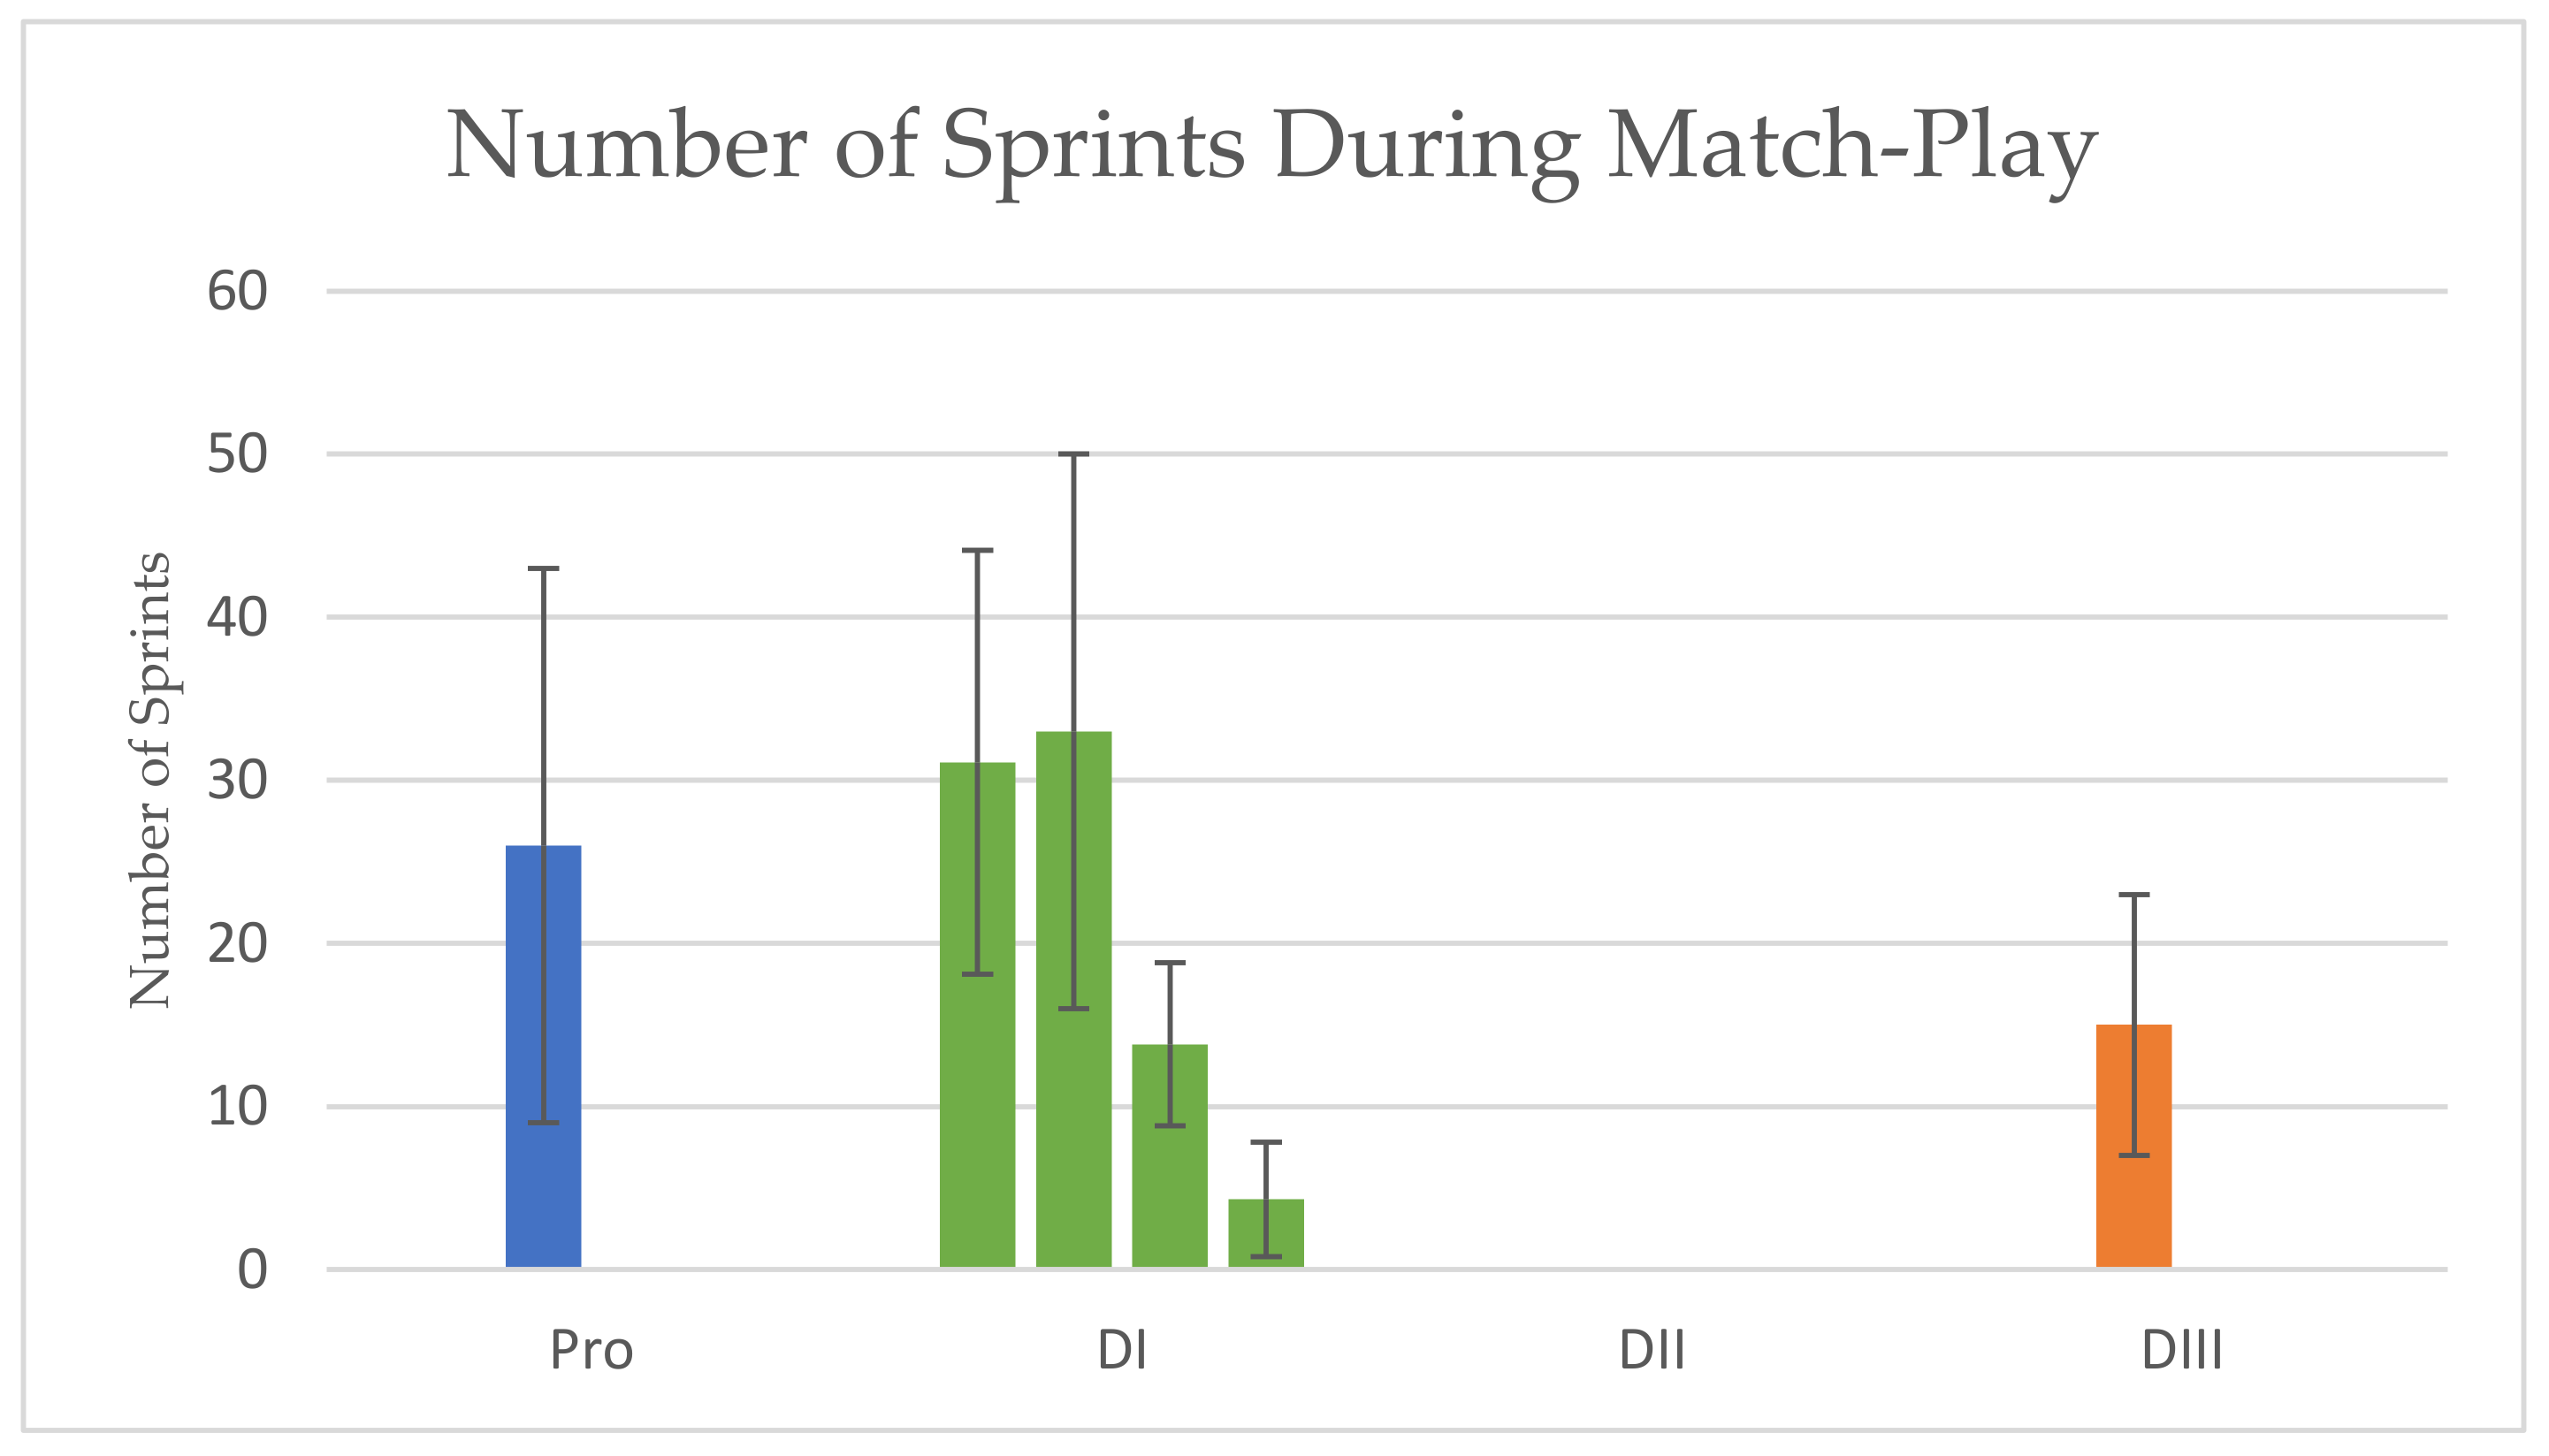
| Vescovi [25] | 71 ProF: 16 MF: 26 D: 29 | RA across 12 regular season | 5 Hz GPS—SPI Pro, GPSports | DNE | F: 657 ± 157 MF: 447 ± 185 * D: 545 ± 217 | F: 43 ± 10 * MF: 31 ± 11 D: 36 ± 12 | DNE | These data should guide the development of high intensity and sprint thresholds for elite female soccer players |
| Krustrup et al. [24] | 14 Pro | RA across 4 regular season | Time-motion analysis: VHS movie camera (NV-M50, Panasonic) | 10,500 ± 800 | AVG HIR: 1310 | 26 ± 17 | Distance covered at a high intensity decreased from first to last 15-min period of the first and second halves ** | Match performance of elite female soccer players varies with differences in the physical capacities of the players |
| Romero et al. [11] | 18 Pro F: 2 MF: 10 D: 6 | RA across 1 competitive season | 5 Hz GPS—SPI Pro X, GPSports | 9040 ± 938 | 1108 ± 294 | DNE 255 ± 40 (# of accelerations) | DNE | Match load was greater than training load and differed by position while training load did not. Differences between positions should be accounted for when prescribing training load to optimize performance and reduce injury risk. |
| Sausaman et al. [28] | 23 NCAA DI | RA across 4 competitive regular seasons | 10 Hz GPS—Catapult Systems | Combined: 9486 ± 300 -------------- F: 9882 * MF: 9536 D: 9039 | Combined: 428 ± 70 ------------- F: 633 * MF: 267 D: 385 | Combined: 31.1 ± 13 | DNE | The physical demands of DI soccer differ * by position and appear lower compared to higher standards of play |
| Alexander [26] | 10 NCAA DI | RA across 1 competitive season | 10 Hz GPS—Catapult Systems | Combined: 9058 ± 840 ---------------- F: 9695 ±401 * Wide MF: 9500 ±847 CA MF: 9236 ± 491 Central D MF: 9947 ± 578 * Fullback: 9306 ± 377 Central D: 8041 ± 371 * | F: 608 ± 199 Wide MF: 518 ± 154 CA MF: 316 ± 105 Central D MF: 256 ± 75 Fullback: 467 ± 147 Central D: 277 ± 61 | F: 47 ± 4 * Wide MF: 36 ± 9 * CA MF: 23 ± 6 Central D MF: 18 ± 5 Fullback: 39 ± 6 * Central D: 19 ± 3 | High-speed efforts dropped approx. 18% from the first match to the second match on average **, and distance covered in high speed dropped by approx. 8% ** | Significant differences exist between positions for total distance covered during a match *. Forward and central defensive midfielder positions covered the greatest distance during match play |
| Corrales [27] | 10 NCAA DI F: 3 MF: 3 D: 4 | RA across 8 regular season matches | 10 Hz GPS | 8320 ± 1963 | 747 ± 387 | 33 ± 17 | DNE | Physical demands of collegiate female soccer players during competition are similar, regardless of their position |
| Wells et al. [30] | 9 NCAA DI F: 4 MF: 5 D: 5 | RA across 17 regular season games & 4 postseason games | 10 Hz GPS—Catapult Systems | Regular season: 7482 ± 959 | Regular season: 86 ± 81 | DNE | Sig ↓ high-speed and high-intensity runs during the second half of the postseason compared with the regular season** | Results indicate that additional minutes played during the postseason were primarily performed at lower intensity thresholds, suggesting running performance during postseason competitions may be compromised with greater playing time |
| Vescovi & Favero [29] | 113 NCAA DI from 9 teams F: 33 MF: 45 D: 35 | RA across 1 regular season | 5 Hz GPS—SPI Pro, GPSports | First Half: F: 5232 ± 153 MF: 5186 ± 76 D: 4878 ± 74 * ----------------- Second Half: F: 5065 ±185 MF: 4939 ±121 D: 4618 ± 101 * | First Half: F: 146 ±26 * MF:87 ± 13 D: 131 ± 13 * --------------- Second Half: F: 193 ± 27 MF: 110 ± 18 D: 135 ± 15 | DNE | D covered less total absolute distance than MF (first half), and MF and F (second half) | Moderate- and high-intensity distances cumulatively range from 2100 to 2600 m (26–28% total distance) in female college matches. It is suggested that substitution patterns have little impact on locomotor distribution |
| Ishida et al. [12] | 17 NCAA DI F: 3 MF: 9 D: 5 | RA across 1 competitive season | 10 Hz GPS—OptimEye S5, Catapult Innovations | F: 6995.2 ± 3844.5 MF: 6869.8 ± 3973.0 D: 9339.4 ± 3860.6 | F: 681.7 ± 492.0 MF: 594.9 ± 428.4 D: 734.2 ± 366.9 | DNE | DNE | Internal and external training loads differ by position |
| McFadden et al. [10] | 16 NCAA DI | RA across 1 competitive season | 10 Hz GPS—Polar TeamPro System | 8310.0 ± 1400.0 | 400.9 ± 157.6 | 13.8 ± 5.0 | DNE | Tracking relative workload on an individual-basis may help to enhance the health and performance of athletes throughout the playing season |
| McCormack et al. [35] | 10 NCAA DI | RA across 16 regular season matches | 10 Hz GPS—Minimax 4.0, Catapult Systems | DNE | DNE | 4.31 ± 3.51 | Significant ↓ in high intensity running rate from Friday match to Sunday match | NCAA DI female soccer players run less total distance when matches are less than 48 h after a first, potentially requiring more intensive recovery strategies |
| Gentles et al. [2] | 25 NCAA DII | RA across 17 regular season matches | GPS 5 Hz ZephyrTM BioHarnesses | 5480 ± 2350 | DNE | DNE | DNE | This study details the demands of Division II women’s soccer match-play. |
| Jagim et al. [31] | 25 NCAA DIII | RA across 22 regular season matches | GPS 10 Hz—Polar Team Pro | 9807 ± 2588 | 1019 ± 552 | 15 ± 8 | DNE | Significant and meaningful differences in movement kinematics were observed across position groups |
Publisher’s Note: MDPI stays neutral with regard to jurisdictional claims in published maps and institutional affiliations. |
© 2022 by the authors. Licensee MDPI, Basel, Switzerland. This article is an open access article distributed under the terms and conditions of the Creative Commons Attribution (CC BY) license (https://creativecommons.org/licenses/by/4.0/).
Share and Cite
Choice, E.; Tufano, J.; Jagger, K.; Hooker, K.; Cochrane-Snyman, K.C. Differences across Playing Levels for Match-Play Physical Demands in Women’s Professional and Collegiate Soccer: A Narrative Review. Sports 2022, 10, 141. https://doi.org/10.3390/sports10100141
Choice E, Tufano J, Jagger K, Hooker K, Cochrane-Snyman KC. Differences across Playing Levels for Match-Play Physical Demands in Women’s Professional and Collegiate Soccer: A Narrative Review. Sports. 2022; 10(10):141. https://doi.org/10.3390/sports10100141
Chicago/Turabian StyleChoice, Erin, James Tufano, Kristen Jagger, Kayla Hooker, and Kristen C. Cochrane-Snyman. 2022. "Differences across Playing Levels for Match-Play Physical Demands in Women’s Professional and Collegiate Soccer: A Narrative Review" Sports 10, no. 10: 141. https://doi.org/10.3390/sports10100141
APA StyleChoice, E., Tufano, J., Jagger, K., Hooker, K., & Cochrane-Snyman, K. C. (2022). Differences across Playing Levels for Match-Play Physical Demands in Women’s Professional and Collegiate Soccer: A Narrative Review. Sports, 10(10), 141. https://doi.org/10.3390/sports10100141