Article

Architecture, Chromatin and Gene Organization of Toxoplasma gondii Subtelomeres

1
Laboratorio de Parasitología Molecular, Instituto Tecnológico Chascomús (INTECH), Universidad Nacional de General San Martín (UNSAM), Consejo Nacional de Investigaciones Científicas y Técnicas (CONICET), Chascomús 7130, Argentina
2
Instituto de Investigaciones en Ingeniería Genética y Biología Molecular “Dr. Héctor N. Torres” (INGEBI-CONICET), Buenos Aires C1428ADN, Argentina
3
Laboratorio de Genómica y Bioinformática de Patógenos, iB3|Instituto de Biociencias, Biotecnología y Biología traslacional, Departamento de Fisiología y Biología Molecular y Celular, Facultad de Ciencias Exactas y Naturales, Universidad de Buenos Aires, Buenos Aires C1428EHA, Argentina
4
Department of Internal Medicine, Morsani College of Medicine, University of South Florida, Tampa, FL 33602, USA
5
Laboratorio de Molecular Farming y Vacunas, Instituto Tecnológico Chascomús (INTECH), Universidad Nacional de General San Martín (UNSAM), Consejo Nacional de Investigaciones Científicas y Técnicas (CONICET), Chascomús 7130, Argentina
*
Authors to whom correspondence should be addressed.
Epigenomes 2022, 6(3), 29; https://doi.org/10.3390/epigenomes6030029
Submission received: 30 June 2022 / Revised: 5 September 2022 / Accepted: 8 September 2022 / Published: 15 September 2022

Abstract

:
Subtelomeres (ST) are chromosome regions that separate telomeres from euchromatin and play relevant roles in various biological processes of the cell. While their functions are conserved, ST structure and genetic compositions are unique to each species. This study aims to identify and characterize the subtelomeric regions of the 13 Toxoplasma gondii chromosomes of the Me49 strain. Here, STs were defined at chromosome ends based on poor gene density. The length of STs ranges from 8.1 to 232.4 kbp, with a gene density of 0.049 genes/kbp, lower than the Me49 genome (0.15 kbp). Chromatin organization showed that H3K9me3, H2A.X, and H3.3 are highly enriched near telomeres and the 5′ end of silenced genes, decaying in intensity towards euchromatin. H3K4me3 and H2A.Z/H2B.Z are shown to be enriched in the 5′ end of the ST genes. Satellite DNA was detected in almost all STs, mainly the sat350 family and a novel satellite named sat240. Beyond the STs, only short dispersed fragments of sat240 and sat350 were found. Within STs, there were 12 functional annotated genes, 59 with unknown functions (Hypothetical proteins), 15 from multigene FamB, and 13 from multigene family FamC. Some genes presented low interstrain synteny associated with the presence of satellite DNA. Orthologues of FamB and FamC were also detected in Neospora caninum and Hammondia hammondi. A re-analysis of previous transcriptomic data indicated that ST gene expression is strongly linked to the adaptation to different situations such as extracellular passage (evolve and resequencing study) and changes in metabolism (lack of acetyl-CoA cofactor). In conclusion, the ST region of the T. gondii chromosomes was defined, the STs genes were determined, and it was possible to associate them with high interstrain plasticity and a role in the adaptability of T. gondii to environmental changes.

1. Introduction

Heterochromatin, densely packed DNA with low transcriptional activity, constitutes the major component of most eukaryotic nuclei and is essential for maintaining genomic stability. In most eukaryotes, heterochromatin is concentrated in the pericentromeric, telomeric, and subtelomeric regions and is highly enriched in repetitive sequences [1]. Subtelomeres (STs) are chromosome regions adjacent to telomeres and are rich in satellite DNA, pseudogenes, and, sometimes, complete genes that are generally species-specific [2,3,4,5]. In addition, the heterochromatin that forms the ST is characterized by low nucleosome occupancy and the presence of repressive histone marks such as H4K20me3, H3K9me2/3, and H3K27me3. Those marks, in turn, recruit heterochromatin factors such as HP1 and deacetylases such as Sir2, which target H3 and H4 [6,7,8,9].
One of STs’ functions is to contact the chromosomes with the nuclear envelope [10]. Another very important function is to protect euchromatin from the invasion of telomeric heterochromatin to safeguard gene expression [11]. STs are also involved in telomere maintenance, telomere length regulation, and late DNA replication [12,13,14].
STs are difficult to define because these gene-poor regions evolve quickly. The extraordinary instability of STs allows rapid adaptation to new niches, resulting from the high rate of gene duplication, followed by the functional divergence of the alleles [15]. Subtelomeric genes often comprise groups of genes associated with a determined metabolic pathway, virulence, and pathogenicity [15,16,17,18,19,20,21,22]. The genes of the subtelomeric regions, including those whose expression is associated with certain environmental conditions, are under the telomeric position effect (TPE), which keeps chromatin silenced [4,12,23]. The role of chromatin is essential for the functions of the STs. For example, the subtelomeric regions of Plasmodium and the regulation of its antigenic variation genes are subject to correct chromatin modulation by different factors, including histone marks and histone variants H2A.Z and H2B.Z [24].
Toxoplasma gondii is an apicomplexan protozoan parasite with an infection rate close to one-third of the human population [25]. It is capable of infecting all warm-blooded animals and all nucleated cells. It presents a complex life cycle with several stages, which guarantees its success in dispersion. All this implies high flexibility to develop in the different environments in which it is dispersed. Despite the role that STs could have in this adaptation to different environments, very little is known about them. ST regions were detected and characterized in nine out of the 14 Toxoplasma chromosomes, now revised to 13 [26,27], based on chromosome end similarities and designated telomere-associated sequences (TAS) [28]. T. gondii Chromo1 protein (a heterochromatin protein 1 or HP1-like protein) was found to be associated with the peri-centromeric regions and the repeats present at the end of chromosomes Ia and IX in the nuclear periphery [29]. In a separate set of ChIP-qPCR experiments, an enrichment of the heterochromatin marks H4K20me1 and H3K9me1 with the subtelomeric repetitive element sat350 was also detected [30]. Genome-wide analysis showed that H2A.X and H3.3 are also enriched at the chromosome ends [31].
A T. gondii multigene family (FamC) was detected at T. gondii STs [28]. FamC genes were named Toxoplasma specific factors (TSF) without an attributable function [32]. Recently, Lorenzi et al. [33] classified this family and other multigene families of Toxoplasma within the set of proteins important for the pathogenesis and evasion of the immune system response (FamA, FamB, FamD, FamE, Rop, Mic, Gra, SRS and SAG). FamA, FamB, FamC, FamD, and FamE are predicted to be integral membrane proteins but differ in motif organization and length [32,33]. These genes were detected in the genomes of T. gondii, Hammondia hammondi and Neospora caninum, except FamC, which was detected only in T. gondii and H. hammondi. The Fam genes were not detected in other Apicomplexan protozoa [33].
A more in-depth sequence of the T. gondii genome is now available, allowing the subtelomeric regions to be re-analyzed in detail. Here, we defined STs of 13 T. gondii chromosomes based on gene density. The defined STs were analyzed in terms of their chromatin architecture and the presence of satellite DNA. We also identified and characterized subtelomeric genes based on gene description, synteny, chromatin-associated status, and transcriptional and proteomic evidence. Finally, we analyzed the expression profile of ST genes in different situations: extracellular passage transcriptome from an evolve and resequencing study, an approach to investigate the genomic responses to selection during experimental evolution [34], and changes in metabolism based on ΔACL/iΔACS transcriptome data [35].

2. Results

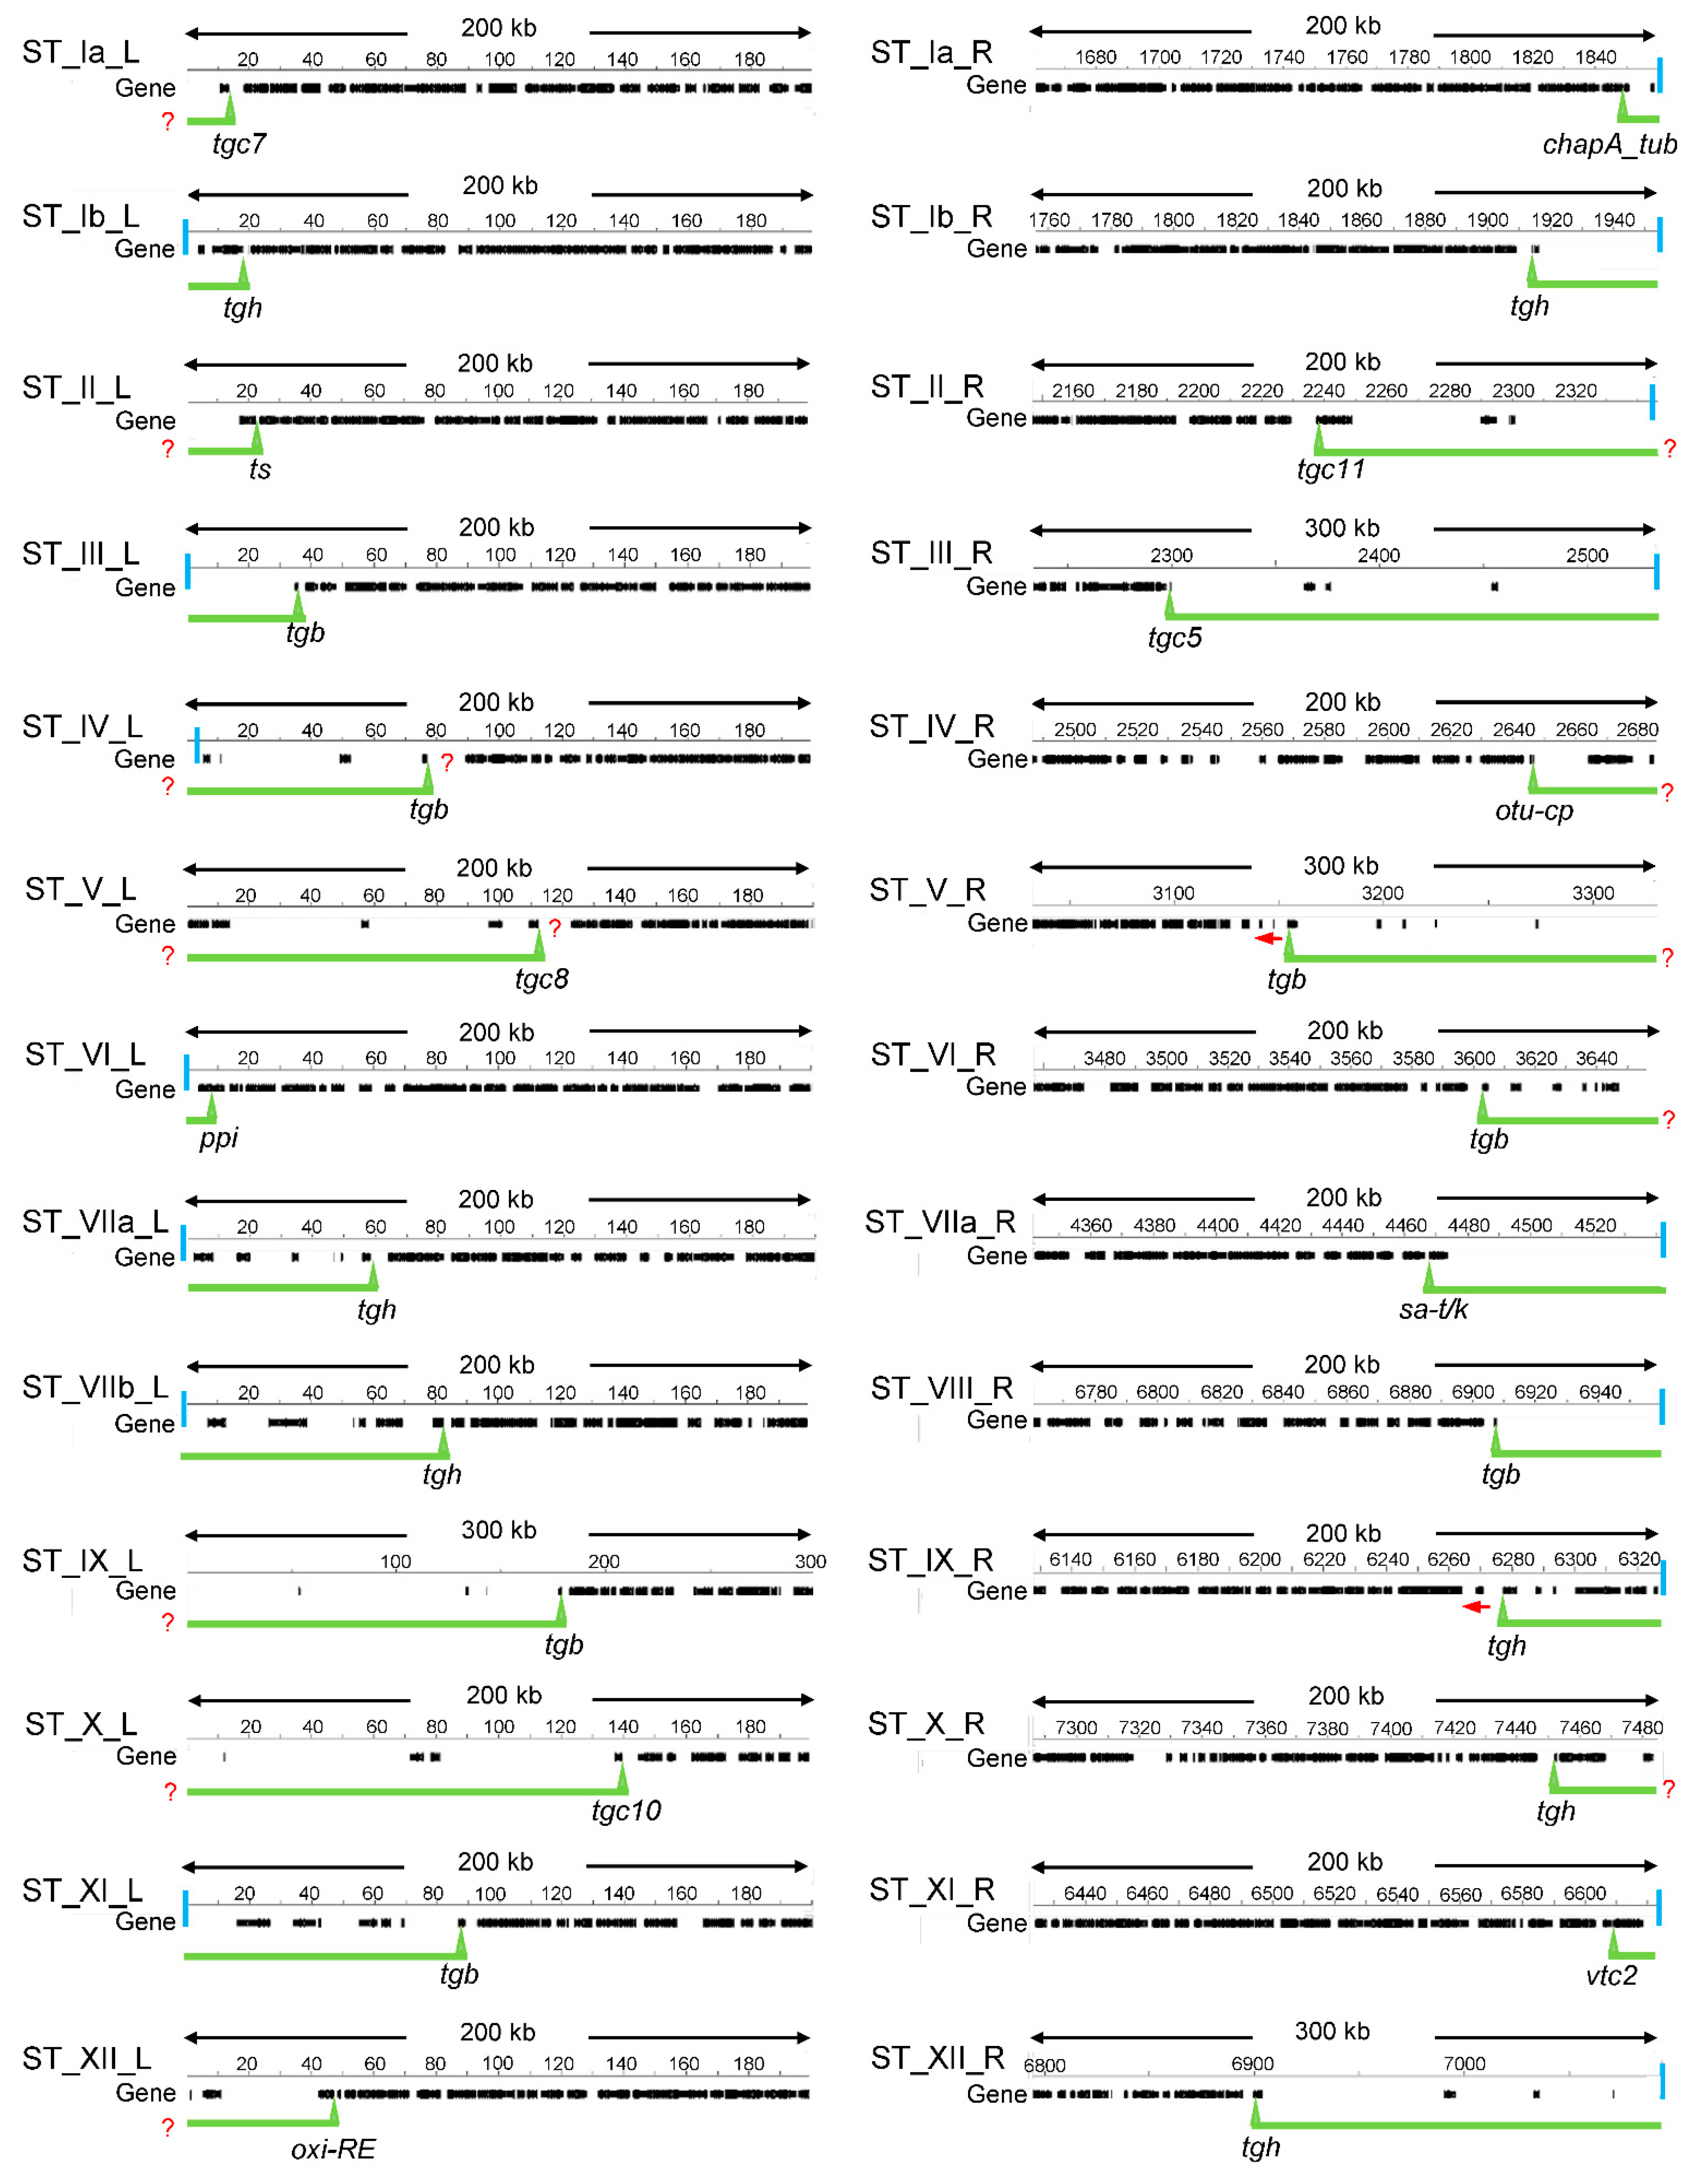
2.1. Defining T. gondii STs

The identification of T. gondii STs based on the search for conserved regions only detected nine STs out of a possible 26 [28], indicating that this strategy was insufficient. In yeast, STs were characterized on the basis of their poor gene density, compared to the high gene density-associated euchromatin [15]. Similarly, we defined the STs of the 13 T. gondii chromosomes by scanning the chromosome ends to detect gene density regions. In euchromatin, genes are separated among them by a short intergenic region. In T. gondii, the general intergenic region was observed to be of ~2000 bp, similar to what was proposed by the genome project (3404-bp) and also in N. caninum (3091 bp) [26,36]. Taking into account that the ST genes would be unrepresentative, we assume that these values are close to what is expected as a mean for intergenic distance in T. gondii euchromatin. For this reason, here we used an intergenic distance of 3500 bp between consecutive genes initiating a long genic array region. Near 200–300 kbp were scanned to detect gene poor regions from euchromatin (Figure 1). The boundaries of the STs were defined by the 5′ end of the first gene that is at the border of a region compatible with euchromatin as defined above. In cases where two contiguous genes were starting euchromatin, we chose the 5′ end of the one oriented towards the telomere. In cases where an ST FamC gene was immediate to the euchromatin, we took this as the border, as had been proposed [28]. Similarly, we selected the ST FamB gene as a border when it was immediate to euchromatin based on studies performed here (see below). With few exceptions, ST regions were easily defined with manual scanning. In the case of ST_Ib_L, TGME49_207370 was selected because the two upstream hypothetical genes have no evidence of expression. In the cases of ST_V_R and ST_IX_R, the upstream genes of selected border genes are oriented towards the centromere. It is important to notice that ST border genes only delimit the euchromatin from the gene-poor region, although it is unclear if they are subject to TPE. In this work, we have considered all of these genes associated with STs. On the other hand, it could be possible that in some cases STs extend beyond the border gene, as it is shown for ST_IV_L and ST_V_L (Figure 1).
The proposed STs and their most relevant characteristics are summarized in Table 1. The putative STs for all the T. gondii chromosomes could be established, which have a length ranging from 8.1 to 232.4 kbp (average 76.3), with a gene content ranging from one to eight per ST (average 3.7), and a GC content averaging 52.37%, similar to GC genomic content (Table 1). The ST gene density was calculated as the number of genes/kbp, resulting in 0.049, a low value compared to that observed for the general Me49 chromosomes gene density (0.16 genes/kbp).
Only 16/23 STs were associated with a T. gondii telomeric TTTAGGG repeat, suggesting that in such cases, the ST could be longer toward the telomere end (Figure 1). In 12 of the STs, we defined the ST border as a gene from FamB or FamC families, whereas 14 STs were delimited by single copy genes, either hypothetical or functional annotated genes (Table S1).

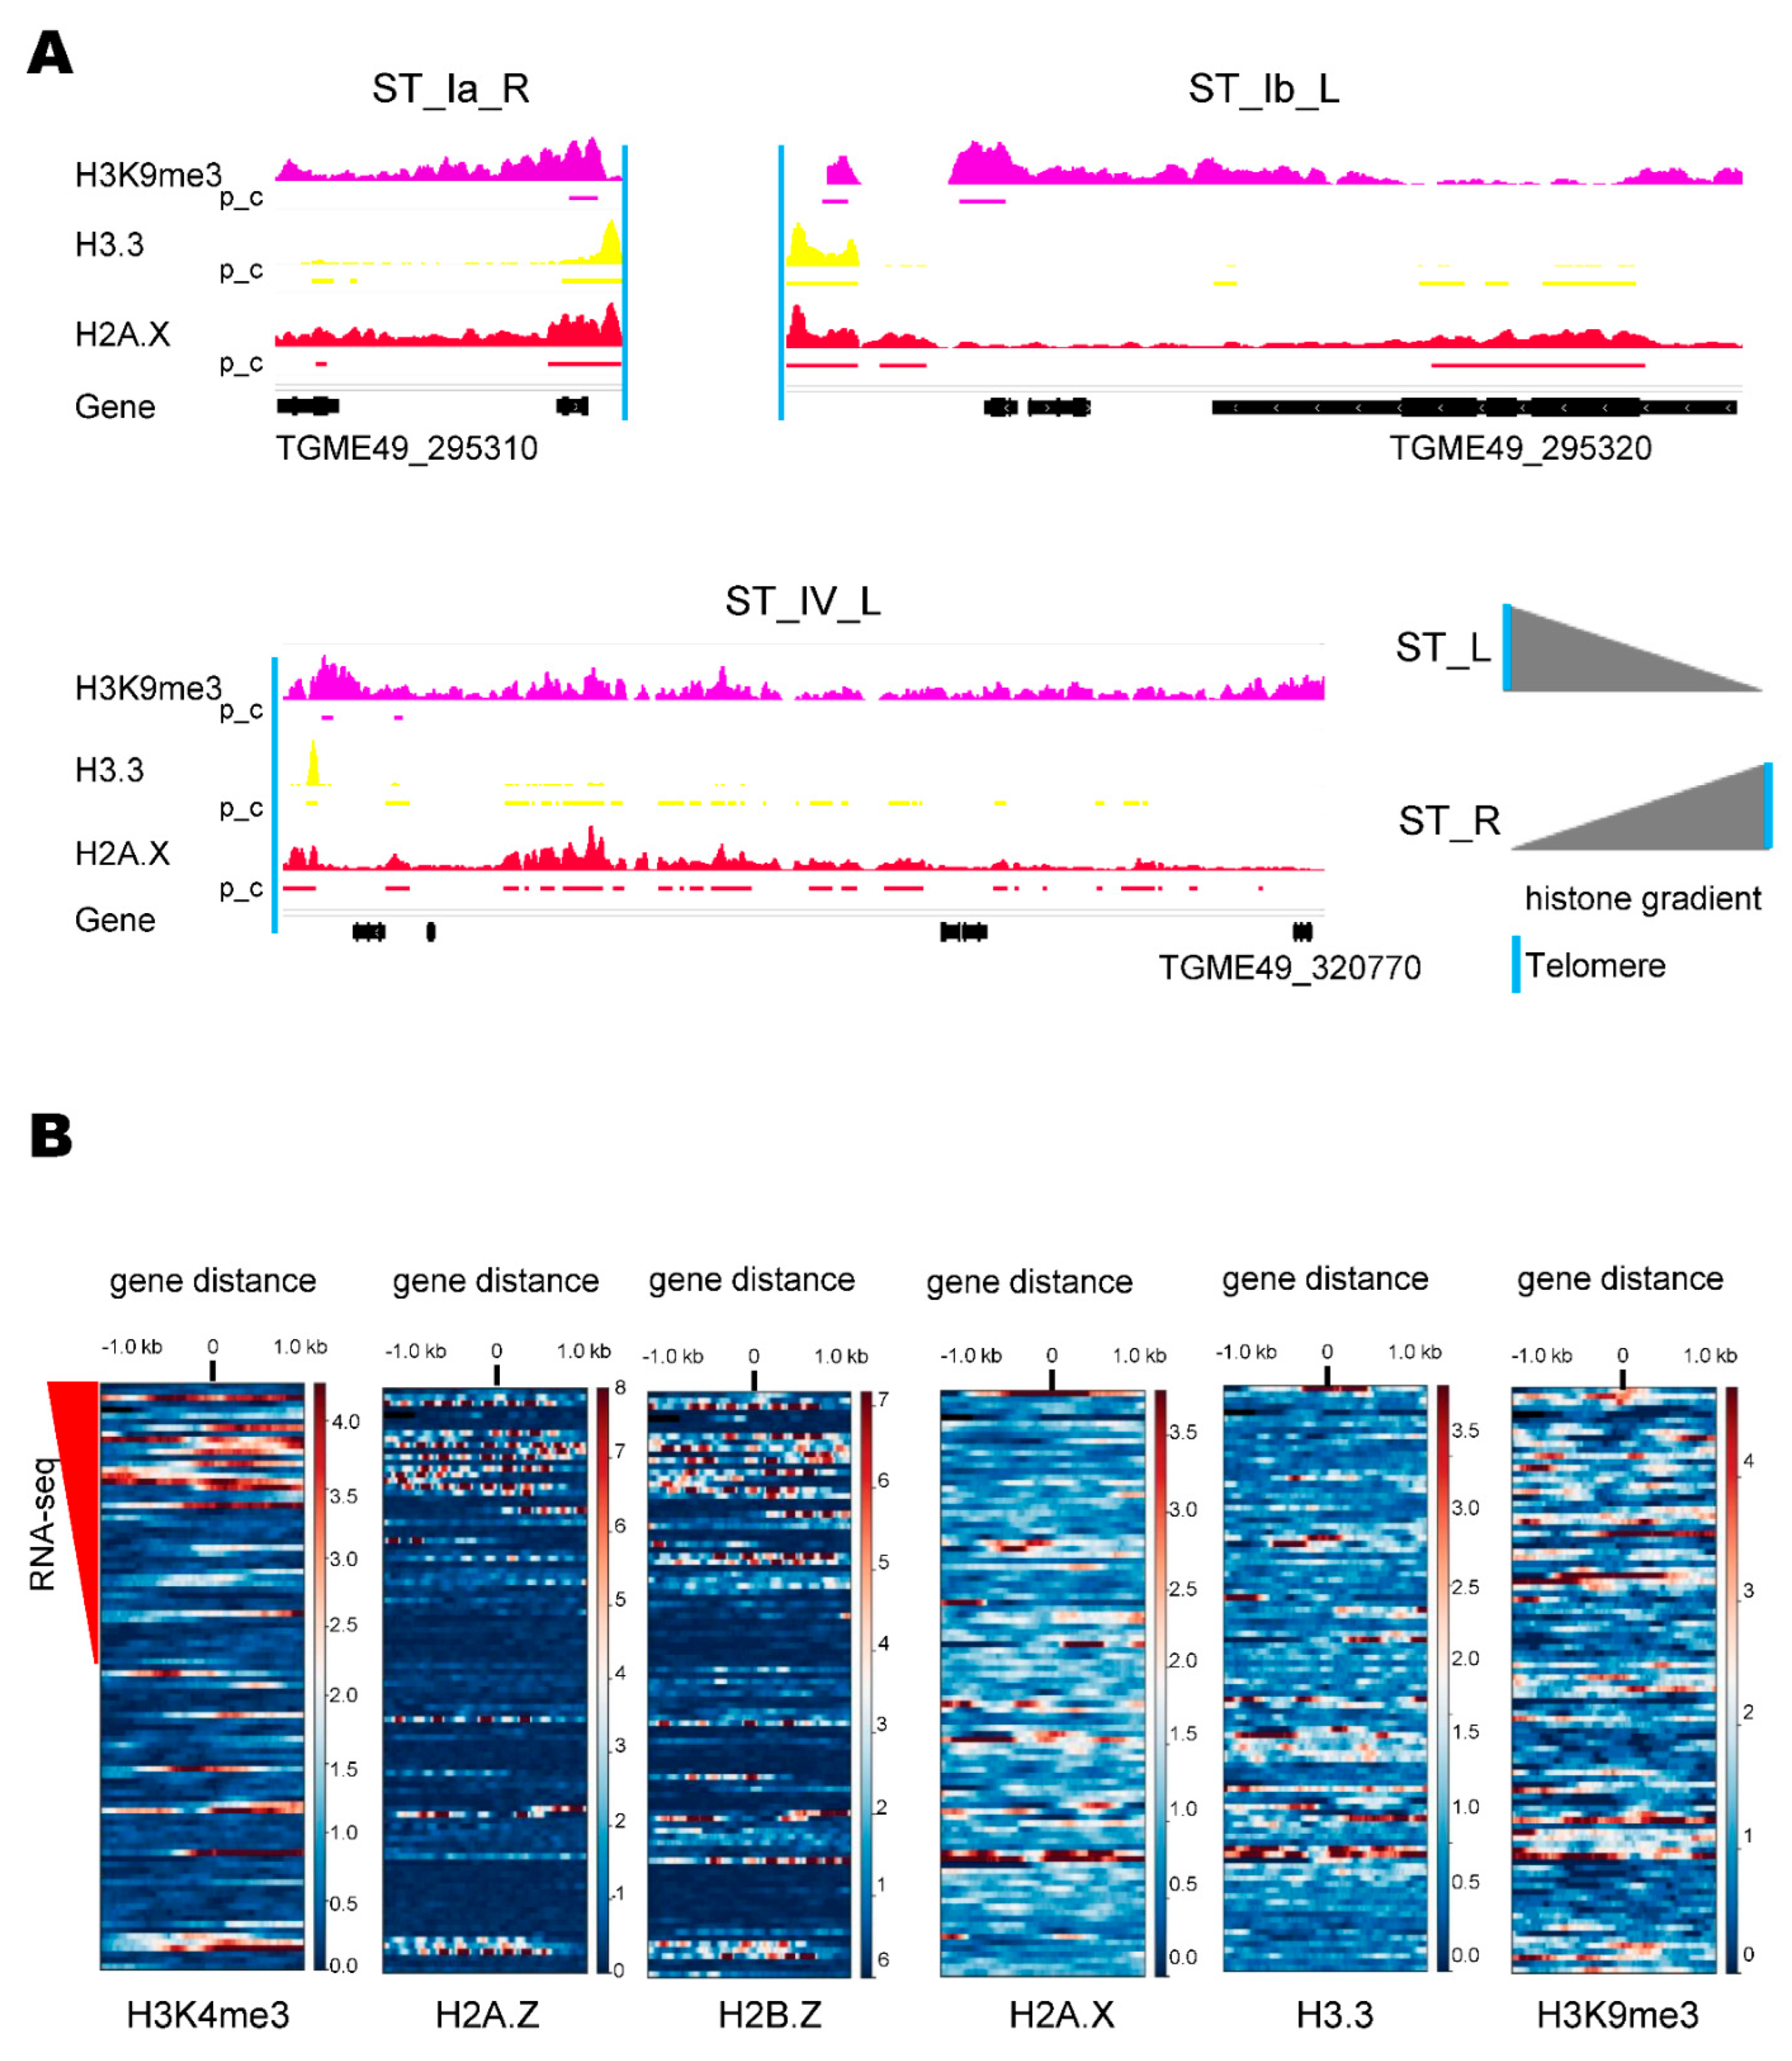
2.2. ST Chromatin Architecture

Histone marks and variants were analyzed in every chromosome. The global histone analysis showed clear peaks for H3K9me3, H3.3, and H2A.X at regions delimiting the ends of the chromosomes [31]. A detailed analysis of ChIP-seq assays (Table S2) showed that the intensities and/or peaks of these histones decreased from the chromosome end toward the centromere in most cases, being more evident for H3.3 and H2A.X (Figure 2A and Figure S1).
The histone H3K4me3 is a mark of transcription start sites (TSS)/promoters of active genes and colocalizes with histone variants H2A.Z and H2B.Z at almost all TSS/promoters of active genes [31,37]. Interestingly, it was suggested that the sole presence of H2A.Z/H2B.Z in a TSS is associated with the bivalent stage of chromatin. ST genes are subject to rapid expression in response to environmental changes, a condition that can be associated with bivalent promoters. Based on that, the presence of H3K4me3, H2A.Z, H2B.Z, H3.3, H2A.X, and H3K9me3 at the 5′ ends of the subtelomeric genes associated with their transcriptional activity was studied (Figure 2B). Only 39/97 ST genes showed RNA-seq evidence (Table S3). In the heat map analysis, the represented genes keep on the y-axis the same sorting as shown in the Table S3. In general, H3K4me3 colocalizes with H2A.Z/H2B.Z dimer at 5′ ends of active genes. There are seven cases of H3K4me3/H2A.Z and/or H2B.Z histones’ co-localization in genes without RNA-seq evidence, which may be associated with differences in the transcriptomic analysis. In addition, there were only two cases in which the dimer H2A.Z/H2B.Z was present at the 5′ ends of moderately active genes, suggesting that ST are not enriched in H2A.Z/H2B.Z-bivalent genes. H3.3 colocalizes with H2A.X, and both partially with H3K9me3, mainly at genes with intermediate or undetected expression.

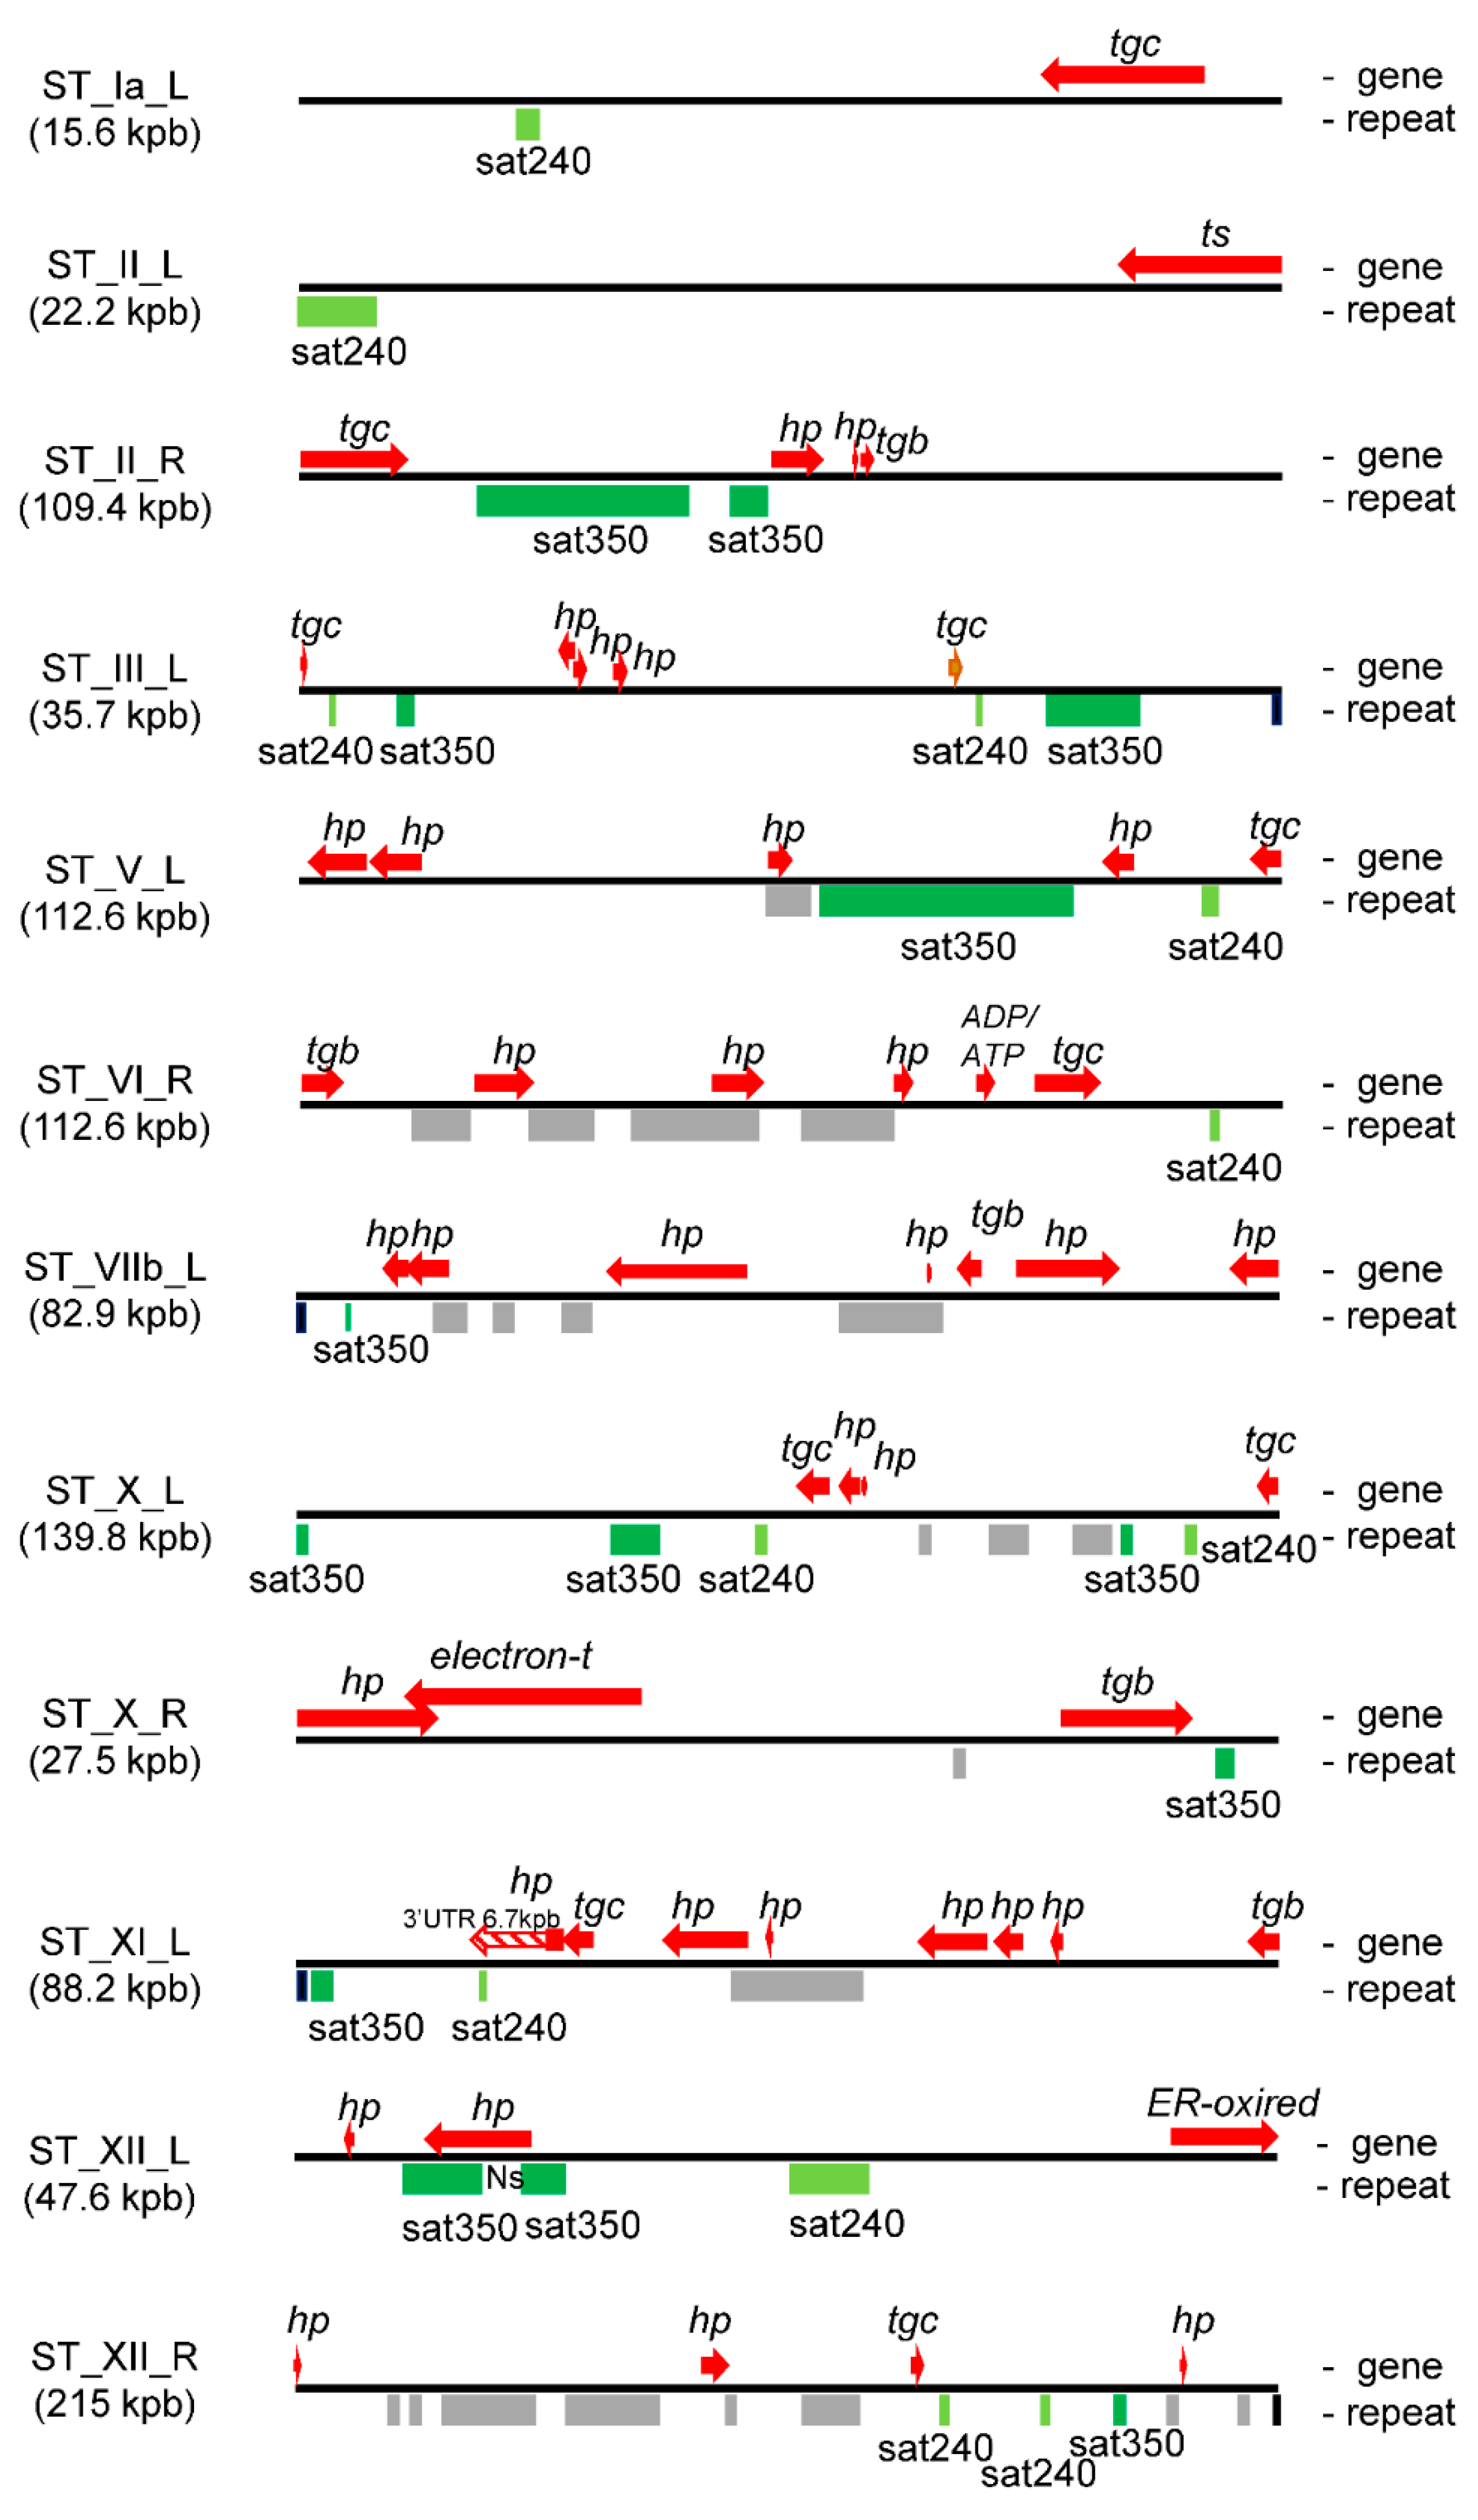
2.3. T. gondii STs Are Enriched in Tandem DNA Repeat Elements

Long tandem repetitive elements (from 10 to hundreds of bp) that may be present in regions of several kbp, called satellite DNA, are located in heterochromatic regions such as STs [38]. To analyze the presence and composition of satellite DNA at T. gondii STs, a dot plot study was carried out. In this way, it was possible to detect regions of repetitive DNA in tandem, compatible with satellite DNA, in 18/26 STs (Table 1, Figure S2). Almost all of the repetitive elements do not have high identities (data not shown). However, the presence of sat350 and sat240, as major satellite DNAs of T. gondii STs, could be detected. Noteworthy, sat529, a centromeric 529-bp satellite DNA [27,39], was also detected in ST_IV_R.
In order to determine whether sat350 and sat240 are also dispersed in non-subtelomeric regions of the T. gondii genome, identity screening was performed along all chromosomes using a dot plot analysis. In Figure S3, it is possible to observe that satellite DNA blocks containing sequences from the sat240 or sat350 families only appear in the STs of expected chromosomes and only in one case close to the centromeric region of chromosome IV (Figure S3). It is also possible to observe numerous small fragments (<100 bp) of both satellite DNAs, but mainly sat240, in internal regions of the chromosomes, compatible with euchromatin. Only a few 240 bp fragments for sat240 appear in euchromatin. This analysis indicates that sat240 and sat350 DNA satellite structures only appear in STs. Data were confirmed by Blastn searching at ToxoDB. The genome database only retrieved short sequences from both DNA satellites (data not shown). Analyzing the transcript database, only Sat240 retrieved two long sequences with significant similarity. One corresponded to the 3′UTR region of the ST gene transcript TGME49_307270, which has a long 3′ UTR region (Figure 3), and the other, with less similarity, to the 5′ UTR region of the TGME49_300980 gene (chromosome V), at 3012 bp from the ATG (data not shown).

2.4. Satellite DNA and Subtelomeric Genes

T. gondii STs present numerous predicted genes (Table S1), in addition to satellite DNAs. In order to know the distribution of these DNA elements, a map was generated for each ST with the sequences of the genes as they were annotated in ToxoDB and the sat350 sequences obtained in Figure S2. The vast majority of genes are positioned between satellite DNA blocks (Figure 3 and Figure S4). In fact, only six genes overlap with repetitive DNA, and only in one case with the sat350 element. It should be noted that the gene (TGME49_300790) that shares sequences with sat350 has a long Ns track in its sequence, which, in fact, separates the two sat350 blocks (Figure 3). Notably, 10 tgc genes (FamC family) were closely associated with sat240 and sat350 (Figure 3).
STs are very dynamic and unstable regions, and part of this dynamism is generated by DNA repeats. Consistent with this, Xia et al. [27] observed high plasticity in the copy number of sat350 among T. gondii strains and F1 progeny. To know if the dynamics can be extended to the genes present in the STs, an interstrain synteny analysis was carried out based on the presence of the genes enlisted in Table S1. The genome organization of 14 strains of T. gondii was retrieved from ToxoDB. Low synteny was considered when the analyzed ST gene was present in the same genome location only in six of the 14 T. gondii strains, or less, according to ToxoDB (Orthology and synteny section). Gene duplications and the presence of new genes were also included in some strains. The loss or gain of genes among strains was more evident in internal ST genes, mostly associated with the presence of satellite DNA, especially with sat240/sat350 (Table S1).

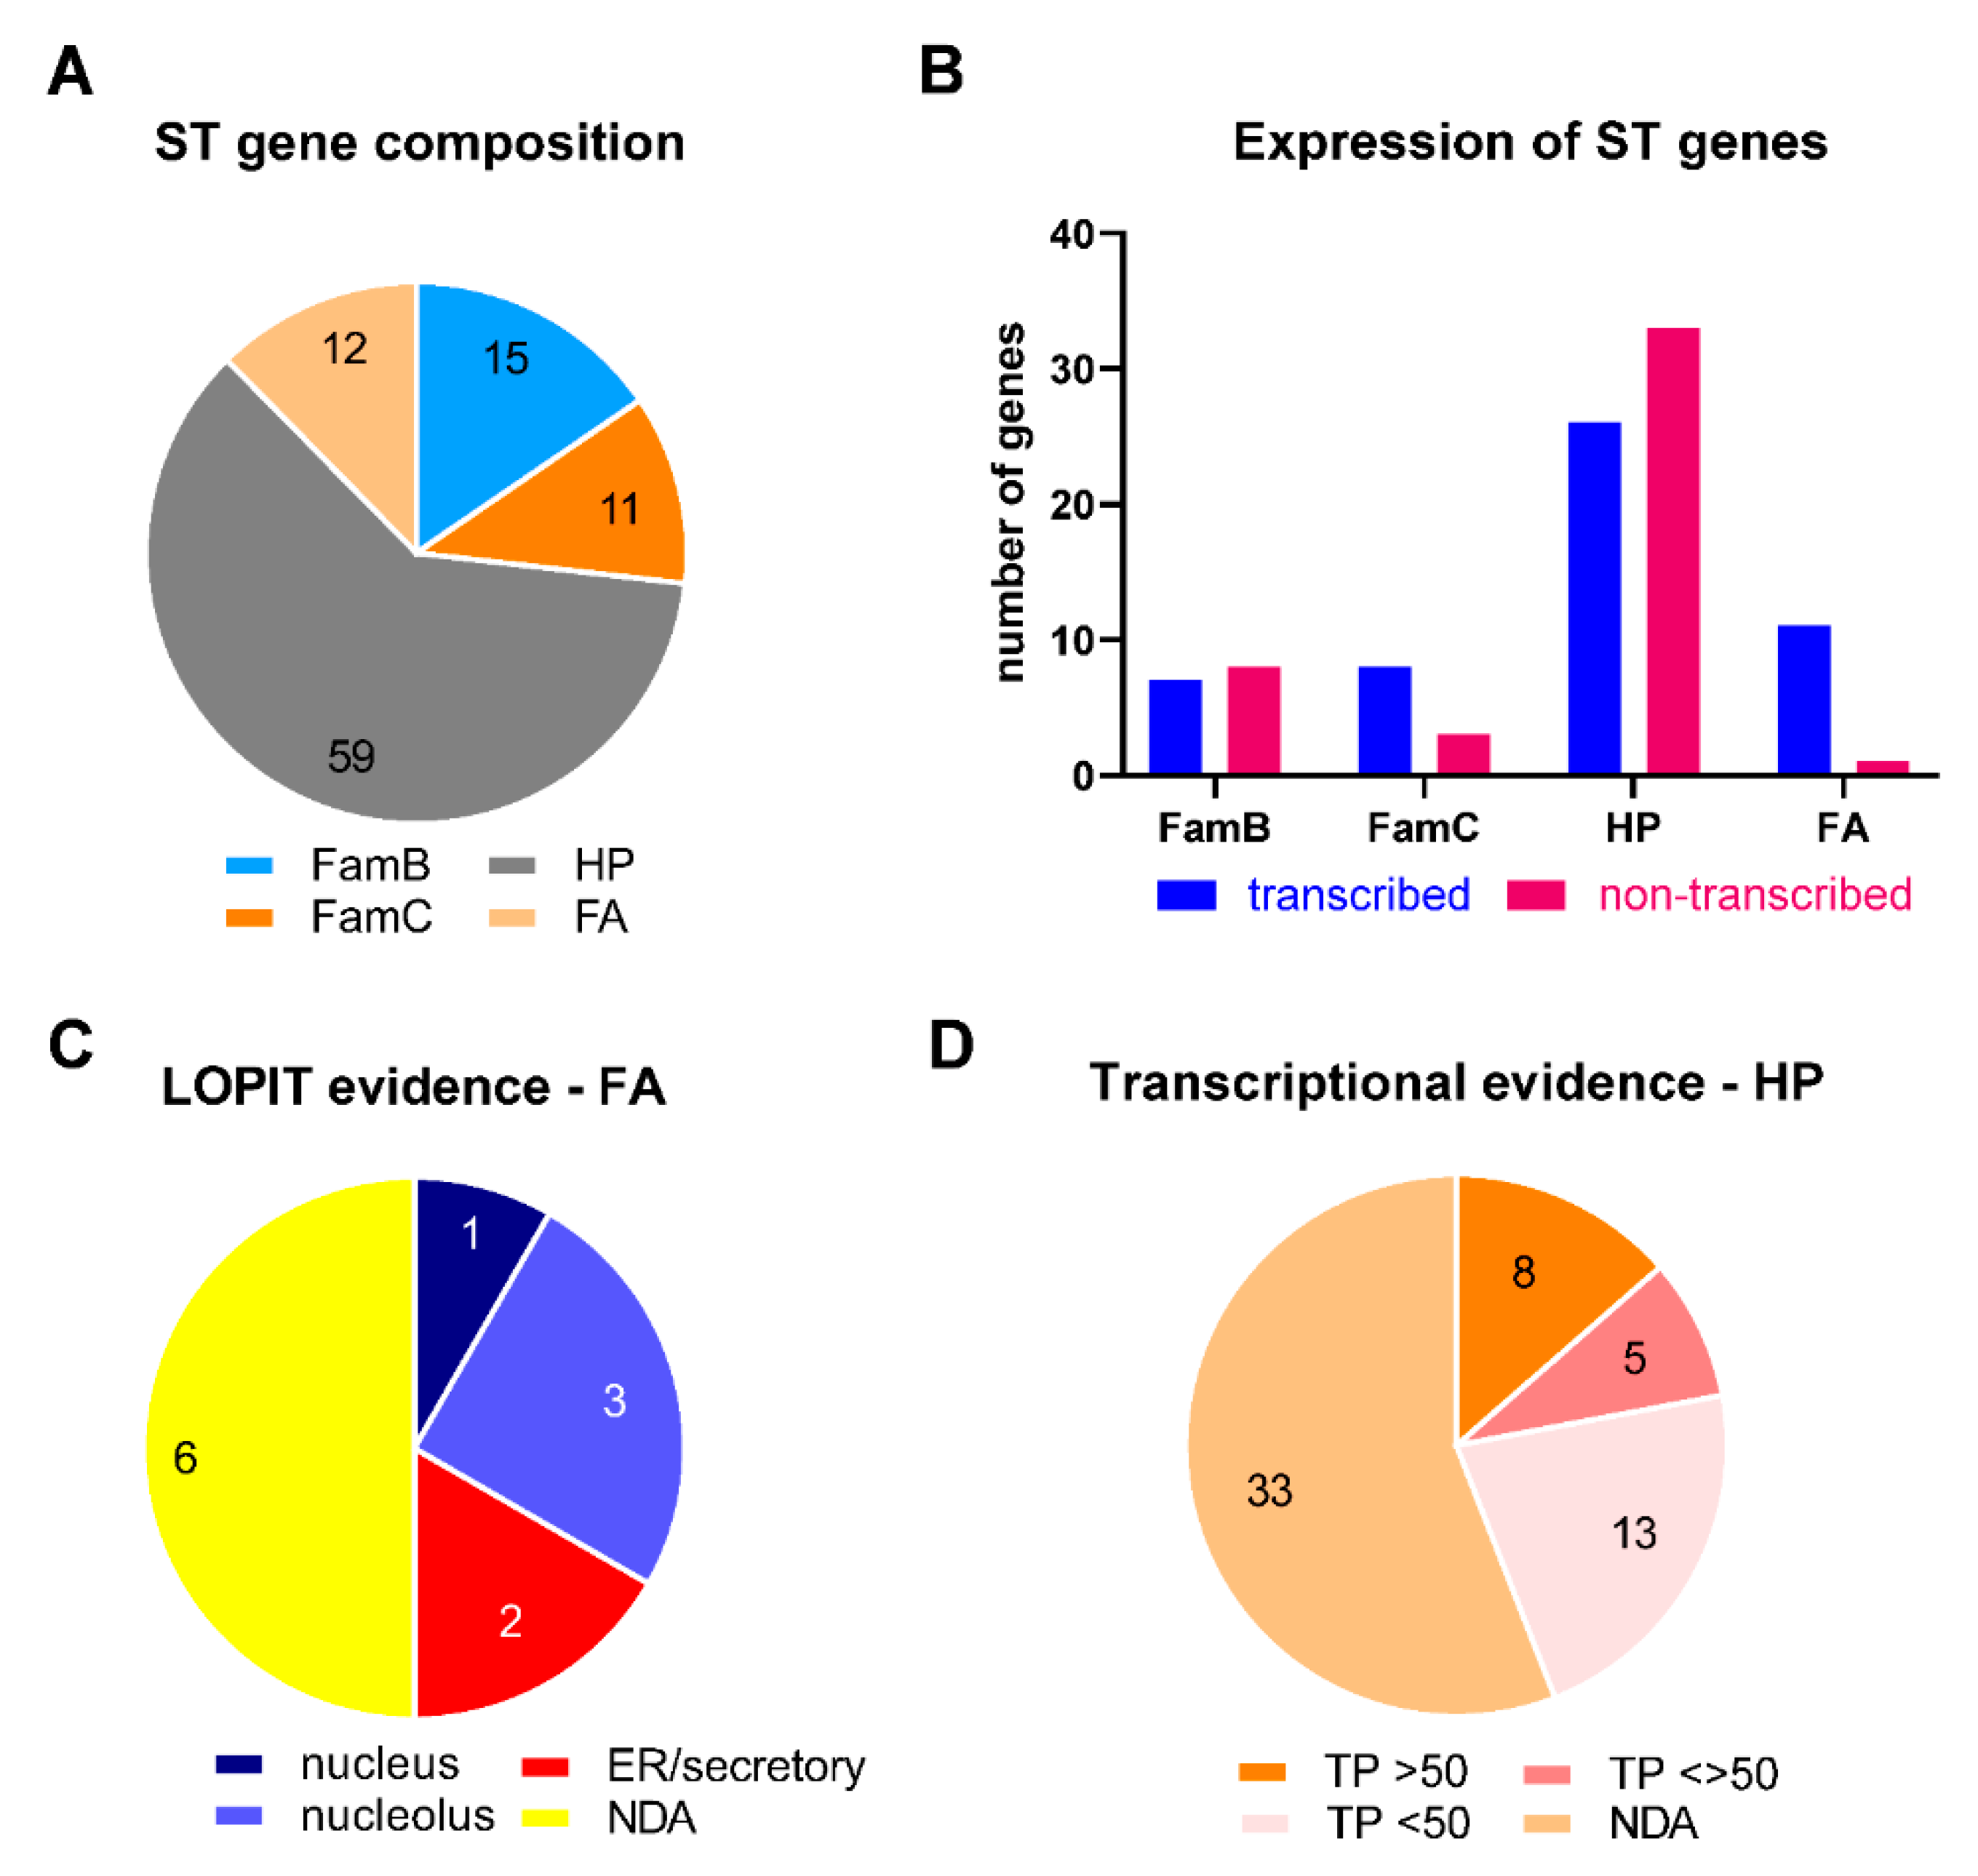
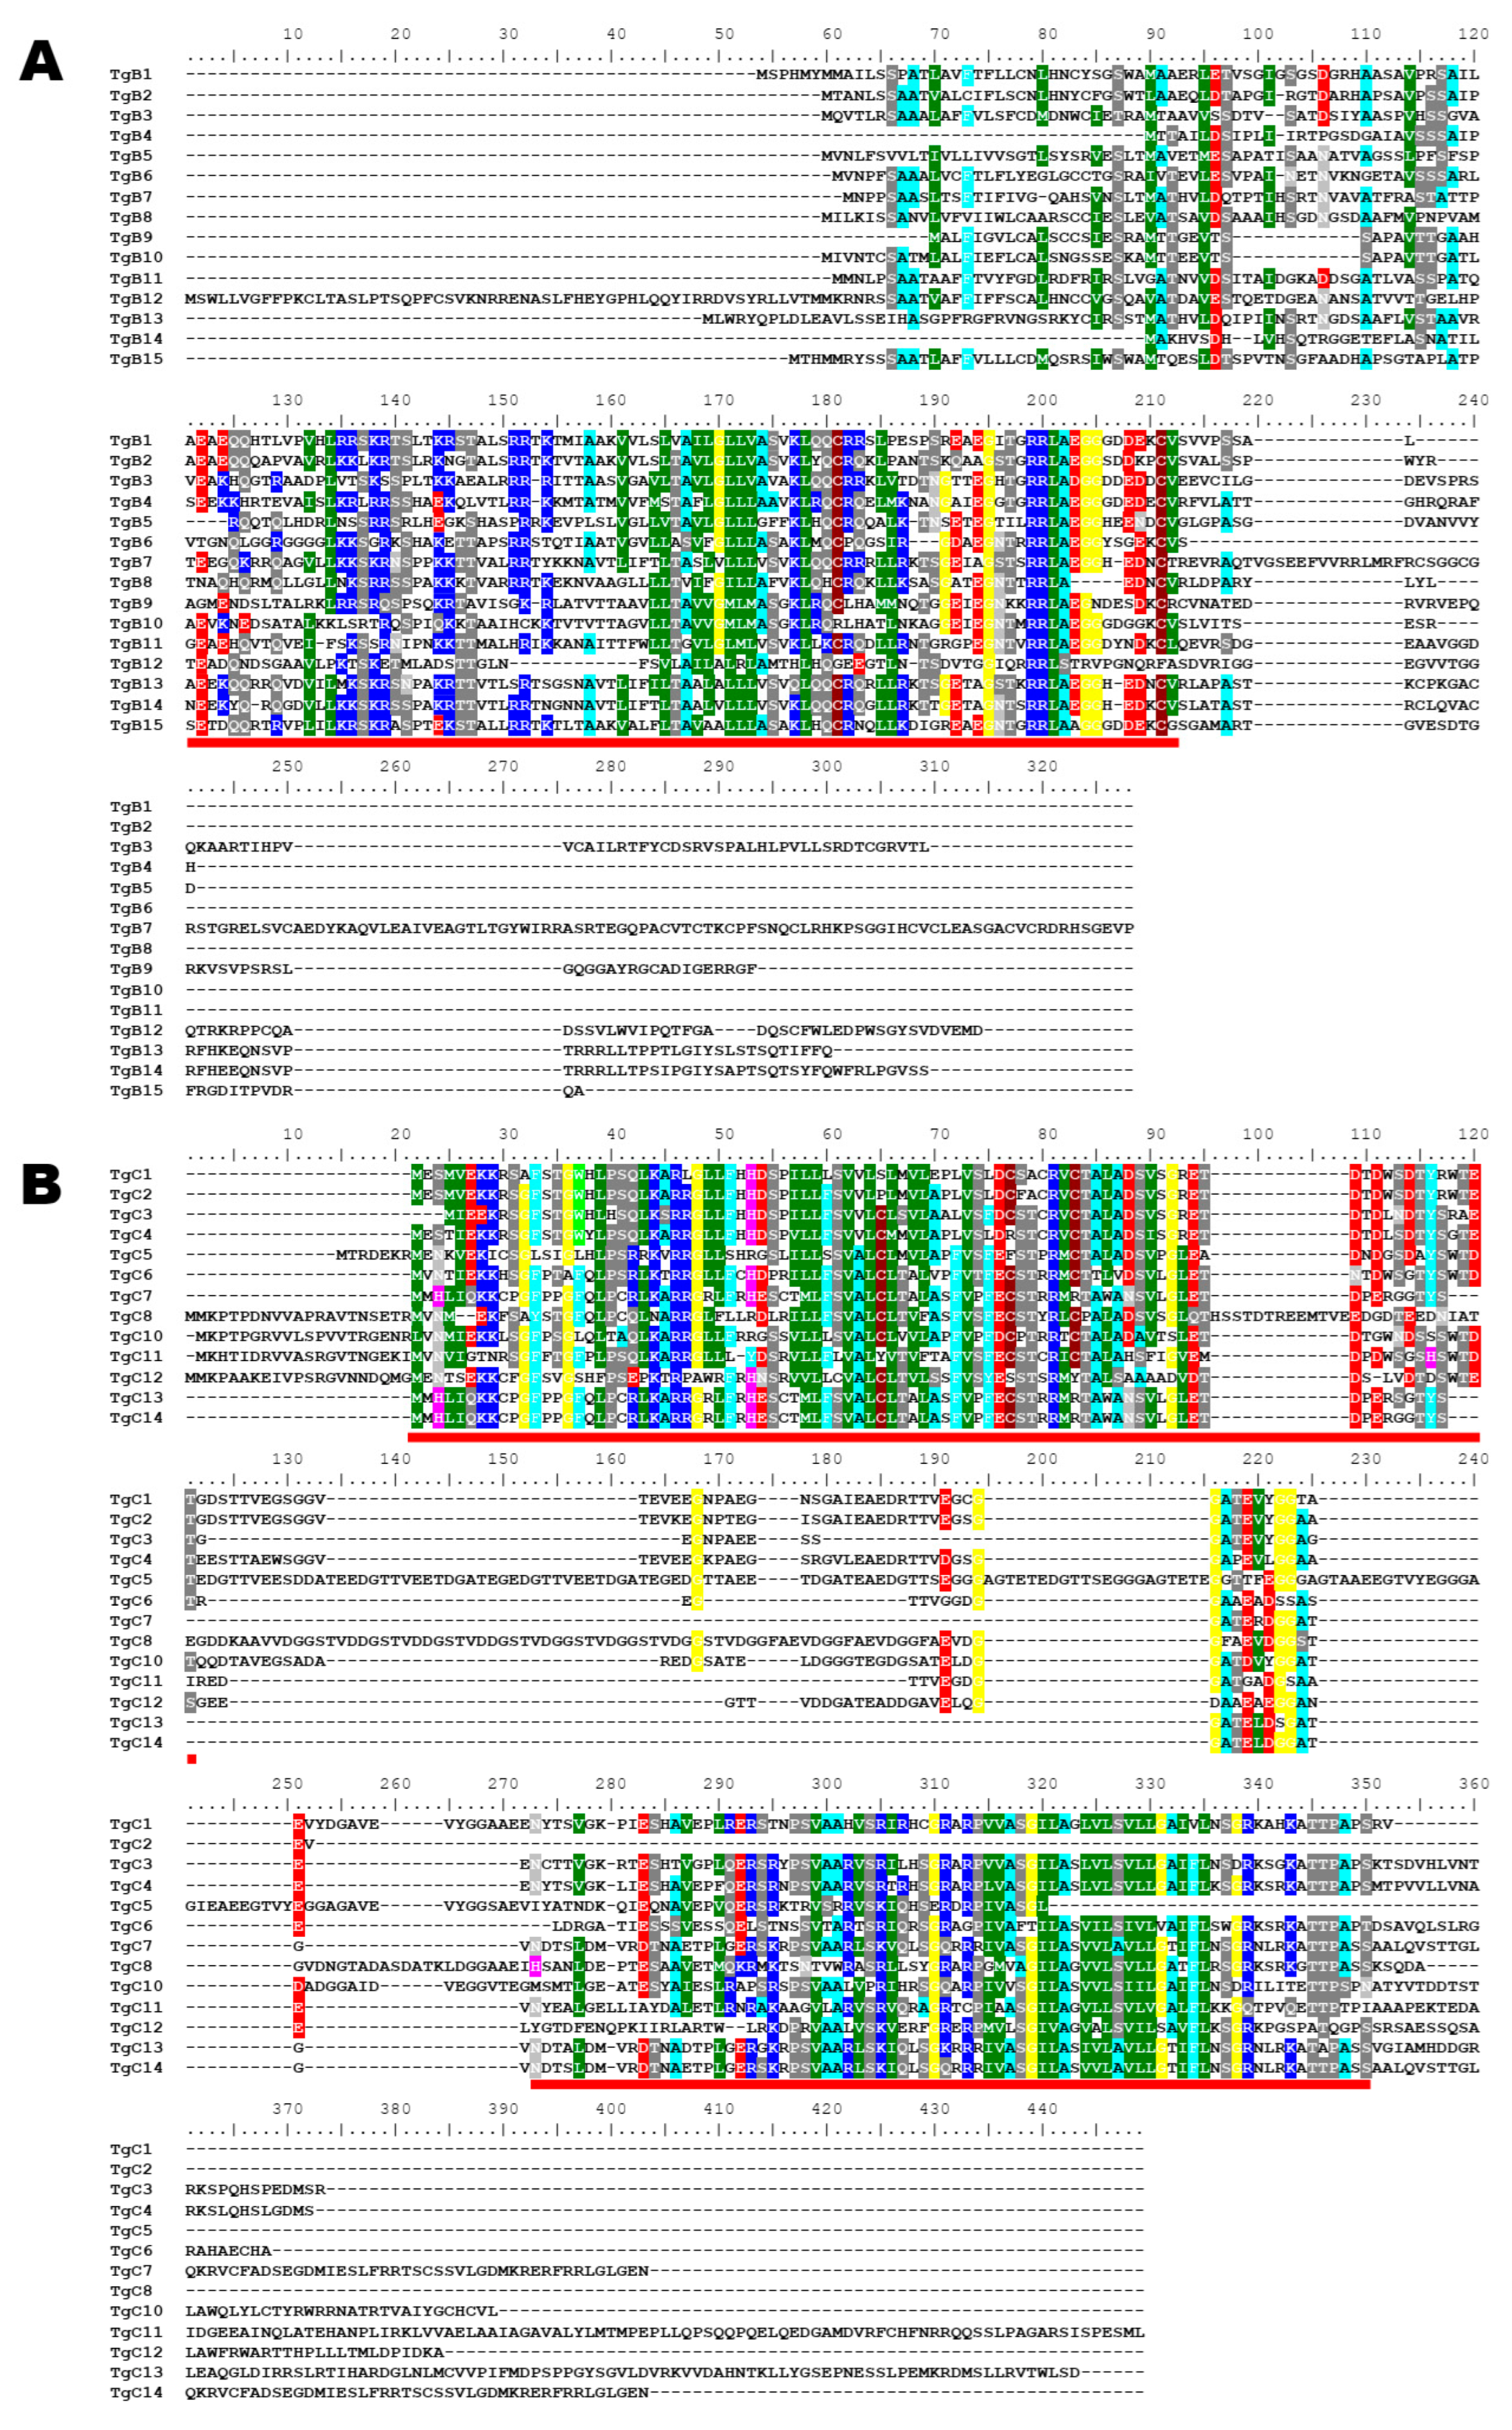
2.5. Features of ST Genes

Ninety-seven genes were identified in the STs, which were referred to as functional annotated (FA), hypothetical (HP), multigene family FamB, and multigene family FamC. The main features of these genes are described in Table 2 and Table S4. Only 12 HP and two FA genes present paralogs, some of them also located at ST (Table S1). The vast majority of them encode HP proteins (Figure 4A). The T. gondii Me49 strain, of low virulence but with cystogenic potential both in vitro and in vivo, has been taken as a reference in ToxoDB. However, there are transcriptomic data for other strains of T. gondii. We decided to incorporate data from Me49 and the highly virulent, non-cystogenic RH strain in this analysis. Analyzing the ToxoDB database, we were able to detect evidence of transcription in 53.7% of subtelomeric genes at ToxoDB (Table 2 and Table S4) and 40.2% by RNA-seq database (Table S3). The analysis by gene group shows variation in the expression rate among them, being lower in the group of hypothetical genes and higher in the group of simple functional annotated (FA) genes (Figure 4B).
Twelve FA genes were identified in the STs; almost all showed evidence of transcription, in many cases with proteomic data (Figure 4B, Table 2). Most functional annotated genes presented expression levels below the 50th percentile, without differences between strains (Table 2). Eight had a negative phenotype score, suggesting that they could be essential for the lytic cycle. TGME49_282230 and TGME49_207250 were detected in the oocyst proteome and showed low transcription levels in tachyzoite and a dispensable phenotype, suggesting that these genes are only active in this stage. The subcellular localization of the proteins encoded by the ST FA genes showed a bias towards the nucleus and endoplasmic reticulum (Figure 4C). However, no clear association among them could be predicted.
There was only one FA gene (TGME49_237700, ADP/ATP carrier protein) that did not show evidence of expression either by transcriptomics or mass spectrometry (Table S3). The ADP/ATP carrier is a predicted gene that would express a peptide of 61 amino acids. We consider that more studies are required to confirm its identity as a gene.
Fifty-nine hypothetical genes (HP) were located in T. gondii STs, and two are compatible with FamB-like genes (Table S4). Only four show evidence of being expressed as a protein by mass spectrometry and/or LOPIT. As expected for a subtelomeric region, most of the HP genes were silenced. In those where there is evidence of expression, transcription presents a low percentile level (<50; Figure 4D). Interestingly, 8.5% of ST HP genes presented significantly differential expression levels between strains (<>50), suggesting that these genes could be associated with their phenotypic differences.
The genes of FamB and FamC families and their deduced protein products shared some aspects: they encoded low molecular weight proteins, and most of their members possessed a signal peptide and one transmembrane domain (Table 2). Members of FamB and FamC were detected in N. caninum, H. hammondi, and T. gondii but not in other Apicomplexa (data not shown). Analysis of bioproject PRJNA597814 [26] did not retrieve any putative FamB or FamC gene different from those already detected.
To detect putative domains and/or proteins with structural similarity, several databases and programs were searched: NCBI CDD search, Jpred 4b PDB, Motifscan, and ProtVirDB. Protein domain analysis of FamB and FamC members did not yield any significant identity rather than some short regions, mainly at the transmembrane motif (data not shown). Therefore, accumulative data suggest identity associated with integral membrane proteins as it was annotated at ToxoDB.
The deduced amino acid sequences of the FamB and FamC proteins were aligned separately. FamB protein sequences present only one conserved region, whereas FamC has at least two conserved regions (Figure 5A,B). Both proteins present a highly variable C-terminal end. These data suggest that both FamB and FamC families encode highly variable membrane proteins.
Notably, the numbers of FamB and FamC genes annotated in the N. caninum, H. hammondi, and T. gondii databases are variable. For FamB, four genes were detected in N. caninum, seven in H. hammondi, and 15 in T. gondii (Table 2). For FamC, three genes were detected in N. caninum, four in H. hammondi, and 13 in T. gondii (Table 2). This observation could be indicative of an expansion of these two families in T. gondii.

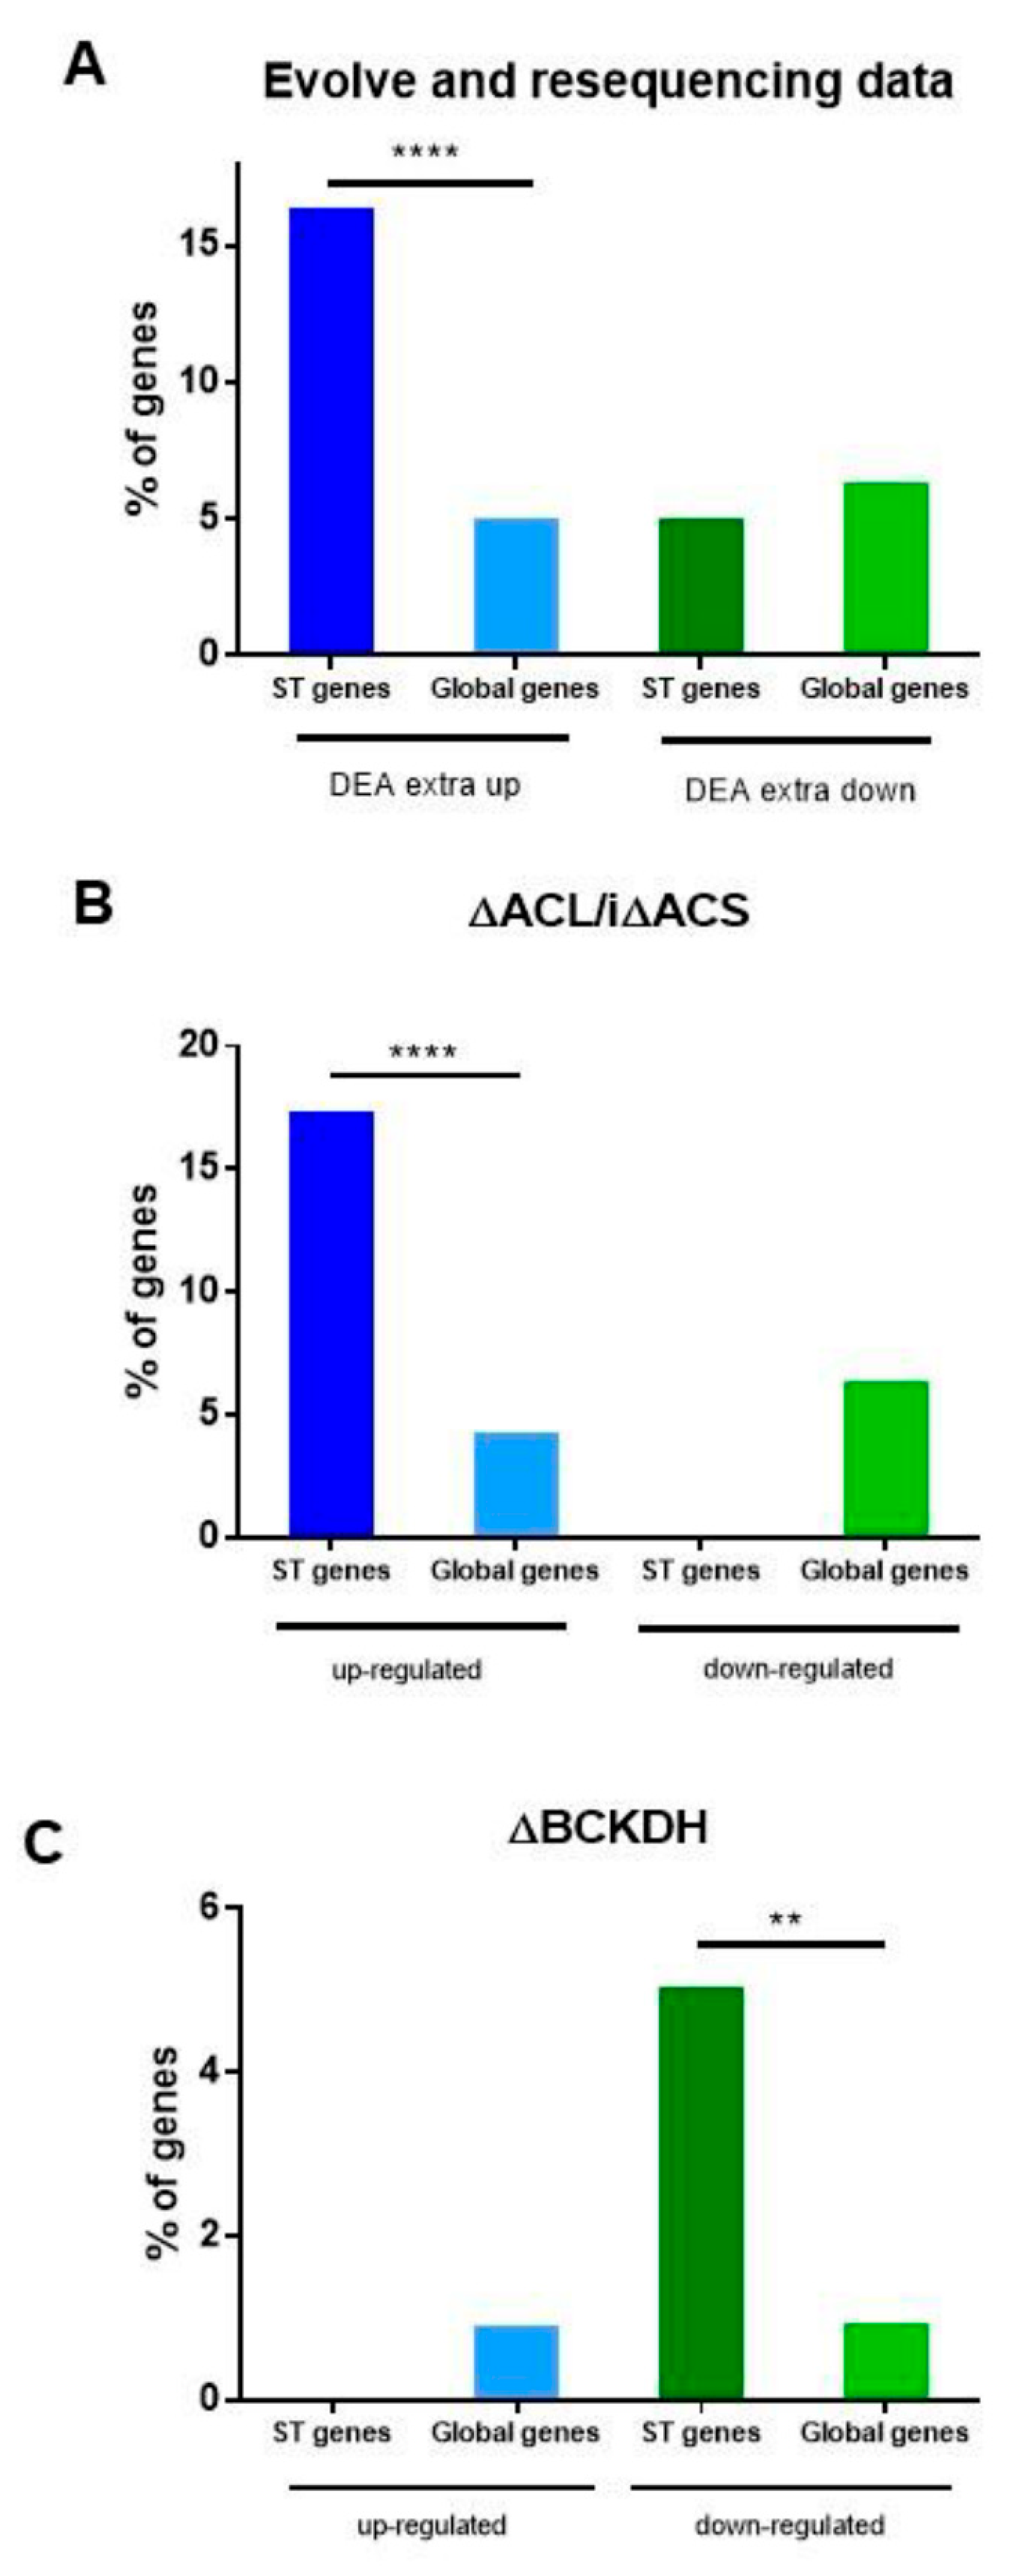
2.6. Role of ST Genes in Adaptability to Different Environmental/Metabolic Situations

Our hypothesis is that ST genes contribute to adaptation to different environmental situations. Recently Primo et al. [34] analyzed the transcriptional reprogramming of T. gondii tachyzoites grown in vitro for 1500 generations as part of an “evolve and resequencing” experiment. In vitro, tachyzoites remain outside the host cell for a longer time, needing to adapt to that environmental context and having to increase their capacity and efficiency to enter the host cell. In this environmental context, the authors observed important transcriptional changes in genes with the transcriptional signature of extracellular parasites. We analyzed the database of differential expression analysis (DEA) of extracellular-associated genes in STs (Table S5). We detected upregulation of 16 internal ST genes out of 435 and downregulation of three border ST genes out of 551 DEA enlisted genes. Taking into account the 97 ST genes, the 16 subtelomeric genes that were upregulated represent 16.5% of the total ST genes, a significantly higher value than that represented by upregulated genes (435) in the entire genome (8468) of the GT1 strain (Figure 6A). By contrast, ST genes were poorly represented in the group of downregulated genes. Interestingly, at least two tgc genes and at least one tgb gene were upregulated, whereas euchromatin multigene FamA, FamD, and FamE genes were downregulated (Table S5).
One of the environmental conditions that can have a great impact on the growth and establishment of T. gondii in the host is associated with the availability of nutrients in the different tissues invaded [40]. Recently, Kloehn et al. [35] analyzed the role of subcellular sub-pools of acetyl-CoA. One of the T. gondii lines (ΔACL/iΔACS) presented impaired nuclear-cytosolic acetyl-CoA production due to a double mutation: ATP citrate lyase (ACL) gene knockout and acetyl-CoA synthetase inducible (i) knockdown. This could be considered a situation that mimics glucose deprivation. The transcriptome of the ΔACL/iΔACS line shows the upregulation of 376 genes and the downregulation of 75 genes. Analyzing these data, we observed that 17 ST genes (13 internal and four border genes) fall into the upregulated group, while no ST genes fall into the downregulated group (Table S5). Among them are FamB, FamC, and hypothetical genes. ST genes (17.5%) are strongly overrepresented in comparison to the group of genes (4.4%) that are upregulated in the absence of acetyl-CoA (Figure 6B). Four hypothetical genes are shared in both experiments, and none of them presented transcription evidence in normal growth conditions (Table S5). No ST gene was detected in the upregulated transcriptome of tachyzoites deficient in mitochondrion acetyl-CoA, based on T. gondii lacking branched-chain α-keto acid dehydrogenase-complex (BCKDH) [35]. By contrast, five ST genes (two FamB, one FamC, one HP, and one FA) were detected in downregulated genes (Table S5, Figure 6C). One of them encodes for enoyl-CoA, which is important in the metabolism of unsaturated fatty acids in beta-oxidation.
These data suggest that subtelomeric genes could play an important role in the adaptation of T. gondii to diverse environmental shifts, but in each case, responding with different genes.

3. Discussion

STs are regions of the chromosome involved in genomic integrity, the timing of DNA replication, and the transition region between euchromatin and heterochromatin. From the species point of view, STs provide a region of rapid evolution of subtelomeric genes, allowing greater plasticity and adaptability to the changing environment. In pathogens, such as Plasmodium spp and Trypanosoma spp, they are also a source of genetic diversity that contribute to pathogenicity and virulence. T. gondii is an example of adaptability to different environments and hosts, where STs could contribute to the species’ spread in nature. In this work, T. gondii STs were predicted for each chromosome based on gene density. We could define 26 STs ranging from 8.1 to 232.4 kbp, averaging 76.3 kbp. In our previous work [28], STs were defined through a comparative genomic analysis strategy. However, STs are rapidly evolving regions, and such analysis could have been partial. In fact, only nine out of 26 possible STs were detected in that study [28]. In yeast, STs were detected as low gene density regions compared to the uniform gene distribution regions that are not considered subtelomeric [15]. In the same analysis, the yeast STs were defined as the 33 kbp region from telomeres. Here, the length of telomeres was more variable. Similarly, the length of the subtelomeric regions in T. cruzi ranges from 5 to 182 kbp, and the authors suggested that the shortest STs could have been generated by a chromosomal break and a telomere healing event [41]. This could also explain the differences in the length of the T. gondii STs.
After defining the STs, we analyzed their chromatin architecture. Our detailed analysis of H2A.X, H3.3, and H3K9me3 enrichment throughout the subtelomeric region supports the heterochromatic composition of STs, as previously observed [31]. H3K9me3 is a recognized mark of repeat-rich constitutive heterochromatin [42]. However, this mark showed homogenous spreading on STs, whereas H2A.X and H3.3 were detected predominantly near telomeres and in poorly expressed or silent subtelomeric genes. H2A.X is phosphorylated at the SQE C-terminal motif under double-strand break damage, and this modified histone is called γH2A.X [43]. In oncogenic mammalian cells, H2A.X and γH2A.X were observed in STs, participating in the protection of genomic instability that can occur at the origins of replication at transcription sites [44]. The H2A.X mark was accompanied by the H3.3 mark in the T. gondii STs. In Plasmodium, H3.3 demarcates subtelomeric repeat DNA elements and GC-rich coding sequences [45]. Histone H3.3 is required for the establishment of heterochromatin during the epigenetic reprogramming of the fertilized oocyte in mammals [46]. Recently, it was observed that the phosphorylation of H3.3 in the telomeric regions/STs would modulate the state of chromatin condensation during the cell cycle and the loss of phosphorylation accompanied genomic instability and the presence of high levels of γH2A.X [47]. The pattern observed for H2A.X and H3.3 in the STs of the T. gondii chromosomes suggests their important role in gene silencing and establishing the heterochromatin of this region, maybe contributing to the maintenance of genome stability and TPE.
Active genes are enriched with the histone H3K4me3 and the dimer H2A.Z/H2B.Z at the 5′ end. Few cases of the sole presence of H2A.Z and/or H2B.Z in low-expression genes were observed. The presence of H3K4me3/H2A.Z/H2B.Z in the TSS region and 5′ end of active genes in T. gondii tachyzoites was recently observed, while the sole presence of H2A.Z/H2B.Z could be an indicator of a bivalent chromatin state [31]. In the T. gondii STs, a similar behavior for these histones was observed, suggesting that there is not a high level of bivalent genes.
Repetitive tandem DNA, compatible with satellite DNA, was observed in most STs but without strictly following the order of TARE1 to three, as previously described [28]. The fact that in that work, the identification of ST used the identity of end chromosomes could be the reason for this difference. The most consistent repeating element of satellite DNA corresponds to the sat350 family, followed by sat240. The rest of the satellite DNAs did not show similarities among them. While satellite DNAs are fairly homogeneous and sequence-level differences are seen between species, the high heterogeneity of satellite DNA in T. gondii STs is intriguing. In fact, sat350 DNA consists of highly variable units or monomers [48]. Sat350 also showed variability in numbers between strains and, very interestingly, also in the number of copies in the F1 progeny with respect to their parents [27]. Taken together, the data suggest a highly dynamic genomic region, maybe contributing to the plasticity and evolution of STs. A synteny analysis of STs on the basis of gene loss or gain, as well as gene duplication events, suggested that internal subtelomeric genes are under a highly dynamic process between strains, and this plasticity is greater when satellite DNA is present. The analysis could be biased because many STs that do not present satellite DNAs have only one gene, most of them located at the ST border. However, rather than indicating a bias, it could support the hypothesis that the lack of satellite DNA in ST is associated with lower mobilization of genes from different regions of the genome to satellite-free STs, which would argue in favor of less dynamic regions.
In addition to plasticity, the presence of satellite DNA in ST may have other roles. We observed that there are few genes overlapping with satellite DNA sequences. However, many genes are found between blocks of satellite DNAs, in some cases closely neighboring. The presence of satellite DNA has been shown to influence the expression of neighboring genes in other species [49]; therefore, some ST genes could be affected by the different ST satellite DNAs. In that sense, the association of sat240 and sat350 elements with FamC genes is intriguing. Future studies should shed light on the nature of this association.
Although the presence of long blocks of sat240 and sa350 in euchromatin was not observed, in the case of sat240, there seems to be a wide distribution of smaller short fragments, less than 100–200 bp, in almost all the chromosomes. This tandem repeat was identified in this work; therefore, there is no previous data. In contrast, the chromatin and miRNA expression of sat350 and sat529 have been determined [30]. In the future, a similar study should be carried out to infer the role of sat240 in ST but also extend to the whole T. gondii genome.
Toxoplasma STs encompass one or more genes in their territories. A total of 97 genes could be linked to STs, a large number associated with inactive chromatin and low or no transcription evidence, as expected for genes under TPE. Seventy-one of these genes encode for HP or FA proteins. Although genes linked to metabolic pathways were observed in STs [22,50], a detailed analysis indicates that there is no obvious relationship between genes located in T. gondii STs, with the exception of the FamB and FamC multigenic families, whose roles have not yet been identified.
Our hypothesis that ST genes would be associated with environmental stress was challenged on the basis of transcriptomes from two recent publications [34,35]. We were able to observe that, indeed, around 16 ST genes were transcriptionally associated with an adaptation to the extracellular passage, an event that may be linked to increased virulence and invasive capacity of the host [34]. Notably, no genes from the other non-subtelomeric multigene families FamA, FamD, and FamE were identified on the upregulated list, whereas they were on the downregulated list. These data suggest that FamB/C and FamA/D/E families may acquire opposite roles in the face of some environmental changes. Future studies are needed to determine if the upregulation of FamC and FamB genes is associated with invasion, host cell attachment, and extracellular stress.
Similarly, 17 ST genes were shown to be associated with cytosolic acetyl-CoA deficiency. Cytosolic acetyl-CoA is a major metabolite of the tricarboxylic acid pathway and energy production. It also regulates the acetylation of several proteins, and its lack in T.gondii showed a deficiency in the acetylation of several proteins, mainly histones H2A.Z, H2B.Z, H2Bb, and H4 [35]. This aspect would link the role of histone acetylation as sensors of nutrient changes in the environment with the activation of genes that adapt to nutritional stress [51,52], where the ST genes would have a relevant role given their enrichment. The transcriptome of the BCKDH line, which produces acetyl-CoA in the mitochondrion, also includes a small group of ST genes, only in the case of those that are downregulated. The genes of the FamB and FamC family (three out of five) are also highly enriched. One of downregulated ST genes is enoyl-CoA, associated with the beta-oxidation of fatty acids, a process that leads to the formation of acetyl-CoA. Loss of BCKDH expression also leads to hypoacetylation of mitochondrial proteins. Clearly, ST genes present a complex regulation mechanism under different metabolic stresses. Future studies should shed light on the role of these genes.

4. Materials and Methods

4.1. Sequence Analysis

FamB and FamC orthologues were retrieved from the NCBI database, www.toxoDB.org, www.plasmodb.org, www.cryptodb.org, and www.piroplasmadb.org (accessed on 6 March 2022), using a Blastp search. Every T. gondii FamC and FamB protein sequence was used as query sequences. The signal peptide probability was confirmed by SignalP 5.0 (https://services.healthtech.dtu.dk/service.php?SignalP-5.0, accessed on 15 March 2022). The signal peptide cleavage site was predicted by PSORT II (https://psort.hgc.jp/form2.html, accessed on 15 March 2022). The TM region was retrieved from PSORT II. The signal peptide and transmembrane domains were confirmed from the ToxoDB report. The repetitive DNA regions were determined by a dot plot analysis on the Yass webpage (https://bioinfo.lifl.fr/yass/yass.php, accessed on 28 August 2022) [53]. The analysis was extended to the first 100 kbp of each chromosome end, except when the border of the proposed ST extended beyond 100 kbp. The identity of the DNA satellites was confirmed using a combination of the Yass and Blastn programs (https://blast.ncbi.nlm.nih.gov/, accessed on 13 May 2022). The gene density analyses were performed in the ToxoDB using a manual scan of the genome Browser, versions 53 and 57. Additionally, the synteny of the genes detected in Me49 was determined in the 14 strains, including Me49 in ToxoDB (version 53), by manual inspection, orthology, and synteny section.
Alignments were performed by the MUSCLE program (Molecular Evolutionary Genetics Analysis, MEGA-X) at standard conditions: Gap open: −2.9, Gap extend: 0, Hydrophobicity multiplier: 1.2, Max memory in MB: 2018, Max interactions: 16, Cluster methods: UPGMA, and Min diag length (lambda): 24. FamB and FamC predicted proteins were searched by Motif scan (https://myhits.sib.swiss/cgi-bin/motif_scan, accessed on 5 April 2022); SMART (http://smart.embl-heidelberg.de/, accessed on 5 April 2022); NCBI Conserved Domains (https://www.ncbi.nlm.nih.gov/Structure/cdd/wrpsb.cgi, accessed on 5 April 2022); J-Pred (http://www.compbio.dundee.ac.uk/jpred/, accessed on 5 April 2022) and ProtVirDB (http://bioinfo.icgeb.res.in/protvirdb, accessed on 23 April 2022) software. New data on the N. caninum genome was generated and available at https://www.ncbi.nlm.nih.gov/bioproject/, accessed on 15 January 2022); under accession number PRJNA597814. Since genes are still not annotated, the presence of additional putative FamB and FamC genes was searched using tblast.

4.2. Chromatin Analysis

ChIP-seq raw data publicly available was downloaded from GSE98806 and GSE104347 (GEO-NCBI). The specific samples used for this study are summarized in Table S1. Paired- or single-end reads were aligned against the T. gondii Me49 genome version 53 using Bowtie 2 [54]. Genome-wide coverage profiles were computed in R (Bioconductor GenomicRanges) and normalized so that the average coverage for every chromosome was 1. The normalized coverage profiles were saved as bigwig files and visualized in IGV [55]. ChIP-seq peaks for histone marks were called with MACS2 [56,57] using a threshold for the q-value of 0.05. The occupancy peaks called by MACS2 were assessed manually in the Integrative Genomics Viewer (IGV, Broad Institute) by comparing them with the coverage profiles computed in R.
For heatmaps representations of the 97 annotated ST genes (Table S1), genome-wide coverage profiles were represented relative to the 5′ end using Deeptools (https://deeptools.readthedocs.io/en/develop/, accessed on 25 May 2022) [58]. The genomic location for the represented group of genes was obtained from ToxoDB. The 5′ end corresponds to the 5′ untranslated region (UTR) when annotated or to the first ATG of the coding sequence (CDS). For correlation with transcription levels, previously quantified RNA-seq data was used by Crocken et al. [59]. The average of 3 biological replicates grown and harvested at pH 7 was used for gene sorting.

4.3. Statistical Analysis

Statistical analysis was performed using GraphPad Prism 6.0 software (GraphPad Software Inc., San Diego, CA, USA). The results were analyzed using Fisher’s exact test. p-values < 0.05 were considered to be statistically significant.

5. Conclusions

Here, we have generated a more precise idea of ST chromatin’s architecture, plasticity, and organization. The presence of 97 ST genes is highlighted. The preliminary characterization of these genes shows differences in expression and degrees of interstrain conservation with properties that could be consistent with virulence- and/or adaptability-associated genes. In addition, the lack of conservation of some STs genes added to their overrepresentation and upregulation as a consequence of metabolic shift or a non-normal extracellular passage would indicate that STs genes could be involved in the adaptability of T. gondii to different environments. Among the subtelomeric genes, there are two multigene families (FamB and FamC) of putative integral membrane proteins with high variable C-terminal region that seemed to be expanded in T. gondii compared with N. caninum and H. hammondi. Their role remains intriguing and encourages further study to determine their relevance in T. gondii biology and pathogenicity. Some of them are regulated by environmental or metabolism shifts. The rapid evolution rate and diversity of FamB and FamC genes may contribute to T. gondii’s adaptation to different hosts or host cell types favoring its expansion. In addition to ST genes, we also found several examples of satellite DNA, among them the already characterized sat350 and a new element called sat240. It is important to highlight that satellite DNAs have been shown to generate a wide variety of non-coding RNAs [30,60]. Although this study was not addressed in this work, Braun et al., 2010 [30] showed that numerous miRNAs cover sat350 and sat529 sequences. Future studies should also analyze the possible transcription of ST lncRNAs.

Supplementary Materials

The following supporting information can be downloaded at: https://www.mdpi.com/article/10.3390/epigenomes6030029/s1, Table S1: List and description of T. gondii STs. Table S2: Major datasets analyzed. Table S3: RNA-seq data of 97 ST genes. Table S4: List and description of ST single hypothetical genes. Table S5: List of ST genes detected in differential expression analysis (DEA). Figure S1. Chromatin landscape of the T. gondii subtelomeric regions. Normalized coverage profiles showing the location of the histones H3K9me3 (violet), H3.3 (yellow), and H2A.X (red) for the different subtelomeric regions proposed (green rectangle). The analyzed regions extend beyond the STs arbitrarily in each case. Below, in black, the gene location is indicated. The vertical light blue line indicates the presence of telomeric repeat. The dashed vertical blue line indicates interstitial telomeric repeat. The red ? indicates the possibility that the ST region extends beyond de defined one. Occupancies of histone marks were plotted with the Integrated Genomics Viewer (IGV). Scale: H3K9me3, 0–4.21; H3.3, 0–1.76 and H2A.X, 0–2.05. Figure S2. Satellite DNA identification in STs. The determination of the repetitive DNA regions was carried out by dot plot analysis, using 100 kbp from each end for all STs (ST) that did not exceed that length. In those STs that exceeded 100 kbp, the length was taken to the border of the ST. In the case of the STs of the left arms (L), direct sequences were used. In the cases of the STs of the right arm (R), reverse complementary (RC) sequences were used. The location of satellite DNAs sat240 and sat350 are indicated in the figure. Figure S3. Presence of sat240 and sat350 on T. gondii chromosomes. To search for sat240 and sat350 satellite DNA elements, a sequence block of different repeats was generated to track its presence in T. gondii chromosomes by dot plot. For sat240 we used the sequences of the mentioned repeat from chromosomes Ia (position 3393–4035), III (position 2,308,702- 2,310,007), V (position 103,058–105,247), X (position 64,449–66,824), XII (position 7,042,760- 7,044,628), generating a 8432-bp sequence block. For sat350 we used parts of the repeat sequences from chromosomes II (position 2,257,761–2,271,082), III (position 2,323,699–2,327,108), V (position 62,336–81,515), XII (position 4952–9238), and the GenBank sequences AY333785, AF022237, AY330209 and M57917, generating a 43,507-bp sequence block. All sequences were oriented in the same direction. Each sequence block was compared to the complete chromosome sequences. Once the dot plot was obtained, the similarity is shown as vertical lines. Green lines represent direct alignment, and red lines represent complementary reverse alignment. An interactive analysis was performed on each line to determine the length of the similar sequence. According to the analysis, the presence of sat240 was represented as light green arrowheads, whereas sat350 as dark green arrowheads. *: sequence of 240–300 bp. #: sequence of 350 bp. The rest of the vertical lines presented similar fragments of less than 200 bp. The scale varies for each chromosome. Note that when there are no significantly similar DNA fragments in the comparison, the program provides truncated versions of the chromosome. Figure S4. Arrays of genes and satellite DNA sequences present in STs. Based on the dot plot analysis and data from the Table S1, a map of the position of each gene (top) and satellite DNA (bottom) was constructed for each ST. The figure shows a selection of STs that contain satellite DNA different from sat240 or sat350. The length of satellite DNAs and genes are scaled for each ST. Note that each ST has a different scale according to its length. Satellite DNA: grey. The names of the genes respond to the criteria of the additional file Table S1. Ns: track of N (any nucleotide) in the ST sequence and genomic gene.

Author Contributions

S.M.C. participated in all the experiments and analyses; R.T.Z.S. and K.K. participated in chromatin analysis; L.K. participated in bioinformatic approaches; E.M.R., C.C. and M.C. performed protein analysis; J.O., L.V. and S.O.A., designed the study and participated in its supervision; S.O.A., wrote the first draft. All authors have read and agreed to the published version of the manuscript.

Funding

This work was supported by the Ministerio Nacional de Ciencia y Tecnología (MINCyT): PICT 2015 1288 (S.O.A.), PICT 2018 2434 (L.V.), Consejo Nacional de Investigaciones Científicas y Tecnológicas (CONICET): PIP 11220150100145CO (S.O.A., L.V.) and by National Institute of Health: NIH-NIAID 1R01AI129807 (S.O.A.).

Institutional Review Board Statement

Not applicable.

Informed Consent Statement

Not applicable.

Data Availability Statement

The data that support the findings of this study are available from the corresponding author upon reasonable request.

Acknowledgments

SM Contreras (Fellow), C. Cristaldi (Fellow), EM Rivera (Fellow), L. Vanagas (Researcher), J. Ocampo (Researcher), L. Kamenetzky (Researcher), M. Clemente (Researcher) and SO Angel (Researcher) are members of CONICET. SO Angel (Full) and L Vanagas (Adjunct) are Professors at Universidad Nacional General de San Martin (UNSAM). A Ganuza (Technician) is a member of CIC (Buenos Aires Province).

Conflicts of Interest

The authors declare that there are no conflict of interest.

References

  1. Janssen, A.; Colmenares, S.U.; Karpen, G.H. Heterochromatin: Guardian of the Genome. Annu. Rev. Cell Dev. Biol. 2018, 34, 265–288. [Google Scholar] [CrossRef] [PubMed]
  2. Pryde, F.E.; Louis, E.J. Limitations of silencing at native yeast telomeres. EMBO J. 1999, 18, 2538–2550. [Google Scholar] [CrossRef] [PubMed]
  3. Figueiredo, L.M.; Freitas-Junior, L.H.; Bottius, E.; Olivo-Marin, J.C.; Scherf, A. A central role for Plasmodium falciparum subtelomeric regions in spatial positioning and telomere length regulation. EMBO J. 2002, 21, 815–824. [Google Scholar] [CrossRef]
  4. Barry, J.D.; Ginger, M.L.; Burton, P.; McCulloch, R. Why are parasite contingency genes often associated with telomeres? Int. J. Parasitol. 2003, 33, 29–45. [Google Scholar] [CrossRef]
  5. Loney, E.R.; Inglis, P.W.; Sharp, S.; Pryde, F.E.; Kent, N.A.; Mellor, J.; Louis, E.J. Repressive and non-repressive chromatin at native telomeres in Saccharomyces cerevisiae. Epigenet. Chromatin 2009, 2, 18. [Google Scholar] [CrossRef]
  6. Hernandez-Rivas, R.; Perez-Toledo, K.; Herrera Solorio, A.M.; Delgadillo, D.M.; Vargas, M. Telomeric heterochromatin in Plasmodium falciparum. J. Biomed. Biotechnol. 2010, 2010, 290501. [Google Scholar] [CrossRef] [PubMed]
  7. Jezek, M.; Green, E.M. Histone Modifications and the Maintenance of Telomere Integrity. Cells 2019, 8, 199. [Google Scholar] [CrossRef] [PubMed]
  8. Diotti, R.; Esposito, M.; Shen, C.H. Telomeric and Sub-Telomeric Structure and Implications in Fungal Opportunistic Pathogens. Microorganisms 2021, 9, 1405. [Google Scholar] [CrossRef]
  9. Yadav, R.K.; Matsuda, A.; Lowe, B.R.; Hiraoka, Y.; Partridge, J.F. Subtelomeric Chromatin in the Fission Yeast S. pombe. Microorganisms 2021, 9, 1977. [Google Scholar] [CrossRef]
  10. Steglich, B.; Stralfors, A.; Khorosjutina, O.; Persson, J.; Smialowska, A.; Javerzat, J.P.; Ekwall, K. The Fun30 chromatin remodeler Fft3 controls nuclear organization and chromatin structure of insulators and subtelomeres in fission yeast. PLoS Genet. 2015, 11, e1005101. [Google Scholar] [CrossRef] [Green Version]
  11. Tashiro, S.; Nishihara, Y.; Kugou, K.; Ohta, K.; Kanoh, J. Subtelomeres constitute a safeguard for gene expression and chromosome homeostasis. Nucleic Acids Res. 2017, 45, 10333–10349. [Google Scholar] [CrossRef] [PubMed]
  12. Ottaviani, A.; Gilson, E.; Magdinier, F. Telomeric position effect: From the yeast paradigm to human pathologies? Biochimie 2008, 90, 93–107. [Google Scholar] [CrossRef] [PubMed]
  13. Wyse, B.A.; Oshidari, R.; Jeffery, D.C.; Yankulov, K.Y. Parasite epigenetics and immune evasion: Lessons from budding yeast. Epigenet. Chromatin 2013, 6, 40. [Google Scholar] [CrossRef]
  14. Azzalin, C.M.; Lingner, J. Telomere functions grounding on TERRA firma. Trends Cell Biol. 2015, 25, 29–36. [Google Scholar] [CrossRef]
  15. Brown, C.A.; Murray, A.W.; Verstrepen, K.J. Rapid expansion and functional divergence of subtelomeric gene families in yeasts. Curr. Biol. CB 2010, 20, 895–903. [Google Scholar] [CrossRef]
  16. Teunissen, A.W.; Steensma, H.Y. Review: The dominant flocculation genes of Saccharomyces cerevisiae constitute a new subtelomeric gene family. Yeast 1995, 11, 1001–1013. [Google Scholar] [CrossRef]
  17. Hasin, Y.; Olender, T.; Khen, M.; Gonzaga-Jauregui, C.; Kim, P.M.; Urban, A.E.; Snyder, M.; Gerstein, M.B.; Lancet, D.; Korbel, J.O. High-resolution copy-number variation map reflects human olfactory receptor diversity and evolution. PLoS Genet. 2008, 4, e1000249. [Google Scholar] [CrossRef]
  18. Tembo, D.; Montgomery, J. Var gene expression and human Plasmodium pathogenesis. Future Microbiol. 2010, 5, 801–815. [Google Scholar] [CrossRef]
  19. Cross, G.A.; Kim, H.S.; Wickstead, B. Capturing the variant surface glycoprotein repertoire (the VSGnome) of Trypanosoma brucei Lister 427. Mol. Biochem. Parasitol. 2014, 195, 59–73. [Google Scholar] [CrossRef]
  20. Cestari, I.; Stuart, K. Transcriptional Regulation of Telomeric Expression Sites and Antigenic Variation in Trypanosomes. Curr. Genom. 2018, 19, 119–132. [Google Scholar] [CrossRef]
  21. Ramirez, J.L. An Evolutionary View of Trypanosoma Cruzi Telomeres. Front. Cell. Infect. Microbiol. 2019, 9, 439. [Google Scholar] [CrossRef] [PubMed]
  22. Li, Y.; Leveau, A.; Zhao, Q.; Feng, Q.; Lu, H.; Miao, J.; Xue, Z.; Martin, A.C.; Wegel, E.; Wang, J.; et al. Subtelomeric assembly of a multi-gene pathway for antimicrobial defense compounds in cereals. Nat. Commun. 2021, 12, 2563. [Google Scholar] [CrossRef] [PubMed]
  23. Gottschling, D.E.; Aparicio, O.M.; Billington, B.L.; Zakian, V.A. Position effect at S. cerevisiae telomeres: Reversible repression of Pol II transcription. Cell 1990, 63, 751–762. [Google Scholar] [CrossRef]
  24. Duffy, M.F.; Selvarajah, S.A.; Josling, G.A.; Petter, M. The role of chromatin in Plasmodium gene expression. Cell. Microbiol. 2012, 14, 819–828. [Google Scholar] [CrossRef]
  25. Tenter, A.M.; Heckeroth, A.R.; Weiss, L.M. Toxoplasma gondii: From animals to humans. Int. J. Parasitol. 2000, 30, 1217–1258. [Google Scholar] [CrossRef]
  26. Berna, L.; Marquez, P.; Cabrera, A.; Greif, G.; Francia, M.E.; Robello, C. Reevaluation of the Toxoplasma gondii and Neospora caninum genomes reveals misassembly, karyotype differences, and chromosomal rearrangements. Genome Res. 2021, 31, 823–833. [Google Scholar] [CrossRef]
  27. Xia, J.; Venkat, A.; Bainbridge, R.E.; Reese, M.L.; Le Roch, K.G.; Ay, F.; Boyle, J.P. Third-generation sequencing revises the molecular karyotype for Toxoplasma gondii and identifies emerging copy number variants in sexual recombinants. Genome Res. 2021, 31, 834–851. [Google Scholar] [CrossRef]
  28. Dalmasso, M.C.; Carmona, S.J.; Angel, S.O.; Aguero, F. Characterization of Toxoplasma gondii subtelomeric-like regions: Identification of a long-range compositional bias that is also associated with gene-poor regions. BMC Genom. 2014, 15, 21. [Google Scholar] [CrossRef]
  29. Gissot, M.; Walker, R.; Delhaye, S.; Huot, L.; Hot, D.; Tomavo, S. Toxoplasma gondii chromodomain protein 1 binds to heterochromatin and colocalises with centromeres and telomeres at the nuclear periphery. PLoS ONE 2012, 7, e32671. [Google Scholar] [CrossRef]
  30. Braun, L.; Cannella, D.; Ortet, P.; Barakat, M.; Sautel, C.F.; Kieffer, S.; Garin, J.; Bastien, O.; Voinnet, O.; Hakimi, M.A. A complex small RNA repertoire is generated by a plant/fungal-like machinery and effected by a metazoan-like Argonaute in the single-cell human parasite Toxoplasma gondii. PLoS Pathog. 2010, 6, e1000920. [Google Scholar] [CrossRef] [Green Version]
  31. Nardelli, S.C.; Silmon de Monerri, N.C.; Vanagas, L.; Wang, X.; Tampaki, Z.; Sullivan, W.J., Jr.; Angel, S.O.; Kim, K. Genome-wide localization of histone variants in Toxoplasma gondii implicates variant exchange in stage-specific gene expression. BMC Genom. 2022, 23, 128. [Google Scholar] [CrossRef]
  32. Reid, A.J.; Vermont, S.J.; Cotton, J.A.; Harris, D.; Hill-Cawthorne, G.A.; Konen-Waisman, S.; Latham, S.M.; Mourier, T.; Norton, R.; Quail, M.A.; et al. Comparative genomics of the apicomplexan parasites Toxoplasma gondii and Neospora caninum: Coccidia differing in host range and transmission strategy. PLoS Pathog. 2012, 8, e1002567. [Google Scholar] [CrossRef]
  33. Lorenzi, H.; Khan, A.; Behnke, M.S.; Namasivayam, S.; Swapna, L.S.; Hadjithomas, M.; Karamycheva, S.; Pinney, D.; Brunk, B.P.; Ajioka, J.W.; et al. Local admixture of amplified and diversified secreted pathogenesis determinants shapes mosaic Toxoplasma gondii genomes. Nat. Commun. 2016, 7, 10147. [Google Scholar] [CrossRef]
  34. Primo, V.A., Jr.; Rezvani, Y.; Farrell, A.; Murphy, C.Q.; Lou, J.; Vajdi, A.; Marth, G.T.; Zarringhalam, K.; Gubbels, M.J. The Extracellular Milieu of Toxoplasma’s Lytic Cycle Drives Lab Adaptation, Primarily by Transcriptional Reprogramming. mSystems 2021, 6, e0119621. [Google Scholar] [CrossRef] [PubMed]
  35. Kloehn, J.; Oppenheim, R.D.; Siddiqui, G.; De Bock, P.J.; Kumar Dogga, S.; Coute, Y.; Hakimi, M.A.; Creek, D.J.; Soldati-Favre, D. Multi-omics analysis delineates the distinct functions of sub-cellular acetyl-CoA pools in Toxoplasma gondii. BMC Biol. 2020, 18, 67. [Google Scholar] [CrossRef] [PubMed]
  36. Radke, J.R.; Behnke, M.S.; Mackey, A.J.; Radke, J.B.; Roos, D.S.; White, M.W. The transcriptome of Toxoplasma gondii. BMC Biol. 2005, 3, 26. [Google Scholar] [CrossRef]
  37. Gissot, M.; Kelly, K.A.; Ajioka, J.W.; Greally, J.M.; Kim, K. Epigenomic modifications predict active promoters and gene structure in Toxoplasma gondii. PLoS Pathog. 2007, 3, e77. [Google Scholar] [CrossRef] [PubMed]
  38. Garrido-Ramos, M.A. Satellite DNA: An Evolving Topic. Genes 2017, 8, 230. [Google Scholar] [CrossRef]
  39. Homan, W.L.; Vercammen, M.; De Braekeleer, J.; Verschueren, H. Identification of a 200- to 300-fold repetitive 529 bp DNA fragment in Toxoplasma gondii, and its use for diagnostic and quantitative PCR. Int. J. Parasitol. 2000, 30, 69–75. [Google Scholar] [CrossRef]
  40. Walsh, D.; Katris, N.J.; Sheiner, L.; Botte, C.Y. Toxoplasma metabolic flexibility in different growth conditions. Trends Parasitol. 2022, 38, 775–790. [Google Scholar] [CrossRef]
  41. Moraes Barros, R.R.; Marini, M.M.; Antonio, C.R.; Cortez, D.R.; Miyake, A.M.; Lima, F.M.; Ruiz, J.C.; Bartholomeu, D.C.; Chiurillo, M.A.; Ramirez, J.L.; et al. Anatomy and evolution of telomeric and subtelomeric regions in the human protozoan parasite Trypanosoma cruzi. BMC Genom. 2012, 13, 229. [Google Scholar] [CrossRef] [PubMed]
  42. Nakayama, J.; Rice, J.C.; Strahl, B.D.; Allis, C.D.; Grewal, S.I. Role of histone H3 lysine 9 methylation in epigenetic control of heterochromatin assembly. Science 2001, 292, 110–113. [Google Scholar] [CrossRef] [PubMed]
  43. Mah, L.J.; El-Osta, A.; Karagiannis, T.C. gammaH2AX: A sensitive molecular marker of DNA damage and repair. Leukemia 2010, 24, 679–686. [Google Scholar] [CrossRef] [PubMed]
  44. Seo, J.; Kim, K.; Chang, D.Y.; Kang, H.B.; Shin, E.C.; Kwon, J.; Choi, J.K. Genome-wide reorganization of histone H2AX toward particular fragile sites on cell activation. Nucleic Acids Res. 2014, 42, 1016–1025. [Google Scholar] [CrossRef]
  45. Fraschka, S.A.; Henderson, R.W.; Bartfai, R. H3.3 demarcates GC-rich coding and subtelomeric regions and serves as potential memory mark for virulence gene expression in Plasmodium falciparum. Sci. Rep. 2016, 6, 31965. [Google Scholar] [CrossRef]
  46. Santenard, A.; Ziegler-Birling, C.; Koch, M.; Tora, L.; Bannister, A.J.; Torres-Padilla, M.E. Heterochromatin formation in the mouse embryo requires critical residues of the histone variant H3.3. Nat. Cell Biol. 2010, 12, 853–862. [Google Scholar] [CrossRef]
  47. Udugama, M.; Vinod, B.; Chan, F.L.; Hii, L.; Garvie, A.; Collas, P.; Kalitsis, P.; Steer, D.; Das, P.P.; Tripathi, P.; et al. Histone H3.3 phosphorylation promotes heterochromatin formation by inhibiting H3K9/K36 histone demethylase. Nucleic Acids Res. 2022, 8, 4500–4514. [Google Scholar] [CrossRef]
  48. Clemente, M.; de Miguel, N.; Lia, V.V.; Matrajt, M.; Angel, S.O. Structure analysis of two Toxoplasma gondii and Neospora caninum satellite DNA families and evolution of their common monomeric sequence. J. Mol. Evol. 2004, 58, 557–567. [Google Scholar] [CrossRef]
  49. Feliciello, I.; Pezer, Z.; Sermek, A.; Bruvo Madaric, B.; Ljubic, S.; Ugarkovic, D. Satellite DNA-Mediated Gene Expression Regulation: Physiological and Evolutionary Implication. Prog. Mol. Subcell. Biol. 2021, 60, 145–167. [Google Scholar] [CrossRef]
  50. Lukito, Y.; Chujo, T.; Hale, T.K.; Mace, W.; Johnson, L.J.; Scott, B. Regulation of subtelomeric fungal secondary metabolite genes by H3K4me3 regulators CclA and KdmB. Mol. Microbiol. 2019, 112, 837–853. [Google Scholar] [CrossRef]
  51. Etchegaray, J.P.; Mostoslavsky, R. Interplay between Metabolism and Epigenetics: A Nuclear Adaptation to Environmental Changes. Mol. Cell 2016, 62, 695–711. [Google Scholar] [CrossRef] [PubMed]
  52. Shi, L.; Tu, B.P. Acetyl-CoA and the regulation of metabolism: Mechanisms and consequences. Curr. Opin. Cell Biol. 2015, 33, 125–131. [Google Scholar] [CrossRef]
  53. Noe, L.; Kucherov, G. YASS: Enhancing the sensitivity of DNA similarity search. Nucleic Acids Res. 2005, 33, W540–W543. [Google Scholar] [CrossRef]
  54. Langmead, B.; Salzberg, S.L. Fast gapped-read alignment with Bowtie 2. Nat. Methods 2012, 9, 357–359. [Google Scholar] [CrossRef]
  55. Robinson, J.T.; Thorvaldsdottir, H.; Winckler, W.; Guttman, M.; Lander, E.S.; Getz, G.; Mesirov, J.P. Integrative genomics viewer. Nat. Biotechnol. 2011, 29, 24–26. [Google Scholar] [CrossRef]
  56. Zhang, Y.; Liu, T.; Meyer, C.A.; Eeckhoute, J.; Johnson, D.S.; Bernstein, B.E.; Nusbaum, C.; Myers, R.M.; Brown, M.; Li, W.; et al. Model-based analysis of ChIP-Seq (MACS). Genome Biol. 2008, 9, R137. [Google Scholar] [CrossRef]
  57. Feng, J.; Liu, T.; Qin, B.; Zhang, Y.; Liu, X.S. Identifying ChIP-seq enrichment using MACS. Nat. Protoc. 2012, 7, 1728–1740. [Google Scholar] [CrossRef]
  58. Ramirez, F.; Ryan, D.P.; Gruning, B.; Bhardwaj, V.; Kilpert, F.; Richter, A.S.; Heyne, S.; Dundar, F.; Manke, T. deepTools2: A next generation web server for deep-sequencing data analysis. Nucleic Acids Res. 2016, 44, W160–W165. [Google Scholar] [CrossRef]
  59. Croken, M.M.; Qiu, W.; White, M.W.; Kim, K. Gene Set Enrichment Analysis (GSEA) of Toxoplasma gondii expression datasets links cell cycle progression and the bradyzoite developmental program. BMC Genom. 2014, 15, 515. [Google Scholar] [CrossRef]
  60. Perea-Resa, C.; Blower, M.D. Centromere Biology: Transcription Goes on Stage. Mol. Cell. Biol. 2018, 38, e00263-18. [Google Scholar] [CrossRef] [Green Version]
Figure 1. Definition of subtelomeric regions based on gene density. Regions with low gene density were defined manually by scanning the chromosome ends. The border (triangle) was defined from the first gene flanking the euchromatin-compatible region. The vertical light blue line indicates the presence of telomeric repeat. The red ? indicates the possibility that the ST region extends beyond the defined one. The red arrow indicates the orientation of the gene. Numbers above the line indicate the position in chromosomes (in kb). Me49 data was obtained from ToxoDB versions 53 and 57. No difference was observed. Version 53 of the reference strain ME49 was used.
Epigenomes 06 00029 g001
Figure 2. Toxoplasma gondii ST chromatin architecture. (A) Examples of H3K9me3 (violet), H3.3 (yellow), and H2A.X (red) distribution in T. gondii STs. The occupancies of histone marks were explored with the Integrated Genomics Viewer (IGV). Scale: H3K9me3, 0–4.21; H3.3, 0–1.76 and H2A.X, 0–2.05. Below each histone coverage track, the positions of the histone peaks identified by MACS2 peak_calling (pc) analysis are shown. The lower black bars correspond to the presence of genes along the chromosomes. The vertical light blue line indicates the presence of telomeric repeat. Below: the geneID of the STs border some genes. Version 53 of the reference strain ME49 was used. Gray triangles indicate the observed gradient of histone marks along the ST from the telomere. (B) Heatmaps showing occupancies of histone marks for the 97 ST genes sorted according to their levels of expression (from top to bottom). The reference point indicated by 0 represents the position of the 5′ UTR or the initiation codon ATG of the CDS. The color level indicates the occupancy of the histone, brown representing high intensity and blue representing minimum intensity. The red triangle indicates the descendent expression gradient measured by RNA-seq for 47/97 ST genes (see Table S3).
Epigenomes 06 00029 g002
Figure 3. Arrays of genes and satellite DNA sequences present in STs. Based on the dot plot analysis and data from Table S1, a map of the position of each gene (top) and satellite DNA (bottom) was constructed for each ST. The figure shows a selection of STs that contain at least one sat240 and/or sat350. The length of satellite DNAs and genes are scaled for each ST. Note that each ST has a different scale according to its length. Sat350: green; sat240: light green; other satellite DNAs: grey. The names of the genes respond to the criteria listed in Table S1: Ns, track of N (any nucleotide) in the ST sequence, and genomic genes.
Epigenomes 06 00029 g003
Figure 4. Analysis of genes detected in T. gondii STs (ST). The graphs were obtained from the data displayed in Table 2, Tables S1 and S4. HP: hypothetical protein. FA: functional annotated gene. (A) Gene composition of ST. The numbers represent the number of genes. (B) The number of genes showing transcriptional evidence in the ToxoDB database is based on the expression profiling of three archetypal lineage sources. The transcription expressed as percentages of gene expression were obtained for Me49 and RH strains. Other transcriptional evidence was not taken into account. (C) Subcellular localization of FA group genes according to a LOPIT analysis retrieved from ToxoDB. The numbers represent the number of genes. (D) Genetic evidence of hypothetical gene expression according to the level of transcription measured in each percentile (TP). Percentile values greater than 50 and less than 50 were retrieved from ToxoDB for Me49 and RH strains. When the levels were greater than 50 in one strain and less than 50 in another strain, they are shown as <>.
Epigenomes 06 00029 g004
Figure 5. Conservation patterns of TgB and TgC families. (A) Alignment of amino acid sequences of TgB proteins according to Table 2 enumeration. The Red line indicates a conserved region. (B) Alignment of amino acid sequences of TgC proteins according to Table 2 enumeration. The red lines indicate conserved regions. Alignments were performed by MUSCLE.
Epigenomes 06 00029 g005
Figure 6. The role of ST genes in T. gondii environmental adaptation. (A) Data from a differential expression analysis (DEA) of the genes in the context of an “evolve and resequencing” study was analyzed. The ST % of genes was calculated as the number of ST genes that were upregulated (16) and downregulated (5) in DEA extra up or DEA extra down transcriptome list of the total ST genes (97). The global % of genes was calculated as the number of DEA extra up (435) and DEA extra down (551) genes from DEA extra up or extra down lists of the total GT1 strain gene data obtained from ToxoDB (8468). DEA data was obtained from Primo et al. [34] Extra: the prolonged extracellular passage of T. gondii tachyzoites grown in vitro. (B,C) Data from a study on the role of subcellular pools of acetyl-CoA was analyzed. (B) The ST % of genes was calculated as the number of ST genes that were up- (17) and downregulated (0) in the ΔACL/iΔACS mutant differentially expressed transcriptome list of the total ST genes (97). The global % of genes was calculated as the number of upregulated (376) or downregulated (75) genes from a differentially expressed transcriptome list of the total GT1 strain gene data obtained from ToxoDB (8468). ΔACL/iΔACS mutant is deficient in cytosolic/nuclear acetyl-CoA production [35]. (C) The ST % of genes was calculated as the number of ST genes that were up- (0) and downregulated (five) in the ΔBCKDH mutant differentially expressed transcriptome list of the total ST genes (97). The global % of genes was calculated as the number of upregulated (84) or downregulated (89) genes from a differentially expressed transcriptome list of the total Me49 strain gene data obtained from ToxoDB (8920). BCKDH mutant is deficient in mitochondrial acetyl-CoA production [35]. Data were obtained from Table S5. Fisher’s exact test was applied only to those cases in which ST genes were detected in the experiment. ** p < 0.01, **** p < 0.0001.
Epigenomes 06 00029 g006
Table 1. List and main features of T. gondii STs.
STLength (kpb)Nr of GenesCG% 1Telomere SequencesSatellite DNA
ST_Ia_L15.6150.1noyes
ST_Ia_R10.5249.0yesno
ST_Ib_L18.4352.0yesno
ST_Ib_R40253.3yesyes
ST_II_L22.2149.7nono
ST_II_R109.4453.3yes *yes
ST_III_L35.7153.3yesno
ST_III_R232.4552.5yesyes
ST_IV_L77554.8yes **yes
ST_IV_R40.2450.8noyes
ST_V_L112.6554.3noyes
ST_V_R177.9554.4noyes
ST_VI_L8.1150.1yesno
ST_VI_R53.7752.7noyes
ST_VIIa_L58.4652.6yesyes
ST_VIIa_R76.3153.7yesno
ST_VIIb_L +82.9753.4yesyes
ST_VIII_R +53.1154.9yesyes
ST_IX_L179.1453.9noyes
ST_IX_R49.6852.2yesno
ST_X_L139.8552.3noyes
ST_X_R27.5350.1noyes
ST_XI_L88.2751.4yesyes
ST_XI_R13.2153.1yesno
ST_XII_L47.6351.6noyes
ST_XII_R215452.3yesyes
average76.33.752.37--
sum1985.496-16 (yes)18 (yes)
Me49 Chr ++54,997.6378920---
+ Chromosomes VIIb and VIII turned out to be fused according to recent alignments, not yet annotated. Here the left arm for VIIb and the right arm for VIII were taken into account. ++ Data obtained from ToxoDB, organism Me49. 1 Telomere sequences and “ns” were removed from the analysis (https://www.sciencebuddies.org/science-fair-projects/references/genomics-g-c-content-calculator, accessed on 11 May 2022). Toxoplasma GC content 52% (RH strain). * Interstitial, position 1445–1758. ** Interstitial, position 1896–2705.
Table 2. Basic gene and protein features of ST genes with annotated description.
GenegeneID
(TGME49)
ChProtein Length (aa)TMSP ScorePhenotype 1Transcription 1,§
Me49/RH
Proteomic 1LOPIT 1
T. gondii FA 2:
chapA-tub_295310I a1890<0.01−4.7885.7/85.6yesnucleolus
ts_220840II5710<0.011.7620.7/7.66Oocyst ^NDA
otu-cp familiy_237894IV2190<0.01−4.3739.9/38.8NDANDA
enoyl-CoA_317705IV3710<0.01−0.4593/92.3yesnucleolus
eIF3-D_317720IV6090<0.01−4.8790.8/92.7yesnucleus
otu-cp_237900IV4860<0.01NDA39.9/38.8yesNDA
ppi_238000VI2830<0.01−6.2783.2/87.1yesnucleolus
adp/atp_237700VI610<0.01−0.76NDANDANDA
sa-t/k_282230VII a6340<0.010.9410.2/6.1Oocyst ^NDA
electron-t_207250X4500<0.010.7333.4/16.6Oocyst ^NDA
vtc2_298630XI13082<0.01−3.331.9/35.4yesER/Golgi/PM
ER-oxired_300380XII58710.020.8263.7/74.8yesER
FamB and FamC multigene families:
TgB1_200480VIII16710.19/ +1.23NDANDANDA
TgB2_244920VI16210.39−0.82NDANDANDA
TgB3_264225VIIb2082 Φ0.722.03NDANDANDA
TgB4_274290IX1361<0.010.991.8/87.7NDANDA
TgB5_276230III16310.87/ +2.3869.9/85.4NDANDA
TgB6_279460IX14910.82/ +0.43NDANDANDA
TgB7_283450V26510.351.7267.0/25.3NDANDA
TgB8_295300Ia15810.87/ +0.4260.7/24.7NDANDA
TgB9_298090II17210.91/ +−0.24NDANDANDA
TgB10_299570IX15010.85/ +−1.1250.9/31.0NDANDA
TgB11_301890X16510.012NDA91.0/82/2NDANDA
TgB12_307045XI25810.17/ +1.3063.7/37.9NDANDA
TgB13_307460V2121<0.011.16NDANDANDA
TgB14_307480V1771<0.010.28NDANDANDA
TgB15_320770IV18210.89/ +−0.05NDANDANDA
HhB3_264225NA2642 Φ0.064NDANDANDANDA
HhB6_279460NA15210.84/ +NDANDANDANDA
HhB7_283450NA1261<0.01NDANDANDANDA
HhB8_295300NA15810.92/ +NDANDANDANDA
HhB9_298090NA13700.92/ +NDANDANDANDA
HhB10_299570NA10710.91/ +NDANDANDANDA
HhB16_454170NA18310.79/ +NDANDANDANDA
NcB13CEL64573 *Ib a16310.71NDANDANDANDA
NcB17_060290XII1471<0.01NDANDANDANDA
NcB18CEL66112NDA19910.30NDANDANDANDA
NcB19CEL64819 *III b1731<0.01NDANDANDANDA
TgC1_321170III2322 Φ0.130.5244.7/61.2NDANDA
TgC2_200700X1391 Φ0.05NDANDANDANDA
TgC3_307260XI20610.14 +0.9675.2/64.8NDANDA
TgC4_200130XII23810.04 +NDANDANDANDA
TgC5_298960III2821 Φ<0.010.0653.9/40.5NDANDA
TgC6_200590X20110.01 +2.09NDANDANDA
TgC7_287280Ia22510.06 +NDA53.0/36.9NDANDA
TgC8_220080V3061<0.010.4423.7/22.4MembraneNDA
TgC10_228780X2862<0.011.4915.2/23.9NDANDA
TgC11_298060II3053 Φ<0.011.2214,5/32.6NDANDA
TgC12_300990IV2521<0.010.0418.4/16.0NDANDA
TgC13_292610V26510.06 +NDA53.0/36.9NDANDA
TgC14_329400NA22510.06 +NDA53.0/36.9NDANDA
HhC6a_321170NA21610.02NDANDANDANDA
HhC6b_200590NA19310.06 +NDANDANDANDA
HhC8_220080NA1801c0.004NDANDANDANDA
HhC11_298060NA3301<0.01NDANDANDANDA
NcC15CEL68745 *IX3132 Φ0.01NDANDANDANDA
NcC16_069620NA24210.03NDANDANDANDA
NcC17CEL66113 *VIIa c14610.005NDANDANDANDA
TGME49: Toxoplasma gondii strain Me49. Tg: T. gondii; Hh: Hammondia hammondi; Nc: Neospora caninum. SP: signal peptide: Score was determined by Signal P 5.0 (https://services.healthtech.dtu.dk/service.php?SignalP-5.0, accessed on 15 March 2022). + Signal peptide predicted by PSORT II (https://psort.hgc.jp/form2.html, accessed on 15 March 2022). ER: endoplasmic reticulum; TM: transmembrane region (Psort II, TMHMM server v 2.0, http://www.cbs.dtu.dk/services/TMHMM/0, accessed on 15 March 2022). NA: not assigned; NDA: no data available. 1 Phenotype, transcription, proteomic, and LOPIT data were obtained from ToxoDB. § Only the transcription “expression profiling of three archetypal lineages” database was incorporated. 2 FA: functional annotated genes. ToxoDB annotation: chapA-tub: tubulin binding cofactor A protein; ts: threonine synthase; out-cp family: OTU family cysteine protease; enoyl-coA: enoyl-CoA hydratase/isomerase family protein; eIF3-D: eukaryotic initiation factor 3, subunit D; ppi: peptidyl-prolyl isomerase; adp/atp: adp/atp translocase; sa-t/k: sulfate adenylyltransferase/adenylylsulfate kinase; electron-t: electron-transfer-flavoprotein; vtc2: vacuolar transporter chaperone VTC2; ER-oxired: endoplasmic reticulum oxidoreductin. ^ Oocyst proteome. Φ One is a TMHH in the putative cleavage site. * Bioproject PRJEB7872. a Chromosome corresponding to gDNA sequence NCLIV_004620, a truncated version (87aa). b Chromosome corresponding to gDNA sequence NCLIV_006930, a truncated version (113aa). c Chromosome was determined by sequence NCLIV_019380, a truncated version (122aa) of CEL66113.
Publisher’s Note: MDPI stays neutral with regard to jurisdictional claims in published maps and institutional affiliations.

