Article

Saliva as a Blood Alternative for Genome-Wide DNA Methylation Profiling by Methylated DNA Immunoprecipitation (MeDIP) Sequencing

1
Department of Biomedicine, Aarhus University, 8000 Aarhus C, Denmark
2
Translational Neuropsychiatric Unit, Aarhus University Hospital, 8240 Risskov, Denmark
3
Psychosis Research Unit, Aarhus University Hospital, 8240 Risskov, Denmark
4
The Lundbeck Foundation Initiative for Integrative Psychiatric Research, iPSYCH, Denmark
5
Center for Integrative Sequencing, iSEQ, Aarhus University, 8000 Aarhus C, Denmark
*
Author to whom correspondence should be addressed.
Epigenomes 2017, 1(3), 14; https://doi.org/10.3390/epigenomes1030014
Submission received: 31 July 2017 / Revised: 5 October 2017 / Accepted: 11 October 2017 / Published: 19 October 2017

Abstract

:
Background: Interrogation of DNA methylation profiles hold promise for improved diagnostics, as well as the delineation of the aetiology for common human diseases. However, as the primary tissue of the disease is often inaccessible without complicated and inconvenient interventions, there is an increasing interest in peripheral surrogate tissues. Whereas most work has been conducted on blood, saliva is now becoming recognized as an interesting alternative due to the simple and non-invasive manner of collection allowing for self-sampling. Results: In this study we have evaluated if saliva samples are suitable for DNA methylation studies using methylated DNA immunoprecipitation coupled to next-generation sequencing (MeDIP-seq). This was done by comparing the DNA methylation profile in saliva against the benchmark profile of peripheral blood from three individuals. We show that the output, quality, and depth of paired-end 50 bp sequencing reads are comparable between saliva and peripheral blood and, moreover, that the distribution of reads along genomic regions are similar and follow canonical methylation patterns. Conclusion: In summary, we show that high-quality MeDIP-seq data can be generated using saliva, thus supporting the future use of saliva in the generation of DNA methylation information at annotated genes, non-RefSeq genes, and repetitive elements relevant to human disease.

1. Introduction

DNA methylation plays a pivotal role in gene regulation and has been implicated in several human conditions including cancer, cardiovascular disease, and neuropsychiatric conditions [1,2,3,4]. In addition, numerous epidemiological epigenetic studies investigating associations between environmental exposures and DNA methylation have found biologically sensible correlations. An example of such findings is a well-studied change in DNA methylation levels at the AHRR and CYP1A1 loci in the blood of children in response to maternal smoking [5,6], suggesting an epigenetic role in diseases as a response to environmental stimuli. The interest in easily-accessible surrogate tissue for epigenetic epidemiology has resulted in an increased focus on DNA methylation profiling in saliva, buccal, and blood-derived cell material. Especially in epigenetic studies of mental disorders, where brain tissue is mostly inaccessible, the use of surrogate tissue is of major interest. Biologically-relevant findings in adult blood-based case-control studies of schizophrenia, major depressive disorder, and bipolar disorder have been made [7,8,9,10,11,12]. This reinforces the usage of peripheral tissue for biomarker screening and in the study of disorder-associated environmental insults embedded in the peripheral tissue as mirror effects. As an example to the latter, childhood maltreatment has shown to be associated with FKBP5 gene promoter hypomethylation in both brain and blood tissues [13,14].
The ease of use and non-invasive nature of saliva collection makes it an appealing alternative to peripheral blood, especially where study subjects are children or where the samples are self-collected. In addition to reducing the costs, this ensures increased convenience and acceptability, all of which are important in large-scale epidemiological studies. Previous studies have shown that despite the presence of naturally-occurring bacteria in saliva, which results in lower DNA yield and quality, the tissue remains suitable for high-throughput genotyping with call rates similar to blood [15,16,17]. An overall high correlation in DNA methylation levels between blood, saliva, and the brain, especially at promoter CpG islands (CGIs), has also been noted, accompanied with a significant over-representation of differences in intragenic CGIs [18,19,20,21,22]. This is in line with the general notion that tissue-specific DNA methylation is enriched particularly in the shore and shelf regions of CGIs, as well as in intragenic CGIs [23,24,25]. However, on a global level, hardly any intra-individual difference is expected, as most methylation sites are static and canonical patterns are conserved in terminally-differentiated cells where, e.g., repetitive elements are epigenetically silenced and promoters of housekeeping genes are active across tissues [26,27,28].
DNA from both peripheral blood and saliva originates from a variable composition of leukocytes and, in the case of saliva, also exfoliated epithelial cells. The variation in the proportion of epithelial cells in saliva has shown to be particularly high ranging from 3% to 99% (n = 64) [18]. Whereas, in other studies the leukocyte contribution to saliva DNA, especially from neutrophils, was more predominate [29,30]. Interestingly, however, counting epithelial cells, which originate from the same germ layer as the brain, the ectoderm, saliva has a higher correlation to brain tissue than observed between blood and brain tissue [18,20,31,32]. Yet, the use of saliva for brain-related genome-wide methylation studies has been limited [33,34,35].
MeDIP-seq is a cost-effective approach for genome-wide DNA methylation profiling, where methylated genomic fragments enriched by immunoprecipitation are high-throughput sequenced. The method displays good positive correlation with array-based methods, such as the HumanMethylation450 BeadChip [36,37] but, importantly, also provides information on non-RefSeq genes and repetitive elements, which have recently been linked with disease development [38,39], also illustrated in a recent study providing evidence of proto-oncogene activation in prostate cancer by means of Alu element hypomethylation [40]. In theory MeDIP-seq can cover the total methylome of roughly 28 million CpGs and whereas the methodology is less suited for CpG-sparse lowly methylated regions [41], ultra-deep sequencing has shown to cover about 90% of all CpGs with ≥10X coverage [36]. Furthermore, CpGs have shown to be often cis co-methylated over a range of at least 1 kb [42], thus making it more likely to pick up changes in CpG-sparse regions. However, it should be noted that heterochromatin, being heavily methylated, would dominate the library if sequenced below saturation.
The agnostic information provided by MeDIP-seq outside annotated gene bodies and regulatory elements can, therefore, be used in a broader characterization of cell development and the impact of environmental exposures. This given, it is important to evaluate if MeDIP-seq analyses of saliva represents a feasible and cost-effective alternative to analyses based on peripheral blood.

2. Results and Discussion

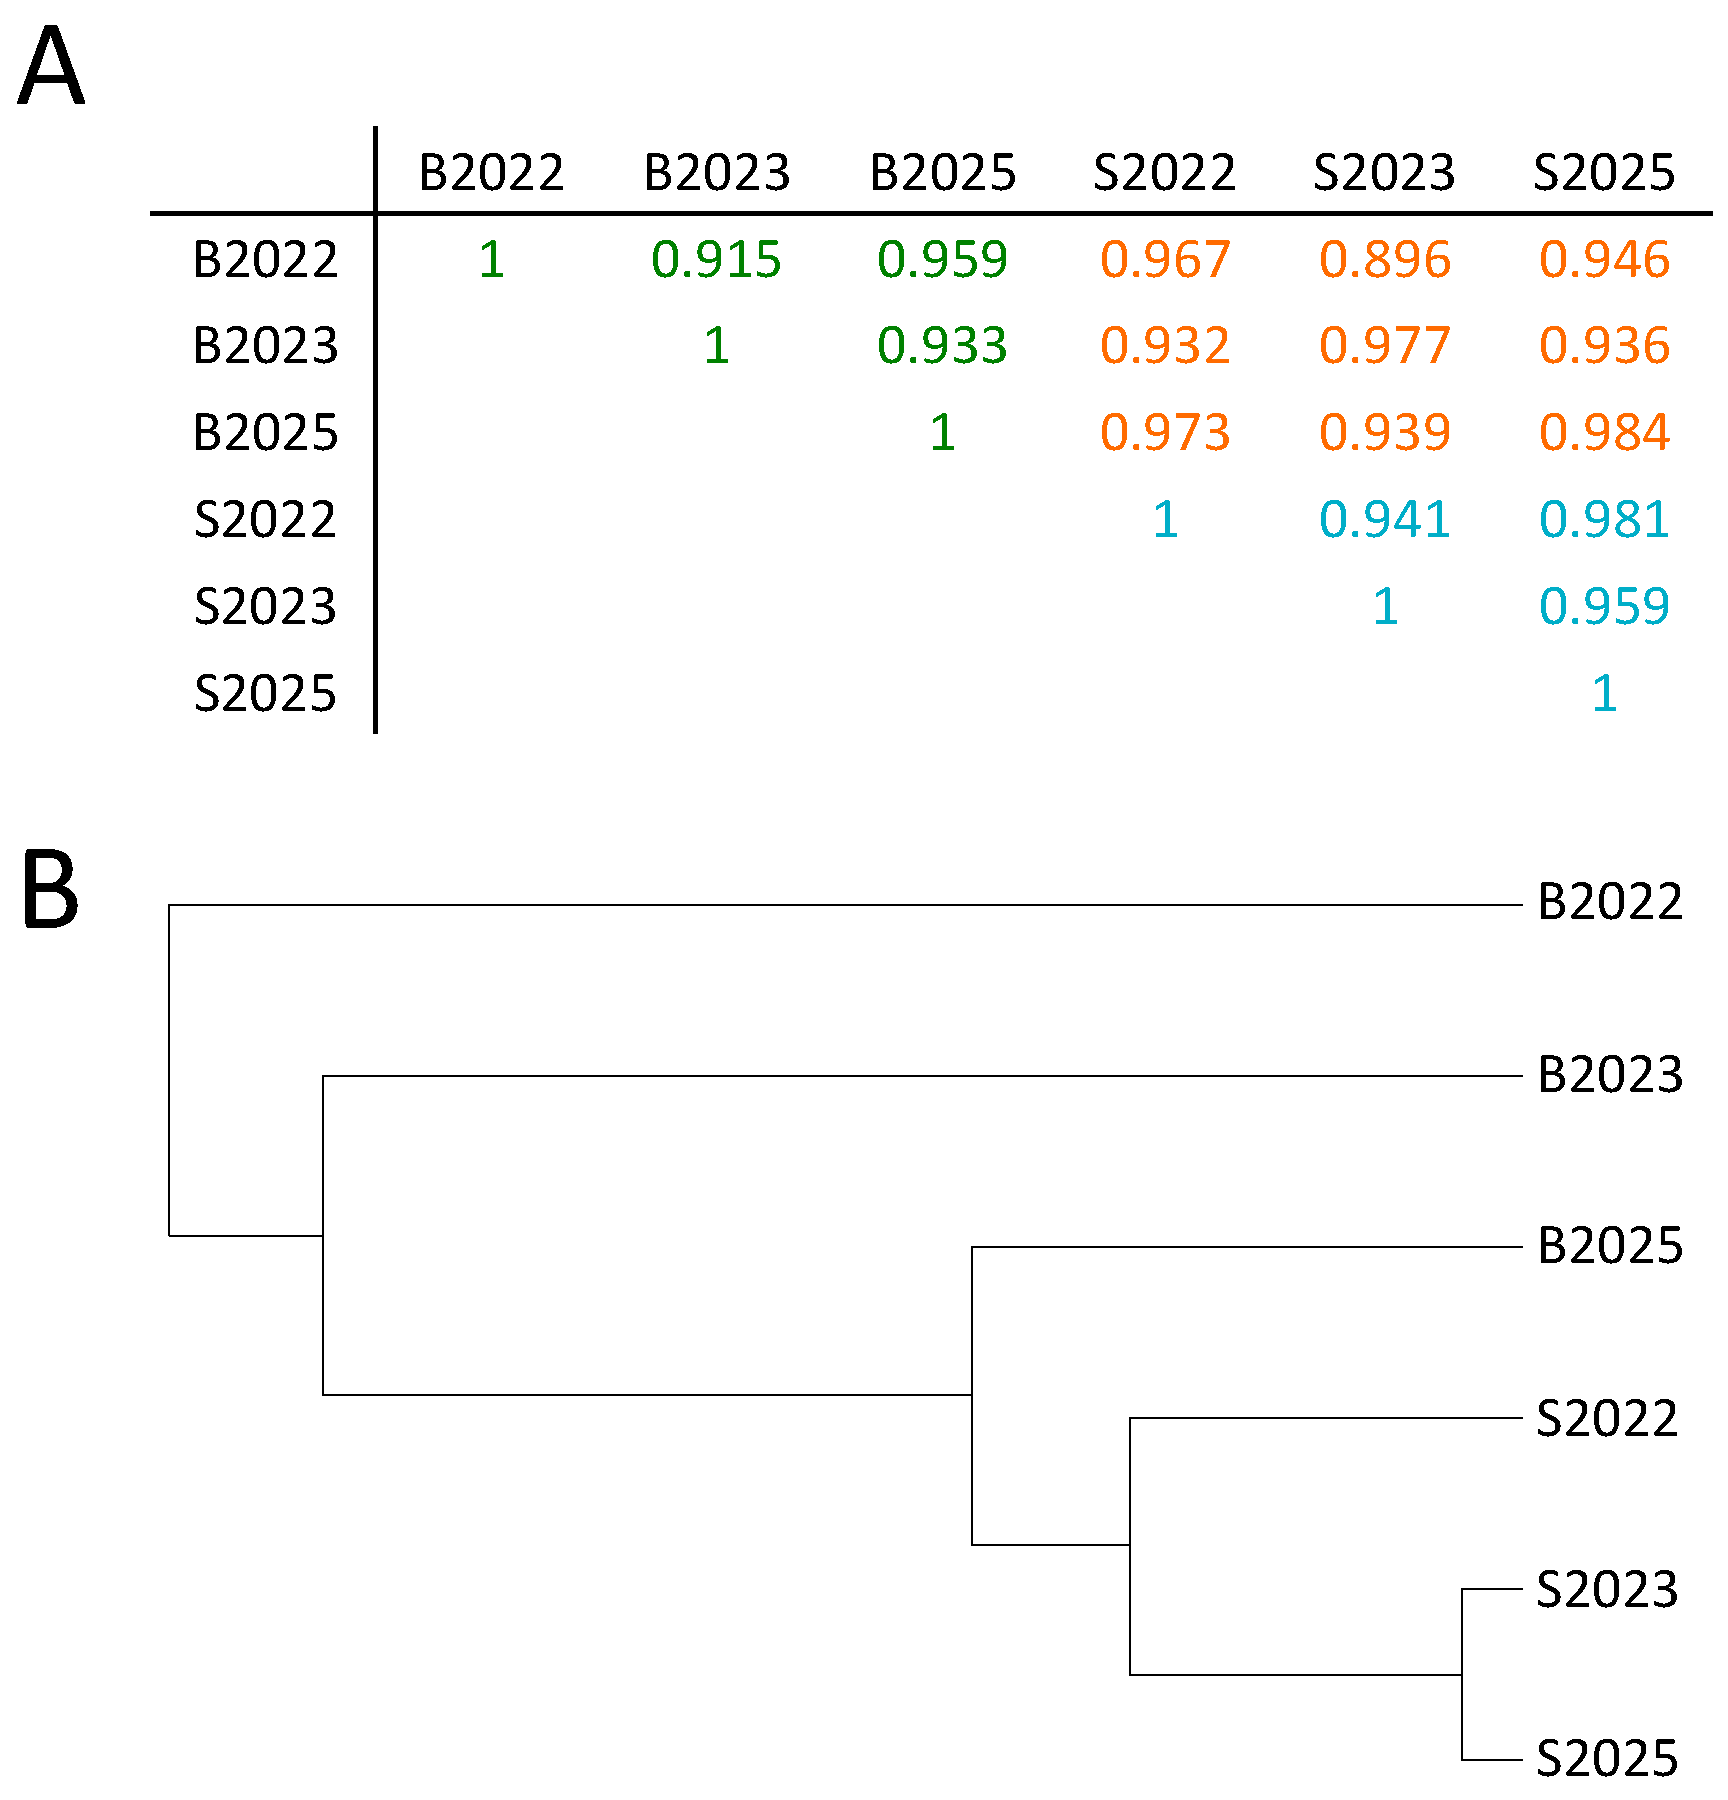
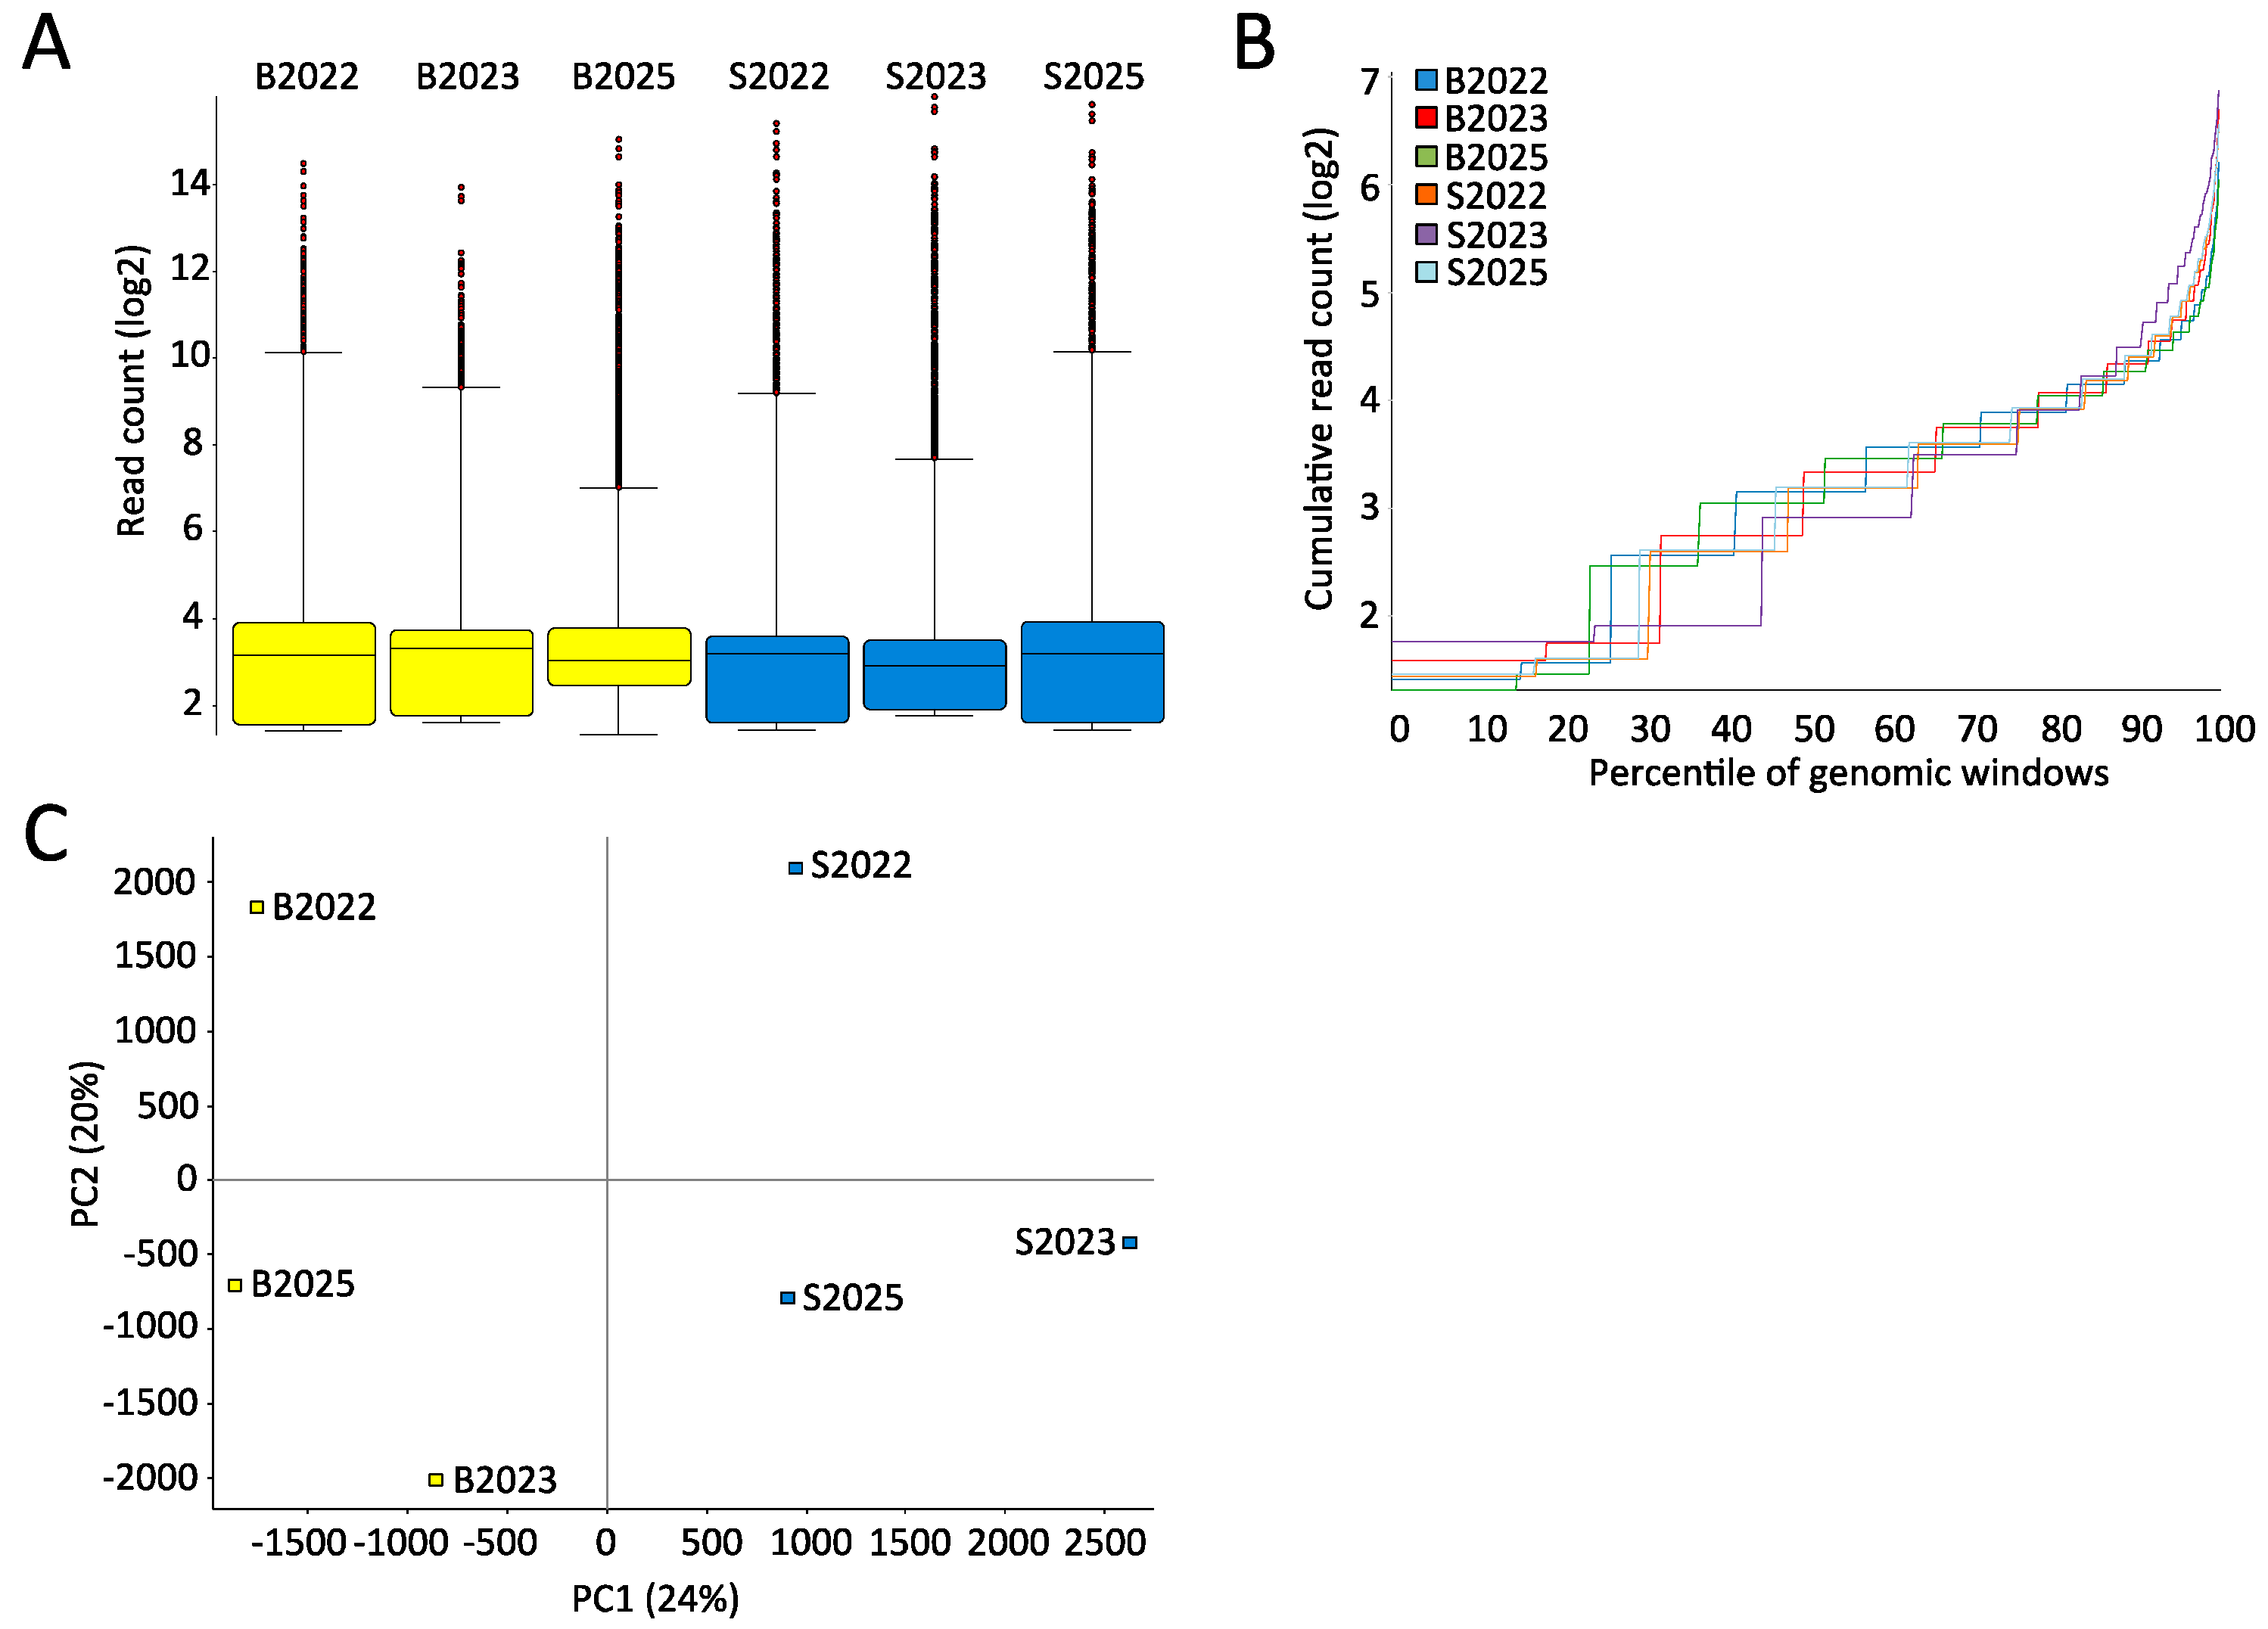
2.1. High-Quality Sequencing Data Generated by MeDIP-seq Using Saliva-Extracted DNA

DNA extracted from pairwise matched blood and saliva samples from three individuals was sonicated to a mean fragment length of about 180 bp. Sequencing of the MeDIP-enriched libraries yielded approximately 67 million clean reads per sample. All samples performed well, with mean Phred scores above 30 along the entire read, and the anticipated GC content skewedness of methylated DNA enriched samples (Supplementary Figure S1). Clean reads were aligned to the human genome (hg38) using the Burrows-Wheeler aligner (BWA) algorithm and filtered using quality-associated attributes. The filtering resulted in a final dataset of approximately 64 million reads per library.
As chromosomal abnormalities may lead to incorrect interpretation of the data, an analysis of copy number variations in the six samples was conducted using only non-CpG fragments, as these are not enriched. No copy number variations (CNVs) > 1 Mb were found in any of the samples (Supplementary Figure S2). Pre-analytic quality checks of the mapped libraries (excluding sex chromosomes, as study subjects have different sexes) displayed a high similarity of fragment size distribution, complexity, and depth, as well as genomic coverage among samples (Supplementary Figures S3–S6). This clearly indicated that all libraries had sufficient diversity and depth of reads to saturate the profile of the reference genome in a reproducible manner.
CpG-site enrichment was visualized by the number of reads interrogated as a function of 500 bp genomic bins ranked by the number of reads contained within the bin. Furthermore, the enrichment was measured as the observed/expected ratio of CpGs within the reference genome (Supplementary Figure S7). This verified that all sample libraries were indeed enriched for CpG sites (score > 1) but also that, in saliva samples, CpG-site enrichment was more pronounced than in blood samples (mean scores of 1.36 and 1.16, respectively). The enrichment score is somewhat lower than reported elsewhere for human embryonic stem cells (1.64), human dried blood spots (1.63), and rodent hippocampus (1.4) [43,44,45].
A pair-wise correlation using all mapped reads in 500 bp windows displayed Pearson correlation coefficients (PCCs) between 0.896 and 0.984 (Figure 1A).
The intra-individual correlation rate was lower than expected but, interestingly, highest amongst saliva samples. This may partly be explained by the lower enrichment observed in the blood samples or differences in cell-type composition, which is known to vary substantially in buffy coat as a function of season, age, and sex [46,47,48]. However, a high correlation, per se, is still expected, even without correction for cell composition and sex, as methylation status at most CpGs is conserved across tissues [49,50,51,52,53]. This is also illustrated in a methylation array based pilot study where, at 70% of CpGs, methylation positively correlated between saliva and blood even when cell composition was uncorrected for [54]. Moreover, only a minority of CpGs were statistically differently methylated between the two tissues and the number did not change upon correction for cell heterogeneity.
Notably, in the between-tissue comparison, a higher-end correlation was always found inter-individually, suggesting that genotype-associated methylation (methylation quantitative trait loci, mQTLs, or CpG-SNPs) or early life environmental exposures explain the intra-individual difference. Unsupervised hierarchical clustering based on all uniquely-mapped reads indicated that the saliva or peripheral blood origin of the DNA is the main factor in sample differentiation (Figure 1B).
Characterizing the samples in greater detail by the spread and distribution of reads using genomic bins of 300 bp with 150 bp overlap showed that both the median and the interquartile ranges (IQRs) between the samples were comparable (Figure 2A). It is anticipated that even with significant differently methylated regions (DMRs) present, the global distribution of reads should be comparable between samples. Therefore, the sum of reads from the lowest covered percentile of the genome to the highest should followed similar trajectories in samples to be compared. This is indeed the case in the current sample set (Figure 2B). Performing a principle component analysis showed that the first component explained 24% of the common variation, dividing the samples by tissue type. The second component stratifies the samples by individual (Figure 2C).
Taken together, this indicates that no major technical differences exist between the blood and saliva MeDIP-seq datasets.

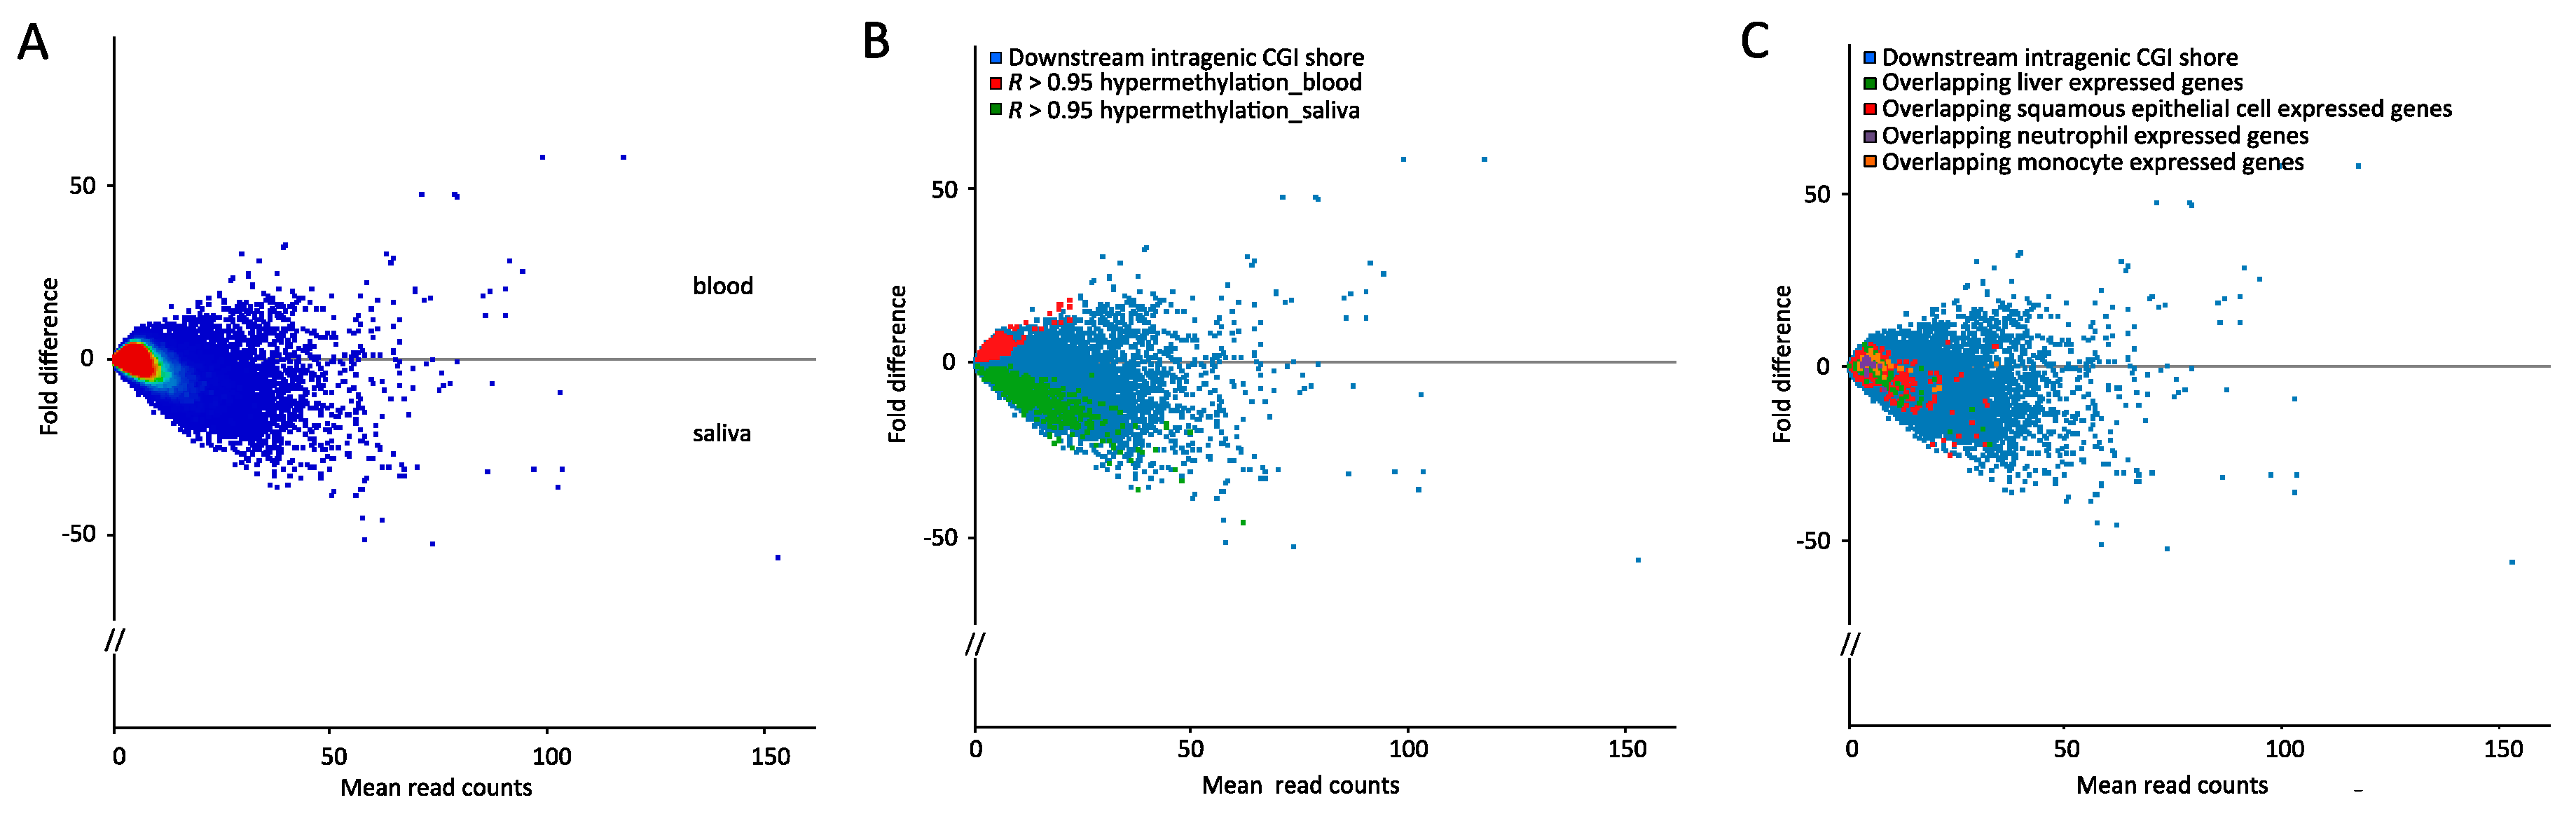
2.2. Few Differently-Methylated Windows are Detected between Saliva and Blood

To further characterize the MeDIP-seq dataset, we computed library size normalized 100 bp differently-methylated windows (DMWs) between the pairwise matched blood and saliva samples, excluding sex chromosomes. Setting a threshold of significance at p < 0.05 (Bonferroni corrected) the intra-individual comparison returned 322, 608, and 349 DMWs for individuals 2022, 2023, and 2025, respectively (Supplementary Figure S8). Only a minimal overlap of DMWs existed between the three datasets, again indicating that no consistent technical variation was introduced during processing of the saliva samples. Importantly, this does not imply that no biological difference exists.
We next computed the DMWs between the concatenated saliva (S2022, S2023, and S2025) and blood (B2022, B2023, and B2025) dataset excluding sex chromosomes.Depicted in an MA plot of the methylation difference as log ratio (“Minus”) against the mean methylation (“Average”), the analyses showed a general tendency of higher methylation in saliva and that all significant DMWs were, indeed, hypermethylated in saliva (Supplementary Figure S9A). This appears in contrast to previous findings [19], but may be due to differences in cell composition and technical variation. Most of the DMWs were located in intergenic regions, and fewer in intragenic regions and exons (Supplementary Figure S9B).

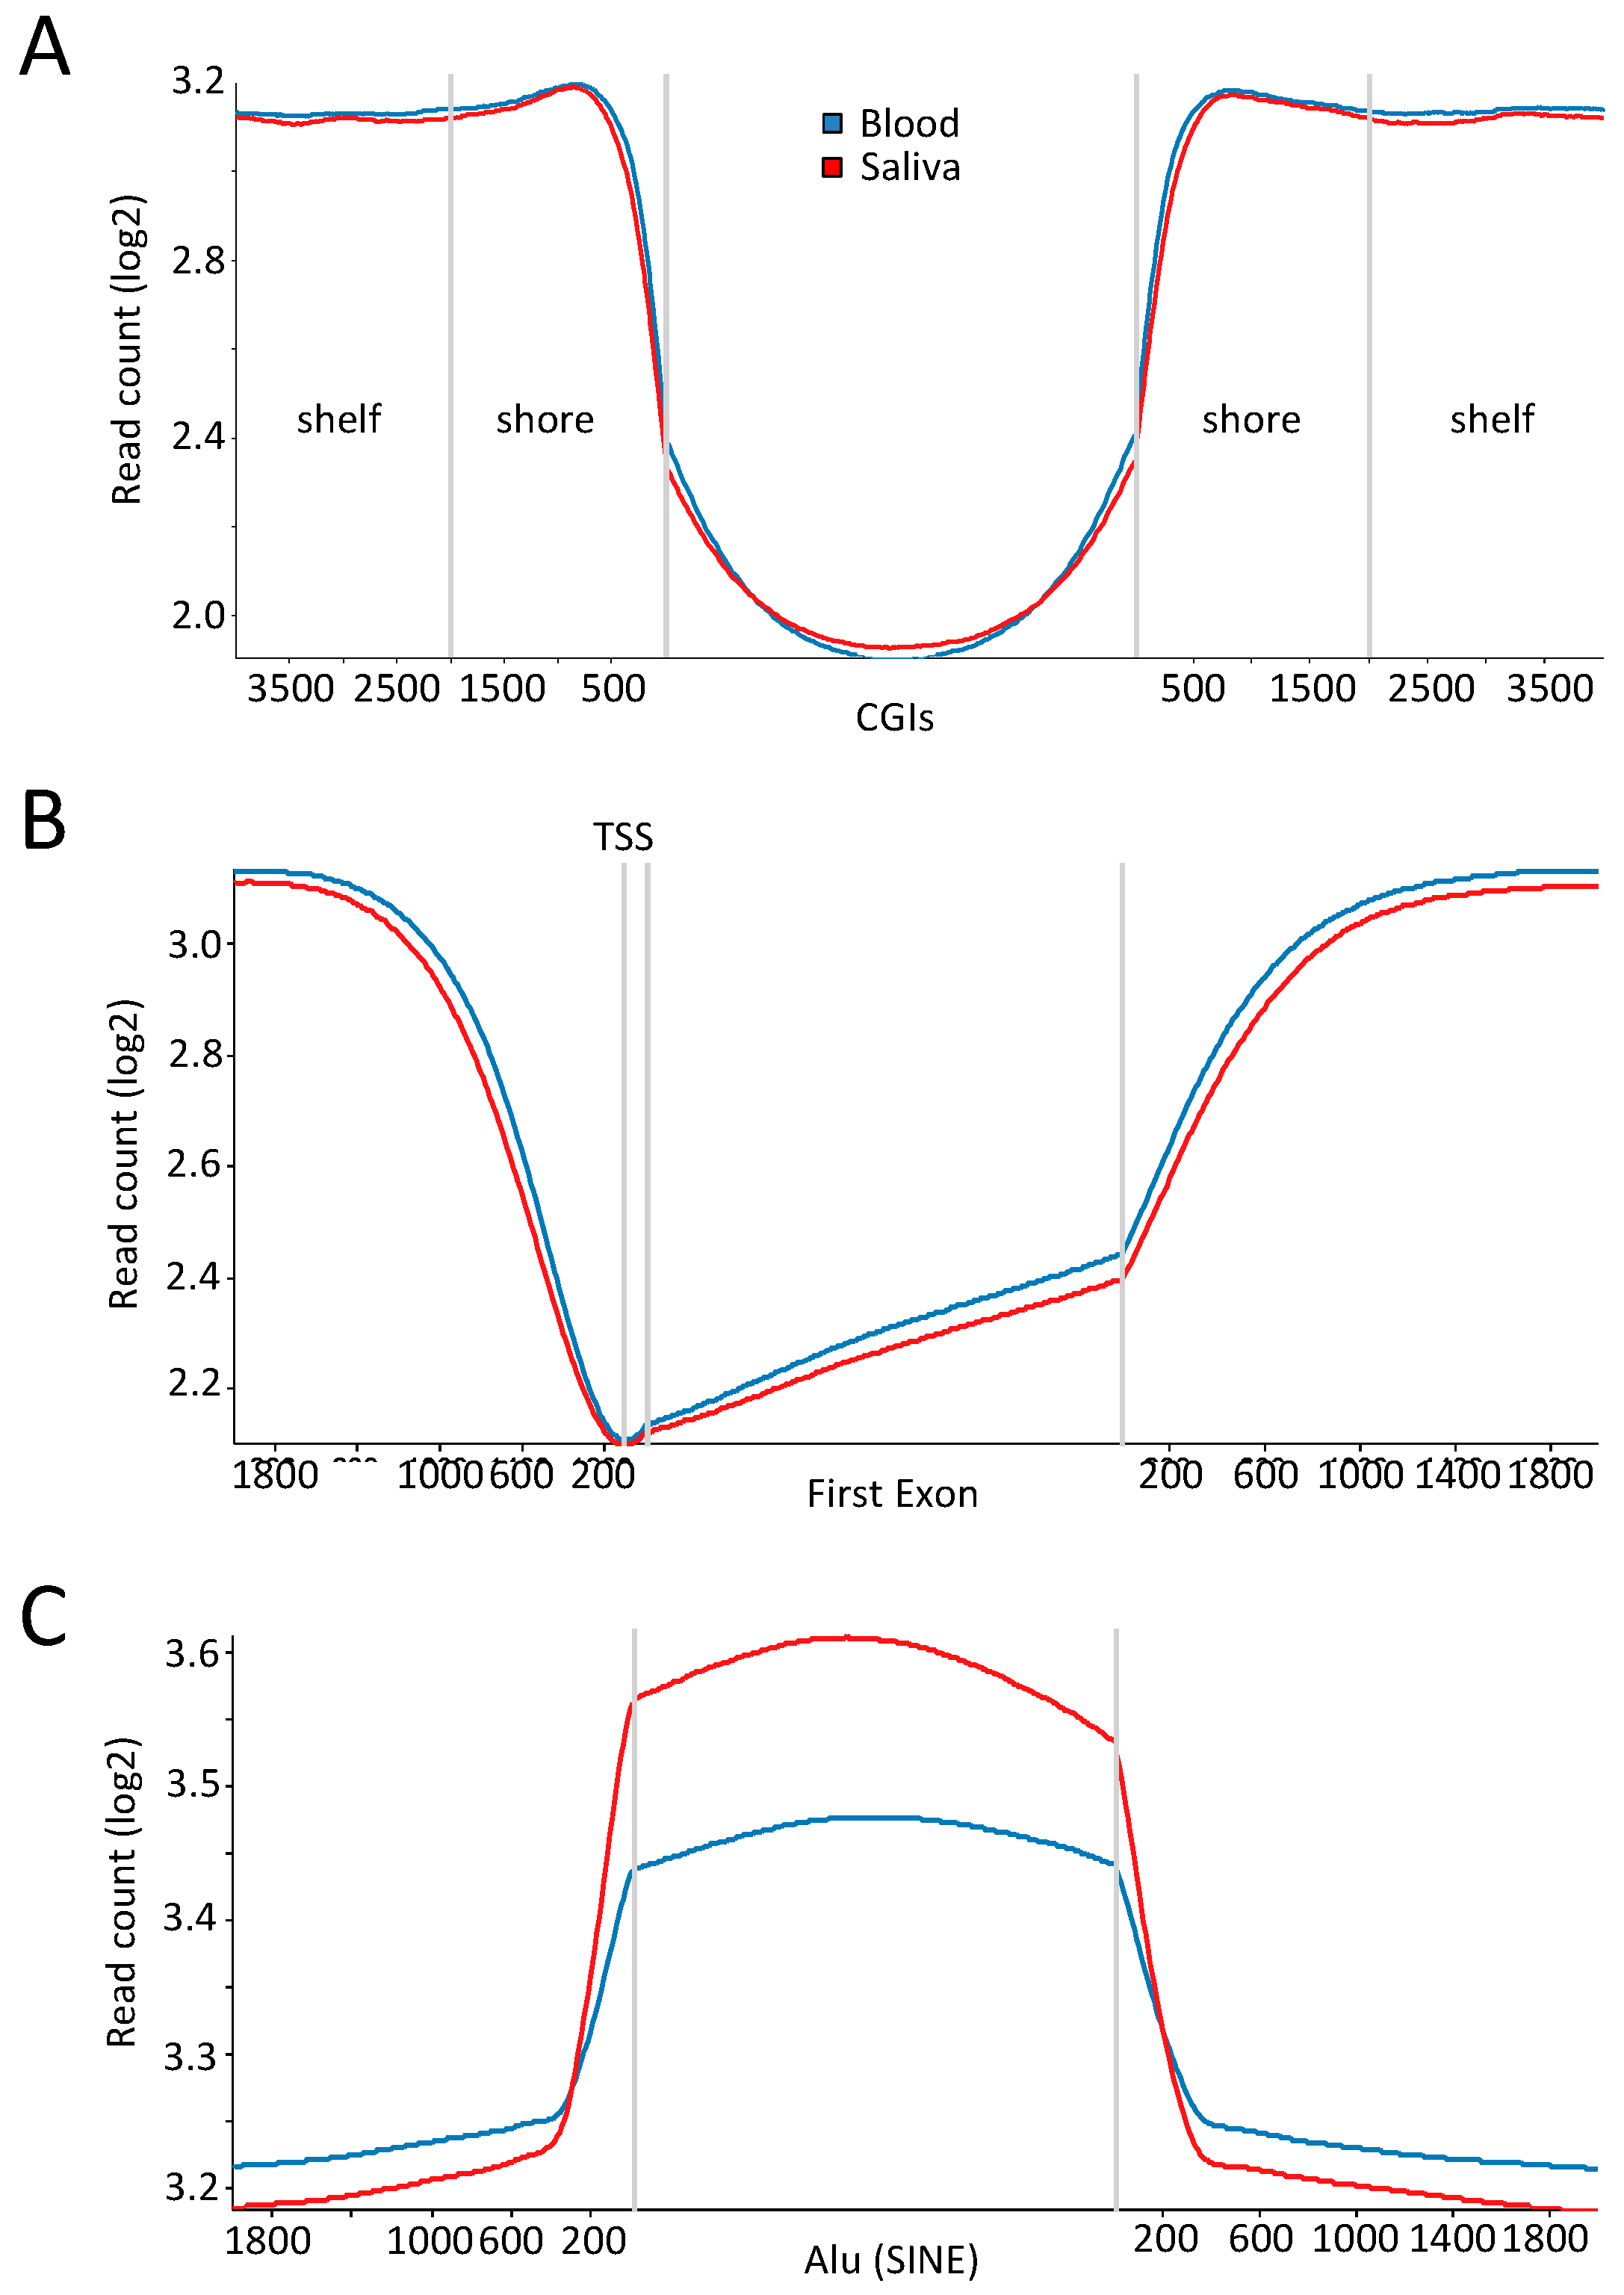
2.3. Comparable DNA Methylation Patterns between Blood and Saliva at Defined Genomic Regions

With the intent to inspect the methylation profile at genomic regions with a known canonical profile, mean read counts in the saliva and blood samples were calculated for CGIs (±4 kb), the first exon (±2 kb), thereby including transcription start sites (TSS), and Alu repeats (±2 kb) (Figure 3A–C). The expected low level of DNA methylation at CGIs with a step increase in the flanking shore regions was evident. Moreover, the DNA methylation profiles of saliva and blood were almost indistinguishable. Likewise, the methylation trajectories overlapping the TSS and the first exon were in concordance with previous observed profiles, with a sharp drop in methylation at the TSS and a lower methylation level in the first exon compared to downstream parts of the gene body [55,56,57,58,59,60]. Notably, the mean read-count level appeared slightly lower in saliva, which is in agreement with previous findings [19,54,61,62]. CpG sites within repetitive elements such as L1 and Alu are normally hypermethylated to prevent their expression. Especially, Alu repeats tend to accumulate in gene-rich regions and span roughly one quarter of all CpG dinucleotides in the human genome [63,64,65].
In line with this, plotting the read count over Alu elements showed a considerable increase compared to the flanking regions. Interestingly, within Alu elements the methylation profile of saliva and blood, although following the same trajectory, differs, with a read count higher in saliva (p < 0.0001, Welch t-test). Depending on the subtype of the Alu element analysed, both saliva hypo- and hypermethylation has been reported [62,66]. Importantly, however, a consistent low correlation of Alu methylation levels between saliva and blood was observed, which is indicative of high intra-individual variation in methylation across cell types and tissues.
Next we examined genome-wide variation between the saliva and blood sample sets in genomic regions annotated to the following features: proximal promoters (2 kb upstream of RefSeq genes), RefSeq genes, coding sequences (CDS), LINEs (L1 and L2), SINEs (Alu), previously reported mental disorder-associated genes found by DNA methylation studies using peripheral tissue (BDNF, SLC6A4, CACNA1C, HTR1A, COMT, ST6GALNAC1, DRD2, and GAD1) [8,67,68,69,70,71,72,73,74,75], and the above described DMWs. A box whisker plot of read counts in the grouped datasets at each genomic feature and a matching line graph for the individual datasets (normalized and summarized) showed a very similar profile with little variability and inter-individual difference, with DMWs as the natural exception (Figure 4A,B).
We next examined intragenic and intergenic CGIs, as well as the associated upstream and downstream shores (±2 kb of CGI) (Figure 5A,B). Notably, saliva displayed a slightly larger variability, as judged by the IQR, which is in concordance with previous findings [18]. Taken together, the overall similar profiles between peripheral blood and saliva emphasize the validity of MeDIP-seq results based on saliva.
Tissue-specific DNA methylation is known to be enriched in gene bodies, and especially at intragenic CGI shores [31,55,76]. Focusing on such intragenic CGI shores we found a clear tissue-specific distinction, as judged by hierarchical and principal component clustering (Supplementary Figure S10A,B). From 300 bp genomic windows overlapping downstream intragenic CGI shores (Figure 6A), overlapping genes restricted to a within-tissue PCC above 0.95 and a same directional deviation from the mean were selected, generating a list of 577 genes (Figure 6B).
Gene ontology (GO) analyses using the 577 genes returned two pathways significant after Bonferroni correction (p < 0.05), being B-cell and T-cell activation (Table 1).
We also performed a DAVID functional annotation using either default settings or restricted to tissue expression. Five functional terms were significant after Benjamini-Hochberg (BH) correction (p < 0.05) (Supplementary Table S1) using default settings. We acknowledge that the small sample set calls for extreme caution in the interpretation of the functional enrichment analysis results. Nevertheless, the enriched terms related to cellular processes involved in alternative splicing and post-transcriptional processing. Utilizing only databases on tissue of expression in the functional annotation of the 577 genes, the top three significant tissues were brain, peripheral lymphocytes, and epithelium (Supplementary Table S2). Whereas only brain tissue survived correction for multiple testing, this finding still indicates that the methylation differences observed are a function of the tissue of origin and, thus, associated with phenotypic differences.
In a reverse approach we looked for specific patterns in the downstream intragenic CGI shores based on cell-type-specific expressed genes. For this we extracted a gene list from the GeneCardsSuite specific for neutrophils, monocytes, hepatocytes, and oral cavity squamous epithelial cells and overlapped it with the downstream intragenic CGI shores (Figure 6C). No specific patterns were observed, however, it should be noted that, in contrast to promoter CpG methylation, no unidirectional relationship between gene body methylation and expression exists [77,78,79].
With the intent to compare to other MeDIP-seq datasets we included GEO-available datasets on foetal brain, peripheral blood mononuclear cells (PBMCs), and breast epithelial cells. Restricting the analysis to previously identified blood-brain tissue-specific DMRs (TS-DMRs) (n = 50) within CGIs or regions with high inter-individual difference (n = 43) [20] the samples clustered according to tissue or individual of origin, respectively (Figure 7). In the former comparison the linear correlation between foetal brain and saliva (R = 0.173) was, furthermore, larger than between foetal brain and blood (R = −0.06) whereas PBMCs and blood was more correlated (R = 0.639) than PBMCs and saliva (R = 0.558) (Supplementary Figure S11). Notably, in the latter comparison the matched blood-saliva samples clustered together, whereas only the related brain samples clustered closely together.
Taken together, the presented data suggests that even in a suboptimal matched and small sized sample set where up to 74% of the DNA may originate from the same tissue, white blood cells [29], samples can be separated by tissue using MeDIP-seq. A previous study has measured the inter-individual saliva and blood methylation profile to be at a positive correlation for 88.5% of CpGs [18]. Limitations to this study include a small sample size and the inability to correct for cell heterogeneity, making a replication study warranted. However, although tissue, age, and sex specific methylation are well described—on a global level, inter-individual correlation remains high [80,81,82,83,84,85], justifying the comparison described herein. A further limitation is the presence of bacterial DNA in saliva samples. However, with the collection kit used in the current study the content has been shown to be low (median 11.8%) compared to mouthwashes and buccal swabs (median 60–90%) [86].

3. Materials and Methods

3.1. Biological Samples

As part of the CHANGE project [87], peripheral blood (10 mL) and saliva (2 mL) samples were collected in EDTA tubes (BD, Franklin Lakes, NJ, USA) and Oragene saliva collection tubes for DNA extraction (OG-500, DNA Genotek, Ottawa, ON, Canada), respectively, from adult individuals. Blood samples were stored <6 months at −20 °C and saliva samples 6–12 months at ambient temperatures before extraction. Genomic DNA (gDNA) from peripheral blood was extracted using Maxwell (Promega, WI, USA) and from saliva with the prepIT-L2P kit (DNA Genotek) and stored at −80 °C. Matched saliva and blood samples from three individuals were used in the study; individual 2022 (male, age 54), 2023 (female, age 45), and 2025 (female, age 33). Concentration of the extracted genomic DNA (gDNA) was measured using the Nanodrop 1000 instrument (Thermo Scientific, Waltham, MA, USA). Additionally, a MeDIP-seq input control (blood) from an unrelated study was included in the enrichment analysis.

3.2. MeDIP-seq

Extracted gDNA was sonicated in a Pico Bioruptor (Diagenode, Seraing, Belgium) at 10 ng/μL for 13 cycles of 30 s on 30 s off to a mean fragment size of about 180 bp. Fragment length distribution was assessed by microelectrophoresis using the Qiaxcel instrument and a high-resolution gel cartridge (Qiagen, Hilden, Germany). Five-hundred nanograms of sonicated gDNA was subsequently used for end-repair and adaptor ligation employing the NEBNext Ultra DNA Library Prep Kit for Illumina (New England Biolabs, MA, USA). The reaction mix was purified using Ampure XP beads (Beckman-Coulter, CA, USA) after which MeDIP was set up on the SX-8G-IP-Star Compact robot (Diagenode) according to manufacturer’s instructions applying the Auto MeDIP kit (Diagenode) and including unmethylated and methylated spike-in controls. Effectively 415 ng of adaptor ligated DNA was used in the MeDIP process. Antibody incubation was performed at 4 °C for 15 h. Immunoprecipitated samples were magnetically purified on the robot using the Auto iPure v2 kit (Diagenode) according to the manufacturer’s instructions. Recovery and enrichment was evaluated by qPCR using primer sets specific for the spike-in controls. Minimum criteria were set to 10% recovery and 25-fold enrichment [88]. Based on the recovery rate samples were PCR-amplified at 13 cycles using multiplex oligos (New England Biolabs). Samples were size-selected with Ampure XP beads on the SX-8G-IP-Star Compact robot (Diagenode) using a total of 90 μL beads per sample and eluted in 25 μL DNase-free H2O. Purity and fragment length distribution was evaluated on the Qiaxcel instrument. Post-amplification enrichment was verified by qPCR using primer pairs targeting the endogenous hypermethylated promoter region of testis specific histone 2B (TSH2B) (Diagenode, cat. no. C17011041) or the hypomethylated transcription start site (TSS) of glyceraldehyde 3-phosphate dehydrogenase (GAPDH) (Diagenode, cat. no. C17011047).

3.3. Sequencing and Bioinformatics

Samples were PE50 sequenced in two lanes on a HiSeq2000 instrument (Illumina, San Diego, CA, USA), generating around 68 million reads per sample. The reads were cleaned using Soapnuke 1.5.0 (BGI, Shenzhen, China) applying the following filters; remove reads with adaptors, remove reads with >10% unknown reads, and remove reads with >50% low quality bases (Q score < 5). Clean reads only qualify if Q 20% > 85%. Quality control of the cleaned fastq files was performed using FastQC. Utilizing the Galaxy platform [89], the pair-end reads were aligned to the human genome (hg38) using BWA [90]. SAM files were converted to BAM files and filtered to include only de-duplicated, uniquely-mapped reads resulting in 58–67 million clean reads per sample. BAM files were imported to R and SeqMonk v0.32.1 (Barbraham Institute, Cambridge, UK). In SeqMonk segments were generated by quantitation of read counts in genetic windows of 300 bp (150 bp overlap) corrected for total read counts (reads per million). Duplicates were ignored. The R package MEDIPS was used for quality control, genomic coverage estimation, and differential coverage analysis in bin sizes of 100 or 500 bp [91]. Differential coverage was calculated with an exact test using trimmed mean of M-values (TMM) corrected libraries with a variance estimated by the quantile-adjusted conditional maximum likelihood (qCML) method. The p-values were corrected for multiple testing using the Bonferroni procedure. CNV analysis was performed using the QSEA and HMMcopy bioconductor packages, using a genomic window size of 1 × 10⁶ bp. Annotation was performed using the DAVID bioinformatics and The Gene Ontology Consortium database [92,93,94,95]. Publicly-available GEO MeDIP-seq datasets on breast luminal epithelium cells (GSM493615 and GSM613843), PBMCs (GSM543023), and foetal brain (GSM669615, GSM707019, and GSM669614) (methylated fragments enriched using antibody from Diagenode) were downloaded and lifted over to the hg38 build. Blood and brain tissue and inter-individual specific DMRs were obtained from [20].

3.4. Ethics Statement

All procedures were performed in accordance with relevant regulation and approved by the Danish health research ethical committee (license no.: H-4-2012-051) and the Danish Data Protection Agency (license no.: 01689 RHP-2012-007)

3.5. Availability of Data and Materials

The saliva-blood MeDIP-seq dataset is available upon request.

4. Conclusions

We compared MeDIP-seq profiles of saliva and blood from three individuals. The methylation profile of blood has previously been analysed by MeDIP-seq and follows a pattern also observed in other cell types [20,36,56]. On a global level the data quality and methylation profiles described herein are highly similar between saliva and peripheral blood, suggesting that the use of MeDIP-seq on DNA extracted from saliva is a feasible and valid approach for methylome studies. The use of saliva-derived DNA could alleviate logistic challenges, thereby increasing the number of participants in future epigenetic epidemiology studies.

Supplementary Materials

Supplementary Figure S1: Representative FastQC outputs. Quality of sequence data exemplified by the output of the B2022 sense and antisense sequencing reactions. (A) Sequencing quality (Phred) score across the PE50 reads; (B) GC content in the MeDIP enriched samples (red line) compared to the theoretical distribution (blue line). Supplementary Figure S2: CNV analysis for existence of chromosomal copy number abnormalities in the blood and saliva samples. Based on the HMMcopy R package and ≥1 Mb genomic windows. Supplementary Figure S3: Normal distribution of sequencing read length. Length distribution of all filtered and mapped reads in the grouped saliva and blood sample sets. Supplementary Figure S4: Saturation plots depicting comparable complexity and depth among all samples. Saturation plot showing adequate complexity and reproducibility of mapped reads in the six samples compared to the reference genome. Supplementary Figure S5: Whole-genome CpG coverage for each sample. Genome-wide CpG coverage and depth depicted as the percentage and coverage level of the 28 million CpGs covered by the sequence reads. Reads are extended to length 180 bp (library mean length) and only one read mapped to same genomic location is kept (avoiding PCR duplicates). Supplementary Figure S6: CpG density dependent immunoprecipitation of DNA fragments. Calibration plot showing the CpG density dependent immunoprecipitation of DNA fragments in blood and saliva samples with normalization of number of reads per window. For illustrative purposes only chromosome 1 results are shown. Supplementary Figure S7: Enrichment of CpG. (A) Fingerprint plot depicting read count as a function of ranked genomic bins for saliva and blood samples and an input control (peripheral blood sample); (B) Enrichment score for CpG sites shown as the ratio of CpGs in MeDIP enriched DNA from saliva and blood samples compared to the reference genome. Supplementary Figure S8: Intra-individual DMWs. Venn diagram presenting the number of DMWs found in each intra-individual comparison and the overlap. Also included are bar charts of the pair-wise overlap of DMWs segregated by direction and genomic annotation. Supplementary Figure S9: Hypermethylated regions in saliva compared to blood. (A) MA plot depicting the average methylation level (x-axis) in the complete dataset against methylation difference (y-axis) between tissues. Yellow dots represent differentially methylated windows at p < 0.001 and red crosses significant DMWs with Bonferroni adjusted p < 0.05. A general tendency of a higher methylation rate in saliva is indicated from the cloud of orange dots with a downward trajectory, deviating from the mean; (B) Genomic annotation of DMWs within the three genomic features: intragenic (including pseudogenes), intronic, and exonic. Supplementary Figure S10: Improved within-tissue clustering at downstream intragenic CGI shores. (A) Dendrogram of saliva and blood samples; (B) PCA plot of PC1 and PC2 using only sequencing reads overlapping downstream intragenic CGI shores. Supplementary Figure S11: Correlation was larger between related tissues compared to unrelated tissues. The correlation was based on 50 TS-DMRs. Supplementary Table S1: DAVID functional annotation. Employing default databases, terms passing Benjamini-Hochberg correction of the 577 genes featuring differently covered downstream intragenic CGI shores. UP; Uniprot. Supplementary Table S2: DAVID functional annotation restricted to tissue expression. Using only Uniprot tissue (up_tissue) annotation database the 10 most significant terms applying the list of 577 genes featuring differently covered downstream intragenic CGI shores are displayed.

Acknowledgments

We thank Marit Nielsen for expert technical assistance at Translational Neuropsychiatric Unit, Aarhus University Hospital. This work was funded by the Lundbeck Foundation Initiative for Integrative Psychiatric Research (iPSYCH), Aarhus University, Denmark.

Author Contributions

Conceived and designed the experiments: N.H.S., A.B., and O.M.; performed the experiments: N.H.S.; analysed the data: N.H.S., A.L.N., M.N., and A.S.; drafted the manuscript: N.H.S. All authors read and approved the final manuscript.

Conflicts of Interest

The authors declare no conflict of interest.

References

  1. Bjornsson, H.T.; Cui, H.; Gius, D.; Fallin, M.D.; Feinberg, A.P. The new field of epigenomics: Implications for cancer and other common disease research. Cold Spring Harb. Symp. Quant. Biol. 2004, 69, 447–456. [Google Scholar] [CrossRef] [PubMed]
  2. Esteller, M. Epigenetics in cancer. N. Engl. J. Med. 2008, 358, 1148–1159. [Google Scholar] [CrossRef] [PubMed]
  3. Feinberg, A.P. Epigenetics at the epicenter of modern medicine. JAMA 2008, 299, 1345–1350. [Google Scholar] [CrossRef] [PubMed]
  4. Migliore, L.; Coppede, F. Genetics, environmental factors and the emerging role of epigenetics in neurodegenerative diseases. Mutat. Res. 2009, 667, 82–97. [Google Scholar] [CrossRef] [PubMed]
  5. Joubert, B.R.; Felix, J.F.; Yousefi, P.; Bakulski, K.M.; Just, A.C.; Breton, C.; Reese, S.E.; Markunas, C.A.; Richmond, R.C.; Xu, C.J.; et al. DNA Methylation in Newborns and Maternal Smoking in Pregnancy: Genome-wide Consortium Meta-analysis. Am. J. Hum. Genet. 2016, 98, 680–696. [Google Scholar] [CrossRef] [PubMed]
  6. Markunas, C.A.; Xu, Z.; Harlid, S.; Wade, P.A.; Lie, R.T.; Taylor, J.A.; Wilcox, A.J. Identification of DNA methylation changes in newborns related to maternal smoking during pregnancy. Environ. Health Perspect. 2014, 122, 1147–1153. [Google Scholar] [CrossRef] [PubMed] [Green Version]
  7. Aberg, K.A.; McClay, J.L.; Nerella, S.; Clark, S.; Kumar, G.; Chen, W.; Khachane, A.N.; Xie, L.; Hudson, A.; Gao, G.; et al. Methylome-wide association study of schizophrenia: Identifying blood biomarker signatures of environmental insults. JAMA Psychiatry 2014, 71, 255–264. [Google Scholar] [CrossRef] [PubMed]
  8. Dempster, E.L.; Pidsley, R.; Schalkwyk, L.C.; Owens, S.; Georgiades, A.; Kane, F.; Kalidindi, S.; Picchioni, M.; Kravariti, E.; Toulopoulou, T.; et al. Disease-associated epigenetic changes in monozygotic twins discordant for schizophrenia and bipolar disorder. Hum. Mol. Genet. 2011, 20, 4786–4796. [Google Scholar] [CrossRef] [PubMed]
  9. Kinoshita, M.; Numata, S.; Tajima, A.; Ohi, K.; Hashimoto, R.; Shimodera, S.; Imoto, I.; Takeda, M.; Ohmori, T. Aberrant DNA methylation of blood in schizophrenia by adjusting for estimated cellular proportions. Neuromol. Med. 2014, 16, 697–703. [Google Scholar] [CrossRef] [PubMed]
  10. Liu, J.; Chen, J.; Ehrlich, S.; Walton, E.; White, T.; Perrone-Bizzozero, N.; Bustillo, J.; Turner, J.A.; Calhoun, V.D. Methylation patterns in whole blood correlate with symptoms in schizophrenia patients. Schizophr. Bull. 2014, 40, 769–776. [Google Scholar] [CrossRef] [PubMed]
  11. Mill, J.; Tang, T.; Kaminsky, Z.; Khare, T.; Yazdanpanah, S.; Bouchard, L.; Jia, P.; Assadzadeh, A.; Flanagan, J.; Schumacher, A.; et al. Epigenomic profiling reveals DNA-methylation changes associated with major psychosis. Am. J. Hum. Genet. 2008, 82, 696–711. [Google Scholar] [CrossRef] [PubMed]
  12. Montano, C.; Taub, M.A.; Jaffe, A.; Briem, E.; Feinberg, J.I.; Trygvadottir, R.; Idrizi, A.; Runarsson, A.; Berndsen, B.; Gur, R.C.; et al. Association of DNA Methylation Differences With Schizophrenia in an Epigenome-Wide Association Study. JAMA Psychiatry 2016, 73, 506–514. [Google Scholar] [CrossRef] [PubMed]
  13. Klengel, T.; Mehta, D.; Anacker, C.; Rex-Haffner, M.; Pruessner, J.C.; Pariante, C.M.; Pace, T.W.; Mercer, K.B.; Mayberg, H.S.; Bradley, B.; et al. Allele-specific FKBP5 DNA demethylation mediates gene-childhood trauma interactions. Nat. Neurosci. 2013, 16, 33–41. [Google Scholar] [CrossRef] [PubMed]
  14. Bevilacqua, L.; Carli, V.; Sarchiapone, M.; George, D.K.; Goldman, D.; Roy, A.; Enoch, M.A. Interaction between FKBP5 and childhood trauma and risk of aggressive behavior. Arch. Gener. Psychiatry 2012, 69, 62–70. [Google Scholar] [CrossRef] [PubMed]
  15. Bahlo, M.; Stankovich, J.; Danoy, P.; Hickey, P.F.; Taylor, B.V.; Browning, S.R.; The Australian and New Zealand Multiple Sclerosis Genetics Consortium (ANZgene); Brown, M.A.; Rubio, J.P. Saliva-derived DNA performs well in large-scale, high-density single-nucleotide polymorphism microarray studies. Cancer Epidemiol. Biomark. Prev. 2010, 19, 794–798. [Google Scholar] [CrossRef] [PubMed] [Green Version]
  16. Yokoyama, J.S.; Erdman, C.A.; Hamilton, S.P. Array-based whole-genome survey of dog saliva DNA yields high quality SNP data. PLoS ONE 2010, 5, e10809. [Google Scholar] [CrossRef] [PubMed]
  17. Abraham, J.E.; Maranian, M.J.; Spiteri, I.; Russell, R.; Ingle, S.; Luccarini, C.; Earl, H.M.; Pharoah, P.P.; Dunning, A.M.; Caldas, C. Saliva samples are a viable alternative to blood samples as a source of DNA for high throughput genotyping. BMC Med. Genom. 2012, 5, 19. [Google Scholar] [CrossRef] [PubMed]
  18. Smith, A.K.; Kilaru, V.; Klengel, T.; Mercer, K.B.; Bradley, B.; Conneely, K.N.; Ressler, K.J.; Binder, E.B. DNA extracted from saliva for methylation studies of psychiatric traits: Evidence tissue specificity and relatedness to brain. Am. J. Med. Genet. B Neuropsychiatr. Genet. 2015, 168B, 36–44. [Google Scholar] [CrossRef] [PubMed]
  19. Thompson, T.M.; Sharfi, D.; Lee, M.; Yrigollen, C.M.; Naumova, O.Y.; Grigorenko, E.L. Comparison of whole-genome DNA methylation patterns in whole blood, saliva, and lymphoblastoid cell lines. Behav. Genet. 2013, 43, 168–176. [Google Scholar] [CrossRef] [PubMed]
  20. Davies, M.N.; Volta, M.; Pidsley, R.; Lunnon, K.; Dixit, A.; Lovestone, S.; Coarfa, C.; Harris, R.A.; Milosavljevic, A.; Troakes, C.; et al. Functional annotation of the human brain methylome identifies tissue-specific epigenetic variation across brain and blood. Genome Biol. 2012, 13, R43. [Google Scholar] [CrossRef] [PubMed]
  21. Kaminsky, Z.; Tochigi, M.; Jia, P.; Pal, M.; Mill, J.; Kwan, A.; Ioshikhes, I.; Vincent, J.B.; Kennedy, J.L.; Strauss, J.; et al. A multi-tissue analysis identifies HLA complex group 9 gene methylation differences in bipolar disorder. Mol. Psychiatry 2012, 17, 728–740. [Google Scholar] [CrossRef] [PubMed]
  22. Murphy, B.C.; O’Reilly, R.L.; Singh, S.M. DNA methylation and mRNA expression of SYN III, a candidate gene for schizophrenia. BMC Med. Genet. 2008, 9, 115. [Google Scholar] [CrossRef] [PubMed]
  23. Doi, A.; Park, I.H.; Wen, B.; Murakami, P.; Aryee, M.J.; Irizarry, R.; Herb, B.; Ladd-Acosta, C.; Rho, J.; Loewer, S.; et al. Differential methylation of tissue- and cancer-specific CpG island shores distinguishes human induced pluripotent stem cells, embryonic stem cells and fibroblasts. Nat. Genet. 2009, 41, 1350–1353. [Google Scholar] [CrossRef] [PubMed]
  24. Irizarry, R.A.; Ladd-Acosta, C.; Wen, B.; Wu, Z.; Montano, C.; Onyango, P.; Cui, H.; Gabo, K.; Rongione, M.; Webster, M.; et al. The human colon cancer methylome shows similar hypo- and hypermethylation at conserved tissue-specific CpG island shores. Nat. Genet. 2009, 41, 178–186. [Google Scholar] [CrossRef] [PubMed]
  25. Rao, X.; Evans, J.; Chae, H.; Pilrose, J.; Kim, S.; Yan, P.; Huang, R.L.; Lai, H.C.; Lin, H.; Liu, Y.; et al. CpG island shore methylation regulates caveolin-1 expression in breast cancer. Oncogene 2013, 32, 4519–4528. [Google Scholar] [CrossRef] [PubMed]
  26. Laurent, L.; Wong, E.; Li, G.; Huynh, T.; Tsirigos, A.; Ong, C.T.; Low, H.M.; Kin Sung, K.W.; Rigoutsos, I.; Loring, J.; et al. Dynamic changes in the human methylome during differentiation. Genome Res. 2010, 20, 320–331. [Google Scholar] [CrossRef] [PubMed]
  27. Varley, K.E.; Gertz, J.; Bowling, K.M.; Parker, S.L.; Reddy, T.E.; Pauli-Behn, F.; Cross, M.K.; Williams, B.A.; Stamatoyannopoulos, J.A.; Crawford, G.E.; et al. Dynamic DNA methylation across diverse human cell lines and tissues. Genome Res. 2013, 23, 555–567. [Google Scholar] [CrossRef] [PubMed]
  28. Smith, Z.D.; Meissner, A. DNA methylation: Roles in mammalian development. Nat. Rev. Genet. 2013, 14, 204–220. [Google Scholar] [CrossRef] [PubMed]
  29. Thiede, C.; Prange-Krex, G.; Freiberg-Richter, J.; Bornhauser, M.; Ehninger, G. Buccal swabs but not mouthwash samples can be used to obtain pretransplant DNA fingerprints from recipients of allogeneic bone marrow transplants. Bone Marrow Transpl. 2000, 25, 575–577. [Google Scholar] [CrossRef] [PubMed]
  30. Vidovic, A.; Vidovic Juras, D.; Vucicevic Boras, V.; Lukac, J.; Grubisic-Ilic, M.; Rak, D.; Sabioncello, A. Determination of leucocyte subsets in human saliva by flow cytometry. Arch. Oral. Biol. 2012, 57, 577–583. [Google Scholar] [CrossRef] [PubMed]
  31. Deaton, A.M.; Webb, S.; Kerr, A.R.; Illingworth, R.S.; Guy, J.; Andrews, R.; Bird, A. Cell type-specific DNA methylation at intragenic CpG islands in the immune system. Genome Res. 2011, 21, 1074–1086. [Google Scholar] [CrossRef] [PubMed]
  32. Mohn, F.; Weber, M.; Rebhan, M.; Roloff, T.C.; Richter, J.; Stadler, M.B.; Bibel, M.; Schubeler, D. Lineage-specific polycomb targets and de novo DNA methylation define restriction and potential of neuronal progenitors. Mol. Cell 2008, 30, 755–766. [Google Scholar] [CrossRef] [PubMed]
  33. Essex, M.J.; Boyce, W.T.; Hertzman, C.; Lam, L.L.; Armstrong, J.M.; Neumann, S.M.; Kobor, M.S. Epigenetic vestiges of early developmental adversity: Childhood stress exposure and DNA methylation in adolescence. Child Dev. 2013, 84, 58–75. [Google Scholar] [CrossRef] [PubMed]
  34. Weder, N.; Zhang, H.; Jensen, K.; Yang, B.Z.; Simen, A.; Jackowski, A.; Lipschitz, D.; Douglas-Palumberi, H.; Ge, M.; Perepletchikova, F.; et al. Child abuse, depression, and methylation in genes involved with stress, neural plasticity, and brain circuitry. J. Am. Acad. Child Adolesc. Psychiatry 2014, 53, 417–424. [Google Scholar] [CrossRef] [PubMed]
  35. Yang, B.Z.; Zhang, H.; Ge, W.; Weder, N.; Douglas-Palumberi, H.; Perepletchikova, F.; Gelernter, J.; Kaufman, J. Child abuse and epigenetic mechanisms of disease risk. Am. J. Prev. Med. 2013, 44, 101–107. [Google Scholar] [CrossRef] [PubMed]
  36. Clark, C.; Palta, P.; Joyce, C.J.; Scott, C.; Grundberg, E.; Deloukas, P.; Palotie, A.; Coffey, A.J. A comparison of the whole genome approach of MeDIP-seq to the targeted approach of the Infinium HumanMethylation450 BeadChip(®) for methylome profiling. PLoS ONE 2012, 7, e50233. [Google Scholar] [CrossRef] [PubMed]
  37. Beyan, H.; Down, T.A.; Ramagopalan, S.V.; Uvebrant, K.; Nilsson, A.; Holland, M.L.; Gemma, C.; Giovannoni, G.; Boehm, B.O.; Ebers, G.C.; et al. Guthrie card methylomics identifies temporally stable epialleles that are present at birth in humans. Genome Res. 2012, 22, 2138–2145. [Google Scholar] [CrossRef] [PubMed]
  38. Chen, G.; Yu, D.; Chen, J.; Cao, R.; Yang, J.; Wang, H.; Ji, X.; Ning, B.; Shi, T. Re-annotation of presumed noncoding disease/trait-associated genetic variants by integrative analyses. Sci. Rep. 2015, 5, 9453. [Google Scholar] [CrossRef] [PubMed]
  39. Feber, A.; Wilson, G.A.; Zhang, L.; Presneau, N.; Idowu, B.; Down, T.A.; Rakyan, V.K.; Noon, L.A.; Lloyd, A.C.; Stupka, E.; et al. Comparative methylome analysis of benign and malignant peripheral nerve sheath tumors. Genome Res. 2011, 21, 515–524. [Google Scholar] [CrossRef] [PubMed]
  40. Rajendiran, S.; Gibbs, L.D.; Van Treuren, T.; Klinkebiel, D.L.; Vishwanatha, J.K. MIEN1 is tightly regulated by SINE Alu methylation in its promoter. Oncotarget 2016, 7, 65307–65319. [Google Scholar] [CrossRef] [PubMed]
  41. Li, N.; Ye, M.; Li, Y.; Yan, Z.; Butcher, L.M.; Sun, J.; Han, X.; Chen, Q.; Zhang, X.; Wang, J. Whole genome DNA methylation analysis based on high throughput sequencing technology. Methods 2010, 52, 203–212. [Google Scholar] [CrossRef] [PubMed]
  42. Eckhardt, F.; Lewin, J.; Cortese, R.; Rakyan, V.K.; Attwood, J.; Burger, M.; Burton, J.; Cox, T.V.; Davies, R.; Down, T.A.; et al. DNA methylation profiling of human chromosomes 6, 20 and 22. Nat. Genet. 2006, 38, 1378–1385. [Google Scholar] [CrossRef] [PubMed]
  43. Chavez, L.; Jozefczuk, J.; Grimm, C.; Dietrich, J.; Timmermann, B.; Lehrach, H.; Herwig, R.; Adjaye, J. Computational analysis of genome-wide DNA methylation during the differentiation of human embryonic stem cells along the endodermal lineage. Genome Res. 2010, 20, 1441–1450. [Google Scholar] [CrossRef] [PubMed]
  44. Neary, J.L.; Perez, S.M.; Peterson, K.; Lodge, D.J.; Carless, M.A. Comparative analysis of MBD-seq and MeDIP-seq and estimation of gene expression changes in a rodent model of schizophrenia. Genomics 2017, 109, 204–213. [Google Scholar] [CrossRef] [PubMed]
  45. Staunstrup, N.H.; Starnawska, A.; Nyegaard, M.; Christiansen, L.; Nielsen, A.L.; Borglum, A.; Mors, O. Genome-wide DNA methylation profiling with MeDIP-seq using archived dried blood spots. Clin. Epigenet. 2016, 8, 81. [Google Scholar] [CrossRef] [PubMed] [Green Version]
  46. De Jong, S.; Neeleman, M.; Luykx, J.J.; ten Berg, M.J.; Strengman, E.; Den Breeijen, H.H.; Stijvers, L.C.; Buizer-Voskamp, J.E.; Bakker, S.C.; Kahn, R.S.; et al. Seasonal changes in gene expression represent cell-type composition in whole blood. Hum. Mol. Genet. 2014, 23, 2721–2728. [Google Scholar] [CrossRef] [PubMed]
  47. Whitney, A.R.; Diehn, M.; Popper, S.J.; Alizadeh, A.A.; Boldrick, J.C.; Relman, D.A.; Brown, P.O. Individuality and variation in gene expression patterns in human blood. Proc. Natl. Acad. Sci. USA 2003, 100, 1896–1901. [Google Scholar] [CrossRef] [PubMed]
  48. Eady, J.J.; Wortley, G.M.; Wormstone, Y.M.; Hughes, J.C.; Astley, S.B.; Foxall, R.J.; Doleman, J.F.; Elliott, R.M. Variation in gene expression profiles of peripheral blood mononuclear cells from healthy volunteers. Physiol. Genom. 2005, 22, 402–411. [Google Scholar] [CrossRef] [PubMed]
  49. Busche, S.; Shao, X.; Caron, M.; Kwan, T.; Allum, F.; Cheung, W.A.; Ge, B.; Westfall, S.; Simon, M.M.; The Multiple Tissue Human Expression Resource; et al. Population whole-genome bisulfite sequencing across two tissues highlights the environment as the principal source of human methylome variation. Genome Biol. 2015, 16, 290. [Google Scholar] [CrossRef] [PubMed]
  50. Hon, G.C.; Rajagopal, N.; Shen, Y.; McCleary, D.F.; Yue, F.; Dang, M.D.; Ren, B. Epigenetic memory at embryonic enhancers identified in DNA methylation maps from adult mouse tissues. Nat. Genet. 2013, 45, 1198–1206. [Google Scholar] [CrossRef] [PubMed]
  51. Stadler, M.B.; Murr, R.; Burger, L.; Ivanek, R.; Lienert, F.; Scholer, A.; van Nimwegen, E.; Wirbelauer, C.; Oakeley, E.J.; Gaidatzis, D.; et al. DNA-binding factors shape the mouse methylome at distal regulatory regions. Nature 2011, 480, 490–495. [Google Scholar] [CrossRef] [PubMed]
  52. Ziller, M.J.; Gu, H.; Muller, F.; Donaghey, J.; Tsai, L.T.; Kohlbacher, O.; De Jager, P.L.; Rosen, E.D.; Bennett, D.A.; Bernstein, B.E.; et al. Charting a dynamic DNA methylation landscape of the human genome. Nature 2013, 500, 477–481. [Google Scholar] [CrossRef] [PubMed] [Green Version]
  53. Van Dongen, J.; Nivard, M.G.; Willemsen, G.; Hottenga, J.J.; Helmer, Q.; Dolan, C.V.; Ehli, E.A.; Davies, G.E.; van Iterson, M.; Breeze, C.E.; et al. Genetic and environmental influences interact with age and sex in shaping the human methylome. Nat. Commun. 2016, 7, 11115. [Google Scholar] [CrossRef] [PubMed] [Green Version]
  54. Langie, S.A.; Szarc Vel Szic, K.; Declerck, K.; Traen, S.; Koppen, G.; Van Camp, G.; Schoeters, G.; Vanden Berghe, W.; De Boever, P. Whole-Genome Saliva and Blood DNA Methylation Profiling in Individuals with a Respiratory Allergy. PLoS ONE 2016, 11, e0151109. [Google Scholar] [CrossRef] [PubMed]
  55. Jones, P.A. Functions of DNA methylation: Islands, start sites, gene bodies and beyond. Nat. Rev. Genet. 2012, 13, 484–492. [Google Scholar] [CrossRef] [PubMed]
  56. Shen, H.; Qiu, C.; Li, J.; Tian, Q.; Deng, H.W. Characterization of the DNA methylome and its interindividual variation in human peripheral blood monocytes. Epigenomics 2013, 5, 255–269. [Google Scholar] [CrossRef] [PubMed]
  57. Brenet, F.; Moh, M.; Funk, P.; Feierstein, E.; Viale, A.J.; Socci, N.D.; Scandura, J.M. DNA methylation of the first exon is tightly linked to transcriptional silencing. PLoS ONE 2011, 6, e14524. [Google Scholar] [CrossRef] [PubMed]
  58. Ball, M.P.; Li, J.B.; Gao, Y.; Lee, J.H.; LeProust, E.M.; Park, I.H.; Xie, B.; Daley, G.Q.; Church, G.M. Targeted and genome-scale strategies reveal gene-body methylation signatures in human cells. Nat. Biotechnol. 2009, 27, 361–368. [Google Scholar] [CrossRef] [PubMed] [Green Version]
  59. Maunakea, A.K.; Nagarajan, R.P.; Bilenky, M.; Ballinger, T.J.; D’Souza, C.; Fouse, S.D.; Johnson, B.E.; Hong, C.; Nielsen, C.; Zhao, Y.; et al. Conserved role of intragenic DNA methylation in regulating alternative promoters. Nature 2010, 466, 253–257. [Google Scholar] [CrossRef] [PubMed]
  60. Suzuki, M.M.; Bird, A. DNA methylation landscapes: Provocative insights from epigenomics. Nat. Rev. Genet. 2008, 9, 465–476. [Google Scholar] [CrossRef] [PubMed]
  61. Godderis, L.; Schouteden, C.; Tabish, A.; Poels, K.; Hoet, P.; Baccarelli, A.A.; Van Landuyt, K. Global Methylation and Hydroxymethylation in DNA from Blood and Saliva in Healthy Volunteers. BioMed Res. Int. 2015, 2015, 845041. [Google Scholar] [CrossRef] [PubMed]
  62. Wu, H.C.; Wang, Q.; Chung, W.K.; Andrulis, I.L.; Daly, M.B.; John, E.M.; Keegan, T.H.; Knight, J.; Bradbury, A.R.; Kappil, M.A.; et al. Correlation of DNA methylation levels in blood and saliva DNA in young girls of the LEGACY Girls study. Epigenetics 2014, 9, 929–933. [Google Scholar] [CrossRef] [PubMed]
  63. Grover, D.; Mukerji, M.; Bhatnagar, P.; Kannan, K.; Brahmachari, S.K. Alu repeat analysis in the complete human genome: Trends and variations with respect to genomic composition. Bioinformatics 2004, 20, 813–817. [Google Scholar] [CrossRef] [PubMed]
  64. Buj, R.; Mallona, I.; Diez-Villanueva, A.; Barrera, V.; Mauricio, D.; Puig-Domingo, M.; Reverter, J.L.; Matias-Guiu, X.; Azuara, D.; Ramirez, J.L.; et al. Quantification of unmethylated Alu (QUAlu): A tool to assess global hypomethylation in routine clinical samples. Oncotarget 2016, 7, 10536–10546. [Google Scholar] [CrossRef] [PubMed]
  65. Luo, Y.; Lu, X.; Xie, H. Dynamic Alu methylation during normal development, aging, and tumorigenesis. BioMed Res. Int. 2014, 2014, 784706. [Google Scholar] [CrossRef] [PubMed]
  66. Armstrong, D.A.; Lesseur, C.; Conradt, E.; Lester, B.M.; Marsit, C.J. Global and gene-specific DNA methylation across multiple tissues in early infancy: Implications for children’s health research. FASEB J. 2014, 28, 2088–2097. [Google Scholar] [CrossRef] [PubMed]
  67. D’Addario, C.; Dell’Osso, B.; Palazzo, M.C.; Benatti, B.; Lietti, L.; Cattaneo, E.; Galimberti, D.; Fenoglio, C.; Cortini, F.; Scarpini, E.; et al. Selective DNA methylation of BDNF promoter in bipolar disorder: Differences among patients with BDI and BDII. Neuropsychopharmacology 2012, 37, 1647–1655. [Google Scholar] [CrossRef] [PubMed]
  68. Sugawara, H.; Iwamoto, K.; Bundo, M.; Ueda, J.; Miyauchi, T.; Komori, A.; Kazuno, A.; Adati, N.; Kusumi, I.; Okazaki, Y.; et al. Hypermethylation of serotonin transporter gene in bipolar disorder detected by epigenome analysis of discordant monozygotic twins. Transl. Psychiatry 2011, 1, e24. [Google Scholar] [CrossRef] [PubMed]
  69. Starnawska, A.; Demontis, D.; Pen, A.; Hedemand, A.; Nielsen, A.L.; Staunstrup, N.H.; Grove, J.; Als, T.D.; Jarram, A.; O’Brien, N.L.; et al. CACNA1C hypermethylation is associated with bipolar disorder. Transl. Psychiatry 2016, 6, e831. [Google Scholar] [CrossRef] [PubMed]
  70. Carrard, A.; Salzmann, A.; Malafosse, A.; Karege, F. Increased DNA methylation status of the serotonin receptor 5HTR1A gene promoter in schizophrenia and bipolar disorder. J. Affect. Disord. 2011, 132, 450–453. [Google Scholar] [CrossRef] [PubMed]
  71. Kordi-Tamandani, D.M.; Sahranavard, R.; Torkamanzehi, A. DNA methylation and expression profiles of the brain-derived neurotrophic factor (BDNF) and dopamine transporter (DAT1) genes in patients with schizophrenia. Mol. Biol. Rep. 2012, 39, 10889–10893. [Google Scholar] [CrossRef] [PubMed]
  72. Melas, P.A.; Rogdaki, M.; Osby, U.; Schalling, M.; Lavebratt, C.; Ekstrom, T.J. Epigenetic aberrations in leukocytes of patients with schizophrenia: Association of global DNA methylation with antipsychotic drug treatment and disease onset. FASEB J. 2012, 26, 2712–2718. [Google Scholar] [CrossRef] [PubMed]
  73. Nohesara, S.; Ghadirivasfi, M.; Mostafavi, S.; Eskandari, M.R.; Ahmadkhaniha, H.; Thiagalingam, S.; Abdolmaleky, H.M. DNA hypomethylation of MB-COMT promoter in the DNA derived from saliva in schizophrenia and bipolar disorder. J. Psychiatr. Res. 2011, 45, 1432–1438. [Google Scholar] [CrossRef] [PubMed]
  74. Ikegame, T.; Bundo, M.; Sunaga, F.; Asai, T.; Nishimura, F.; Yoshikawa, A.; Kawamura, Y.; Hibino, H.; Tochigi, M.; Kakiuchi, C.; et al. DNA methylation analysis of BDNF gene promoters in peripheral blood cells of schizophrenia patients. Neurosci. Res. 2013, 77, 208–214. [Google Scholar] [CrossRef] [PubMed]
  75. Petronis, A.; Gottesman, II; Kan, P.; Kennedy, J.L.; Basile, V.S.; Paterson, A.D.; Popendikyte, V. Monozygotic twins exhibit numerous epigenetic differences: Clues to twin discordance? Schizophr. Bull. 2003, 29, 169–178. [Google Scholar] [CrossRef] [PubMed]
  76. Lokk, K.; Modhukur, V.; Rajashekar, B.; Martens, K.; Magi, R.; Kolde, R.; Koltsina, M.; Nilsson, T.K.; Vilo, J.; Salumets, A.; et al. DNA methylome profiling of human tissues identifies global and tissue-specific methylation patterns. Genome Biol. 2014, 15, r54. [Google Scholar] [CrossRef] [PubMed]
  77. Jjingo, D.; Conley, A.B.; Yi, S.V.; Lunyak, V.V.; Jordan, I.K. On the presence and role of human gene-body DNA methylation. Oncotarget 2012, 3, 462–474. [Google Scholar] [CrossRef] [PubMed]
  78. Kulis, M.; Heath, S.; Bibikova, M.; Queiros, A.C.; Navarro, A.; Clot, G.; Martinez-Trillos, A.; Castellano, G.; Brun-Heath, I.; Pinyol, M.; et al. Epigenomic analysis detects widespread gene-body DNA hypomethylation in chronic lymphocytic leukemia. Nat. Genet. 2012, 44, 1236–1242. [Google Scholar] [CrossRef] [PubMed]
  79. Rakyan, V.K.; Down, T.A.; Thorne, N.P.; Flicek, P.; Kulesha, E.; Graf, S.; Tomazou, E.M.; Backdahl, L.; Johnson, N.; Herberth, M.; et al. An integrated resource for genome-wide identification and analysis of human tissue-specific differentially methylated regions (tDMRs). Genome Res. 2008, 18, 1518–1529. [Google Scholar] [CrossRef] [PubMed]
  80. Johannes, F.; Colot, V.; Jansen, R.C. Epigenome dynamics: A quantitative genetics perspective. Nat. Rev. Genet. 2008, 9, 883–890. [Google Scholar] [CrossRef] [PubMed]
  81. Ozanne, S.E.; Constancia, M. Mechanisms of disease: The developmental origins of disease and the role of the epigenotype. Nat. Clin. Pract. Endocrinol. Metab. 2007, 3, 539–546. [Google Scholar] [CrossRef] [PubMed]
  82. Reinius, L.E.; Acevedo, N.; Joerink, M.; Pershagen, G.; Dahlen, S.E.; Greco, D.; Soderhall, C.; Scheynius, A.; Kere, J. Differential DNA methylation in purified human blood cells: Implications for cell lineage and studies on disease susceptibility. PLoS ONE 2012, 7, e41361. [Google Scholar] [CrossRef] [PubMed]
  83. Horvath, S. DNA methylation age of human tissues and cell types. Genome Biol. 2013, 14, R115. [Google Scholar] [CrossRef] [PubMed]
  84. Horvath, S.; Zhang, Y.; Langfelder, P.; Kahn, R.S.; Boks, M.P.; van Eijk, K.; van den Berg, L.H.; Ophoff, R.A. Aging effects on DNA methylation modules in human brain and blood tissue. Genome Biol. 2012, 13, R97. [Google Scholar] [CrossRef] [PubMed]
  85. Liu, J.; Morgan, M.; Hutchison, K.; Calhoun, V.D. A study of the influence of sex on genome wide methylation. PLoS ONE 2010, 5, e10028. [Google Scholar] [CrossRef] [PubMed]
  86. Jette, L.; Bissoon-Haqqani, S.; Le Francois, B.; Maroun, J.A.; Birnboim, H.C. Resistance of colorectal cancer cells to 5-FUdR and 5-FU caused by Mycoplasma infection. Anticancer Res. 2008, 28, 2175–2180. [Google Scholar] [PubMed]
  87. Speyer, H.; Norgaard, H.C.; Hjorthoj, C.; Madsen, T.A.; Drivsholm, S.; Pisinger, C.; Gluud, C.; Mors, O.; Krogh, J.; Nordentoft, M. Protocol for CHANGE: A randomized clinical trial assessing lifestyle coaching plus care coordination versus care coordination alone versus treatment as usual to reduce risks of cardiovascular disease in adults with schizophrenia and abdominal obesity. BMC Psychiatry 2015, 15, 119. [Google Scholar] [CrossRef] [PubMed]
  88. Taiwo, O.; Wilson, G.A.; Morris, T.; Seisenberger, S.; Reik, W.; Pearce, D.; Beck, S.; Butcher, L.M. Methylome analysis using MeDIP-seq with low DNA concentrations. Nat. Protoc. 2012, 7, 617–636. [Google Scholar] [CrossRef] [PubMed]
  89. Afgan, E.; Baker, D.; van den Beek, M.; Blankenberg, D.; Bouvier, D.; Cech, M.; Chilton, J.; Clements, D.; Coraor, N.; Eberhard, C.; et al. The Galaxy platform for accessible, reproducible and collaborative biomedical analyses: 2016 update. Nucleic Acids Res. 2016, 44, W3–W10. [Google Scholar] [CrossRef] [PubMed]
  90. Li, H.; Durbin, R. Fast and accurate short read alignment with Burrows-Wheeler transform. Bioinformatics 2009, 25, 1754–1760. [Google Scholar] [CrossRef] [PubMed]
  91. Lienhard, M.; Grimm, C.; Morkel, M.; Herwig, R.; Chavez, L. MEDIPS: Genome-wide differential coverage analysis of sequencing data derived from DNA enrichment experiments. Bioinformatics 2014, 30, 284–286. [Google Scholar] [CrossRef] [PubMed]
  92. Dennis, G., Jr.; Sherman, B.T.; Hosack, D.A.; Yang, J.; Gao, W.; Lane, H.C.; Lempicki, R.A. DAVID: Database for Annotation, Visualization, and Integrated Discovery. Genome Biol. 2003, 4, P3. [Google Scholar] [CrossRef] [PubMed]
  93. Huang, D.W.; Sherman, B.T.; Tan, Q.; Kir, J.; Liu, D.; Bryant, D.; Guo, Y.; Stephens, R.; Baseler, M.W.; Lane, H.C.; et al. DAVID Bioinformatics Resources: Expanded annotation database and novel algorithms to better extract biology from large gene lists. Nucleic Acids Res. 2007, 35, W169–W175. [Google Scholar] [CrossRef] [PubMed]
  94. Ashburner, M.; Ball, C.A.; Blake, J.A.; Botstein, D.; Butler, H.; Cherry, J.M.; Davis, A.P.; Dolinski, K.; Dwight, S.S.; Eppig, J.T.; et al. Gene ontology: Tool for the unification of biology. The Gene Ontology Consortium. Nat. Genet. 2000, 25, 25–29. [Google Scholar] [CrossRef] [PubMed]
  95. Gene Ontology Consortium. Gene Ontology Consortium: Going forward. Nucleic Acids Res. 2015, 43, D1049–D1056. [Google Scholar]
Figure 1. Pair-wise Pearson correlation analyses of saliva and blood samples MeDIP-seq methylomes. (A) The correlation value (r) for each pair-wise correlation is shown. Coefficients typed in green (for blood) and blue (for saliva) mark within tissue comparisons, whereas coefficients in orange denote between-tissue comparisons; and (B) unsupervised hierarchical clustering of the analysed six blood and saliva samples based on correlation coefficients.
Epigenomes 01 00014 g001
Figure 2. Comparable variability and distribution of reads in blood and saliva samples. (A) BoxWhisker plots of filtered sequencing reads in 300 bp genomic bins displaying the median, 25th, and 75th percentile, and whiskers (mediumplus/minus interquartile range ×2); (B) cumulative distribution plot showing the accumulation of sequencing reads in 300 bp genomic bins from the lowest covered percentile of the genome to the highest; and (C) Principal Component Analysis (PCA) plot of PC1 and PC2 using all quality filtered and mapped sequencing reads.
Epigenomes 01 00014 g002
Figure 3. Canonical methylation patterns at genomic features. Read count in 300 bp sliding genomic windows with 150 bp overlap across genetic regions corresponding to (A) CGI (CpG Island) ±4 kb flanking regions; (B) the first exon of RefSeq genes ±2 kb flanking regions; and (C) Alu repeat elements ±2 kb flanking regions. TSS: transcription start sites.
Epigenomes 01 00014 g003
Figure 4. Equal coverage and read spread at specific genomic features for saliva and blood MeDIP-seq results. (A) Box whisker plots of filtered reads overlapping six different genomic features in 300 bp genomic bins. Displayed are the median, 25th and 75th percentile, whiskers (median plus/minus interquartile range ×2); and (B) normalized and summarized line graphs of filtered reads matching the six specified genomic features for all saliva and blood samples.
Epigenomes 01 00014 g004
Figure 5. Equal coverage and spread at CGIs and shores for saliva and blood MeDIP-seq results. (A) Box whisker plots of filtered reads overlapping intergenic or intragenic CGIs or shores (±2 kb from CGI) in 300 bp genomic bins. Displayed are the median, 25th, and 75th percentile, whiskers (median plus/minus interquartile range ×2); and (B) normalized (to the genomic window with highest magnitude of difference) and summarized (mean value with 95% confidence interval) line graphs of filtered reads for all saliva and blood samples overlapping intergenic or intragenic CGIs or shores.
Epigenomes 01 00014 g005
Figure 6. Tissue stratification at downstream intragenic CGI shores. (A) MA plot depicting the average read count (x-axis) in the complete dataset restricted to downstream intragenic CGI shores against fold difference (y-axis) between the two tissues; (B) MA plot from (A) overlayed with hypermethylated regions in blood (red dots) and saliva (green dots) defined as 300 bp regions displaying within-tissue PCCs > 0.95 and above mean coverage; (C) MA plot from (A) overlayed with liver (green dots), squamous epithelial (red dots), neutrophil (purple dots), and monocyte (orange dots)-expressed genes.
Epigenomes 01 00014 g006
Figure 7. Hierarchical clustering based on 50 TS-DMRs or 43 individual specific DMRs. GEO available datasets as well as the saliva and blood datasets were hierarchical clustered based correlation coefficients restricted to (A) 50 TS-DMRs; and (B) 43 individual differentiating DMRs.
Epigenomes 01 00014 g007
Table 1. GO enrichment analysis. PANTHER overrepresentation test using PANTHER pathways and a significance threshold of p < 0.05 (Bonferroni corrected). Of 577 genes featuring differently-covered downstream intragenic CGI shores, 549 genes were uniquely mapped to the database. The pathways of B-cell and T-cell activation were enriched above four-fold and passed correction for multiple testing.
GO Enrichment AnalysisNumber of Genes in ReferenceNumber of Genes in Input ListFold EnrichmentBonferroni Corrected p-Value
B-cell activation (P00010)7294.543.4 × 10−2
NFATC1, ITPR2, AC037459.4, MAPK8, CALM1 (+isoforms), NFATC2, MAP2K2
T-cell activation (P00053)96114.161.5 × 10−2
NFATC1, AC037459.4, MAPK8, CALM1 (+isoforms), NFATC2, MAP2K2, PIK3R1, PLCG1, CD247

