Simple Summary
Argynnis hyperbius (Lepidoptera: Nymphalidae) is widely distributed across China, utilizing Viola philippica (Malpighiales: Violaceae) as its primary host plant. Recent intensification of climate change and escalating environmental pressures have severely threatened species diversity. As ecologically significant indicator species, butterflies exhibit substantial variation in gene expression patterns across geographical populations and under divergent environmental conditions. Consequently, identifying appropriate reference genes is critical for accurate assessment of their physiological status and adaptive responses. This study systematically evaluated the expression stability of 10 candidate reference genes under diverse environmental stressors. Results demonstrate that AK and EF1α serve as optimal reference genes across developmental stages, ACT and RPL32 show maximal expression stability between adult sexes, while EF1α and RPL27 exhibit consistent expression under varying temperature regimes. These findings establish reliable reference genes for future gene expression studies in A. hyperbius.
Abstract
Argynnis hyperbius (Lepidoptera: Nymphalidae), as an important environmental indicator species, has shown a gradual decline in its species richness amid intensifying climate change and increasing environmental pressures. Screening for optimal reference genes is fundamental to studying their physiological and adaptive changes using RT-qPCR technology. In this study, 10 commonly used reference genes (ACT, α-TUB, AK, GAPDH, EF1α, BTF3, RPS3, RPL10, RPL32, and RPL27) were selected, and their expression stability under different developmental stages, genders, and temperature treatments was evaluated using the RefFinder website. The results indicated that selecting a pair of reference genes could achieve the most reliable normalization analysis under all experimental conditions. Specifically, AK and EF1α were the most stably expressed reference genes across different developmental stages; ACT and RPL32 showed the most stable expression in different adult sexes; and EF1α and RPL27 exhibited stable expression under different temperature treatments. Additionally, this study used EF1α and RPL32, the most stable reference genes from all results, to normalize and analyze the relative transcription levels of HSP90 under different temperatures, revealing significant differences between the 4 °C group and both the 26 °C and 37 °C groups. The findings of this study will significantly improve the reliability of RT-qPCR detection and lay a foundation for in-depth research on the gene expression, physiology, and biochemical mechanisms of A. hyperbius.
1. Introduction
Real-time quantitative reverse transcription polymerase chain reaction (qRT-PCR) is widely applied for scientific and accurate quantitative analysis of gene expression, mRNA quantification, and related applications [1,2,3]. When utilizing qRT-PCR to measure gene expression levels in diverse organisms, it is essential to normalize the expression of multiple target genes against a stably expressed internal reference gene. This normalization process enhances the accuracy of quantitative results [4,5,6,7]. While reference genes are generally stable, no single gene can be universally applied to all scenarios [8,9,10,11]. The unstable expression of endogenous reference genes may result in erroneous gene expression data [12]. Therefore, it is essential to conduct validation under specific experimental conditions to identify the most suitable reference gene [9,13,14,15,16].
Argynnis hyperbius (Lepidoptera: Nymphalidae) is a complete metamorphosis and oligophagous butterfly species exhibiting distinct sexual dimorphism [17]. As an important pollinator of plants [18], butterflies play a dual ecological role in both maintaining food web dynamics and serving as a sensitive bioindicator for ecosystem health and stability [19,20,21]. Due to their high sensitivity to habitat alterations, butterflies have been widely recognized as a model organism for biodiversity studies [20,21], making significant contributions to ecosystem stability and diversity conservation [22]. Recent decades have witnessed a dramatic population decline of butterfly species worldwide. Gregory et al. calculated the average species index and designated specific indicators for each species in their analysis [23]. In response to this concerning trend, the European Environment Agency (2007) has advocated for establishing European butterfly indicators as a crucial biodiversity monitoring tool [24]. Currently, research on butterflies has mostly focused on the field of mitochondrial genomes [25,26], while the screening and application of reference genes have been more commonly seen in studies on moths [27]. In view of this, it has become particularly urgent to carry out the screening of reference genes in A. hyperbiu.
In this study, to determine suitable reference genes, ten commonly used candidates were selected based on the different developmental stages, temperature treatments, and sexes of A. hyperbius. Their stability was evaluated. The genes assessed were Actin (ACT), α-tubulin (α-TUB), basic transcription factor 3 (BTF3), arginine kinase (AK), glyceraldehyde-3-phosphate dehydrogenase (GAPDH), elongation factor 1α (EF1α), and the ribosomal protein genes (RPS3, RPL10, RPL32, and RPL27), which are frequently employed as reference genes for stability assessment [10,28,29]. Selecting the two to three most stable reference genes for normalization will facilitate future in-depth studies of A. hyperbius physiological processes, developmental mechanisms, and gene expression related to adaptation to environmental changes. Furthermore, the expression of HSP90 in larvae under different temperature treatments was utilized to evaluate the normalization results. These findings provide a foundation for functional gene studies in A. hyperbius.
2. Materials and Methods
2.1. Insect Specimen Collection and Rearing
A. hyperbius specimens used in this study were collected in Pingdingshan City, Henan Province, China, in May 2024. The source population was initially collected within a 3 × 3 × 3 m net cage and reared under natural conditions. The larvae fed on Viola philippica (Malpighiales: Violaceae) and the adults sucked nectar.
2.2. Developmental Stage-Specific Sample Preparation
Larvae were fed on Viola philippica, while adults were provided with nectar sources. During rearing, specimens were sampled at all developmental stages: eggs, larvae (instars 1–6), pupae, and adults (both sexes). Twenty eggs, five larvae per instar group (instars 1–3), three larvae per instar group (instars 4–6), three pupae, three females, and three males were collected. All samples were placed in 2 mL centrifuge tubes and immediately stored at −80 °C.
2.3. Sample Collection Under Differential Temperature Regimes
Fifth and sixth instar larvae were transferred to 4 °C, 26 °C, and 37 °C (three larvae per temperature) for 6 h per treatment, totaling six experimental groups. Post-treatment, larvae were stored at −80 °C for subsequent RNA extraction.
2.4. Selection and Validation of Candidate Housekeeping Genes (HKGs)
Ten housekeeping genes (HKGs) were selected: Actin (ACT), α-tubulin (α-TUB), glyceraldehyde-3-phosphate dehydrogenase (GAPDH), elongation factor 1α (EF1α), ribosomal proteins RPS3, RPL10, RPL27, and RPL32, basic transcription factor 3 (BTF3), and arginine kinase (AK). Heat shock protein 90 (HSP90) was additionally selected. GenBank accession numbers are provided in Table 1.

Table 1.
A list of primers used for RT-PCR of the genes.
Reference genes were amplified using primers listed in Table 1 via reverse transcription PCR. Amplification products were separated by 1.0% agarose gel electrophoresis and purified using a DNA purification kit. Purified DNA fragments were ligated into vectors, cloned, and bidirectionally sequenced. Obtained sequences were submitted to GenBank (accession numbers in Table 1).
2.5. RNA Extraction and cDNA Synthesis
Total RNA was isolated using TRIzol reagent (Invitrogen, Carlsbad, CA, USA) following the manufacturer’s protocol. RNA purity was assessed by measuring A260/A280 and A260/A230 ratios using a UV-1800 spectrophotometer (Shimadzu, Kyoto, Japan), with integrity immediately verified through 1.0% agarose gel electrophoresis. Reverse transcription was performed using gDNA wiper Mix enzyme with RNA templates to synthesize cDNA according to the manufacturer’s specifications. cDNA products were stored at −20 °C for subsequent use within 24 h.
2.6. Quantitative Real-Time PCR (qRT-PCR) Analysis
qRT-PCR primers (Table 2) were designed with Primer-BLAST software, and amplicons were validated by Sanger sequencing. Reactions were conducted on a CFX96 Real-Time System (Bio-Rad Laboratories, Hercules, CA, USA) using ChamQ Universal SYBR qPCR Master Mix (Vazyme Biotech Co., Ltd, Wuhan, China.). The 20 μL reACTion mixture contained: 10 μL 2× ChamQ Universal SYBR qPCR Master Mix, 1 μL cDNA template, 0.4 μL forward primer (10 μM), 0.4 μL reverse primer (10 μM), and 8.2 μL ddH2O. Each assay included reverse transcription-negative controls (without reverse transcriptase) and non-template controls. The thermal profile comprised: initial denaturation at 95 °C for 5 min; 35 cycles of 95 °C for 15 s, 50 °C for 15 s, and 72 °C for 2 min; followed by melting curve analysis (72 °C for 5 min, 12 °C for 2 min cycling). Reaction specificity was confirmed through melting curve analysis and gel electrophoresis using QuantStudio™ Design and Analysis software (v1.5.0). Amplification efficiency was calculated via 3-fold serial dilutions, with all reactions performed in triplicate.

Table 2.
Primer sequences for 10 candidate reference genes in qRT-PCR analysis.
2.7. Validation and Stability Assessment of Reference Genes
HSP90 expression served to evaluate reference gene stability, amplified using primers:
Forward: 5′-TCTCACTGACCCGTCAAAGC-3′
Reverse: 5′-GTAAGGGTGCCTTCGCTCTT-3′
Relative expression levels across temperatures were calculated in triplicate using the 2−ΔΔCT method. Statistical analysis employed SPSS 26.0 (Chicago, IL, USA), with mean values (±SE) compared by the analysis of variance with Tukey–Kramer post hoc testing.
2.8. Data Processing and Statistical Analysis
Raw Ct values were obtained from QuantStudio 3™ Design and Analysis software (v1.5.0). Reference gene stability was evaluated using geNorm, NormFinder, and BestKeeper algorithms according to their respective manuals. Comprehensive rankings under each condition were generated by RefFinder.
3. Results
3.1. Screening and Characterization of Candidate HKGs
Ten candidate housekeeping genes (HKGs) were selected. The obtained GenBank accession numbers are provided in Table 1. All primer pairs exhibited amplification efficiencies between 92.75% and 105.94%, with slopes less than −3.0 and regression coefficients (R2) ranging from 0.993 to 0.999 (Table 2). These data confirm that primer performance meets standard qRT-PCR requirements [30].
3.2. Differential Expression Profiles of HKGs Across Experimental Conditions
Agarose gel electrophoresis of qRT-PCR products confirmed single amplicons of expected sizes for all ten genes, demonstrating their expression throughout the whole development, across temperature treatments, and in both sexes.
Expression stability was evaluated using threshold cycle (CT) values (Figure 1. During Developmental stages, RPS3 and RPL10 showed minimal variation, while BTF3 and GAPDH exhibited substantial fluctuations (Figure 1A). Between adult sexes, RPS3 and EF1α demonstrated low variation, whereas other genes displayed significant variability (Figure 1B). Under different temperature treatments, AK and GAPDH showed high variation, while the remaining eight genes maintained stable expression (Figure 1C). Collectively, RPS3, RPL10, RPL32, and EF1α exhibited minimal expression variation across conditions, whereas the other six HKGs showed substantial fluctuations.
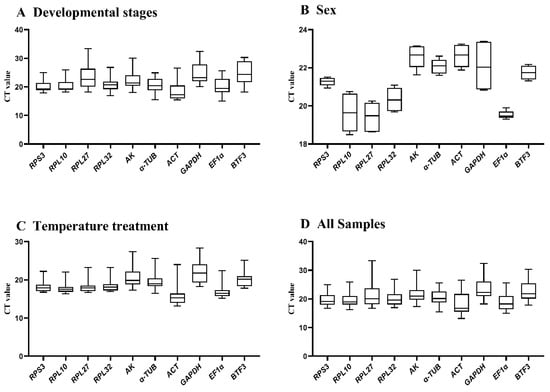
Figure 1.
Expression stability of ten candidate reference genes in A. hyperbius evaluated by CT values. Boxplots display distributions across four experimental conditions: (A): developmental stages, (B): sexes, (C): temperature treatments, and (D): all the samples that have aggregated the first three groups of values together. Boxes represent interquartile ranges (25th–75th percentiles), with horizontal lines indicating medians. Data derived from three biological replicates. Abbreviations: RPL10 (ribosomal protein L10), RPL27 (ribosomal protein L27), RPL32 (ribosomal protein L32), RPS3 (ribosomal protein S3), AK (arginine kinase), α-TUB (α-tubulin), ACT (Actin), GAPDH (glyceraldehyde-3-phosphate dehydrogenase), EF1α (elongation factor 1α), BTF3 (basic transcription factor 3). Abbreviations remain consistent in Figure 2, Figure 3, Figure 4 and Figure 5.
3.3. Developmental Stage-Specific Stability of HKGs Expression
The geNorm algorithm evaluated candidate reference genes based on expression stability (M-value) and pairwise variation (Vn/Vn+1). EF1α and α-TUB demonstrated optimal stability during development (M-values: 0.5–1.5). RPL27 and BTF3 showed M-values > 1.5, while the remaining six genes exhibited intermediate stability (M-values ≈ 1) with comparable stability values (Figure 2A, Table 3). Pairwise variation analysis indicated V2/V3 > 0.15, supporting the requirement for three reference genes during developmental studies (Figure 2B).
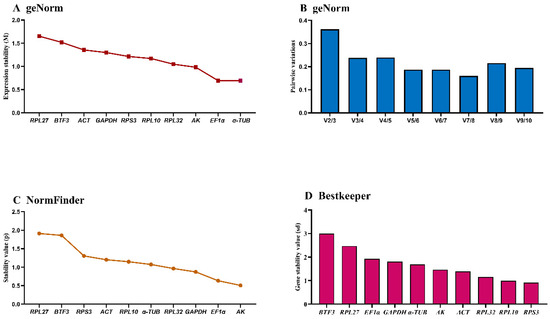
Figure 2.
Expression stability of ten housekeeping genes during A. hyperbius development. Samples represent early/late larvae and pupae (days 1–2 per stage). The expression stability was ranked using three methods: (A) and (B): geNorm, (C): NormFinder, and (D): BestKeeper.

Table 3.
Expression stability of the candidate reference genes under different experimental conditions.
NormFinder identified α-TUB, EF1α, GAPDH, and p as the most stable genes (stability values < 1.0), while RPL27 and BTF3 were the least stable (stability values ≈ 2.0) based on intra- and inter-group variation (Figure 2C, Table 3).
BestKeeper ranked stability as: RPS3 > RPL10 > RPL32 > ACT > AK > α-TUB > GAPDH > EF1α > RPL27 > BTF3. Only RPS3 and RPL10 showed standard deviation (SD) < 1; all others exceeded this threshold (Figure 2D, Table 3), indicating limited suitability as single reference genes. RefFinder integrated these analyses to generate a comprehensive stability ranking: AK > EF1α > α-TUB > RPL32 > RPL10 > RPS3 > GAPDH > ACT > BTF3 > RPL27 (Figure 3A). Thus, AK and EF1α constitute the optimal reference gene combination for developmental stage expression studies.
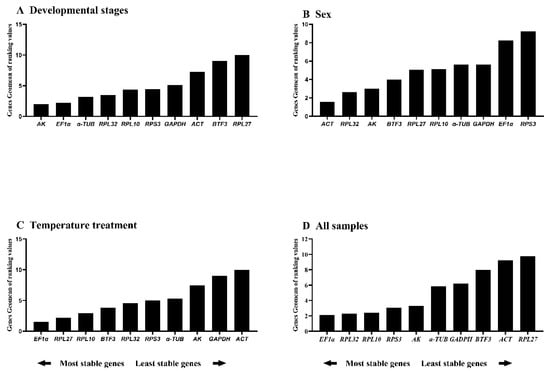
Figure 3.
Comprehensive stability ranking of house-keeping genes across A. hyperbius experimental conditions. Figure displays distributions across four experimental conditions: (A): developmental stages, (B): sexes, (C): temperature treatments, and (D): all the samples that have aggregated the first three groups of values together. Rankings determined by RefFinder using the geomean method, where lower values indicate greater stability.
3.4. Sex-Dimorphic Expression Stability in Adult HKGs
The geNorm analysis revealed comparable stability across all ten reference genes (M-values < 0.6), with the stability ranking: ACT = AK > RPL32 > BTF3 > α-TUB > RPL27 > RPL10 > EF1α > RPS3 > GAPDH (Figure 4A, Table 3). Pairwise variation (V2/V3-V9/V10 < 0.15) indicated all genes were suitable for expression normalization in both sexes (Figure 4B).
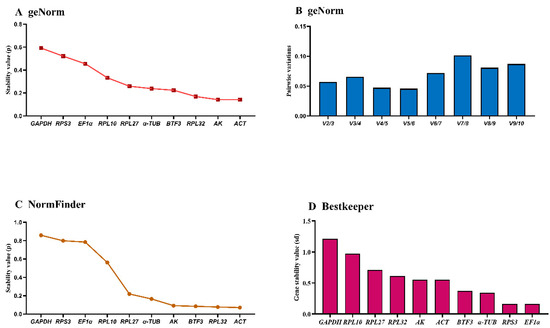
Figure 4.
Expression stability of ten house-keeping genes in A. hyperbius adults. The expression stability was ranked using three methods: (A) and (B): geNorm, (C): NormFinder, and (D): BestKeeper.
NormFinder ranked stability as: ACT > RPL32 > BTF3 > AK > α-TUB > RPL27 > RPL10 > EF1α > RPS3 > GAPDH, with corresponding stability values: 0.859, 0.799, 0.785, 0.562, 0.219, 0.165, 0.092, 0.085, and 0.077. Genes with stability values < 0.4 (RPL10, EF1α, RPS3, GAPDH) demonstrated similar performance (Figure 4C, Table 3).
BestKeeper identified EF1α and RPS3 as the most stable (SD = 0.16). GAPDH (SD > 1.0) showed low stability, while seven genes maintained SD < 1.0 (Figure 4D, Table 3).
RefFinder integration yielded the comprehensive ranking: ACT > RPL32 > AK > BTF3 > RPL27 > RPL10 > α-TUB > GAPDH > EF1α > RPS3 (Figure 3B). Thus, ACT and RPL32 are recommended as the optimal reference gene pair for expression studies in adult males and females.
3.5. Thermotolerance-Associated Stability of HKGs Under Temperatures Treatments
The geNorm analysis ranked gene stability as: RPL27 > EF1α > RPL10 > RPL32 > RPS3 > BTF3 > α-TUB > AK > GAPDH > ACT (Figure 5A, Table 3). ACT and GAPDH exhibited M-values > 1.0, while RPL27 and EF1α showed optimal stability (M-values ≈ 0.5). The remaining six genes demonstrated intermediate stability (M-values = 0.5–1.0). Pairwise variation (V3/V4 < 0.15) indicated three reference genes are required for temperature treatments (Figure 5B).
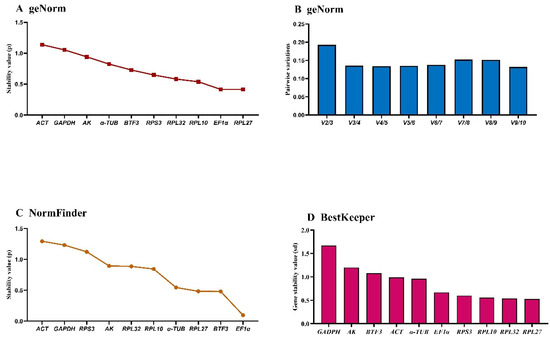
Figure 5.
Expression stability of ten house-keeping genes in A. hyperbius under temperature treatments. Fourth- and fifth-instar larvae exposed to 4 °C, 26 °C, and 37 °C were analyzed. The expression stability was ranked using three methods: (A) and (B): geNorm, (C): NormFinder, and (D): BestKeeper.
The NormFinder identified EF1α > BTF3 > RPL27 > α-TUB > RPL10 > RPL32 > AK > RPS3 > GAPDH > ACT as the stability ranking. EF1α, BTF3, RPL27, and α-TUB showed the lowest stability values, indicating comparable performance (Figure 5C).
BestKeeper analysis yielded: RPL27 > RPL32 > RPL10 > RPS3 > EF1α > α-TUB > ACT > BTF3 > AK > GAPDH (Figure 5D, Table 3). GAPDH, AK, and BTF3 (SD >1) demonstrated low stability, while the remaining seven genes (SD < 1) showed consistent performance. These genes exhibit stable expression and are validated as reference genes for qRT-PCR normalization when analyzing target gene expression levels.
RefFinder analysis revealed distinct stability rankings under specific versus combined experimental conditions. Under standardized conditions, the stability hierarchy was: EF1α > RPL27 > RPL10 > BTF3 > RPL32 > RPS3 > α-TUB > AK > GAPDH > ACT (Figure 3C). However, when integrating data across three experimental conditions (developmental stages, temperature treatments, and sex differences), the composite stability ranking was: EF1α > RPL32 > RPL10 > RPS3 > AK > α-TUB > GAPDH > BTF3 > ACT > RPL27 (Figure 3D). Notably, EF1α consistently ranked as the most stable reference gene in both analyses. Based on these comprehensive evaluations, we recommend the dual combination of EF1α and RPL10 as optimal reference genes for qRT-PCR normalization across diverse experimental conditions in this model system.
3.6. Experimental Validation of Optimal Reference Genes for qRT-PCR Normalization
To validate EF1α and RPL32, we analyzed HSP90 expression in fifth and sixth-instar larvae subjected to different temperature treatments following normalization. HSP90 exhibited the highest mRNA accumulation at 4 °C, intermediate at 26 °C, and lowest at 37 °C (Figure 6).
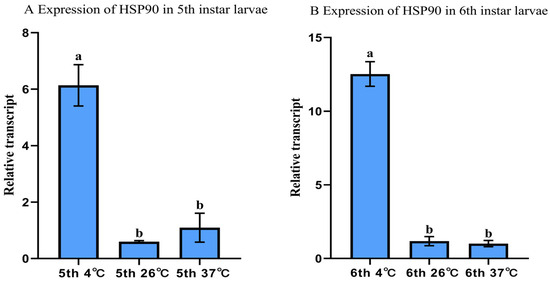
Figure 6.
Relative HSP90 expression in A. hyperbius larvae under temperature treatments ((A):fifth-instar; (B): sixth-instar). Fifth- and sixth-instar larvae exposed to 4 °C, 26 °C, and 37 °C were analyzed using qRT-PCR. Expression normalized to EF1α and RPL32 and calculated via the 2−ΔΔCT method, with 26 °C set as calibrator (value = 1). Columns represent means ± SE. Different letters denote significant differences (p < 0.05, ANOVA with Tukey–Kramer test).
4. Discussion
Quantitative real-time PCR (qRT-PCR) represents the most widely adopted method for gene expression analysis [31,32]. Reliable reference genes are essential for ensuring quantitative accuracy. This study evaluated the expression stability of 10 housekeeping genes (HKGs) in A. hyperbius. ACT, RPL, RPS, TUB, GAPDH, and EF1α rank among the most commonly used reference genes [9,33,34].
Three experimental conditions were examined: developmental stages, temperature treatments, and sex differentiation—a standard approach in reference gene research. Significant expression variations were observed across treatments. AK and EF1α demonstrated optimal stability across developmental stages; ACT and RPL32 exhibited maximal stability between sexes, while EF1α and RPL27 maintained stability under temperature treatments. Discrepancies in stability rankings generated by geNorm, NormFinder, and BestKeeper likely reflect methodological differences in their statistical approaches [6,9,35,36]. RefFinder mitigates such discrepancies by calculating geometric means of algorithm-derived rankings [37,38].
EF1α, encoding a conserved cytoplasmic protein essential for protein synthesis [39,40], is widely employed as an insect reference gene [32,41,42]. Our findings confirm its stability across developmental stages, temperature treatments, and sexes—consistent with studies in Drosophila (Diptera: Drosophilidae) [3], Cydia pomonella (Lepidoptera: Tortricidae) [43], and Phthorimaea operculella (Lepidoptera: Gelechiidae) [14].
Arginine kinase (AK) is a phosphotransferase enzyme critical for cellular energy metabolism [44,45]. The arginine kinase gene showed high stability throughout A. hyperbius development, indicating its reference gene potential. In Bombus terrestris (Hymenoptera: Apidae), gene expression stability was highest in both labial gland and fat body tissues [46]. In Dosophila uzukii (Diptera: Drosophilidae), AK showed high stability as a reference gene [47]. Despite limited prior use [48], it exhibited remarkable stability during non-developmental stages in our study.
Actin (ACT), a crucial cytoskeletal protein, plays fundamental roles in various cellular processes, including muscle contraction and intracellular motility. Our systematic evaluation reveals distinct expression patterns across insect taxa. For example, consistent stability was observed in Lepidoptera, demonstrating stage-independent expression in Phthorimaea operculella (Lepidoptera: Gelechiidae) [3], Plutella xylostella (Lepidoptera: Plutellidae), and Chilo suppressalis (Lepidoptera: Pyralidae) [48]. Similar stability was documented in Drosophila melanogaster (Diptera: Drosophilidae) [3] and Bemisia tabaci (Hemiptera: Aleyrodidae) [49]. In contrast, expression variability characterizes certain Coleoptera species (Chrysomelidae and Henosepilachna) [11,50]. Futhermore, this study provides the first evidence of ACT’s sexual dimorphism-independent stability in adult A. hyperbius, establishing its utility as a novel reference gene for developmental and sex differentiation studies.
Ribosomal proteins (RPs), the primary structural constituents of ribosomes, assemble with four ribosomal RNAs to form functional subunits essential for cellular protein biosynthesis [51,52,53,54]. Extensive evidence supports RP-coding genes as exceptionally stable reference markers for insect gene expression quantification. Our systematic analysis identified condition-specific stability patterns: RPL32 exhibited optimal stability across sex-dimorphic conditions, RPL27 demonstrated temperature-resistant expression, while RPL10 maintained constitutive stability under standard conditions. These findings correlate with established reports of: RPL32 stability in Phaedon brassicae (Coleoptera: Chrysomelidae) under thermo-chemical stress [50]; RPL19 invariance in Colaphellus bowringi (Coleoptera: Chrysomelidae) during photoperiodic adaptation [55]; Helicoverpa armigera (Lepidoptera: Noctuidae) RPS15 and RPL27 stability [56]; thermotolerant expression of RPL10, RPL27, and RPS3 in Mythimna loreyi (Lepidoptera: Noctuidae) [57].
To validate the reliability of EF1α and RPL32 as reference genes for qRT-PCR analysis in Nymphalis xanthomelas (Lepidoptera: Nymphalidae), we quantified HSP90 transcript levels in 5th- and 6th-instar larvae under thermal stress conditions. The results demonstrated significantly elevated HSP90 expression at 4 °C compared to 26 °C and 37 °C (Figure 6), consistent with the well-documented thermoregulatory function of heat shock proteins in stress response [58]. This pattern aligns with reported HSP90 upregulation under cold stress in Leptinotarsa decemlineata (Coleoptera: Chrysomelidae) [59], Nilaparvata lugens (Hemiptera: Delphacidae) [60], and Euzophera pyriella (Lepidoptera: Pyralidae) [61]. The temperature-responsive differential expression of HSP90 confirms the suitability of EF1α and RPL32 as endogenous controls for gene expression normalization in this species.
5. Conclusions
Among the ten candidate reference genes evaluated in Argynnis hyperbius, EF1α and RPL32 emerged as the most stable following comprehensive data integration. Specifically,
- I.
- AK and EF1α demonstrated optimal stability across developmental stages
- II.
- ACT and RPL32 exhibited maximal expression stability between sexes
- III.
- EF1α and RPL27 maintained consistent expression under temperature treatments
This work establishes the first standardized qRT-PCR normalization framework for A. hyperbius, providing a robust foundation for future functional genomics investigations.
Author Contributions
Conceptualization, H.-J.X. and C.-H.S.; Methodology, C.-Y.L., F.Y., L.-D.W. and H.-H.Z.; Formal analysis, H.-J.X. and C.-Y.L.; Investigation, H.-J.X., C.-Y.L., F.Y., L.-D.W. and H.-H.Z.; Writing—original draft, H.-J.X., C.-Y.L. and Q.Z.; Supervision, C.-H.S. and Q.Z.; Funding acquisition, Q.Z. All authors have read and agreed to the published version of the manuscript.
Funding
This research was funded by Science and Technology Planning Projects of the Tibet Autonomous Region grant number XZ202501JD0004.
Data Availability Statement
The original contributions presented in this study are included in the article. Further inquiries can be directed to the corresponding author(s).
Conflicts of Interest
The authors declare no conflict of interest.
References
- Jozefczuk, J.; Adjaye, J. Quantitative real-time PCR-based analysis of gene expression. Methods Enzymol. 2011, 500, 99–109. [Google Scholar]
- Derveaux, S.; Vandesompele, J.; Hellemans, J. How to do successful gene expression analysis using real-time PCR. Methods 2010, 50, 227–230. [Google Scholar] [CrossRef]
- Ponton, F.; Chapuis, M.P.; Pernice, M.; Sword, G.A.; Simpson, S.J. Evaluation of potential reference genes for reverse transcription-qPCR studies of physiological responses in Drosophila melanogaster. J. Insect Physiol. 2011, 57, 840–850. [Google Scholar] [CrossRef]
- Vandesompele, J.; De Paepe, K.; Pattyn, F.; Poppe, B.; Van Roy, N.; De Paepe, A.; Speleman, F. Accurate normalization of real-time quantitative RT-PCR data by geometric averaging of multiple internal control genes. Genome Biol. 2002, 3, Research0034. [Google Scholar] [CrossRef]
- Valasek, M.A.; Repa, J.J. The power of real-time PCR. Adv. Physiol. Educ. 2005, 29, 151–159. [Google Scholar] [CrossRef]
- Andersen, C.L.; Jensen, J.L.; Orntoft, T.F. Normalization of real-time quantitative reverse transcription-PCR data: A model-based variance estimation approach to identify genes suited for normalization, applied to bladder and colon cancer data sets. Cancer Res. 2004, 64, 5245–5250. [Google Scholar] [CrossRef]
- Walker, N.J. Tech. Sight. A technique whose time has come. Science 2002, 296, 557–559. [Google Scholar] [CrossRef] [PubMed]
- Nakamura, A.M.; Chahad-Ehlers, S.; Lima, A.L.; Taniguti, C.H.; Sobrinho, I.J.; Torres, F.R.; de Brito, R.A. Reference genes for accessing differential expression among developmental stages and analysis of differential expression of OBP genes in Anastrepha obliqua. Sci. Rep. 2016, 6, 17480. [Google Scholar] [CrossRef] [PubMed]
- Shakeel, M.; Rodriguez, A.; Tahir, U.B.; Jin, F. Gene expression studies of reference genes for quantitative real-time PCR: An overview in insects. Biotechnol. Lett. 2018, 40, 227–236. [Google Scholar] [CrossRef] [PubMed]
- Yang, X.; Pan, H.; Yuan, L.; Zhou, X. Reference gene selection for RT-qPCR analysis in Harmonia axyridis, a global invasive lady beetle. Sci. Rep. 2018, 8, 2689. [Google Scholar] [CrossRef]
- Lü, J.; Chen, S.; Guo, M.; Ye, C.; Qiu, B.; Wu, J.; Yang, C.; Pan, H. Selection and Validation of Reference Genes for RT-qPCR Analysis of the Ladybird Beetle Henosepilachna vigintioctomaculata. Front Physiol. 2018, 9, 1614. [Google Scholar] [CrossRef]
- Zhang, B.Z.; Liu, J.J.; Chen, X.L.; Yuan, G.H. Selection and evaluation of reference genes for gene expression using quantitative real-time PCR in Mythimna separata walker (Lepidoptera: Noctuidae). Entomol. Res. 2018, 48, 390–399. [Google Scholar] [CrossRef]
- Shen, C.H.; Tang, M.; Li, X.F.; Zhu, L.; Li, W.; Deng, P.; Zhai, Q.; Wu, G.; Yan, X.H. Evaluation of reference genes for quantitative expression analysis in Mylabris sibirica (Coleoptera, Meloidae). Front. Physiol. 2024, 15, 1345836. [Google Scholar] [CrossRef]
- Shen, C.H.; Peng, L.J.; Zhang, Y.X.; Zeng, H.R.; Yu, H.F.; Jin, L.; Li, G.Q. Reference genes for expression analyses by qRT-PCR in Phthorimaea operculella (Lepidoptera: Gelechiidae). Insects 2022, 13, 140. [Google Scholar] [CrossRef]
- Zhang, Y.X.; Tan, Q.; Shen, C.H.; Wu, J.J.; Wu, Y.K.; Li, W.Z.; Jin, L.; Li, G.Q. Reference gene selection for transcriptional profiling by RT-qPCR in the 28-spotted larger potato ladybird. J. Asia Pac. Entomol. 2022, 25, 101900. [Google Scholar] [CrossRef]
- Radonić, A.; Thulke, S.; Mackay, I.M.; Landt, O.; Siegert, W.; Nitsche, A. Guideline to reference gene selection for quantitative real-time PCR. Biochem. Biophys. Res. Commun. 2004, 313, 856–862. [Google Scholar] [CrossRef] [PubMed]
- Qin, X.M.; Guan, Q.X.; Zeng, D.L.; Qin, F.; Li, H.M. Complete mitochondrial genome of Kallima inachus (Lepidoptera: Nymphalidae: Nymphalinae): Comparison of K. inachus and Argynnis hyperbius. Mitochondrial DNA 2012, 23, 318–320. [Google Scholar] [CrossRef] [PubMed]
- Campbell, A.L.; Naik, R.R.; Sowards, L.; Stone, M.O. Biological infrared imaging and sensing. Micron 2002, 33, 211–225. [Google Scholar] [CrossRef]
- Mobeen, G.; Muhammad, F.M.; Mubashar, H.; Razia, I.; Misbah, Y. Diversity and distribution of butterflies in Pakistan: A review. J. Entomol. Zool. Stud. 2016, 4, 115–118. [Google Scholar]
- Winfree, R.; Bartomeus, I.; Cariveau, D.P. Native Pillinators in Anthropogenic Habitats. Annu. Rev. Ecol. Evol. Syst. 2011, 42, 1–22. [Google Scholar] [CrossRef]
- Macdonald, Z.G.; Nielsen, S.E.; Acorn, J.H. Negative relationships between species richness and evenness render common diversity indices inadequate for assessing long-term trends in butterfly diversity. Biodivers. Conserv. 2017, 26, 617–629. [Google Scholar] [CrossRef]
- Hambler, C.; Speight, M.R. Extinction rates and butterflies. Science 2004, 305, 1563–1564. [Google Scholar] [CrossRef]
- Gregory, R.D.; Van Strien, A.J.; Vorisek, P.; Gmelig Meyling, A.W.; Noble, D.G.; Foppen, R.P.; Gibbons, D.W. Developing indicators for European birds. Philos. Trans. R. Soc. B Biol. Sci. 2005, 360, 269–288. [Google Scholar] [CrossRef]
- European Environment Agency. Halting the Loss of Biodiversity by 2010: Proposal for a First Set of Indicators to Monitor Progress in Europe. In Office for Official Publications of the European Communities; European Environment Agency: Copenhagen, Denmark, 2007. [Google Scholar]
- Hassan, M.A.; Shen, R.; Zhang, L.; Sheikh, T.; Xing, J. Mitogenomic phylogeny of nymphalid subfamilies confirms the basal clade position of Danainae (Insecta: Lepidoptera: Nymphalidae). Ecol. Evol. 2023, 13, e10263. [Google Scholar] [CrossRef]
- Liu, N.; Wang, H.; Fang, L.J.; Zhang, Y.L. Mitogenome of the Doleschallia bisaltide and phylogenetic analysis of Nymphalinae (Lepidoptera, Nymphalidae). Diversity 2023, 15, 558. [Google Scholar] [CrossRef]
- Peng, R.; Zhai, Y.; Ding, H.; Di, T.; Zhang, T.; Li, B.; Shen, W.; Wei, Z. Analysis of reference gene expression for real time PCR based on relative quantitative and dual spike-in strategy in the silkworm Bombyx mori. Acta Biochim. Biophys Sin 2012, 44, 614–622. (In Chinese) [Google Scholar] [CrossRef] [PubMed]
- Wang, X.; Xiong, M.; Wang, J.; Lei, C.; Zhu, F. Reference gene stability of a synanthropic fly, Chrysomya megacephala. Parasites Vectors 2015, 8, 565. [Google Scholar] [CrossRef] [PubMed]
- Yu, Y.C.; Zhang, J.; Huang, C.; Hou, X.J.; Sun, X.L.; Xiao, B. Reference genes selection for quantitative gene expression studies in tea green leafhoppers, Empoasca onukii Matsuda. PLoS ONE 2018, 13, 18. [Google Scholar] [CrossRef]
- Bustin, S.A.; Benes, V.; Garson, J.A.; Hellemans, J.; Huggett, J.; Kubista, M.; Mueller, R.; Nolan, T.; Pfaffl, M.W.; Shipley, G.L.; et al. The MIQE guidelines: Minimum information for publication of quantitative real-time PCR experiments. Clin. Chem. 2009, 55, 611–622. [Google Scholar] [CrossRef] [PubMed]
- Szabo, A.; Perou, C.M.; Karaca, M.; Perreard, L.; Bernard, P.S. Statistical modeling for selecting housekeeper genes. Genome Biol. 2008, 9, 405. [Google Scholar] [CrossRef]
- Bustin, S.A. Quantification of mRNA using real-time reverse transcription PCR (RT-PCR): Trends and problems. J. Mol. Endocrinol. 2002, 29, 23–39. [Google Scholar] [CrossRef] [PubMed]
- Li, H.; Dai, C.; Zhang, C.; He, Y.; Ran, H.; Chen, S. Screening potential reference genes for quantitative realtime PCR analysis in the oriental armyworm, Mythimna separata. PLoS ONE 2018, 13, e0195096. [Google Scholar]
- Nagy, N.A.; Németh, Z.; Juhász, E.; Póliska, S.; Póliska, R.; Kosztolányi, A.; Barta, Z. Evaluation of potential reference genes for real-time qPCR analysis in a biparental beetle, Lethrus apterus (Coleoptera: Geotrupidae). PeerJ 2017, 5, e4047. [Google Scholar] [CrossRef]
- Pfaffl, M.W.; Tichopad, A.; Prgomet, C.; Neuvians, T.P. Determination of stable housekeeping genes, differentially regulated target genes and sample integrity: BestKeeper--Excel-based tool using pair-wise correlations. Biotechnol. Lett. 2004, 26, 509–515. [Google Scholar] [CrossRef]
- Silver, N.; Best, S.; Jiang, J.; Thein, S.L. Selection of housekeeping genes for gene expression studies in human reticulocytes using real-time PCR. BMC Mol. Biol. 2006, 7, 33. [Google Scholar] [CrossRef] [PubMed]
- Xie, F.; Xiao, P.; Chen, D.; Xu, L.; Zhang, B. miRDeepFinder: A miRNA analysis tool for deep sequencing of plant small RNAs. Plant Mol. Biol. 2012, 80, 75–84. [Google Scholar] [CrossRef]
- Xie, F.; Wang, J.; Zhang, B. RefFinder: A web-based tool for comprehensively analyzing and identifying reference genes. Funct. Integr. Genom. 2023, 23, 125. [Google Scholar] [CrossRef]
- Kristensen, R.; Torp, M.; Kosiak, B.; Holst-Jensen, A. Phylogeny and toxigenic potential is correlated in Fusarium species as revealed by partial translation elongation factor 1 alpha gene sequences. Mycol. Res. 2005, 109, 173–186. [Google Scholar] [CrossRef]
- Tatsuka, M.; Mitsui, H.; Wada, M.; Nagata, A.; Nojima, H.; Okayama, H. Elongation factor-1 alpha gene determines susceptibility to transformation. Nature 1992, 359, 333–336. [Google Scholar] [CrossRef]
- Wang, Z.; Meng, Q.; Zhu, X.; Sun, S.; Liu, A.; Gao, S.; Liu, A.; Gao, S.; Gou, Y. Identification and evaluation of reference genes for normalization of gene expression in developmental stages, sexes, and tissues of Diaphania caesalis (Lepidoptera, Pyralidae). J. Insect Sci. 2020, 20, 6. [Google Scholar] [CrossRef]
- Pan, H.; Yang, X.; Bidne, K.; Hellmich, R.L.; Siegfried, B.D.; Zhou, X. Selection of Reference Genes for RTqPCR Analysis in the Monarch Butterfly, Danaus plexippus (L.), a Migrating Bio-Indicator. PLoS ONE 2015, 10, e0129482. [Google Scholar]
- Wei, Z.H.; Liu, M.; Hu, C.; Yang, X.Q. Overexpression of glutathione s-transferase genes in field lambda-cyhalothrin-resistant population of Cydia pomonella: Reference gene selection and expression analysis. J. Agric. Food Chem. 2020, 68, 5825–5834. [Google Scholar] [CrossRef]
- Liu, F.; Wang, X.D.; Zhao, Y.Y.; Li, Y.J.; Sun, J. Silencing the Haak gene by transgenic plant-mediated RNAi impairs larval growth of Helicoverpa armigera. Int. J. Biol. Sci. 2015, 11, 67–74. [Google Scholar] [CrossRef] [PubMed]
- Zhu, J.Y.; Fang, Q.; Wang, L.; Hu, C.; Ye, G.Y. Proteomic analysis of the venom from the endoparasitoid wasp Pteromalus puparum (Hymenoptera: Pteromalidae). Arch. Insect Biochem. 2010, 75, 28–44. [Google Scholar] [CrossRef] [PubMed]
- Mamidala, P.; Rajarapu, S.P.; Jones, S.C.; Mittapalli, O. Identification and Validation of Reference Genes for Quantitative Real-Time Polymerase Chain Reaction in Cimex lectularius. J. Med. Entomol. 2011, 48, 947–951. [Google Scholar] [CrossRef]
- Zhai, Y.; Lin, Q.; Zhou, X.; Zhang, X.; Liu, T.; Yu, Y. Identification and validation of reference genes for quantitative real-time PCR in Drosophila suzukii (Diptera: Drosophilidae). PLoS ONE 2014, 9, e106800. [Google Scholar] [CrossRef]
- Xu, J.; Lu, M.X.; Cui, Y.D.; Du, Y.Z. Selection and evaluation of reference genes for expression analysis using qRT-PCR in Chilo suppressalis (Lepidoptera: Pyralidae). J. Econ. Entomol. 2017, 110, 683–691. [Google Scholar]
- Dai, T.M.; Lü, Z.C.; Liu, W.X.; Wan, F.H. Selection and validation of reference genes for qRT-PCR analysis during biological invasions: The thermal adaptability of Bemisia tabaci MED. PLoS ONE 2017, 12, e0173821. [Google Scholar] [CrossRef]
- Ma, L.; Jiang, T.; Liu, X.; Xiao, H.; Peng, Y.; Zhang, W. Evaluation of candidate reference genes for gene expression analysis in the brassica leaf beetle, Phaedon brassicae (Coleoptera: Chrysomelidae). PLoS ONE 2021, 16, e0251920. [Google Scholar] [CrossRef]
- Li, X.; Gong, P.; Wang, B.; Wang, C.; Li, M.; Zhang, Y.; Li, X.; Gao, H.; Ju, J.; Zhu, X. Selection and validation of experimental condition-specific reference genes for qRT-PCR in Metopolophium dirhodum (Walker) (Hemiptera: Aphididae). Sci. Rep. 2020, 10, 21951. [Google Scholar] [CrossRef]
- Landry-Voyer, A.M.; Mir Hassani, Z.; Avino, M.; Bachand, F. Ribosomal protein uS5 and friends: Protein-protein interactions involved in ribosome assembly and beyond. Biomolecules 2023, 13, 853. [Google Scholar] [CrossRef]
- Zhou, X.; Liao, W.; Liao, J.; Liao, P.; Lu, H. Ribosomal proteins: Functions beyond the ribosome. J. Mol. Cell Biol. 2015, 7, 92–104. [Google Scholar] [CrossRef]
- Shi, X.Q.; Guo, W.C.; Wan, P.J.; Zhou, L.T.; Ren, X.L.; Ahmat, T.; Fu, K.Y.; Li, G.Q. Validation of reference genes for expression analysis by quantitative real-time PCR in Leptinotarsa decemlineata (Say). BMC Res. Notes 2013, 6, 93. [Google Scholar] [CrossRef]
- Tan, Q.Q.; Zhu, L.; Li, Y.; Liu, W.; Ma, W.H.; Lei, C.L.; Wang, X.P. A de novo transcriptome and valid reference genes for quantitative Real-Time PCR in Colaphellus bowringi. PLoS ONE 2015, 10, e0118693. [Google Scholar] [CrossRef] [PubMed]
- Zhang, S.; An, S.; Li, Z.; Wu, F.; Yang, Q.; Liu, Y.; Cao, J.; Zhang, H.; Zhang, Q.; Liu, X. Identification and validation of reference genes for normalization of gene expression analysis using qRT-PCR in Helicoverpa armigera (Lepidoptera: Noctuidae). Gene 2015, 555, 393–402. [Google Scholar] [CrossRef]
- Wang, L.; Yang, C.; Liu, Q.; Zhang, X.; Mei, X.; Zhang, T.; Ning, J. Validation and evaluation of reference genes for quantitative real-time PCR analysis in Mythimna loreyi (Lepidoptera: Noctuidae). Insects 2024, 15, 185. [Google Scholar] [CrossRef]
- Waters, E.R. The evolution, function, structure, and expression of the plant shsps. J. Exp. Bot. 2013, 64, 391–403. [Google Scholar] [CrossRef]
- Zheng, H.X.; Gao, Y.L.; Zhang, F.M.; Yang, C.X.; Jiang, J.; Zhu, X.; Zhang, Y.H.; Li, X.R. Cloning of Heat Shock Protein Gene Ld-HSP70 in Leptinotarsa decemlineata and Its Expression Characteristics under Temperature Stress. Agric. Sci. China 2021, 54, 1163–1175. (In Chinese) [Google Scholar]
- Chen, J.; Zhang, D.W.; Yu, Y.Y.; Xu, X.L.; Zhang, Q.; Chen, Y.; Zeng, B.P. Characteristics and temperature induced expression of HSP70 and HSP70 from brown planthopper (Nilaparvata lugens). Biotechnology 2018, 28, 434–440. (In Chinese) [Google Scholar]
- Wang, D.G.; He, P.P.; Ma, G.H.; Xiao, H.B.; Xiong, R.C.; Han, X.; Yang, M.L. Screening of Reference Genes and Analysis of HSP70 and HSP90 Gene Expression of Euzophera pyriella Under Low Temperature Stress. Southwest. China J. Agric. Sci. 2020, 33, 2503–2508. (In Chinese) [Google Scholar]
Disclaimer/Publisher’s Note: The statements, opinions and data contained in all publications are solely those of the individual author(s) and contributor(s) and not of MDPI and/or the editor(s). MDPI and/or the editor(s) disclaim responsibility for any injury to people or property resulting from any ideas, methods, instructions or products referred to in the content. |
© 2025 by the authors. Licensee MDPI, Basel, Switzerland. This article is an open access article distributed under the terms and conditions of the Creative Commons Attribution (CC BY) license (https://creativecommons.org/licenses/by/4.0/).