Monitoring Tribological Events by Acoustic Emission Measurements for Bearing Contacts

 , , , , and
Abstract
:
1. Introduction
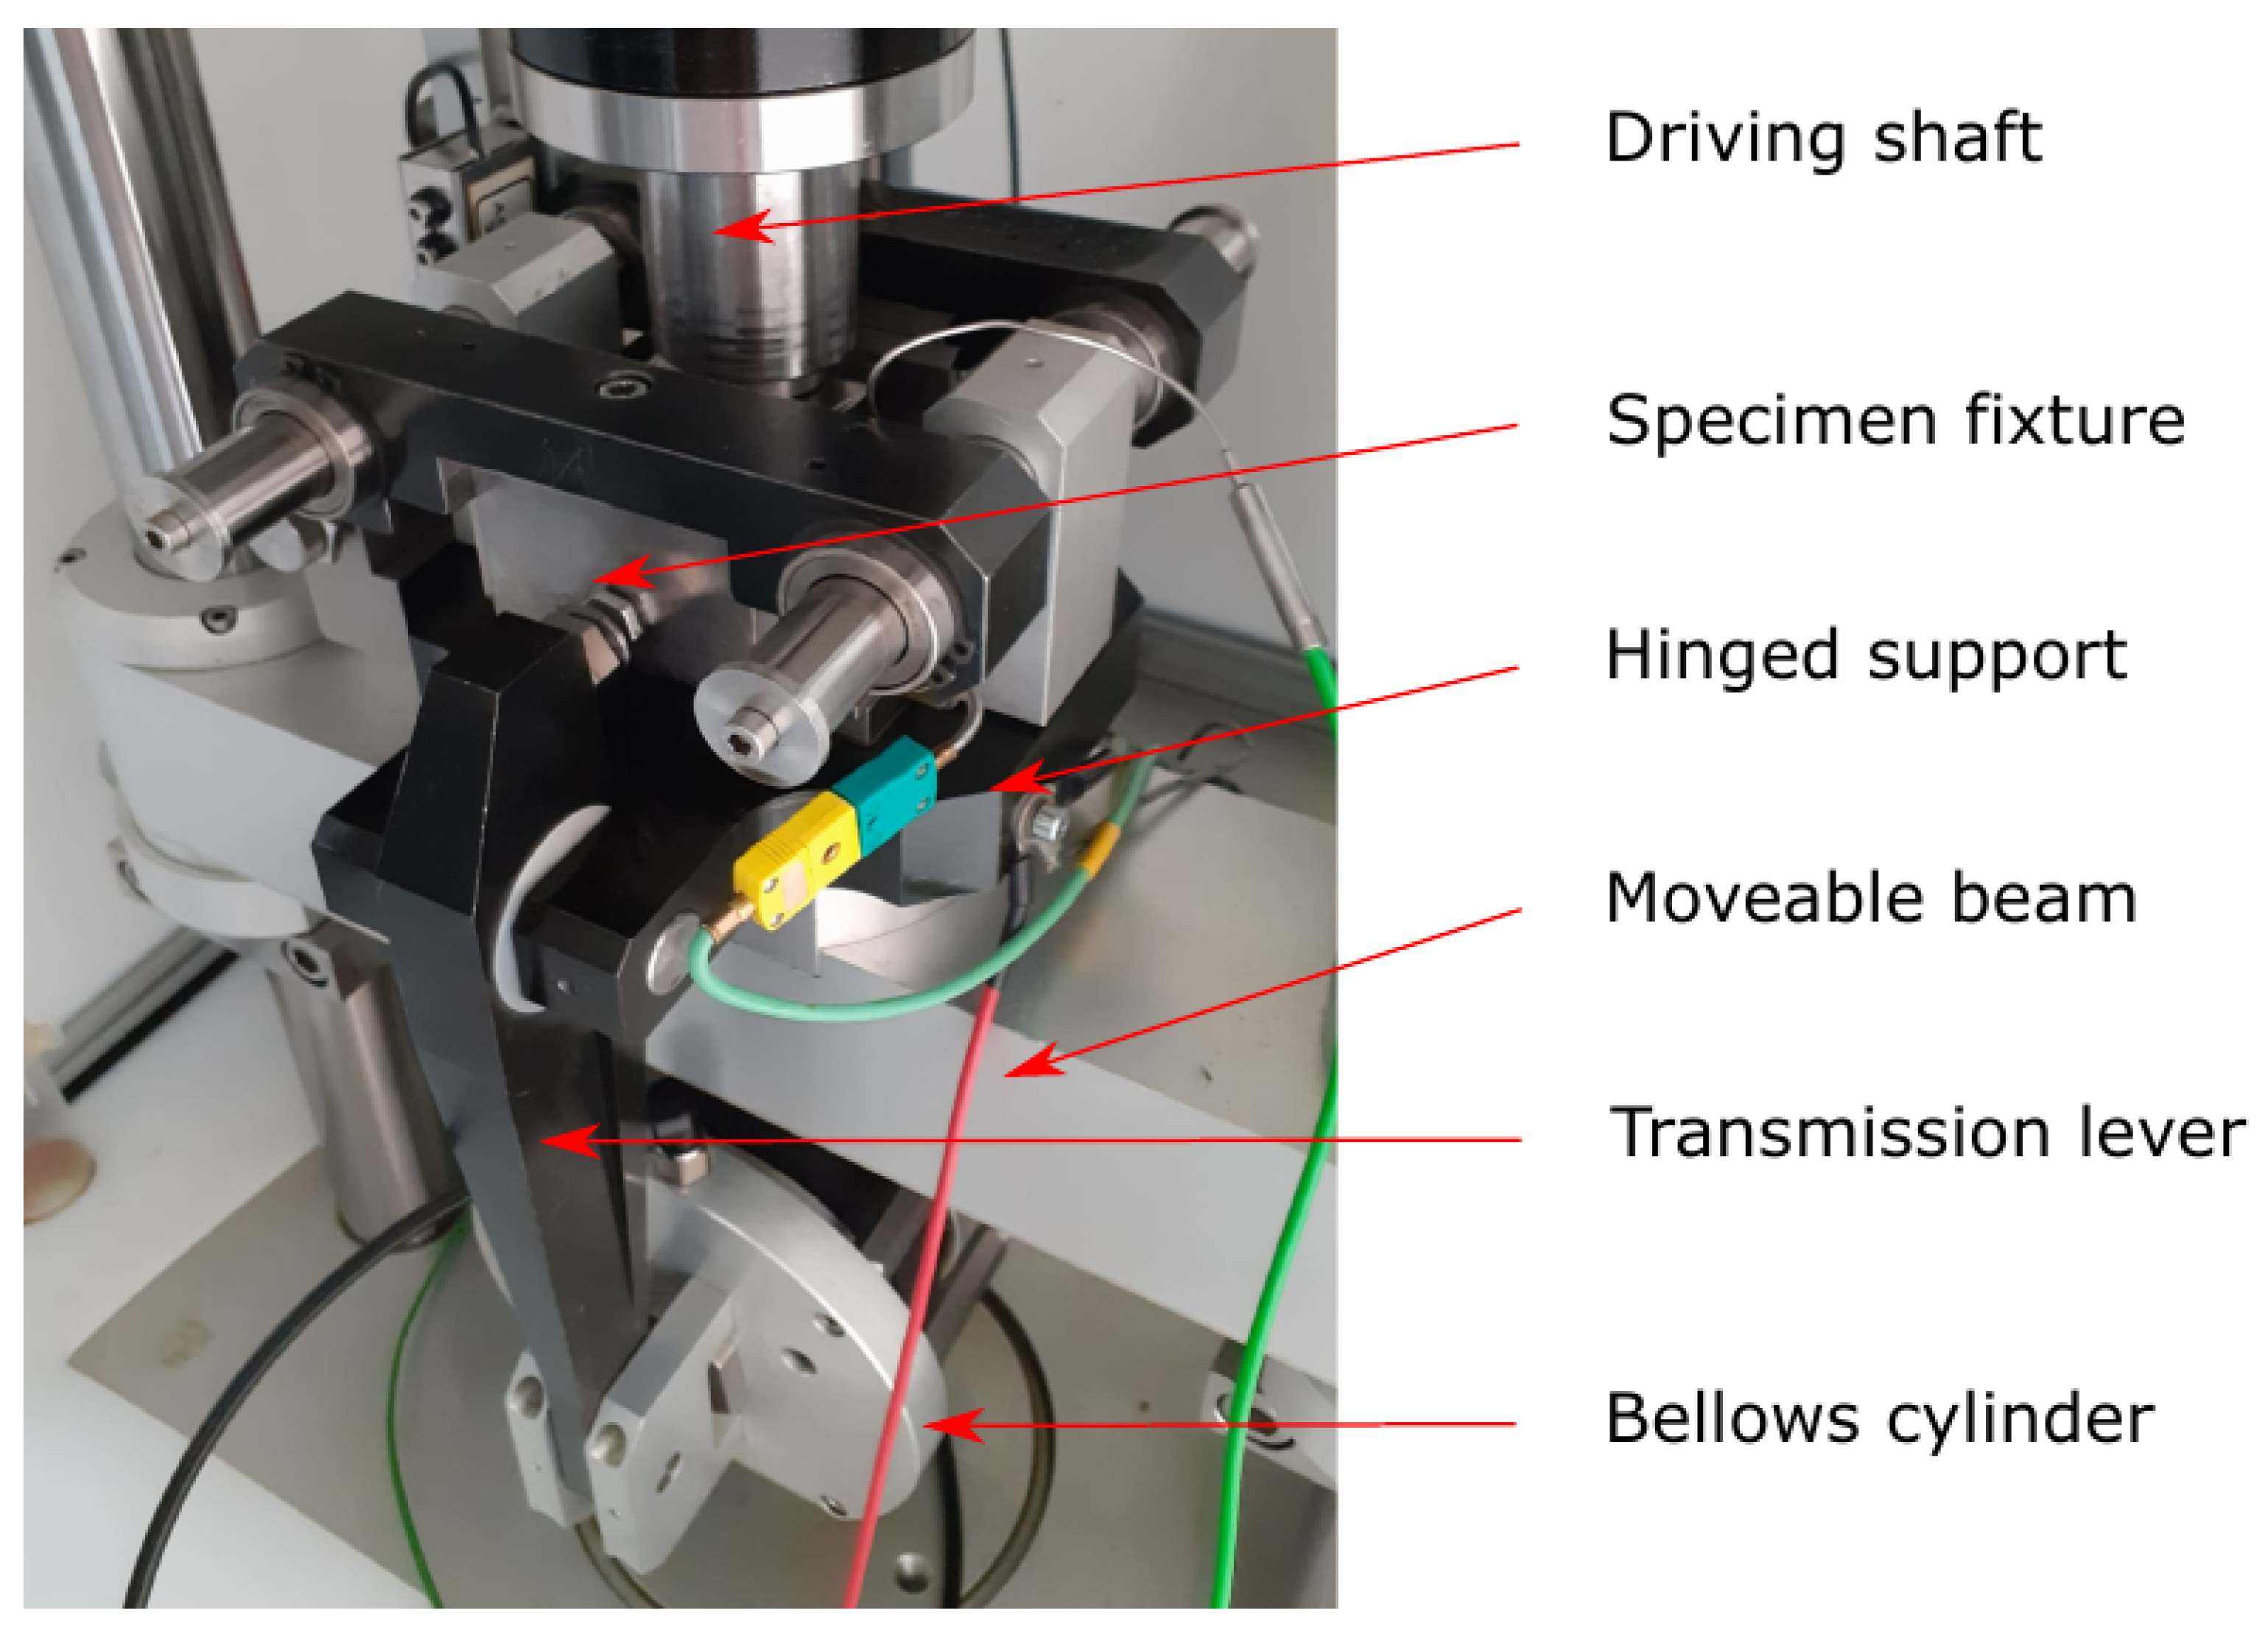
2. Experimental Details
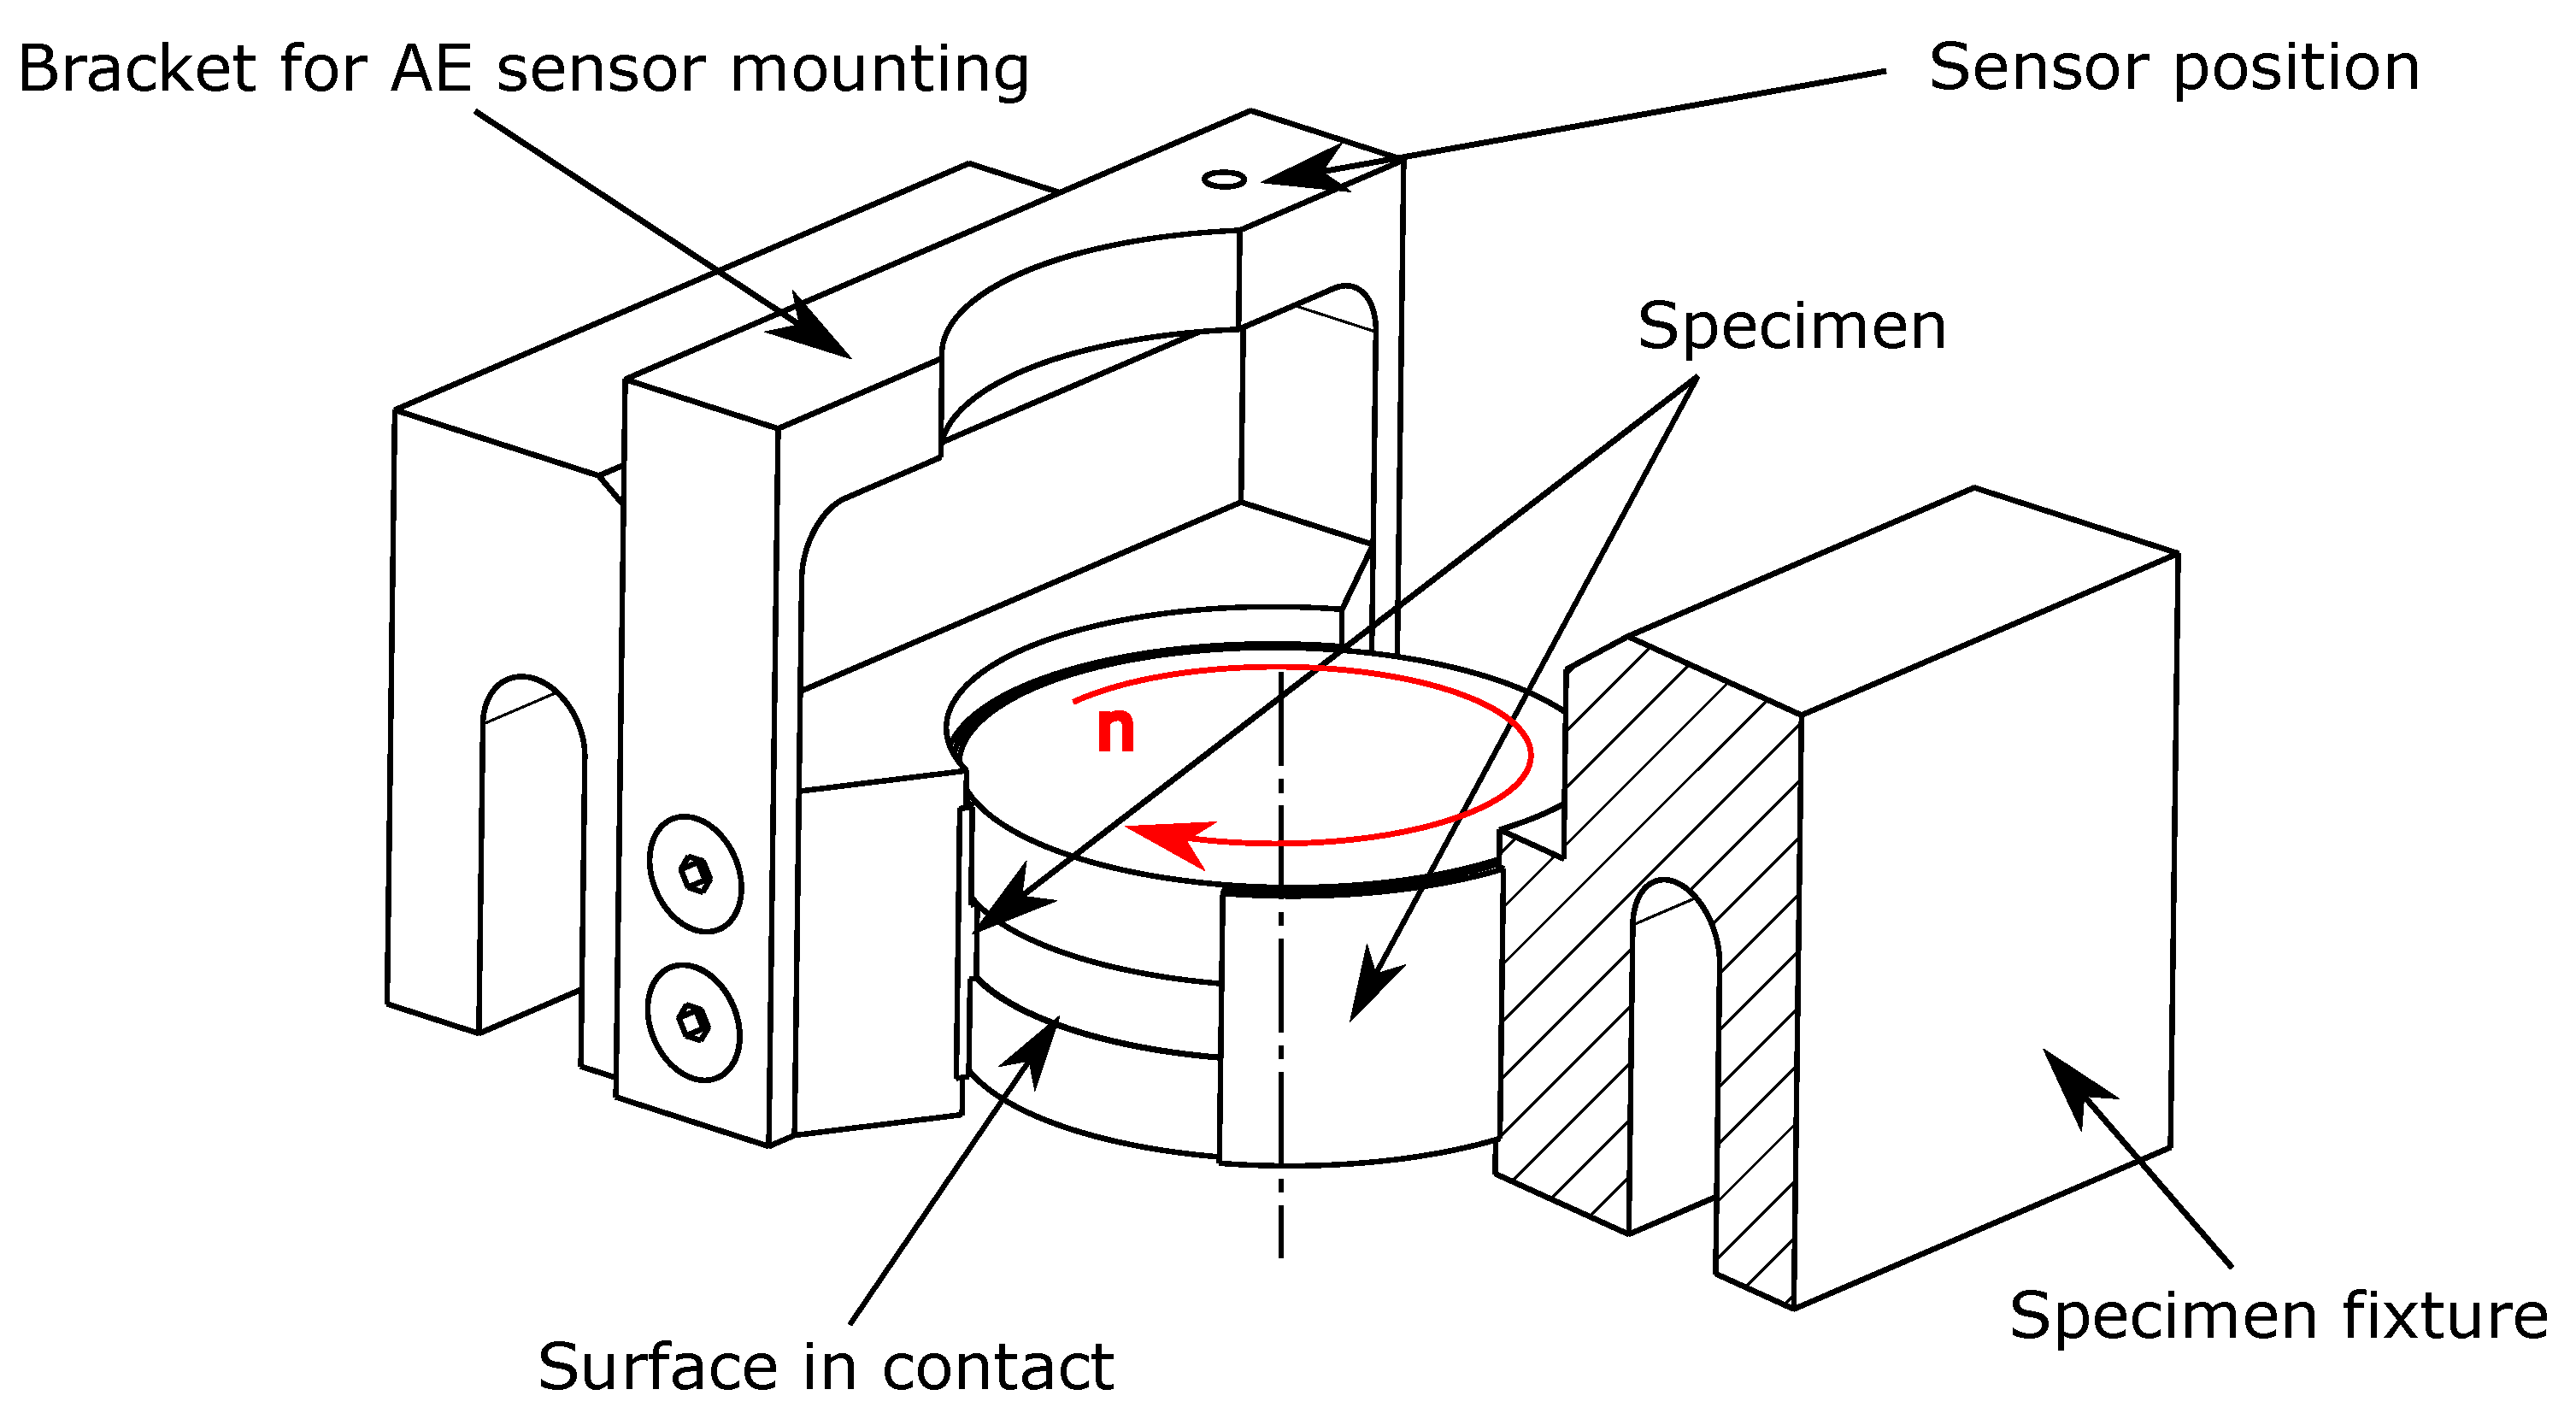
2.1. Test Programme and Measurements
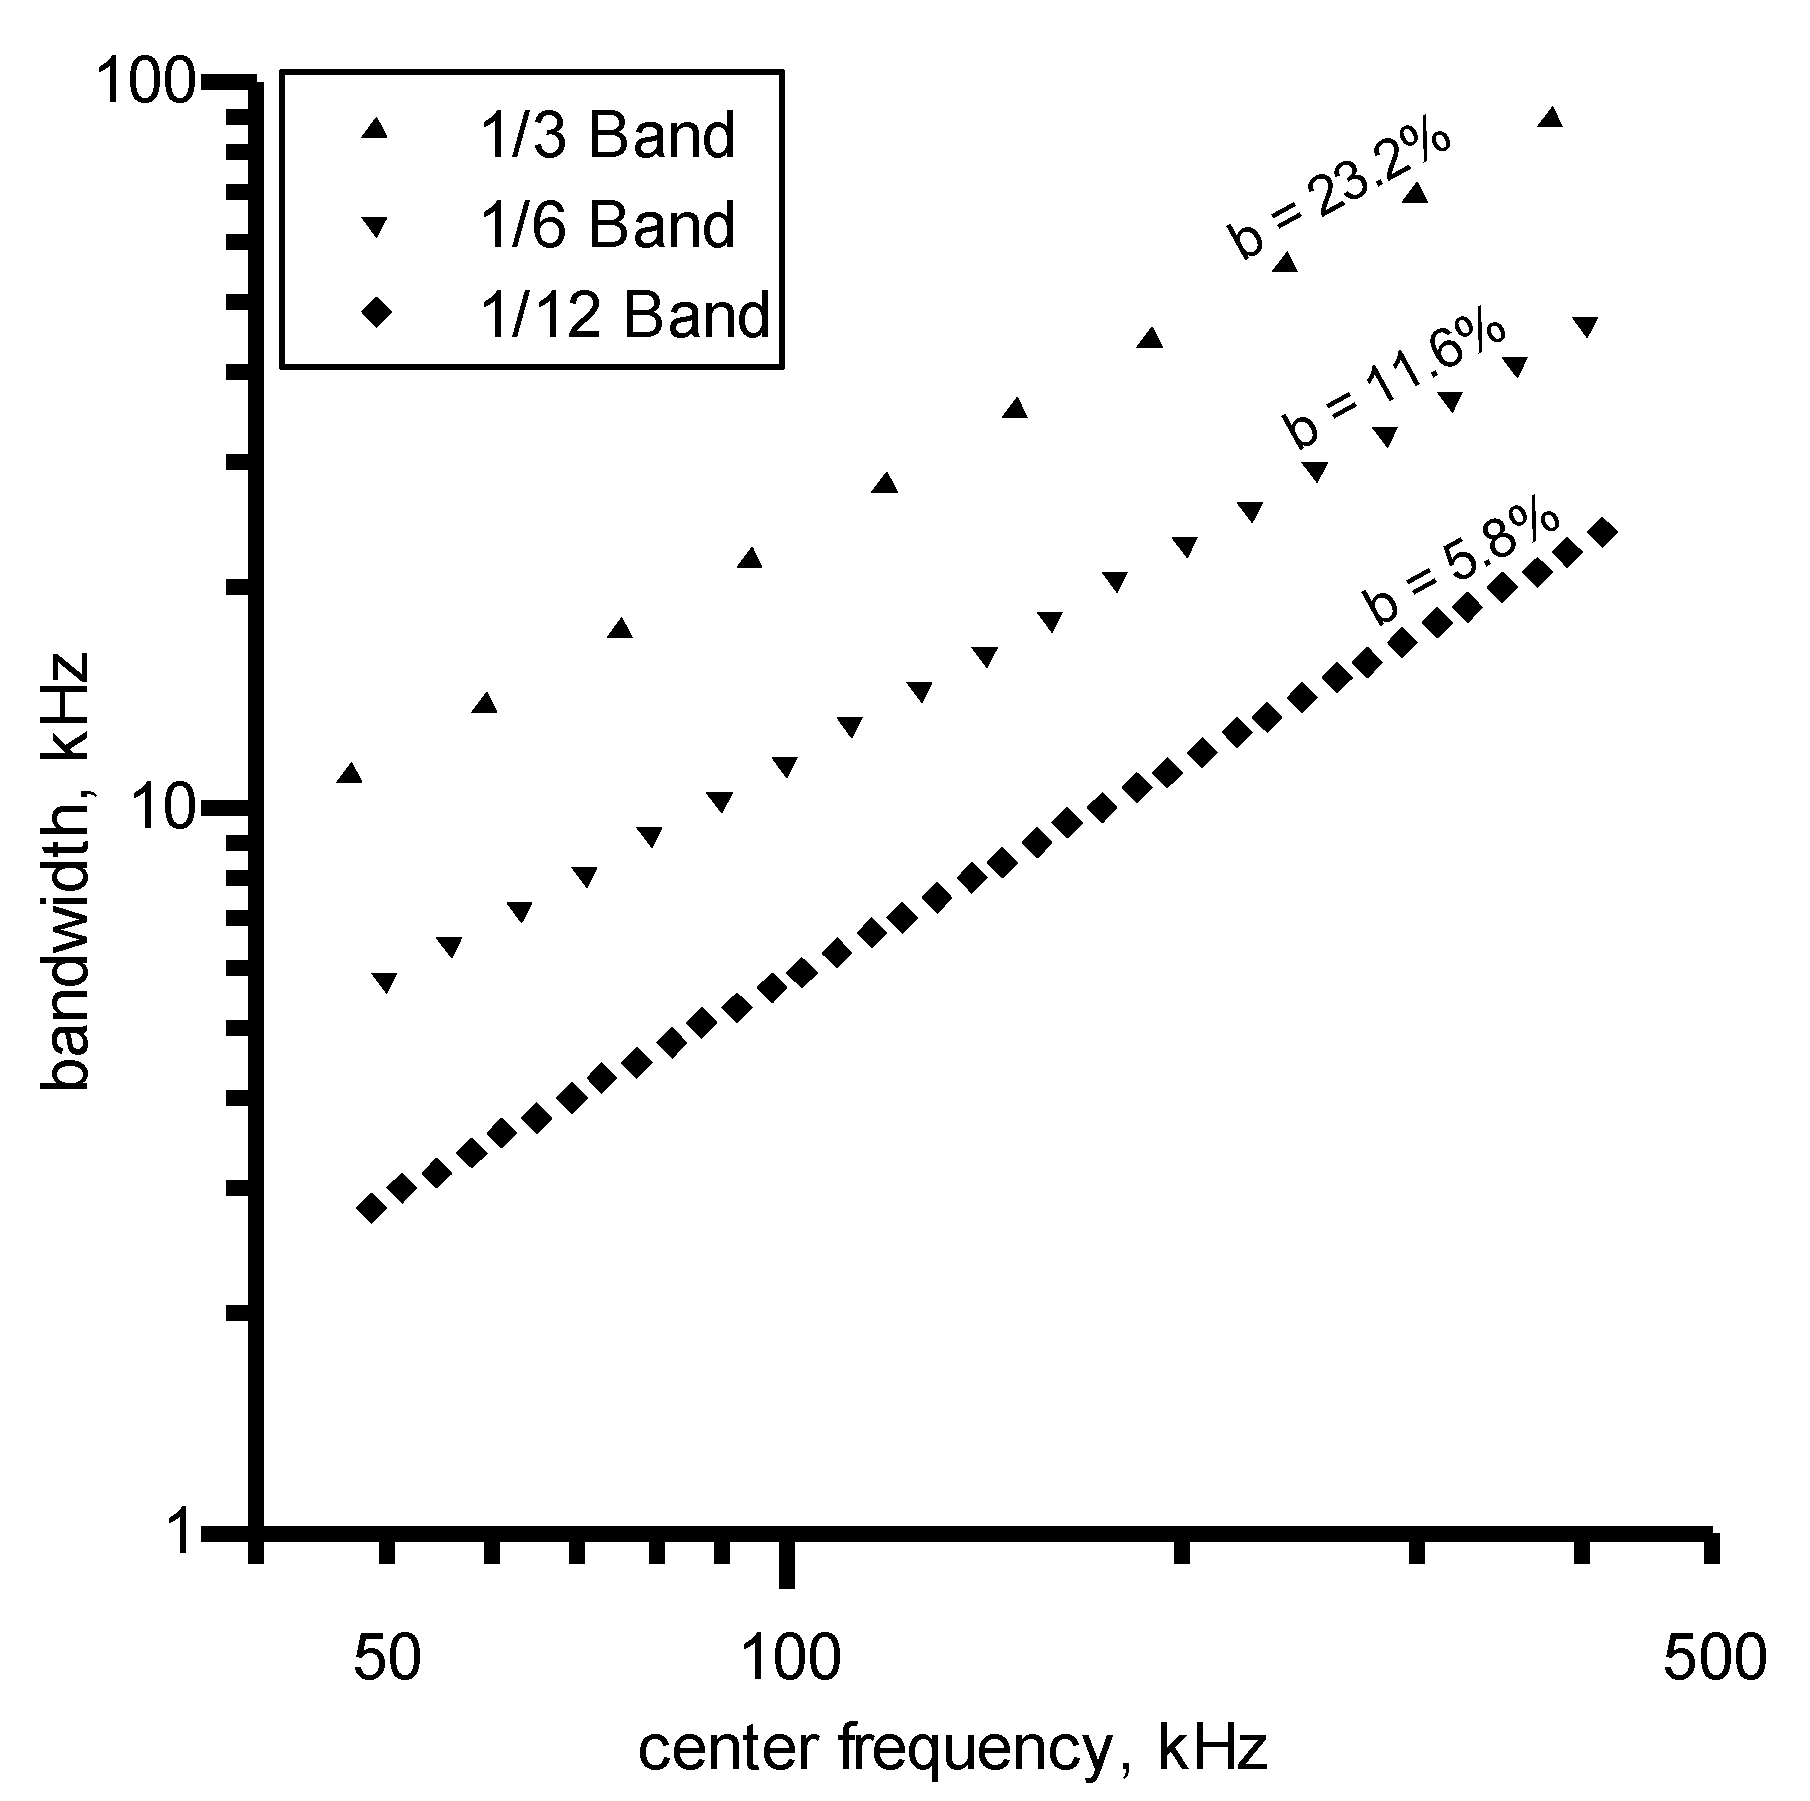
2.2. Data Processing of Raw AE Signals
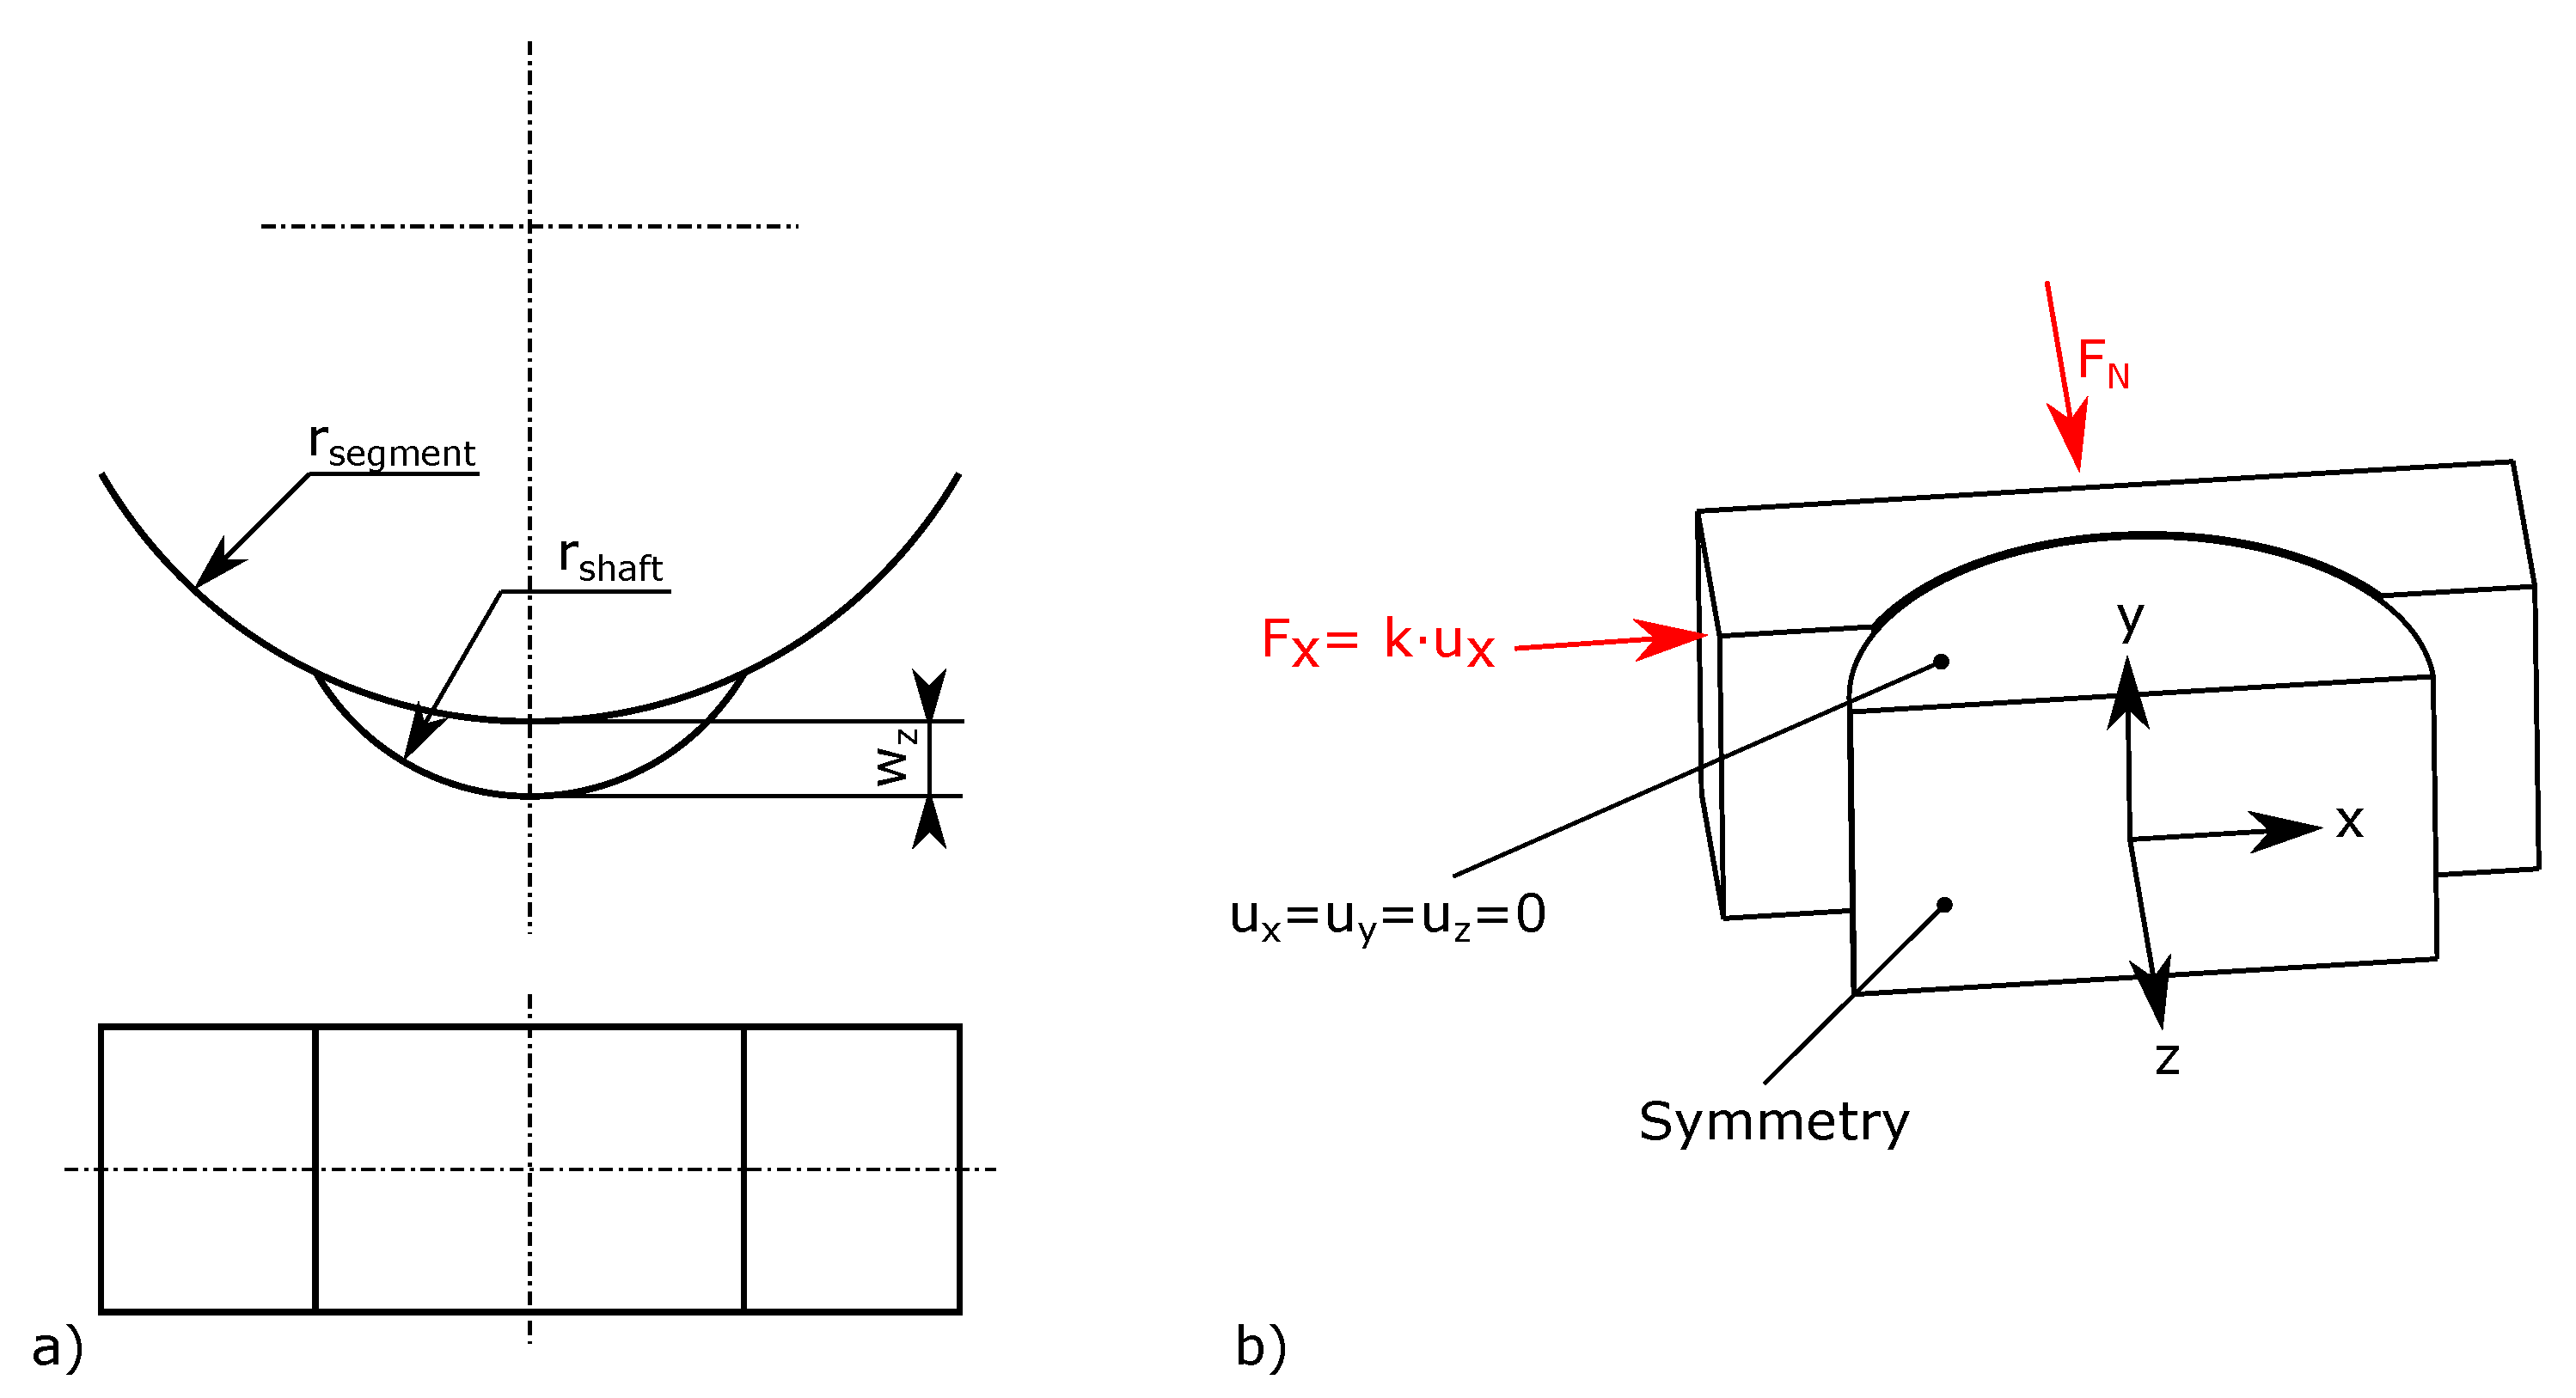
2.3. Simulation
3. Results
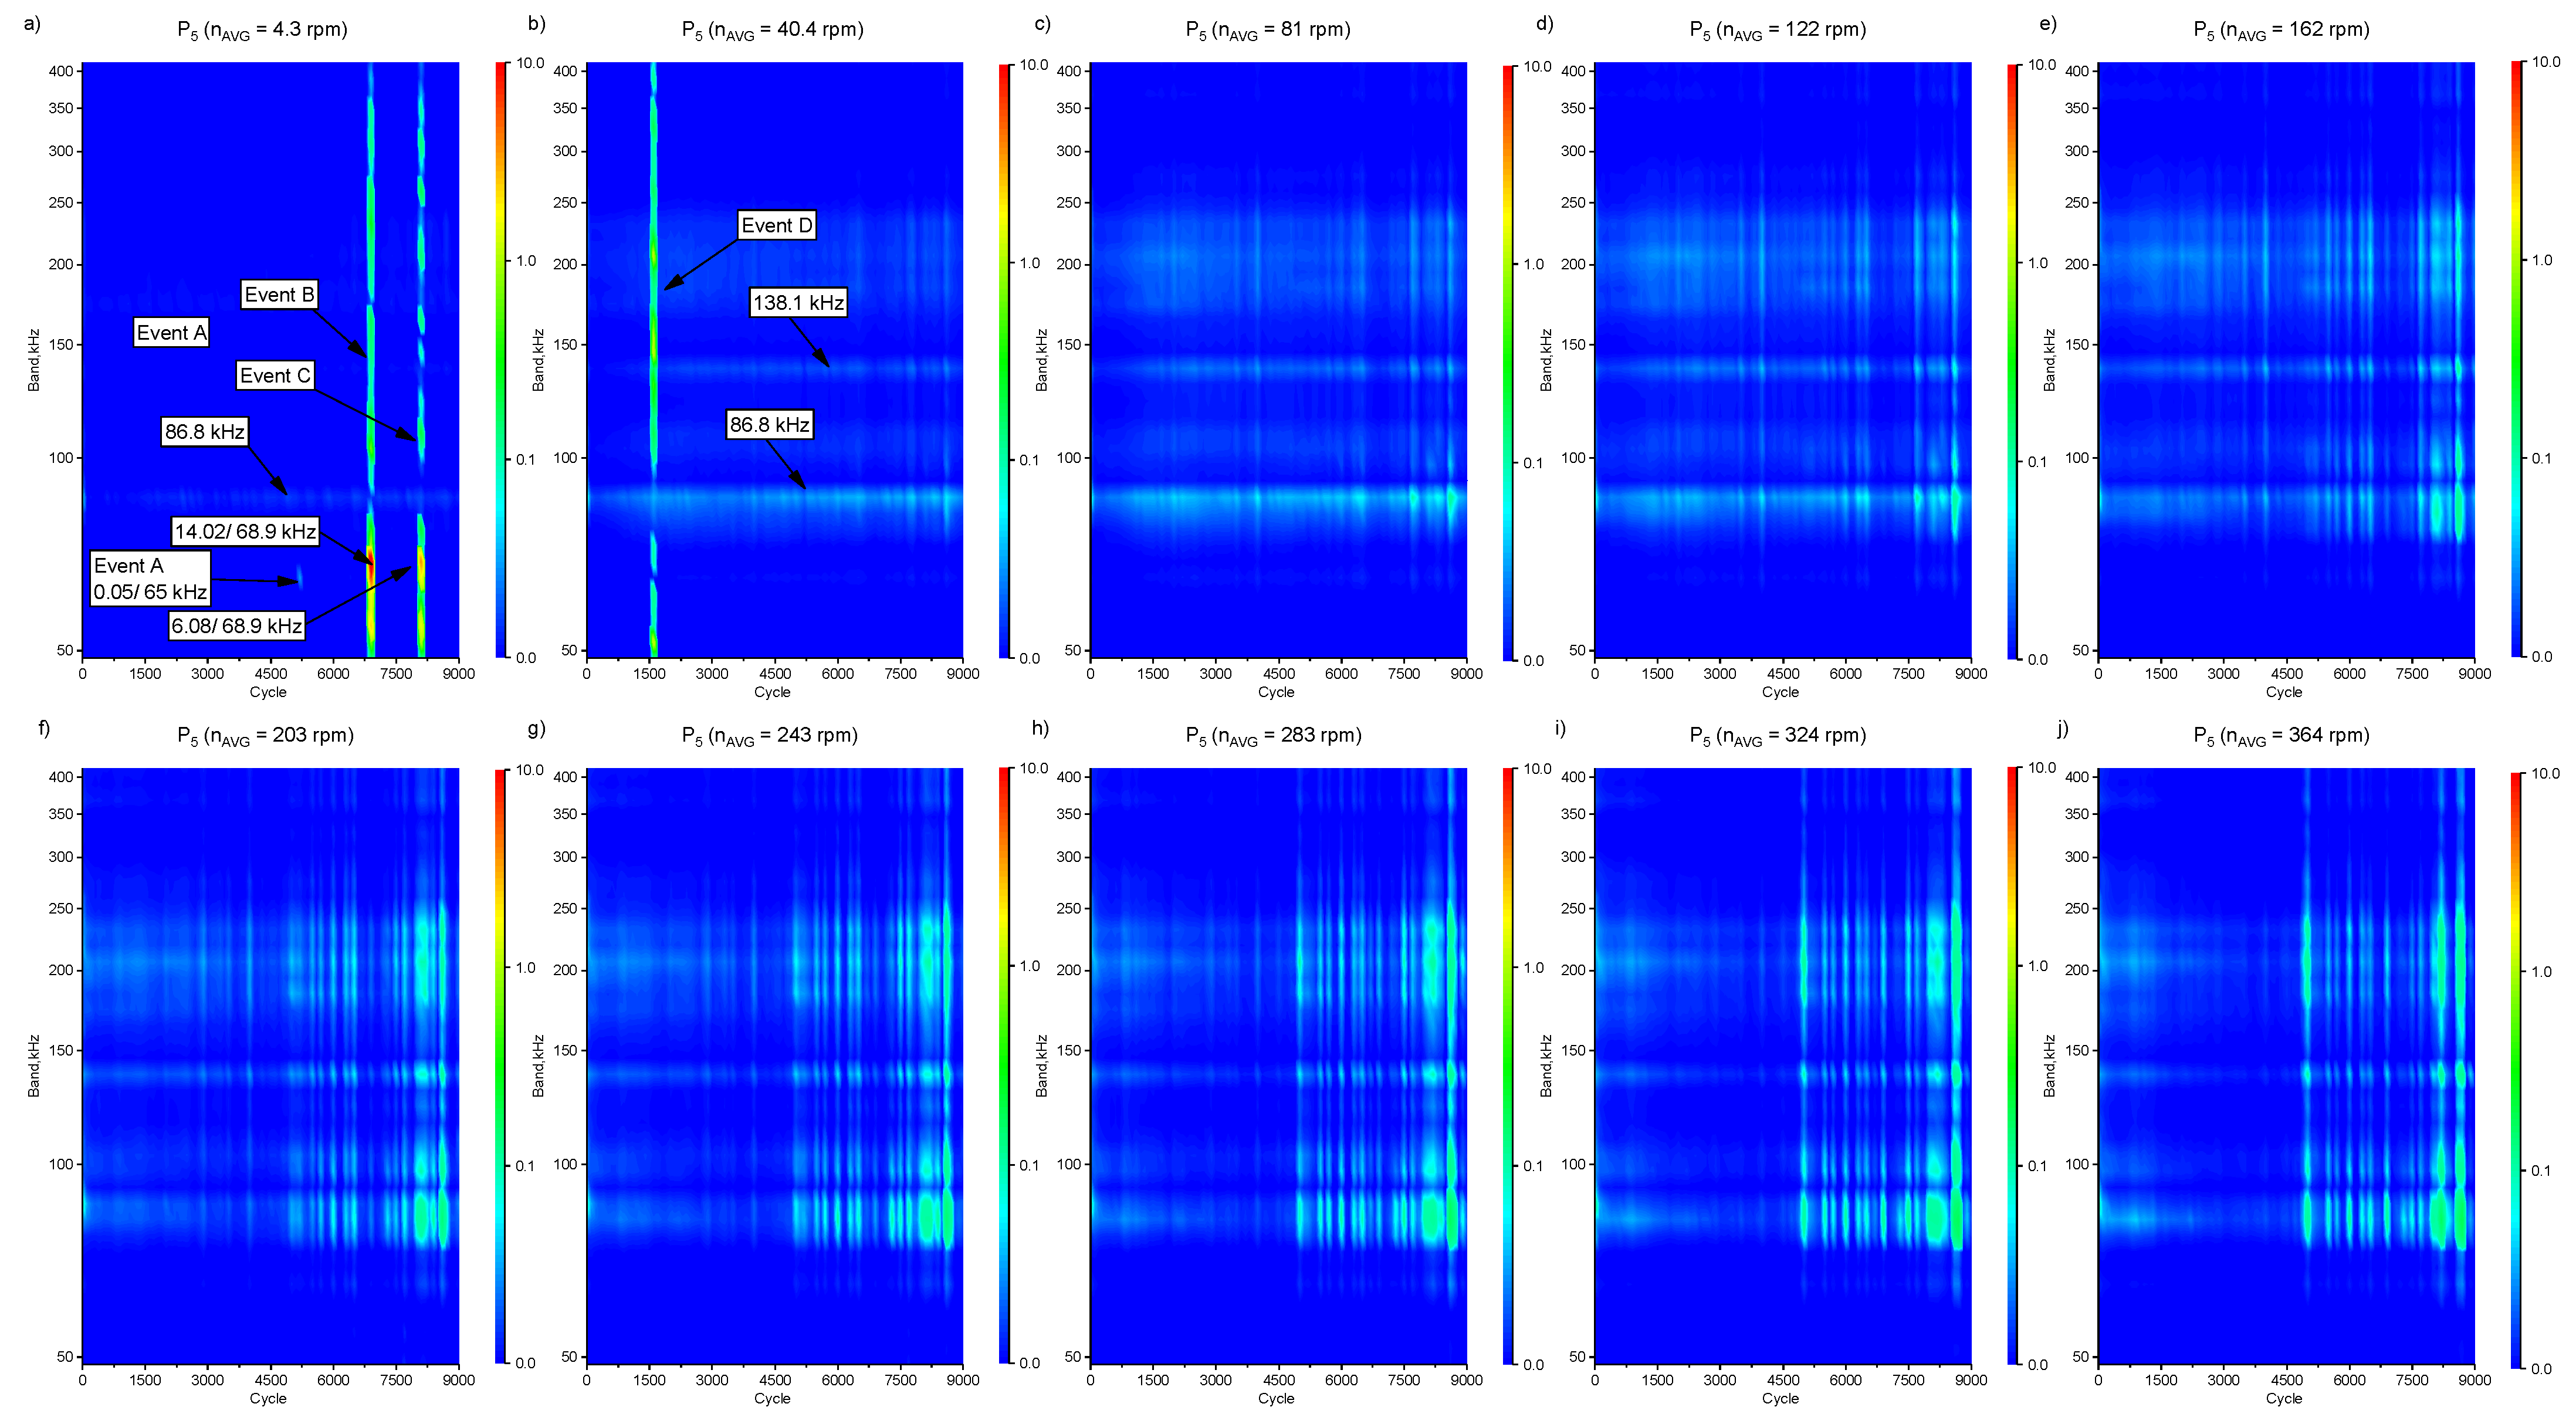
3.1. Test Results
3.2. Simulative Results
4. Discussion
5. Conclusions
- The use of the kurtosis, especially in combination with parameters describing the signal intensity is an appropriate tool to detect tribological events in acoustic emission datasets. An application of the proposed parameter is suitable for an intelligent data acquisition trigger, whereby the trigger can be defined for a special frequency band.
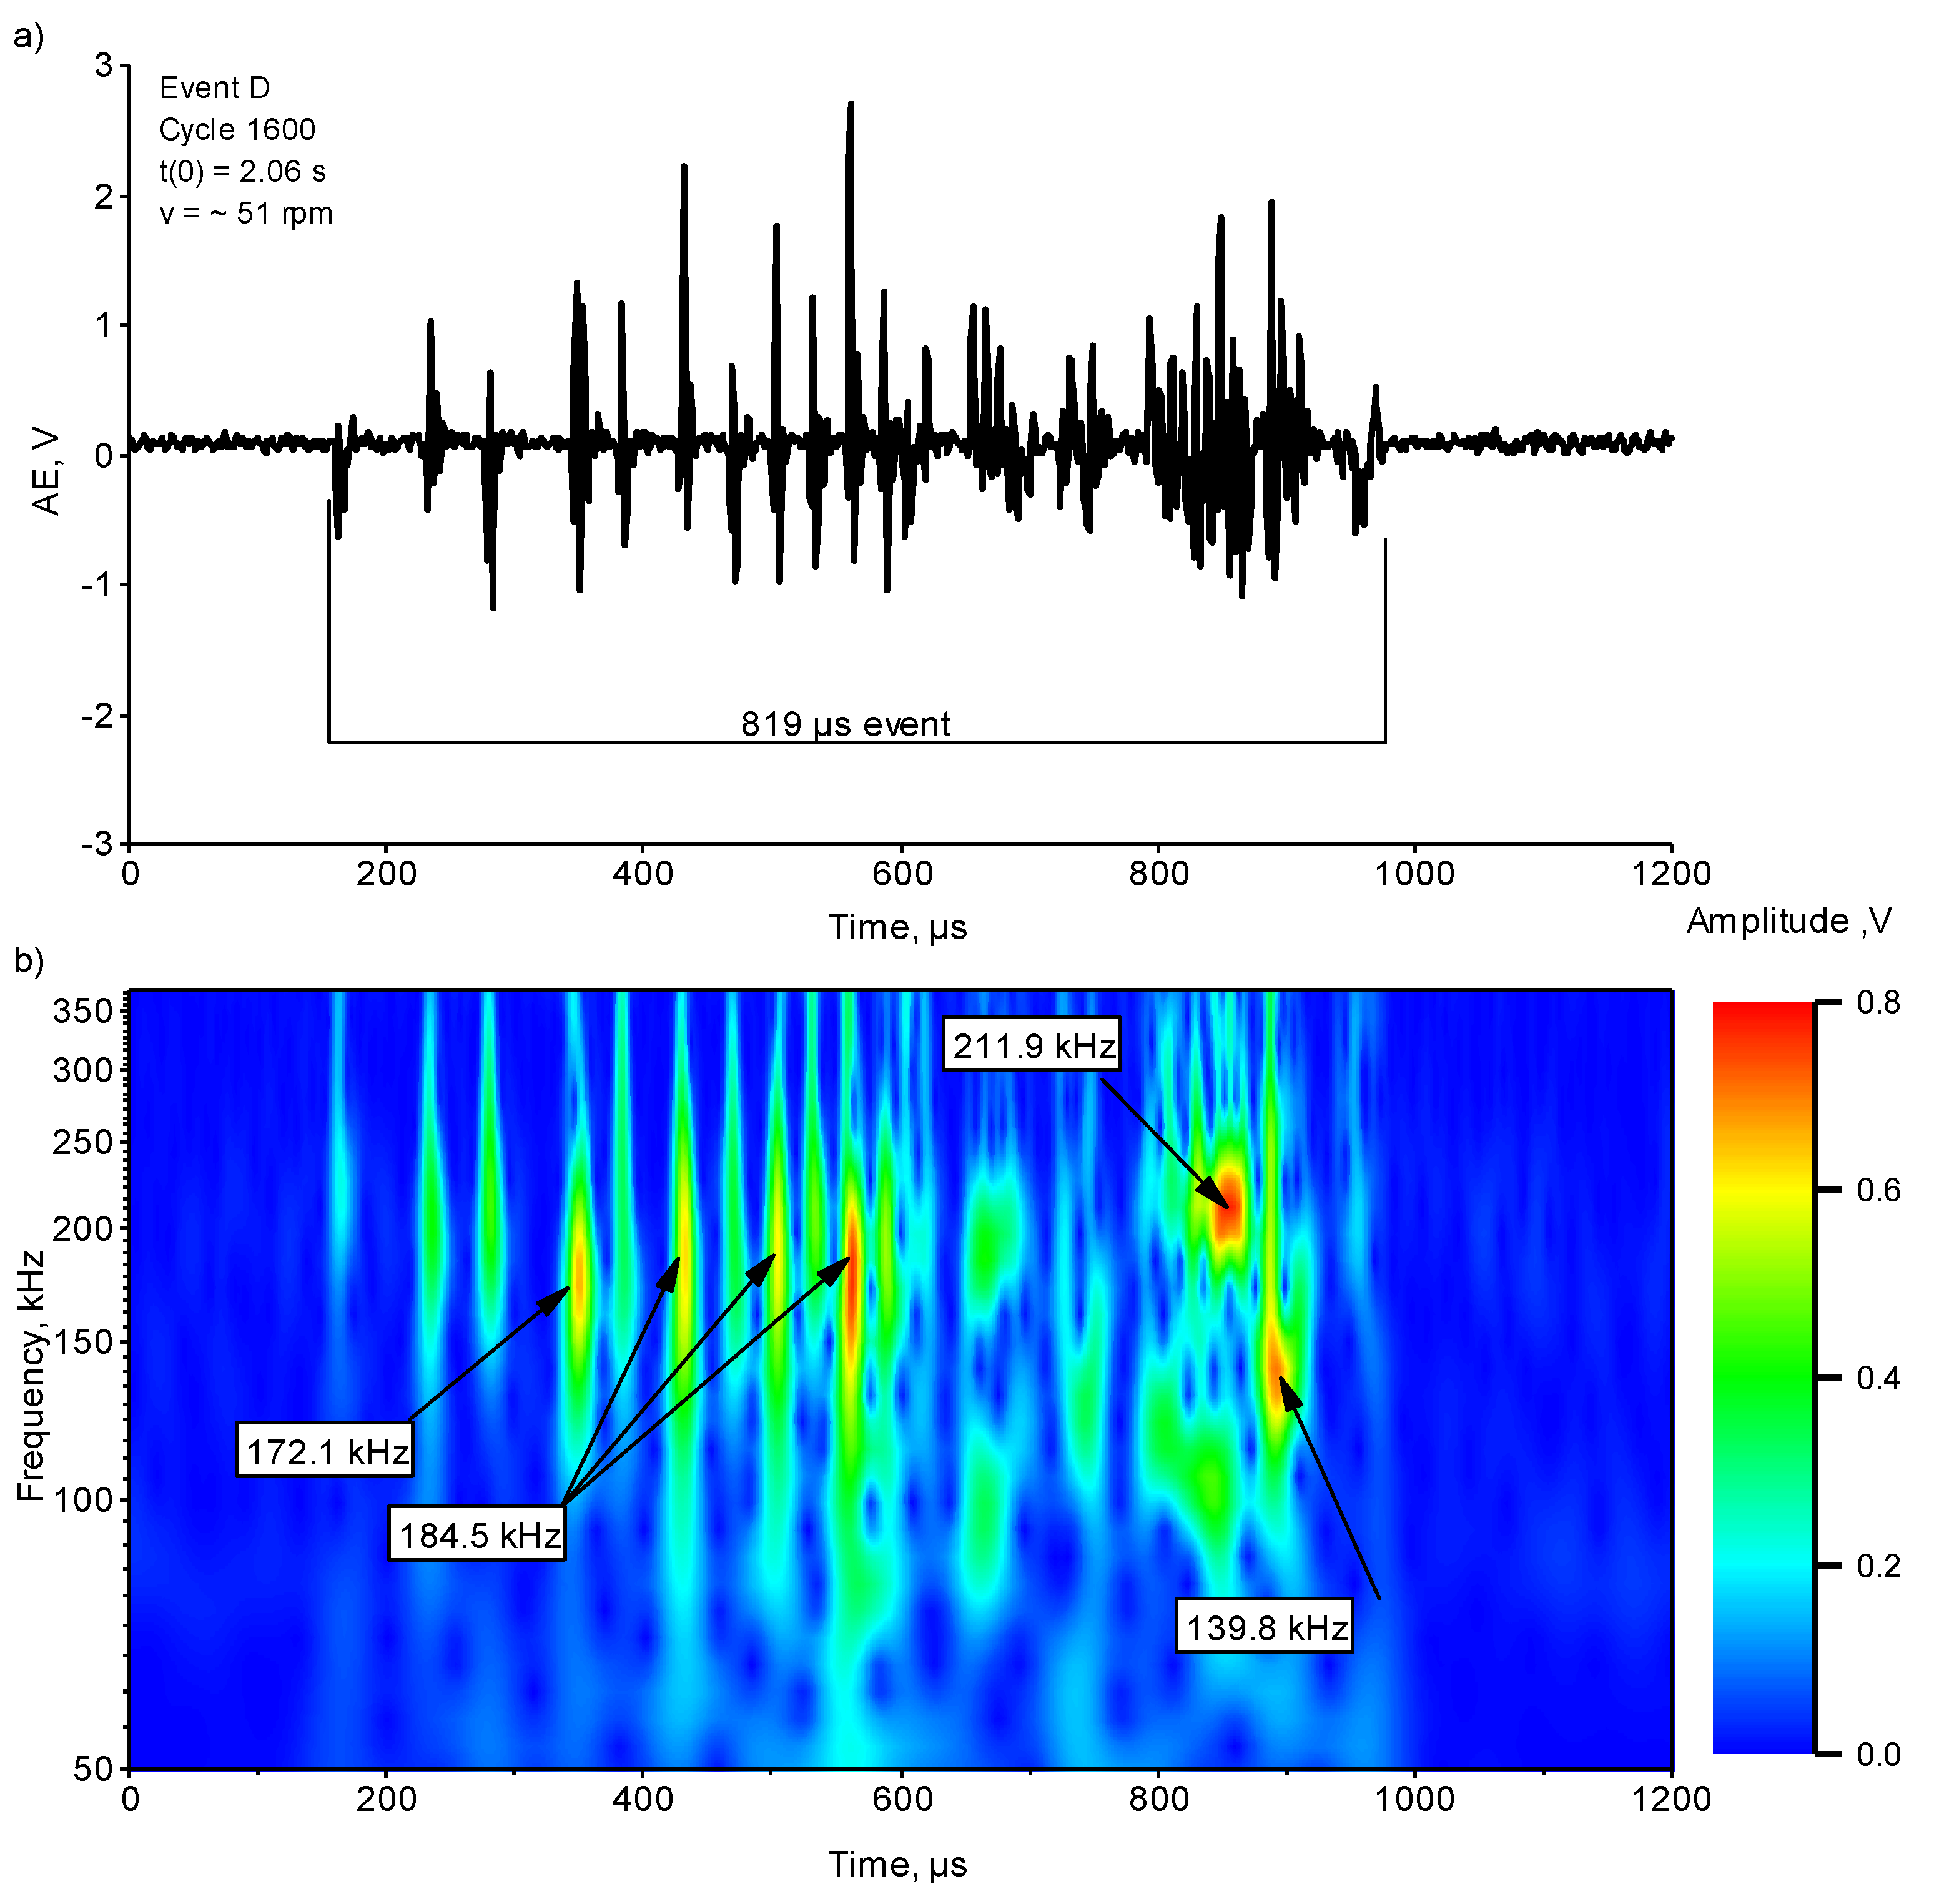
- Short time tribological events like small pulses from particles are emitting a broadband signal, which can be detected easily in most frequencies. Nevertheless, the highest intensities are found to be in certain frequency bands.
- The presence of adhesive wear mechanisms with simultaneously detected particles were successfully detected in a non-stationary operated segment of a journal bearing.
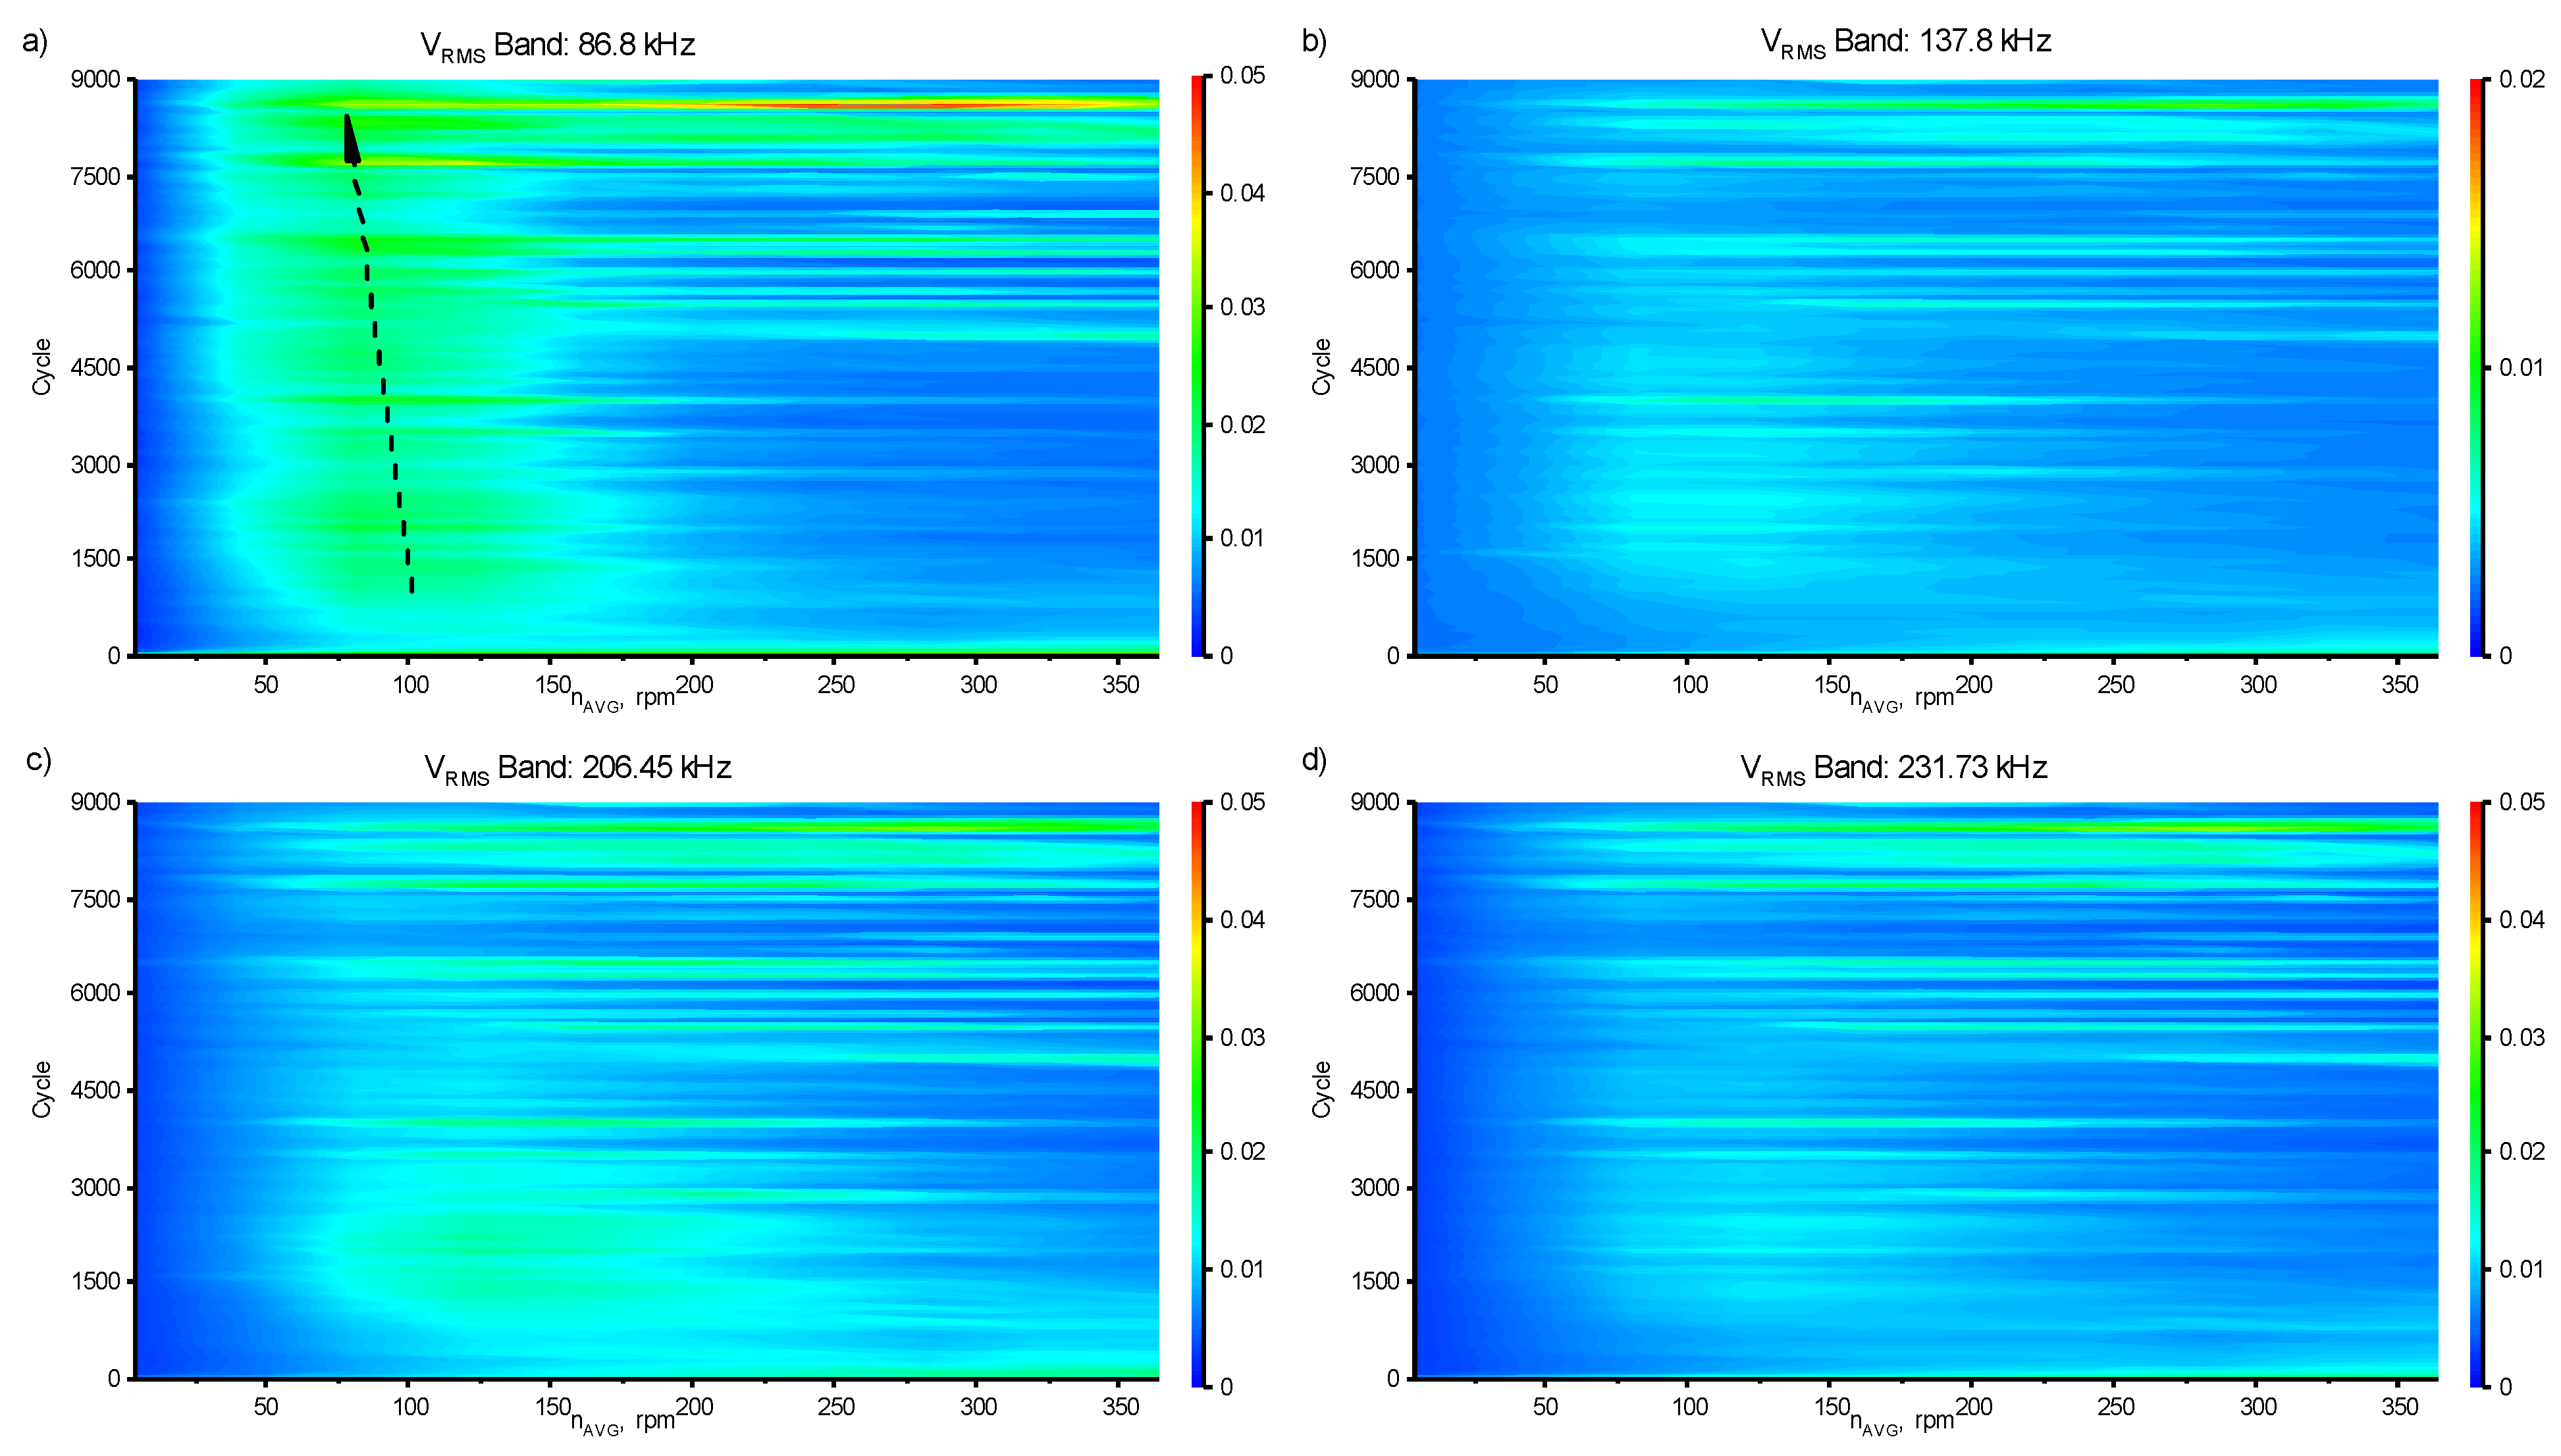
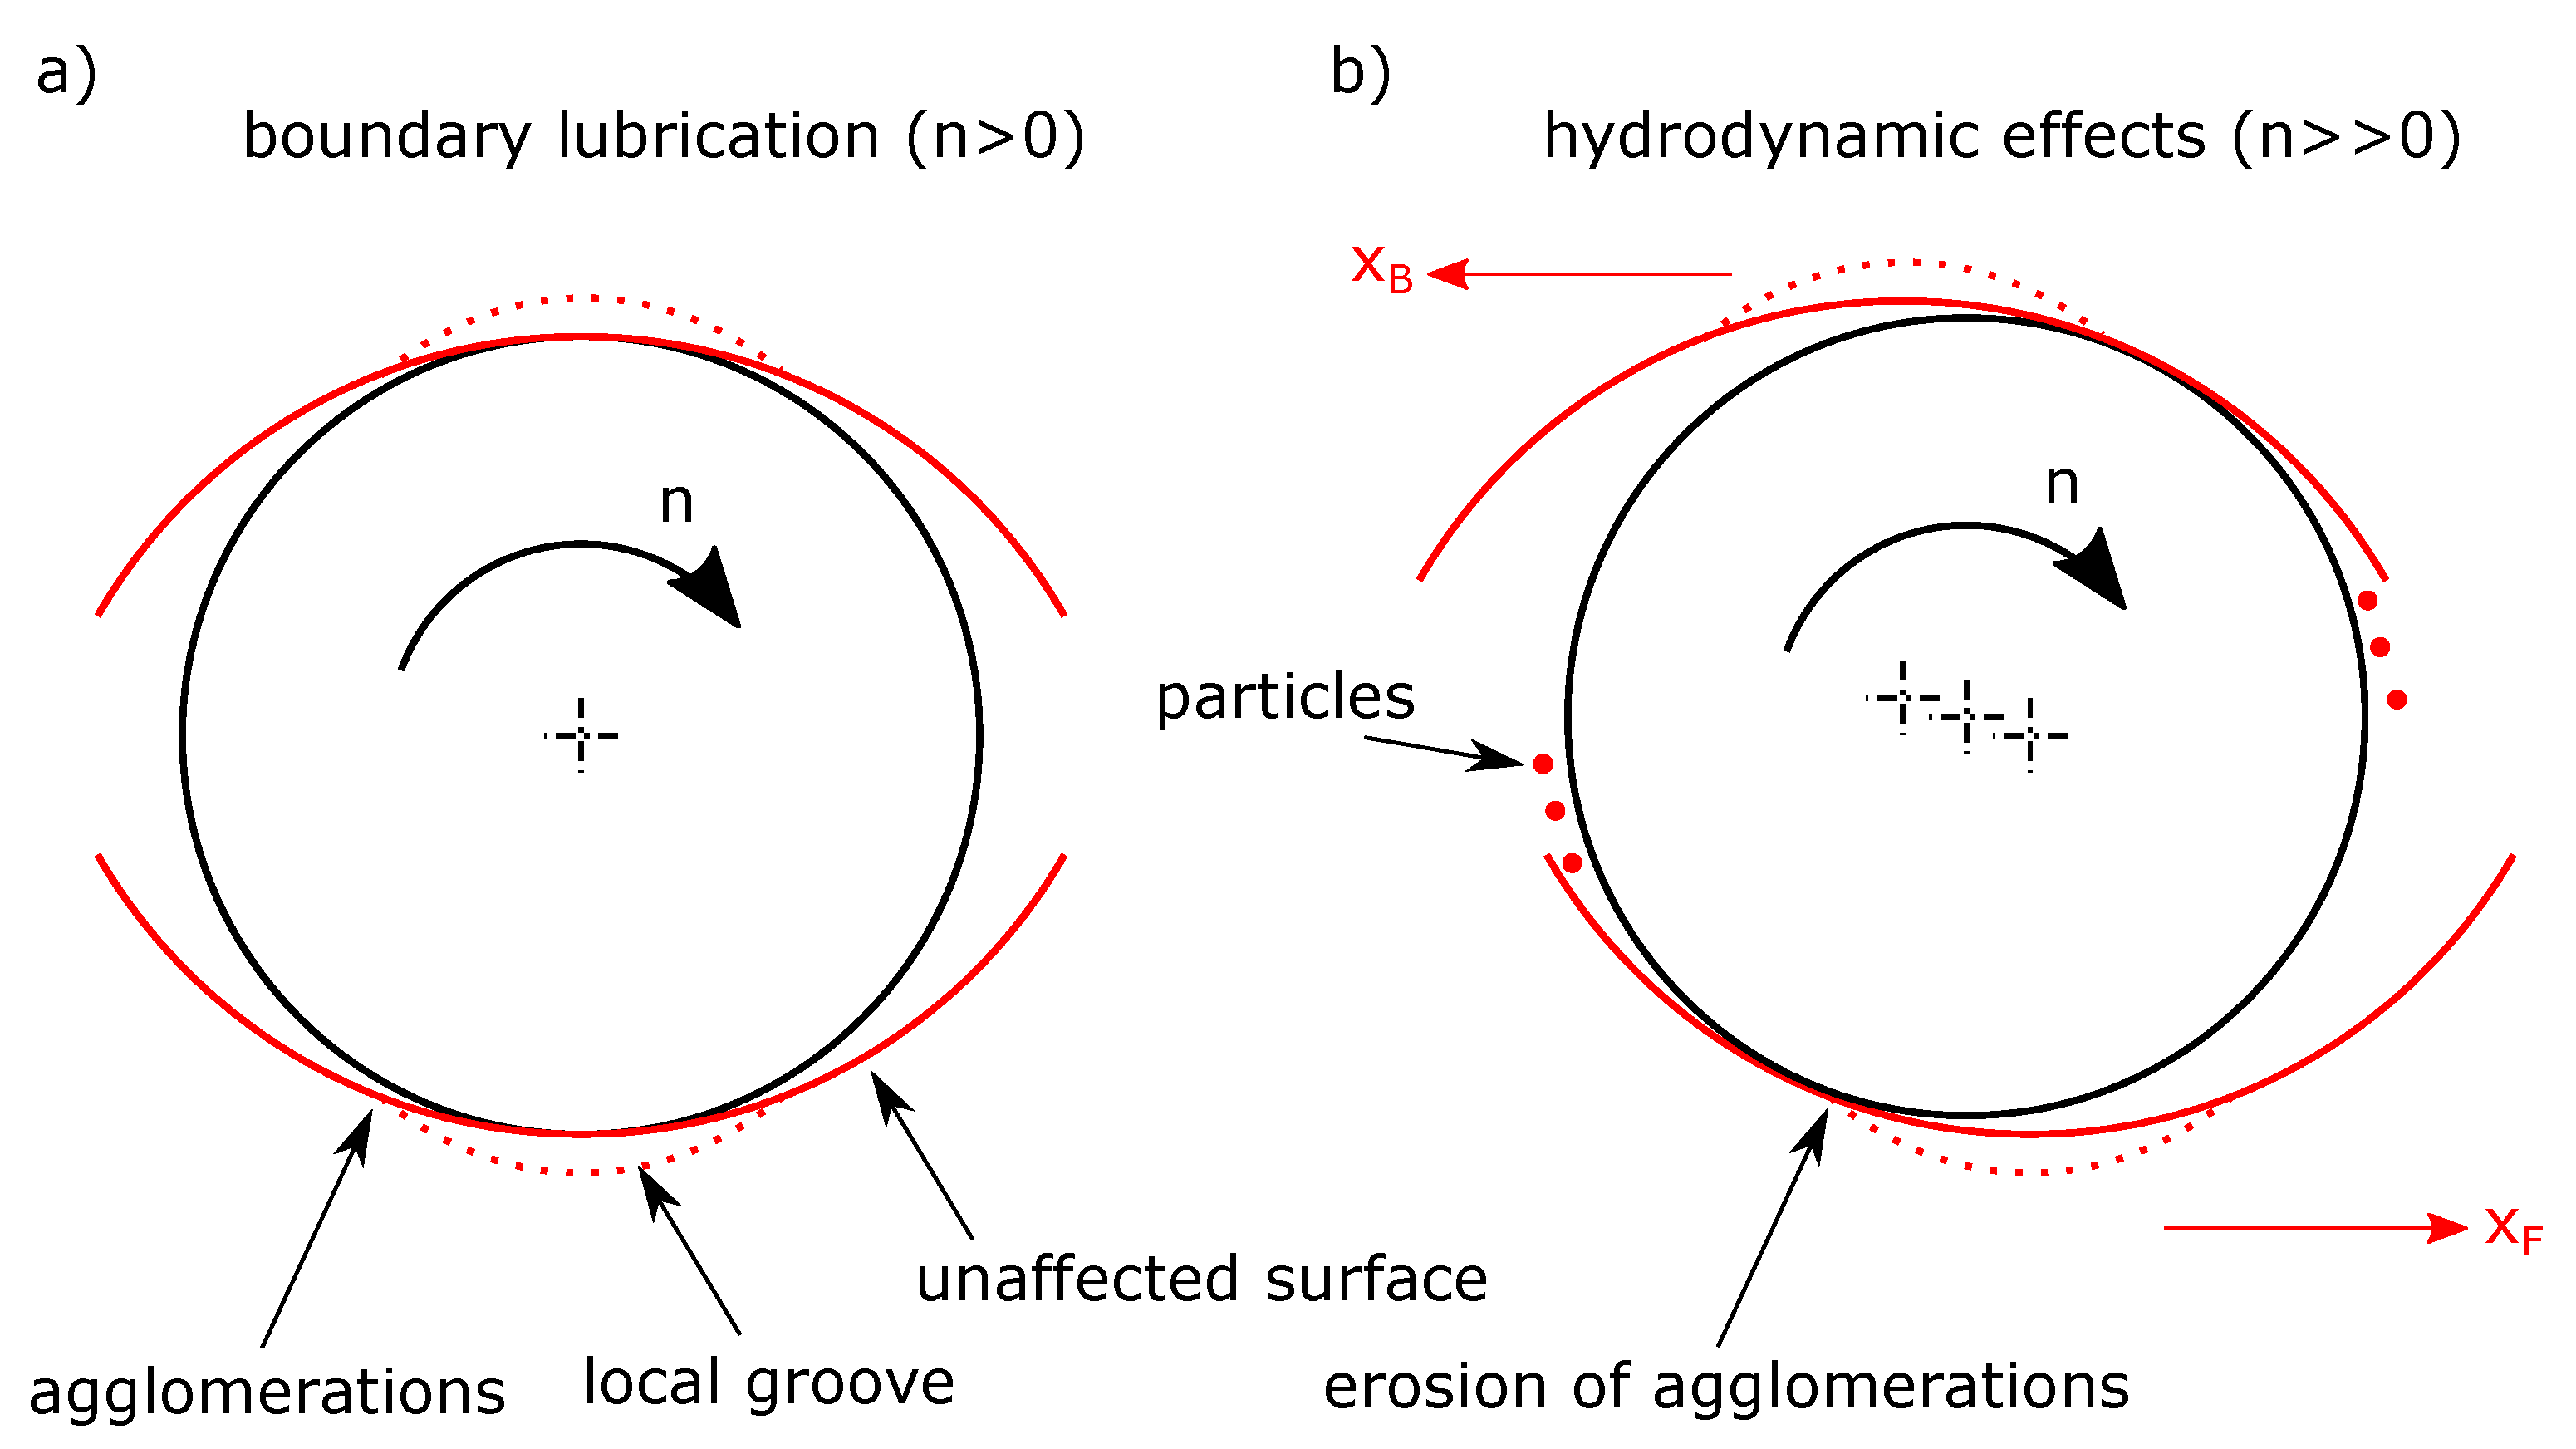
- A theory for a ductile wear mechanism in a silver coating was formulated on the interpretation of a -octave band analysis on acoustic emission measurements. With a supplementary numerical simulation with appropriate elastic boundary conditions, the behavior could be justified by a speed depended lateral displacement.
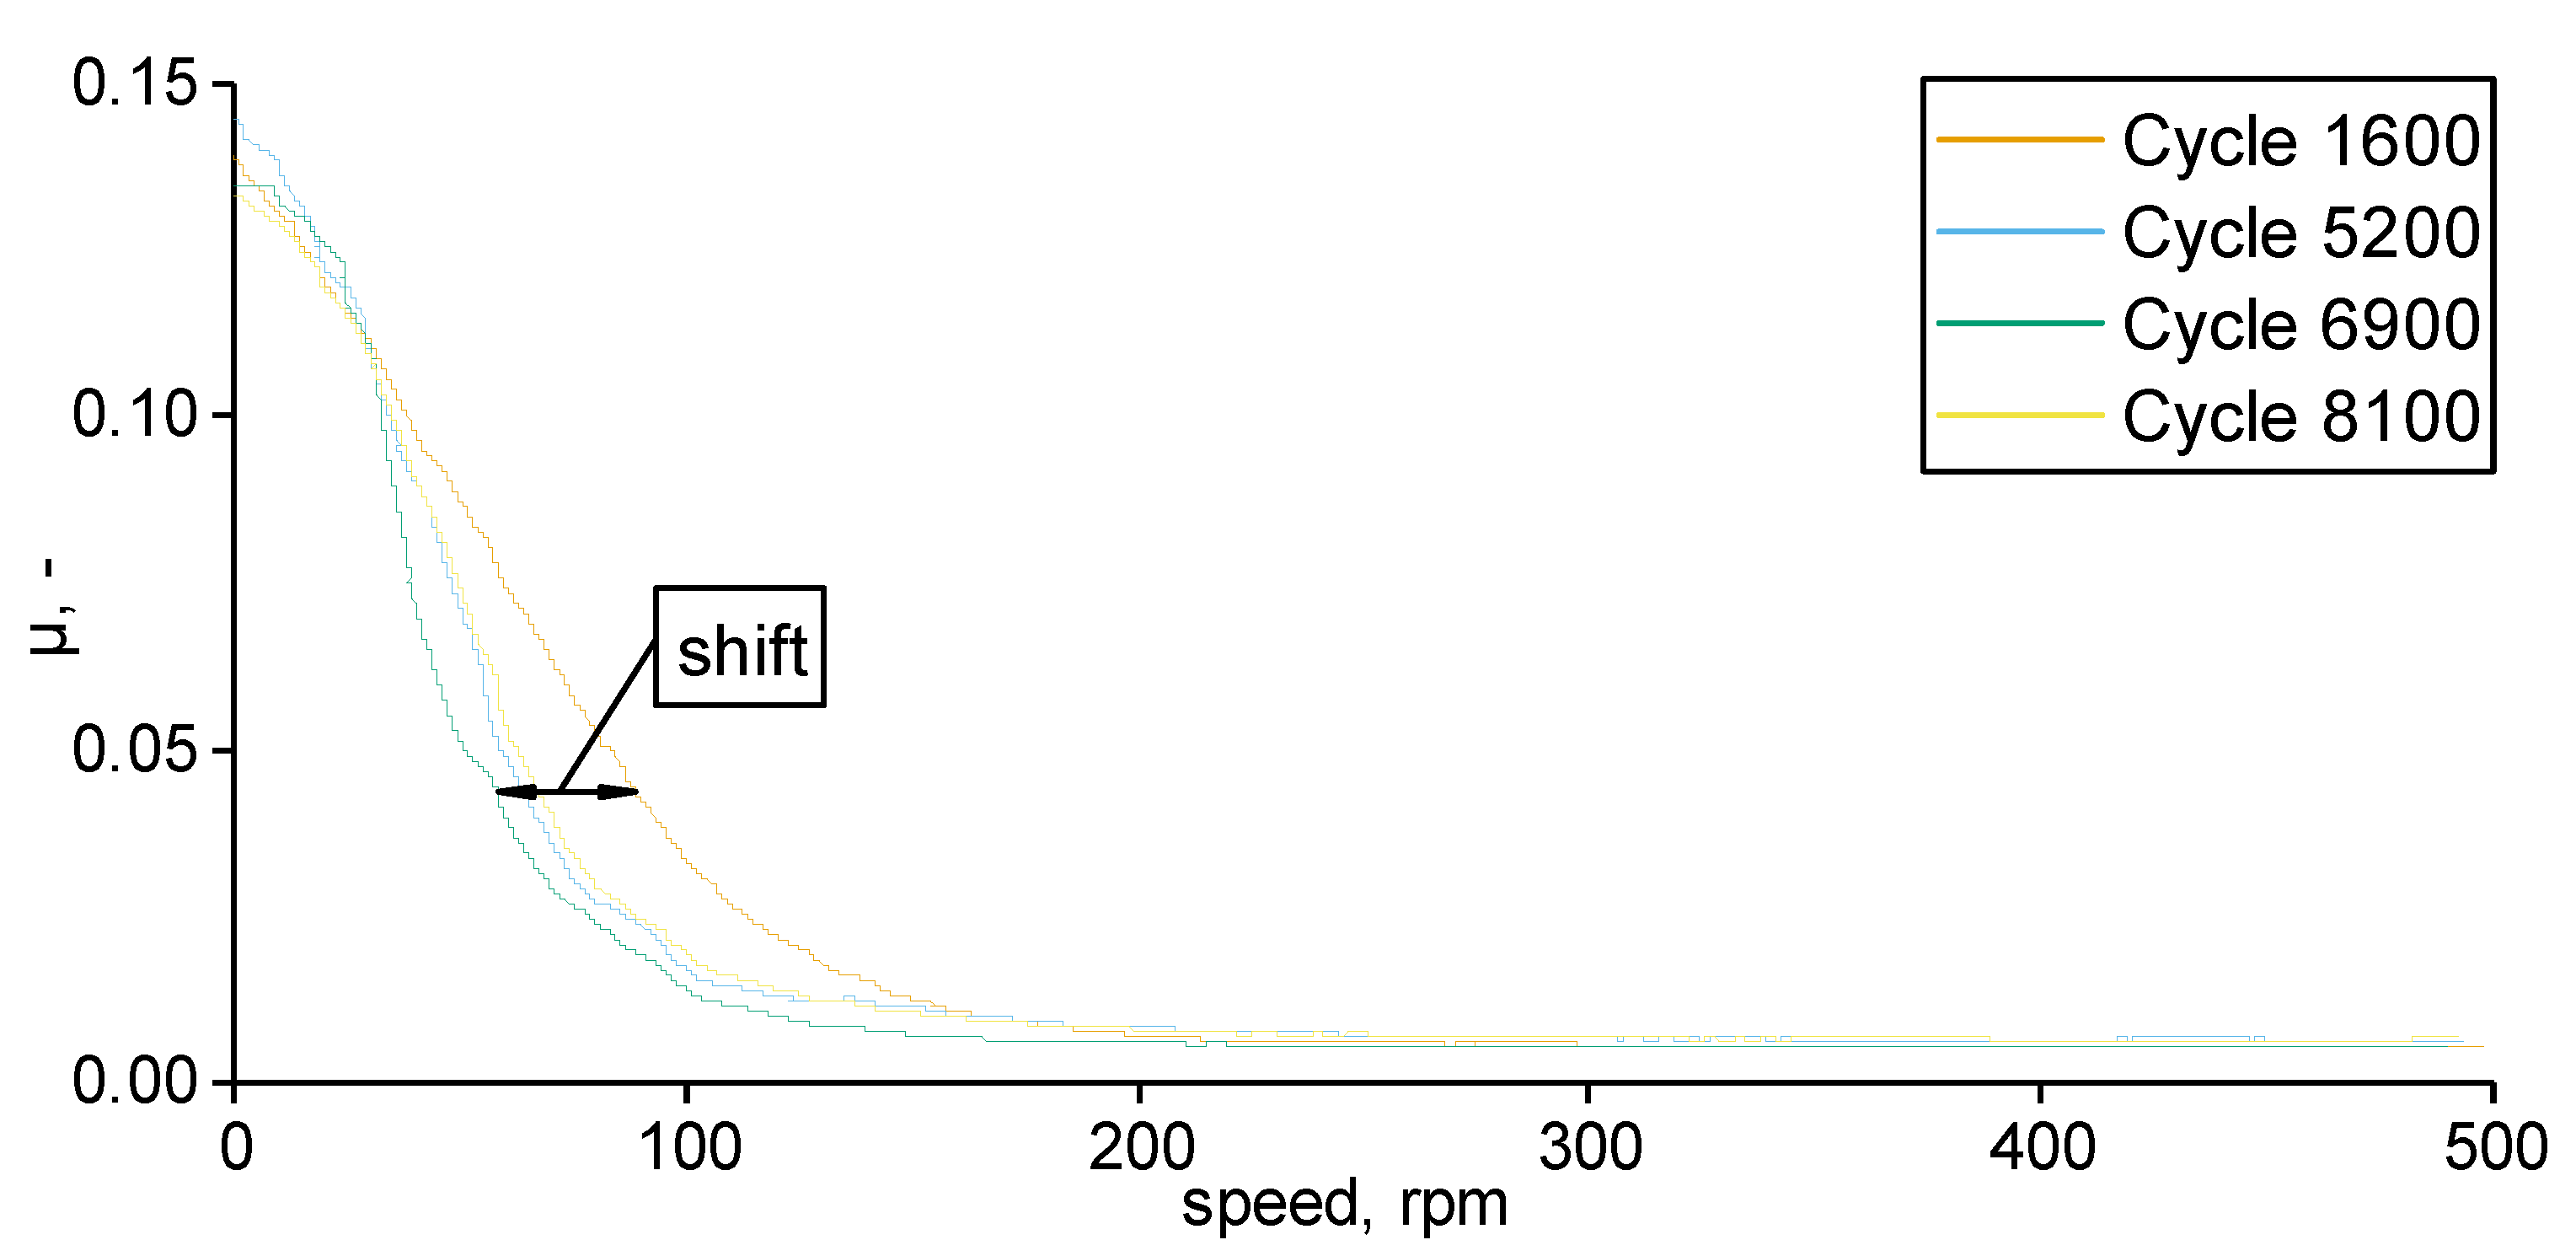
- The evolution of the stribeck curve in mixed friction can be explained by the proposed wear mechanism.
Author Contributions
Funding
Conflicts of Interest
References
- Rubtsov, V.E.; Kolubaev, E.A.; Kolubaev, A.V.; Popov, V.L. Using acoustic emission for the analysis of wear processes during sliding friction. Tech. Phys. Lett. 2013, 39, 223–225. [Google Scholar] [CrossRef]
- Baranov, V.M.; Kudryavtsev, E.M.; Sarychev, G.A. Modelling of the parameters of acoustic emission under sliding friction of solids. Wear 1997, 202, 125–133. [Google Scholar] [CrossRef]
- Hase, A.; Mishina, H.; Wada, M. Correlation between features of acoustic emission signals and mechanical wear mechanisms. Wear 2012, 292–293, 144–150. [Google Scholar] [CrossRef]
- Hase, A.; Wada, M.; Mishina, H. Scanning electron microscope observation study for identification of wear mechanism using acoustic emission technique. Tribol. Int. 2014, 72, 51–57. [Google Scholar] [CrossRef]
- Mirhadizadeh, S.A.; Moncholi, E.P.; Mba, D. Influence of operational variables in a hydrodynamic bearing on the generation of acoustic emission. Tribol. Int. 2010, 43, 1760–1767. [Google Scholar] [CrossRef] [Green Version]
- Nagata, M.; Fujita, M.; Yamada, M.; Kitahara, T. Evaluation of tribological properties of bearing materials for marine diesel engines utilizing acoustic emission technique. Tribol. Int. 2012, 46, 183–189. [Google Scholar] [CrossRef]
- Eftekharnejad, B.; Carrasco, M.R.; Charnley, B.; Mba, D. The application of spectral kurtosis on Acoustic Emission and vibrations from a defective bearing. Mech. Syst. Signal Process. 2011, 25, 266–284. [Google Scholar] [CrossRef] [Green Version]
- Deshpande, P.; Pandiyan, V.; Meylan, B.; Wasmer, K. Acoustic emission and machine learning based classification of wear generated using a pin-on-disc tribometer equipped with a digital holographic microscope. Wear 2021, 152, 203622. [Google Scholar] [CrossRef]
- Bergmann, P.; Grün, F.; Summer, F.; Godor, I.; Stadler, G. Expansion of the Metrological Visualization Capability by the Implementation of Acoustic Emission Analysis. Adv. Tribol. 2017, 2017, 17. [Google Scholar] [CrossRef] [Green Version]
- Loutas, T.H.; Sotiriades, G.; Kalaitzoglou, I.; Kostopoulos, V. Condition monitoring of a single-stage gearbox with artificially induced gear cracks utilizing on-line vibration and acoustic emission measurements. Appl. Acoust. 2009, 70, 1148–1159. [Google Scholar] [CrossRef]
- Eftekharnejad, B.; Mba, D. Seeded fault detection on helical gears with acoustic emission. Appl. Acoust. 2009, 70, 547–555. [Google Scholar] [CrossRef] [Green Version]
- van Hecke, B.; Yoon, J.; He, D. Low speed bearing fault diagnosis using acoustic emission sensors. Appl. Acoust. 2016, 105, 35–44. [Google Scholar] [CrossRef]
- Dwyer, R. Detection of non-Gaussian signals by frequency domain Kurtosis estimation. In Proceedings of the ICASSP ’83. IEEE International Conference on Acoustics Speech, and Signal Processing, Boston, MA, USA, 14–16 April 1983; pp. 607–610. [Google Scholar] [CrossRef]
- Antoni, J. The spectral kurtosis: A useful tool for characterising non-stationary signals. Mech. Syst. Signal Process. 2006, 20, 282–307. [Google Scholar] [CrossRef]
- Saidi, L.; Ben Ali, J.; Bechhoefer, E.; Benbouzid, M. Wind turbine high-speed shaft bearings health prognosis through a spectral Kurtosis-derived indices and SVR. Appl. Acoust. 2017, 120, 1–8. [Google Scholar] [CrossRef]
- Song, W.J.; Cha, D.J. Temporal kurtosis of dynamic pressure signal as a quantitative measure of combustion instability. Appl. Therm. Eng. 2016, 104, 577–586. [Google Scholar] [CrossRef]
- Liang, K.; Zhao, M.; Lin, J.; Jiao, J.; Ding, C. Maximum average kurtosis deconvolution and its application for the impulsive fault feature enhancement of rotating machinery. Mech. Syst. Signal Process. 2021, 149, 107323. [Google Scholar] [CrossRef]
- Combet, F.; Gelman, L. Optimal filtering of gear signals for early damage detection based on the spectral kurtosis. Mech. Syst. Signal Process. 2009, 23, 652–668. [Google Scholar] [CrossRef]
- Affenzeller, J.; Gläser, H. Lagerung und Schmierung von Verbrennungsmotoren; Springer: Berlin/Heidelberg, Germany, 1996. [Google Scholar]
- Renhart, P.; Summer, F.; Grün, F.; Posch, C.; Eder, A. The tribological performance of silver in aircraft turbine load cases. Tribol. Int. 2021, 163, 107184. [Google Scholar] [CrossRef]
- Renhart, P.; Summer, F.; Grün, F.; Eder, A. Close-to-Application Test Methodology Validated by a Baseline Study for Novel Bearing Developments in Aircraft Turbines. Lubricants 2020, 8, 7. [Google Scholar] [CrossRef] [Green Version]
- ÖNORM EN ISO 266:1997 11 01. Available online: https://shop.austrian-standards.at/action/de/public/details/58214/OENORM_EN_ISO_266_1997_11_01;jsessionid=A157FD8B75F612D7A52979AD5E14C27F (accessed on 1 June 2021).
- Bergmann, P.; Grün, F.; Gódor, I.; Stadler, G.; Maier-Kiener, V. On the modelling of mixed lubrication of conformal contacts. Tribol. Int. 2018, 125, 220–236. [Google Scholar] [CrossRef]
- Greenwood, J.A.; Tripp, J.H. The contact of two nominally flat rough surfaces. Proc. Inst. Mech. Eng. 1970, 185, 625–633. [Google Scholar] [CrossRef]
- Bravo, A.E.; Durán, H.A.; Jacobo, V.H.; Ortiz, A.; Schouwenaars, R. Towards new formulations for journal bearing alloys. Wear 2013, 302, 1528–1535. [Google Scholar] [CrossRef]


| Description | Parameter | Value | Description | Parameter | Value |
|---|---|---|---|---|---|
| Load | 249 N | Static friction | 0.125 | ||
| Clearance | 1.6‰ | Kin. viscosity | 5 mm | ||
| Speed range | n | 0–500 rpm | Density | 0.940 kg/m | |
| Stiffness | k | 20 kN/m | Groove | 0–15 µm |
Publisher’s Note: MDPI stays neutral with regard to jurisdictional claims in published maps and institutional affiliations. |
© 2021 by the authors. Licensee MDPI, Basel, Switzerland. This article is an open access article distributed under the terms and conditions of the Creative Commons Attribution (CC BY) license (https://creativecommons.org/licenses/by/4.0/).
Share and Cite
Renhart, P.; Maier, M.; Strablegg, C.; Summer, F.; Grün, F.; Eder, A. Monitoring Tribological Events by Acoustic Emission Measurements for Bearing Contacts. Lubricants 2021, 9, 109. https://doi.org/10.3390/lubricants9110109
Renhart P, Maier M, Strablegg C, Summer F, Grün F, Eder A. Monitoring Tribological Events by Acoustic Emission Measurements for Bearing Contacts. Lubricants. 2021; 9(11):109. https://doi.org/10.3390/lubricants9110109
Chicago/Turabian StyleRenhart, Philipp, Michael Maier, Christopher Strablegg, Florian Summer, Florian Grün, and Andreas Eder. 2021. "Monitoring Tribological Events by Acoustic Emission Measurements for Bearing Contacts" Lubricants 9, no. 11: 109. https://doi.org/10.3390/lubricants9110109
APA StyleRenhart, P., Maier, M., Strablegg, C., Summer, F., Grün, F., & Eder, A. (2021). Monitoring Tribological Events by Acoustic Emission Measurements for Bearing Contacts. Lubricants, 9(11), 109. https://doi.org/10.3390/lubricants9110109