Article

Understanding Friction in Cam–Tappet Contacts—An Application-Oriented Time-Dependent Simulation Approach Considering Surface Asperities and Edge Effects

by
Christian Orgeldinger
* and
Stephan Tremmel
Engineering Design and CAD, University of Bayreuth, 95447 Bayreuth, Germany
*
Author to whom correspondence should be addressed.
Lubricants 2021, 9(11), 106; https://doi.org/10.3390/lubricants9110106
Submission received: 27 August 2021 / Revised: 19 September 2021 / Accepted: 8 October 2021 / Published: 26 October 2021
(This article belongs to the Special Issue Tribology in Mobility)

Abstract

:
With the increasing challenges of climate change and scarce resources, the development of sustainable and energy-efficient technical systems is becoming increasingly important. In many applications, the friction losses occurring in contacts have a decisive influence on the overall efficiency. At this point, tribological contact optimization can make an important contribution to increasing the efficiency of technical systems. However, improvements are often associated with a considerable experimental effort. To reduce the development time, additional simulation models can be applied to predict the tribological behavior. This requires the closest possible approximation of the real contact within a numerical model. This paper presents a simulation approach for the time-dependent simulation of a cam–tappet contact. The simulation uses realistic operating conditions as they arise in the valve train of internal combustion engines. The influence of edge effects on the friction behavior is considered by a scaled calculation area and the influence of the surface roughness is investigated using stochastic asperity models. It is shown that the tribological behavior within the contact strongly depends on the surface properties and the load spectrum used. In addition, edge effects on the sides of the contact area have a clear influence on the pressure and film thickness distribution.

1. Introduction

In recent years, the effects of climate change have become increasingly apparent, and with them, society’s interest in sustainable action has grown. In order to meet the climate targets that have been set, global energy consumption and greenhouse gas emissions have to be reduced significantly in the coming years. To achieve this, the energy efficiency of technical systems must be further improved, with tribological aspects also becoming increasingly important. According to Holmberg, one fifth of the world’s energy consumption is currently needed to overcome friction, and it can be assumed that around 40% could be reduced in the long term [1]. In the short term, the most significant savings are expected in the transportation sector, where nearly one-third of fuel energy is lost in friction processes, excluding braking [2]. The shift toward electromobility is currently evident in the automotive sector, where CO2 emissions could ideally be reduced by a factor of 4.5 [3]. However, this only applies if the electricity used is generated completely from renewable sources. Realistically, this might be possible only in a few countries, and even there, only within the next decades. As climate change is a global challenge, more efficient internal combustion engines (ICE) will be needed in the coming years [4,5]. Since a complete switch to electromobility is not feasible for resource reasons alone, alternative fuels, such as hydrogen, could become relevant in the combustion sector [6].Considering these aspects, the development of more efficient internal combustion engines will remain an important research focus in the upcoming years.
The valve train has particular potential for optimization, as it accounts for up to one third of the friction losses in an ICE, depending on the operating state [2]. While an optimal choice of lubricant is essential at high speeds, friction at low speeds can be reduced by suitable surface treatment or coating [7]. Due to the high proportion of friction within the valve train, there is a potential for savings, especially in the cam–tappet contact. In order to understand the contact conditions, experimental work has been concerned with determining the contact normal forces, lubrication gap heights or time-dependent friction values [8,9]. Experimental work by Kano [10] and Dobrenizki [11] investigated the potential for the friction reduction of DLC coatings in cam–tappet contacts under conditions close to the application on model test rigs. Marian [12] examined the influence of surface textures on friction behavior in addition to DLC coatings, demonstrating an improved friction behavior in both cases. The experiments were further compared with numeric simulations. The influence of axial cam geometry on friction behavior was investigated by Mabuchi [13], with friction being lowest for a flat cam shape with a high contact ratio. Although significant improvements were achieved in this way and were applied in industrial applications, purely experimental optimization tests typically entail a high level of effort. For this reason, numerical approaches where the friction behavior in cam–tappet contacts can be investigated with reduced experimental effort have become increasingly popular in recent years. Over the years, different modeling approaches have been developed depending on the aspects of the contact under investigation.
Among the first numerical descriptions of cam–tappet contact, the works of Ai [14] and Dowson [15] deserve special mention. Messé [16] investigated the influence of transient effects at the circumferential points of the contact using a simulation model along the lines of Lubrecht [17]. Another simplified approach to predict the friction force in the contact at different cam angles was developed by Teodorescu [18]. This calculation is based on the well-known models of Dowson and Higginson [19] and additionally takes into account non-newtonian fluid properties and boundary friction effects. Wang [20] studied the thermal effects on an idealized eccentric cam contact. The temperature change was significant, especially for zero entrainment velocity, with the increase overestimated by the newtonian model used. The model was further extended to include harmonic surface roughness, which was applied to the eccentric cam contact on one and both sides [21]. A significant variation in the lubrication gap, pressure distribution, temperature distribution and coefficient of friction over the cycle was observed, with the fluctuations becoming stronger with a shorter wavelength. A simulation close to the application was presented by Chong [22] for the cam–tappet contact of a valve train with a bottom-mounted camshaft according to the North American emission test cycle. The results showed a good agreement in terms of the friction description in comparison with industrial experience. In contrast to the previously mentioned work, Raisin [23] simulated the thermal line contact in a time-dependent manner using the full-system approach presented by Habchi [24,25,26] using a finite element method (FEM) and commercial FEM software. The focus was on the description of shear thinning, thermal softening and transient effects. However, smooth surfaces were assumed for the calculation. Wu [27] also investigated the influence of different cam base circle radii for smooth surfaces and compared the results with isothermal simulations. Accordingly, small radii resulted in very small lubrication gap heights, with the risk that the lubrication gap could collapse. Based on these findings, the authors provided recommendations for the optimization of the cam–tappet mechanism in general. A reduced-order model for the calculation of the elastohydrodynamic lubricated (EHL) line contact was developed by Tsuha [28] in order to speed up the prediction of the most important output variables, such as the minimum lubrication gap height and pressure at the central point of the contact. For the cam–roller follower contact, a FEM-based approach was developed by Shirzadegan [29], which also, in contrast to most works, not only describes the central line contact but also considers edge effects in the axial cam direction. The simulation investigates the contact under both steady-state and real transient conditions, but the surfaces in contact were assumed to be smooth. The authors showed that the edge effects lead to a smoother pressure distribution in the contact area. Recently, existing simulation models have also been used to further investigate the tribological optimization potential in cam–tappet contacts. For example, Yu [30] investigated the influence of different coatings on tribological contact behavior. Meng [31] analyzed the significance of the thermal insulation effect during start-up from the hot and cold states for the initial cam cycles. The author described that the friction losses during a cold start-up are significantly higher than the losses during a warm start-up, and that a coating generally reduces the friction losses due to thermal insulation. Lyu [32] considered the surface asperities of the contact partners for the investigation of coated cam–tappet contacts and evaluated the resulting fluid friction and solid friction for different rough surfaces, as well as coated and uncoated contacts. Depending on the roughness and coating, the resulting friction forces differed significantly, with the influence of solid-state friction clearly exceeding that of fluid friction in all cases. The simulations were performed for a camshaft speed of 2000 rpm. The authors describe the complex relationship of roughness on friction and wear. The potential of a coating to reduce friction was also investigated by Marian [12] and supported by experiments on a model test rig. At the same time, the author described the potential of micro-textures on the surface of the tappet to reduce friction. Through a TEHL simulation, it was demonstrated that a coating leads to a reduction in solid and fluid friction, and texturing reduces solid friction while slightly increasing fluid friction. The simulations included a detailed description of the mechanisms of microtextures on the lubrication [33]. Further, the work of Torabi [34] should be mentioned, in which, in addition to the purely elastic deformation, the plastic deformation of the surface asperities during running-in is included. It was concluded that the rate of flattening has a decisive influence on the run-in behavior. Finally, Tang [35] recently investigated the influence of the cam rotational speed on lubricant film formation. Here, a lower rotational speed resulted in lower maximum temperatures in the contact and a higher coefficient of friction at the same time. The mentioned papers addressed crucial aspects in the numerical description of the cam–tappet contact. However, to the best of the authors’ knowledge, the influence of the surface asperities in combination with a real geometry description with edge effects has not been investigated so far in detail.
Hence, in this work, existing simulation models are further developed in such a way that a description of the real component contact under transient conditions at different speeds is enabled to be as close as possible to the application. The focus is on the description of possible edge effects at the axial ends of the cam. The wear patterns on tappet surfaces produced in tests suggest that these could have an increased influence on the tribological performance. The description of edge effects is realized through a scaled calculation area. Further, it will be examined to what extent the description of the surface shape affects the simulation results. Thermal effects will not be considered in order to allow for a stable and time-efficient calculation. In principle, thermal effects can be considered with the used simulation approach (compare e.g., Marian [36] in another context). The simplification seems appropriate at this point, as the focus is on a quantitative description of edge effects and roughness influences, and no coating is modeled. It can be shown that lateral edge effects have a significant influence on the formation of the lubrication gap and the resulting pressure distribution. In addition, it becomes apparent that the surface roughness of the contacting bodies is a decisive factor that exceeds many other influencing variables, in some cases by orders of magnitude. Therefore, special attention must be given to the roughness description.

2. Materials and Methods

In the following, the procedure for the simulation of the cam–tappet contact is presented. In addition to the description of the load spectrum used and the assumed fluid properties, the main focus is on the structure of the modified simulation model according to the full system approach [24]. Special attention is paid to the three-dimensional modelling of the contact.

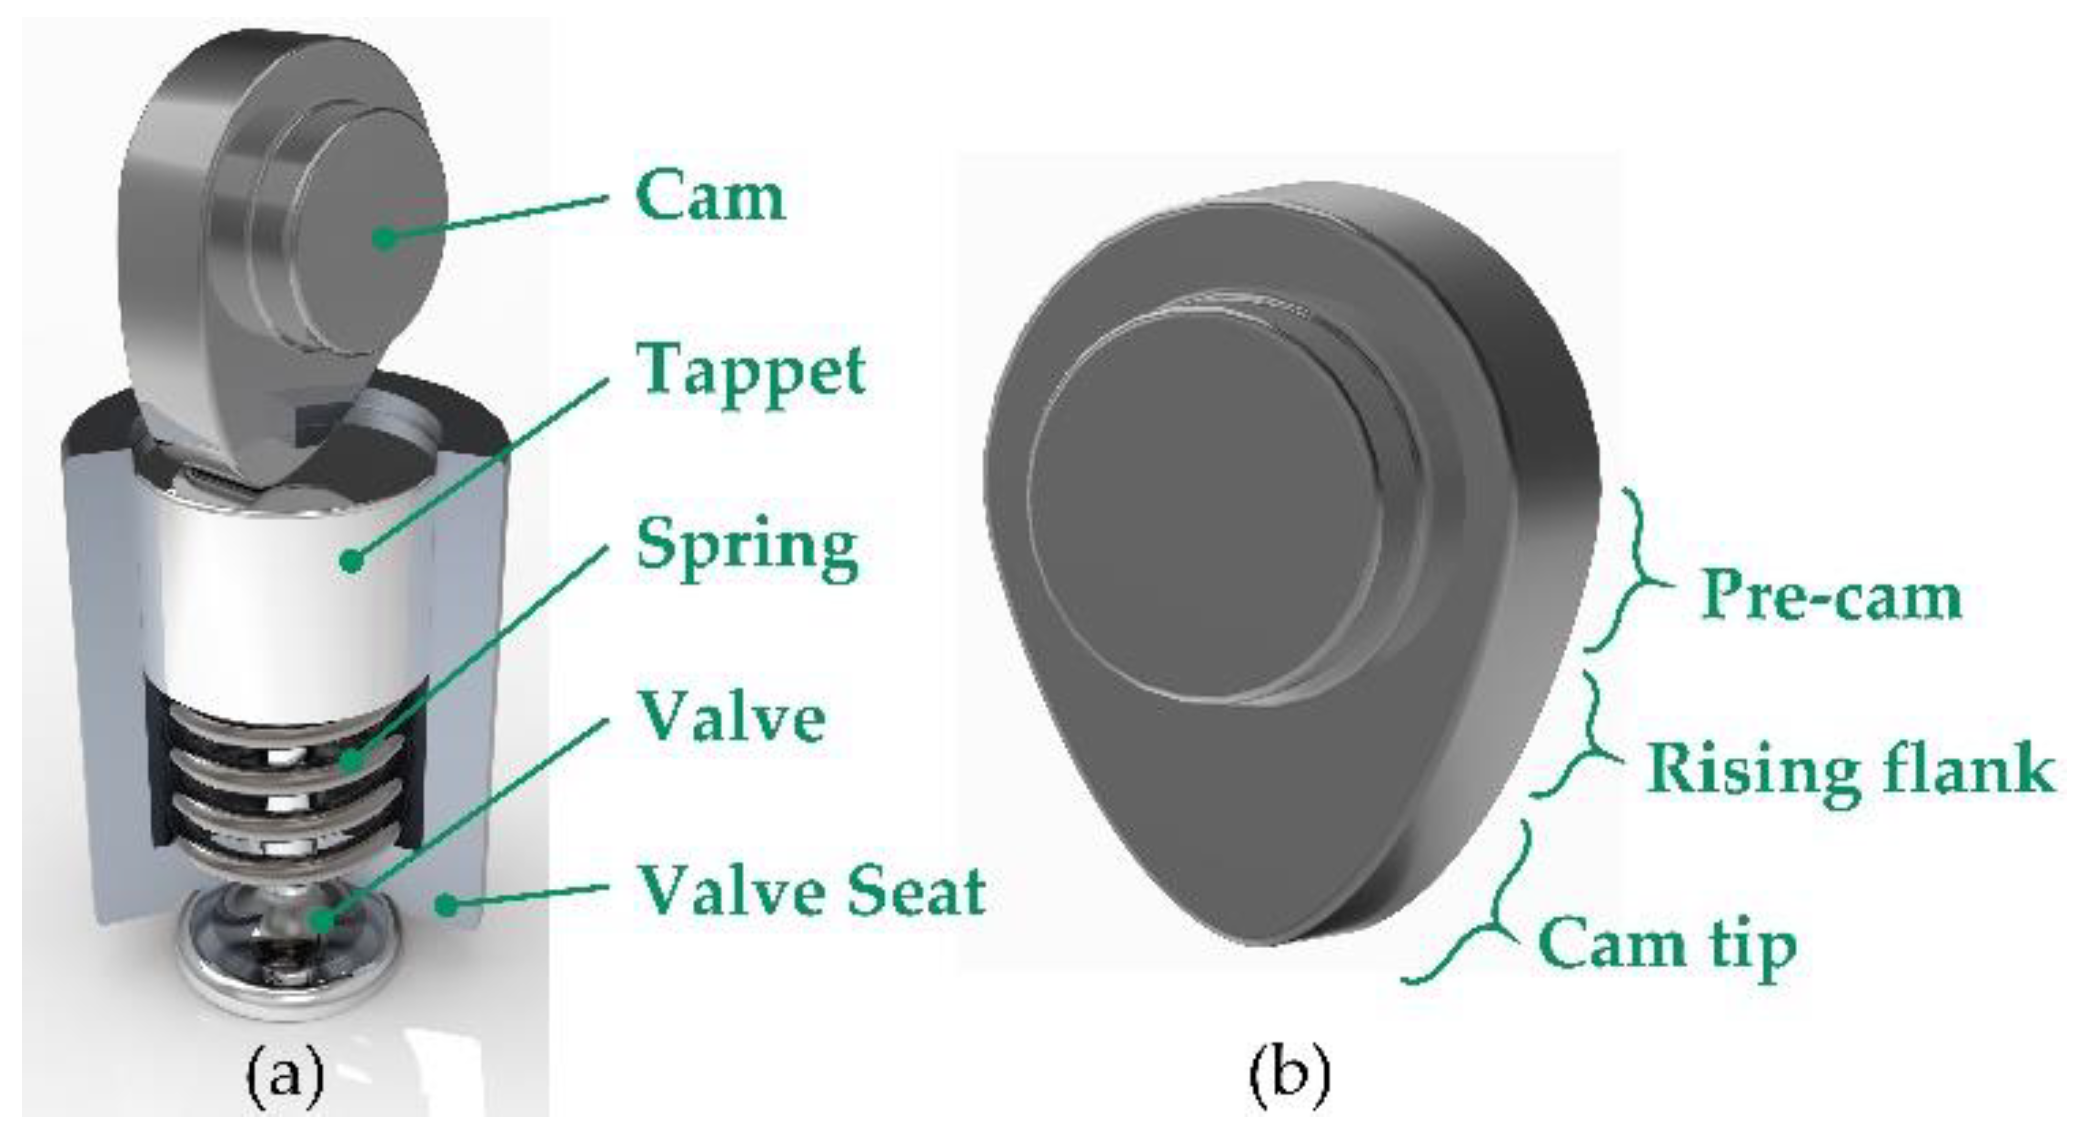
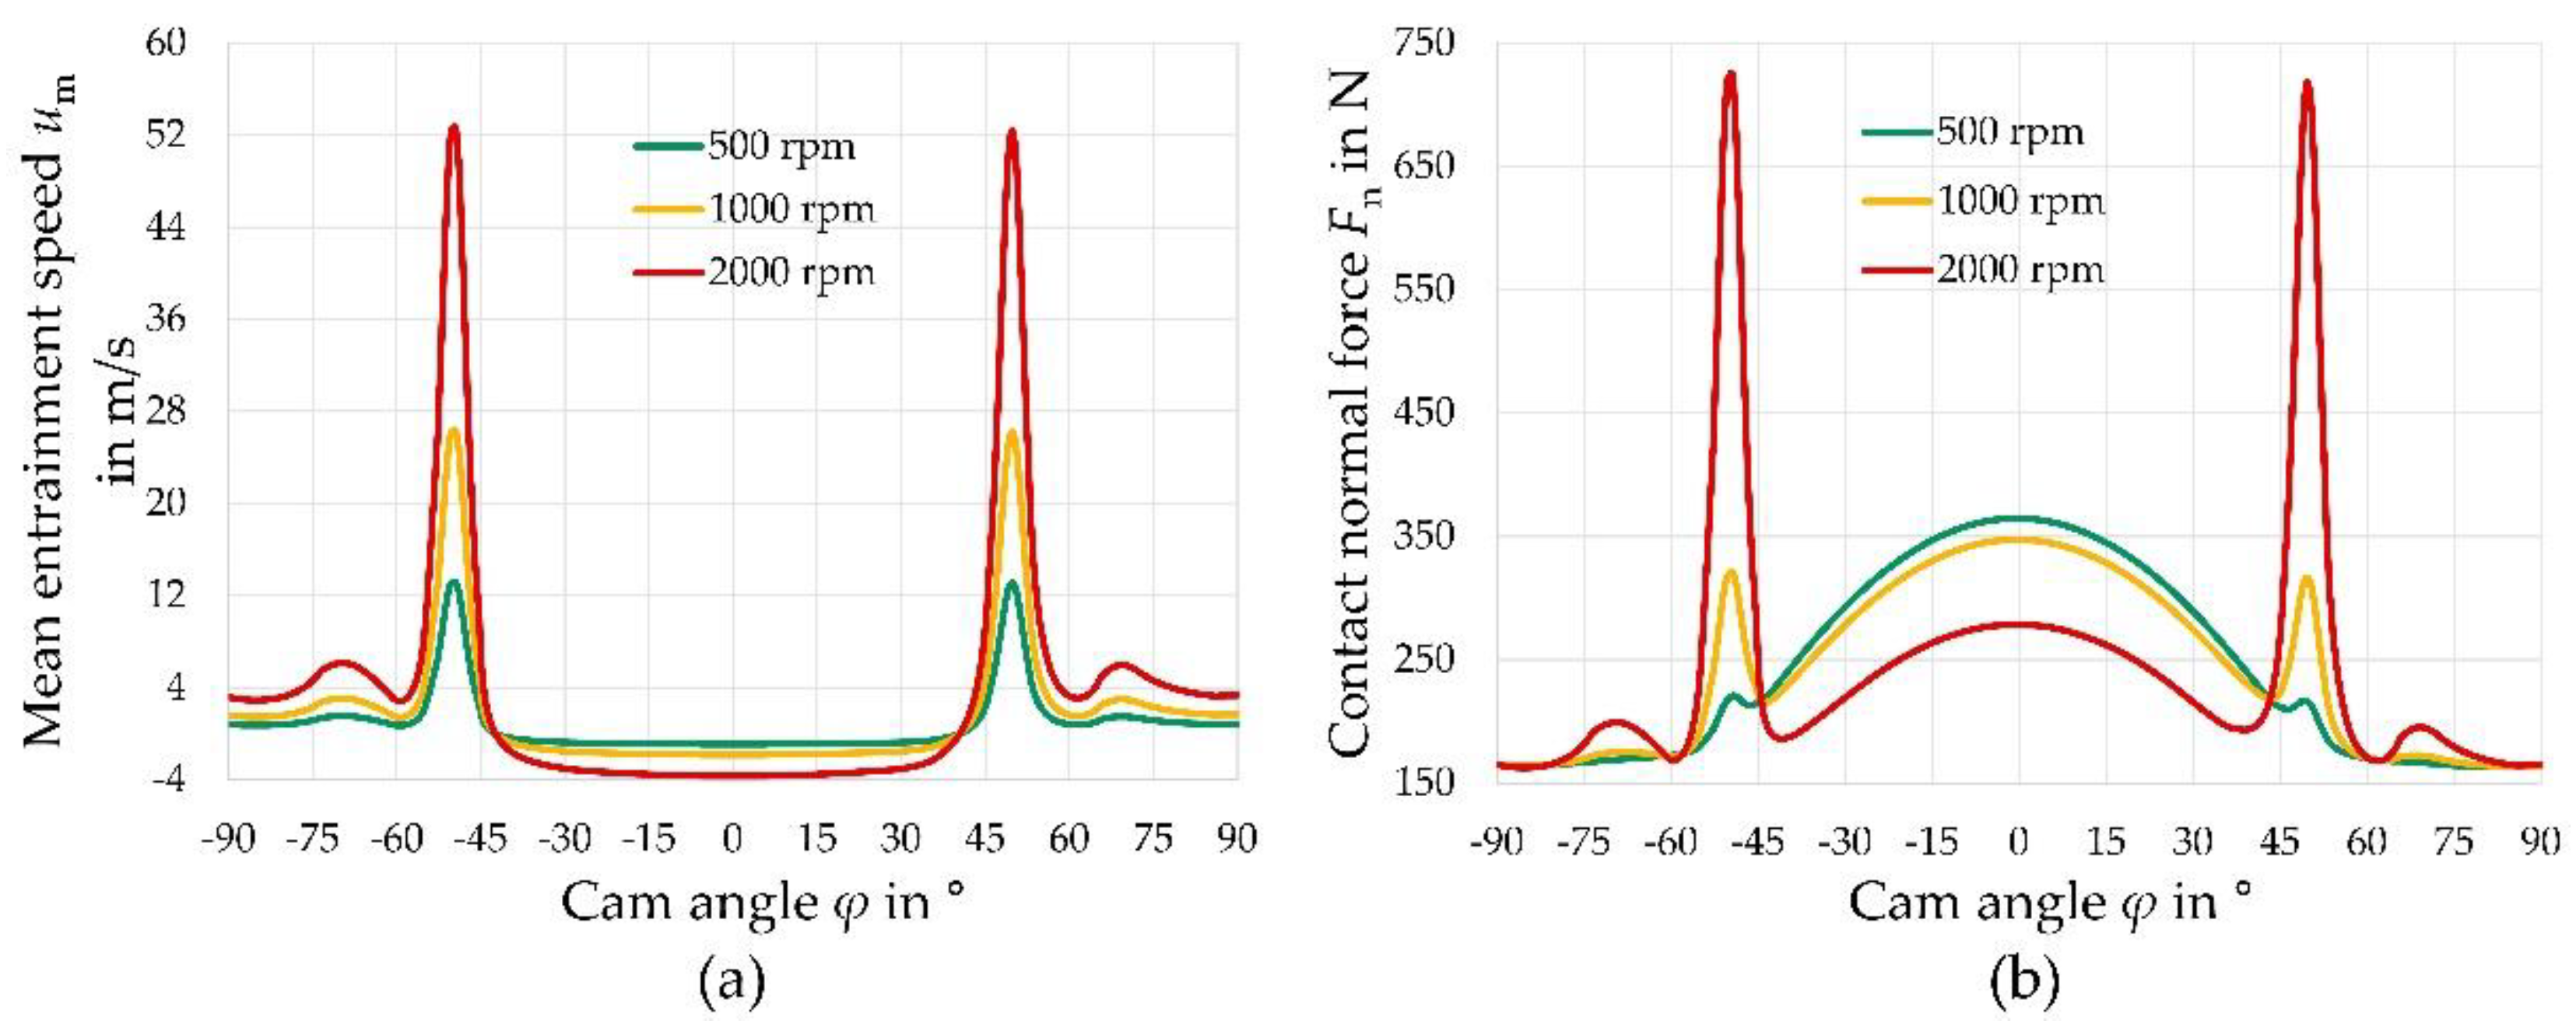
2.1. Load Spectrum of the Cam–Tappet Contact

To ensure the best possible transferability to the application, a typical cam–tappet combination was assumed, as it has been used in preliminary experimental works [12,37,38]. The schematic structure of the analyzed contact is shown in Figure 1.
The tappet was made of steel 16MnCr5 with a Young’s modulus of 216 GPa and a Poisson’s ratio of 0.3. A classical camshaft steel 100Cr6 with a Young’s modulus of 209 GPa was used for the cam. The load spectrum of the cam–tappet contact is generally highly dynamic and results from the interaction of spring force, cam geometry, cam speed and inertia effects. The cam cycle is usually divided into the pre-cam, rising flank and cam tip sections. Load spectrum and cam geometry (angle dependent radius) used in this work have been determined by Weschta [38] in a dynamics simulation for a camshaft speed of 500 rpm, 1000 rpm and 2000 rpm. The curves of mean entrainment speed u m and contact normal force F n are shown in Figure 2. The maximum mean entrainment velocities occurred in the area of the rising flank. Depending on the load case and the resulting dynamics, the contact normal force reached its maximum in the cam tip contact or in the area of the rising flank.
In the literature, cam–tappet contacts are usually calculated as two-dimensional line contacts. However, this approximation to the planar distortion state applies only in the middle of the contact area. To model the edge geometries, the lateral radii of the cam were approximated by a simple 2nd order polynomial function. In the areas outside the central line contact with Y > L 2   and   Y < L 2 , where L is the contact length and Y is the dimensionless coordinate in y-direction, the edges were described by
E g ( Y ) = 10 ( | Y | L 2 ) 2 .
The coefficient was set in the dimensionless so that the curvatures match those of typical cams in industrial application. In preliminary tests, the amount of curvature did not seem to have a major influence on the friction forces.

2.2. Fluid Properites

The fluid properties used in the work are summarized in Table 1. In order to simulate the properties of a typical engine oil and, at the same time, ensure reproducibility, the fluid data were based on a FVA 3 reference oil. A lubricant temperature of 70 °C was assumed. The non-newtonian fluid properties were described by a Carreau model [39] modified by Bair [40], which describes the viscosity using two newtonian plateaus. Since the high pressures in contact also affect the fluid properties, these were considered by frequently used approaches. The pressure-dependent density was implemented according to Dowson and Higginson [19] and the viscosity according to a model presented by Roelands [41].

2.3. Numerical Modelling

The calculation of the cam–tappet contact was performed using the full-system FEM approach first presented by Habchi [24,25], where the calculation of the EHL contact problem is carried out by a simultaneous solution of the hydrodynamics and the deformation of the elastic bodies by means of structural mechanics. The simulation is implemented with the commercial software Comsol Multiphysics. For a more detailed description of the simulation approach, the interested reader is referred to the corresponding literature [24,42]. The use of commercial software offers the advantage that existing calculation modules can be used, and the focus can therefore be on the exact description of the real contact with lower numerical implementation effort. The most important aspects of the simulation model are summarized in the following.

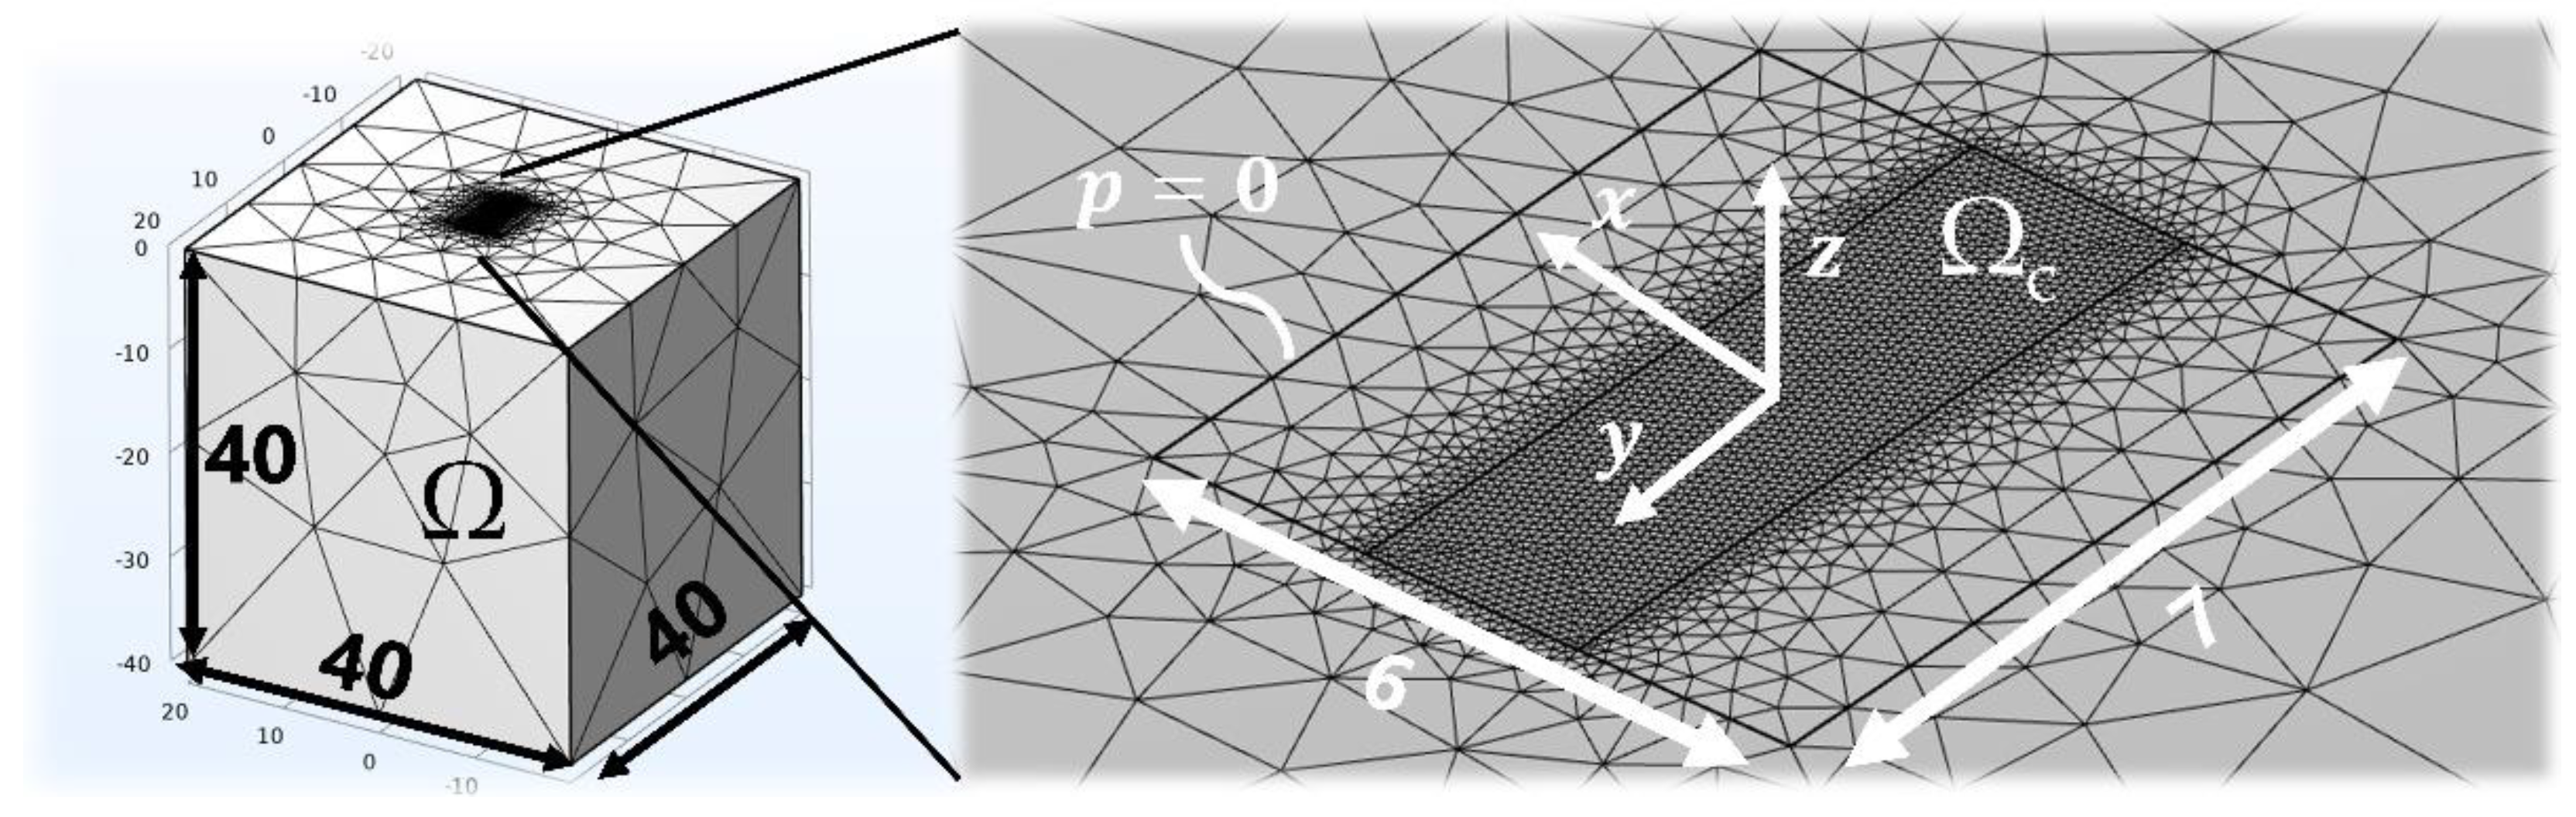
2.3.1. Dimensionless Scaling of the Contact Area

Since the quantities to be solved in the contact sometimes differ by several orders of magnitude, the contact problem was entirely solved in dimensionless quantities. The normalization was carried out to the quantities of the simple Hertzian [43] line contact b H e r t z and p H e r t z in the central contact area, as well as the reference fluid properties ρ 0 and η 0 . All quantities were also normalized on the load conditions at the reference time t r e f . The choice of the reference time is crucial for numerical stability, since it must be ensured that the computational domain can capture the relevant processes within the scaled finite element mesh at all time steps. In addition, the time-dependent load variables should not deviate too much from those at the reference point in order to not generate numerical instabilities. Temporal changes in contact force F n , mean velocity u m and cam radius R were accounted for via correction factors in the corresponding equations, as presented in Tan [44]. The dimensionless variables were thus as follows:
X = x b H e r t z , Y = y b H e r t z S ,   Z = z b H e r t z , P = p p H e r t z ,   H = h R b H e r t z 2 ,   ρ ¯ = ρ ρ 0 ,   η ¯ = η η 0 ,   T = t u m b H e r t z , C u ( T ) = u m ( T ) u m ( T r e f ) ,   C R ( T ) = R ( T ) R ( T r e f )   ,   C F = F n ( T ) F n ( T r e f ) .
For elastic deformation, the Young’s modulus and the Poisson’s ratio must also be normalized accordingly. Since the calculation of the finite line contact in this form leads to a very long calculation area in y-direction with a correspondingly high simulation effort because of the used mesh, the y-axis was compressed by a scaling factor S , as described by Winkler [45]. The scaling was thus directly included in the calculation of structural mechanics and hydrodynamics. The degree of compression has a great influence on the numerical stability. For the existing problem, a scaled edge length of 6   b H e r t z was adequate, whereby the edge areas were extended by 0.5   b H e r t z on both sides to simulate the edge effects in a stable manner. In x-direction, the contact area was set to a length of 6   b H e r t z . This resulted in the calculation area shown in Figure 3, where the meshing in the central contact area was chosen to be finer, with a maximum element size of 0.1   b H e r t z   A maximum element size of 1 b H e r t z was allowed in the outer contact area, with a limit on the maximum growth rate. This meshing has been found to be sufficiently fine in previous mesh refinement studies. It should be mentioned that the very dynamic conditions for the 2000 rpm load case resulted in a partially significantly enlarged contact area. Therefore, the calculation area for this case was extended to a length of 10   b H e r t z in x-direction in order to ensure a stable numeric solution for all timesteps.

2.3.2. Hydrodynamics

The hydrodynamics in the lubrication gap can be described with certain simplifications for EHL contacts via the Reynolds equation [46], which can be derived from the general form of the Navier–Stokes equations. In the context of this work, the Reynolds equation was used in a modified form according to Tan [44]. In dimensionless form, it can be written as
( H 3 ψ ρ ¯ η ¯   P ) ( C u ( T ) ρ ¯ H ) X ( ρ ¯ H ) T = 0 ,
where
ψ = 12 μ 0 u m R 2 b H e r t z 3 p H e r t z .
The first part of the equation describes the influence of the pressure gradient in x- and y-direction (Poiseuille term). The second part presents the wall velocity influence in x-direction, where time-dependent changes are considered via a correction factor C u (Couette term). Finally, the third part of the equation describes the influence of time-dependent squeeze effects. The hydrodynamics were solved on the central contact surface Ω c , shown enlarged in Figure 3. At the edges of the contact area, the following Dirichlet boundary condition was applied:
p = 0 , p x = 0 , p y = 0 .

2.3.3. Contact Mechanics

The calculation of the elastic deformation was performed by an existing Comsol FEM structural mechanics module, where the underlying equations were adapted accordingly in the y-direction of the scaling used. The linear elasticity equations
σ = 0 ,   w i t h   σ = C ε
were calculated under neglect of inertia effects. A Dirichlet boundary condition δ ( x , y , z , t ) = 0 was applied to the bottom of the calculation domain. The Neumann boundary condition was the total contact normal force on the surface. All other surfaces were defined by free boundary conditions.

2.3.4. Equilibrium of Forces

The balance between the pressure distribution on the surface and the total contact force must be fulfilled at all times. If the correction factor for the time-dependent load was applied, the equilibrium of forces can be written as
Ω c P t o t ( X , Y , T ) d Ω c = Ω c P ( X , Y , T ) + P s o l i d ( X , Y , T ) d Ω c = C F ( T ) π 2 L
in dimensionless form, with L being the dimensionless length of the contact in y-direction. In addition to the hydrodynamic pressure, the solid contact pressure must be considered, which is presented in more detail in Section 2.3.7.

2.3.5. Film Thickness Equation

The lubrication gap height equation describes the relationship between the lubrication gap height from the Reynolds equation and the geometric shape of the surface and its elastic deformation from structural mechanics. It is composed of the distance between the two undeformed bodies H 0 , the approximation of the undeformed surfaces, the approximation of the cam edge geometry E g outside the central line contact of 6   b H e r t z and the elastic deformation, and is
H ( X , Y , T ) = H 0 ( T ) + X 2 2 C R ( T ) + E g ( Y ) + δ ¯ ( X , Y , T )
in the dimensionless form. The time-dependent variation of the radius is considered by the factor C R .

2.3.6. Cavitation

The influence of cavitation was included in the simulation in this work by using a mass conservation cavitation model. For this purpose, as presented by Marian [47], a fractional film content
θ ( p ) = h liq h = e γ ( p ) p 2
is defined, which describes the ratio of lubrication gap height and total gap height via an exponential approach. The function γ ( p ) takes the value 0 for p > p c a v and, otherwise, a penalty factor ξ , which is a sufficiently large algebraic number. Density and viscosity are then determined via the fractional film content as
ρ = ρ liq θ ( p )   a n d   η = η l i q θ ( p ) ,
where the properties of the fluid ρ liq and η l i q in the non-cavitated state serve as a reference.

2.3.7. Mixed Lubrication

Since mixed lubrication may occur in many conditions in the investigated cam–tappet contact, the influence of surface roughness must be included. To reduce the simulation effort, a stochastic model by Zhao [48] was used. Its implementation is explained in the work of Marian [49] and is consistent with the approach of Masjedi and Khonsari [50]. The resulting solid contact pressure curves were then directly retrieved in the macroscopic simulation model. The total pressure is thus split into a hydrodynamic component and a solid component, as can be seen in Equation (5). In order to take the surface roughness into account for the pressure distribution, the Reynolds equation was additionally extended by flux factors, which were calculated as described by Patir and Cheng [51,52] for the surface pairing of cam and tappet and were stored as interpolated curves in the simulation. Therefore, the Reynolds equation from Equation (2) was simply expanded, where two pressure flow factors ϕ x and ϕ y adjust the Poiseuille term of the equation, and a shear flow factor ϕ s was included in the Couette term. For the simulation in this work, a combined surface roughness of σ = σ 1 2 + σ 2 2 = 0.1   μ m was first assumed, with the cam being the significantly rougher contact partner, with a preferred direction in surface texture resulting from the manufacturing process. The influence of the surface roughness is investigated in detail in this work. The solid-state contact pressure curve and flux factors used for the cam–tappet contact in this work are shown in Figure 4. Since the surface of the cam had a strongly direction-dependent shape due to the manufacturing process, this was considered in the flux factors. Therefore, the flux factors were chosen for a ratio of the x and y correlation lengths of γ = 9 in the x-direction and γ = 1 9 in the y-direction.

2.3.8. Numerical Implementation

The Reynolds equation was implemented in the weak form in Comsol, where an isotropic diffusion (ID) method [53] was used for numerical stability. The degree of stabilization was determined in such a way that a convergent solution of the numerically unstable problem is possible, but, at the same time, no relevant effects are smoothed. The solution was then calculated by a damped Newton method, and, for the time step control, a BDF method (backward differentiation formula) was used.

2.4. Target Values of the Simulation

In order to be able to evaluate the tribological behavior of the contact, further typical evaluation criteria were defined, in addition to the pressure and lubrication gap distributions. One relevant parameter is often the minimum lubrication gap at different points in time, as this is where wear is most likely to occur [54]. In some cases, the lubrication gap height at the contact center is also evaluated. The maximum pressure and the pressure at the contact center are also relevant. From these, conclusions can be drawn about the material stress. In order to understand the friction mechanisms in the contact, the analysis of the friction forces is particularly relevant. The fluid friction force
F R , f l u i d ( t ) = Ω c τ ( x , y , t ) d Ω c = Ω c η γ ˙ ( x , y , t ) d Ω c
is determined as described by Habchi [26] from the mean shear stress τ ( x , y , t ) in the lubrication gap at Z = 0.5 by integrating over the contact area. The shear stress is thus considered to be constant over the lubricant film height. The solid friction force
F R , s o l i d ( t ) = Ω c μ p s o l i d ( x , y , t ) d Ω c
is obtained from integration over the solid contact pressure, assuming a coefficient of friction of μ = 0.1 for a typical boundary friction steel/steel contact. The total resulting friction force is
F R ( t ) = F R , f l u i d ( t ) + F R , s o l i d ( t ) .
By renormalizing with the contact area, the friction forces can also be evaluated quantitatively for comparison with experimental data.

3. Results

The following is a summary of the most important results of the simulation. In addition to considering edge effects in the pressure and lubricant gap distributions, the focus is primarily on the resulting friction forces at different speeds and for different surface roughness.

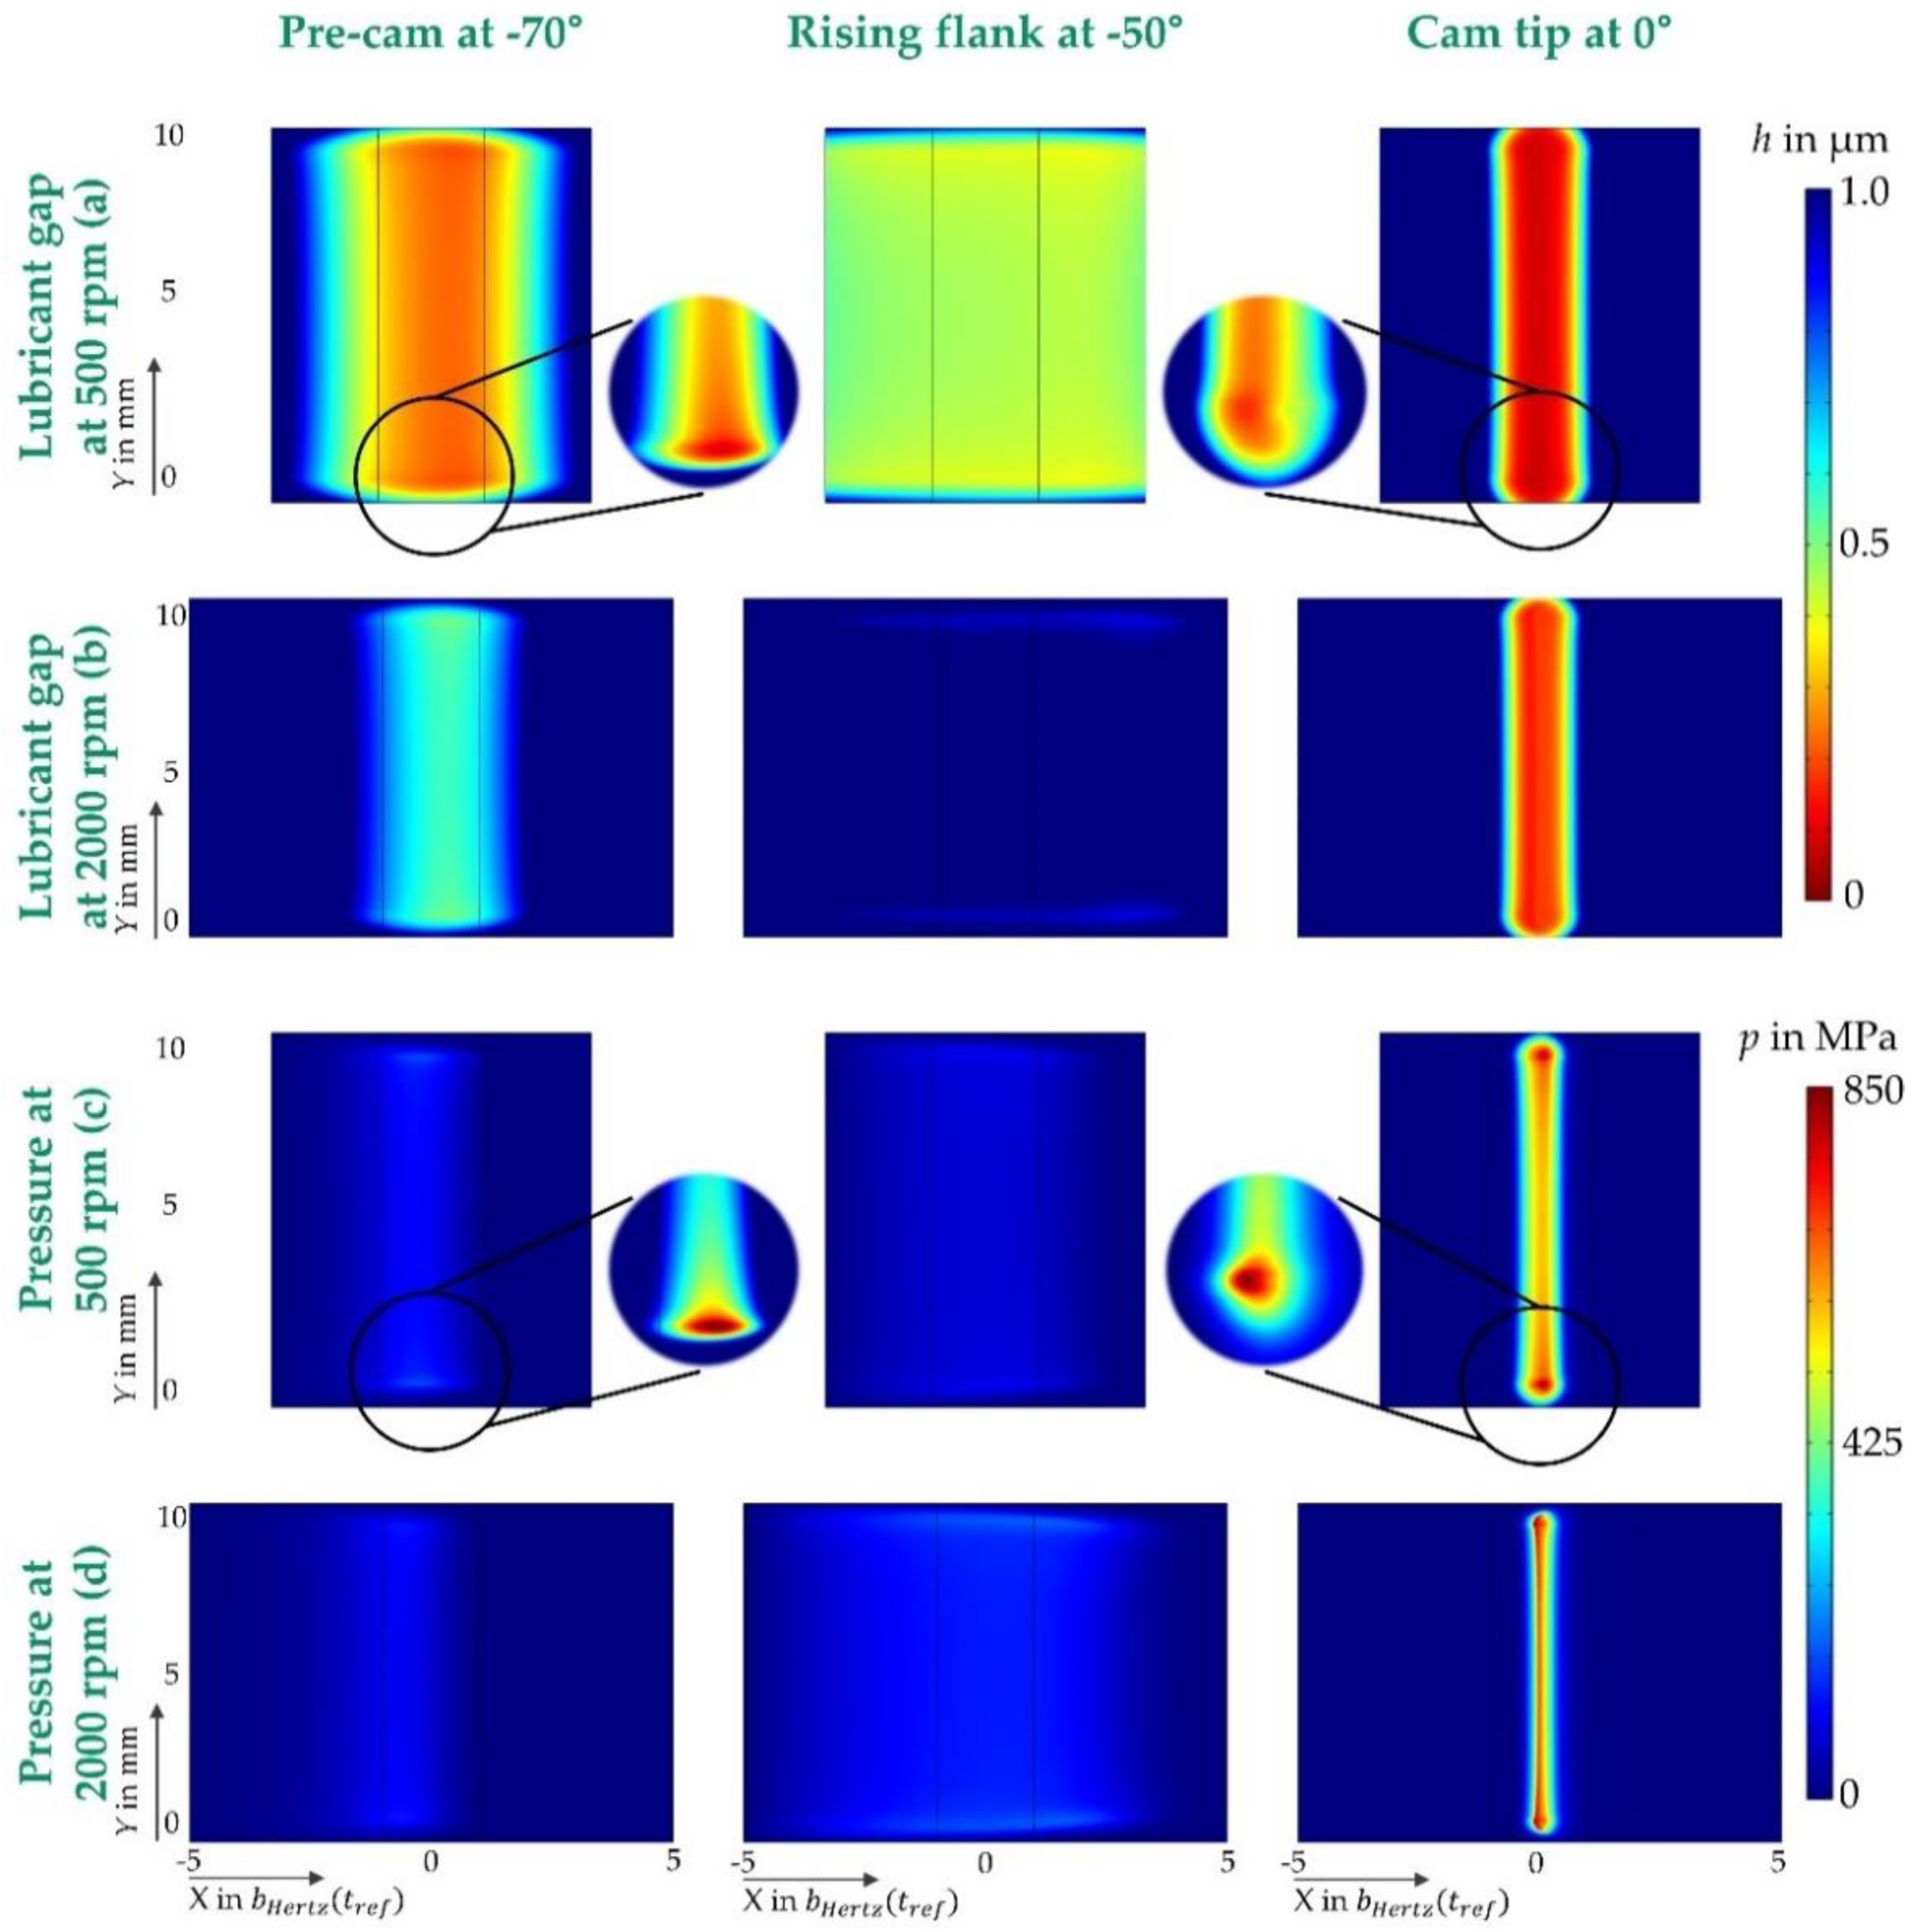
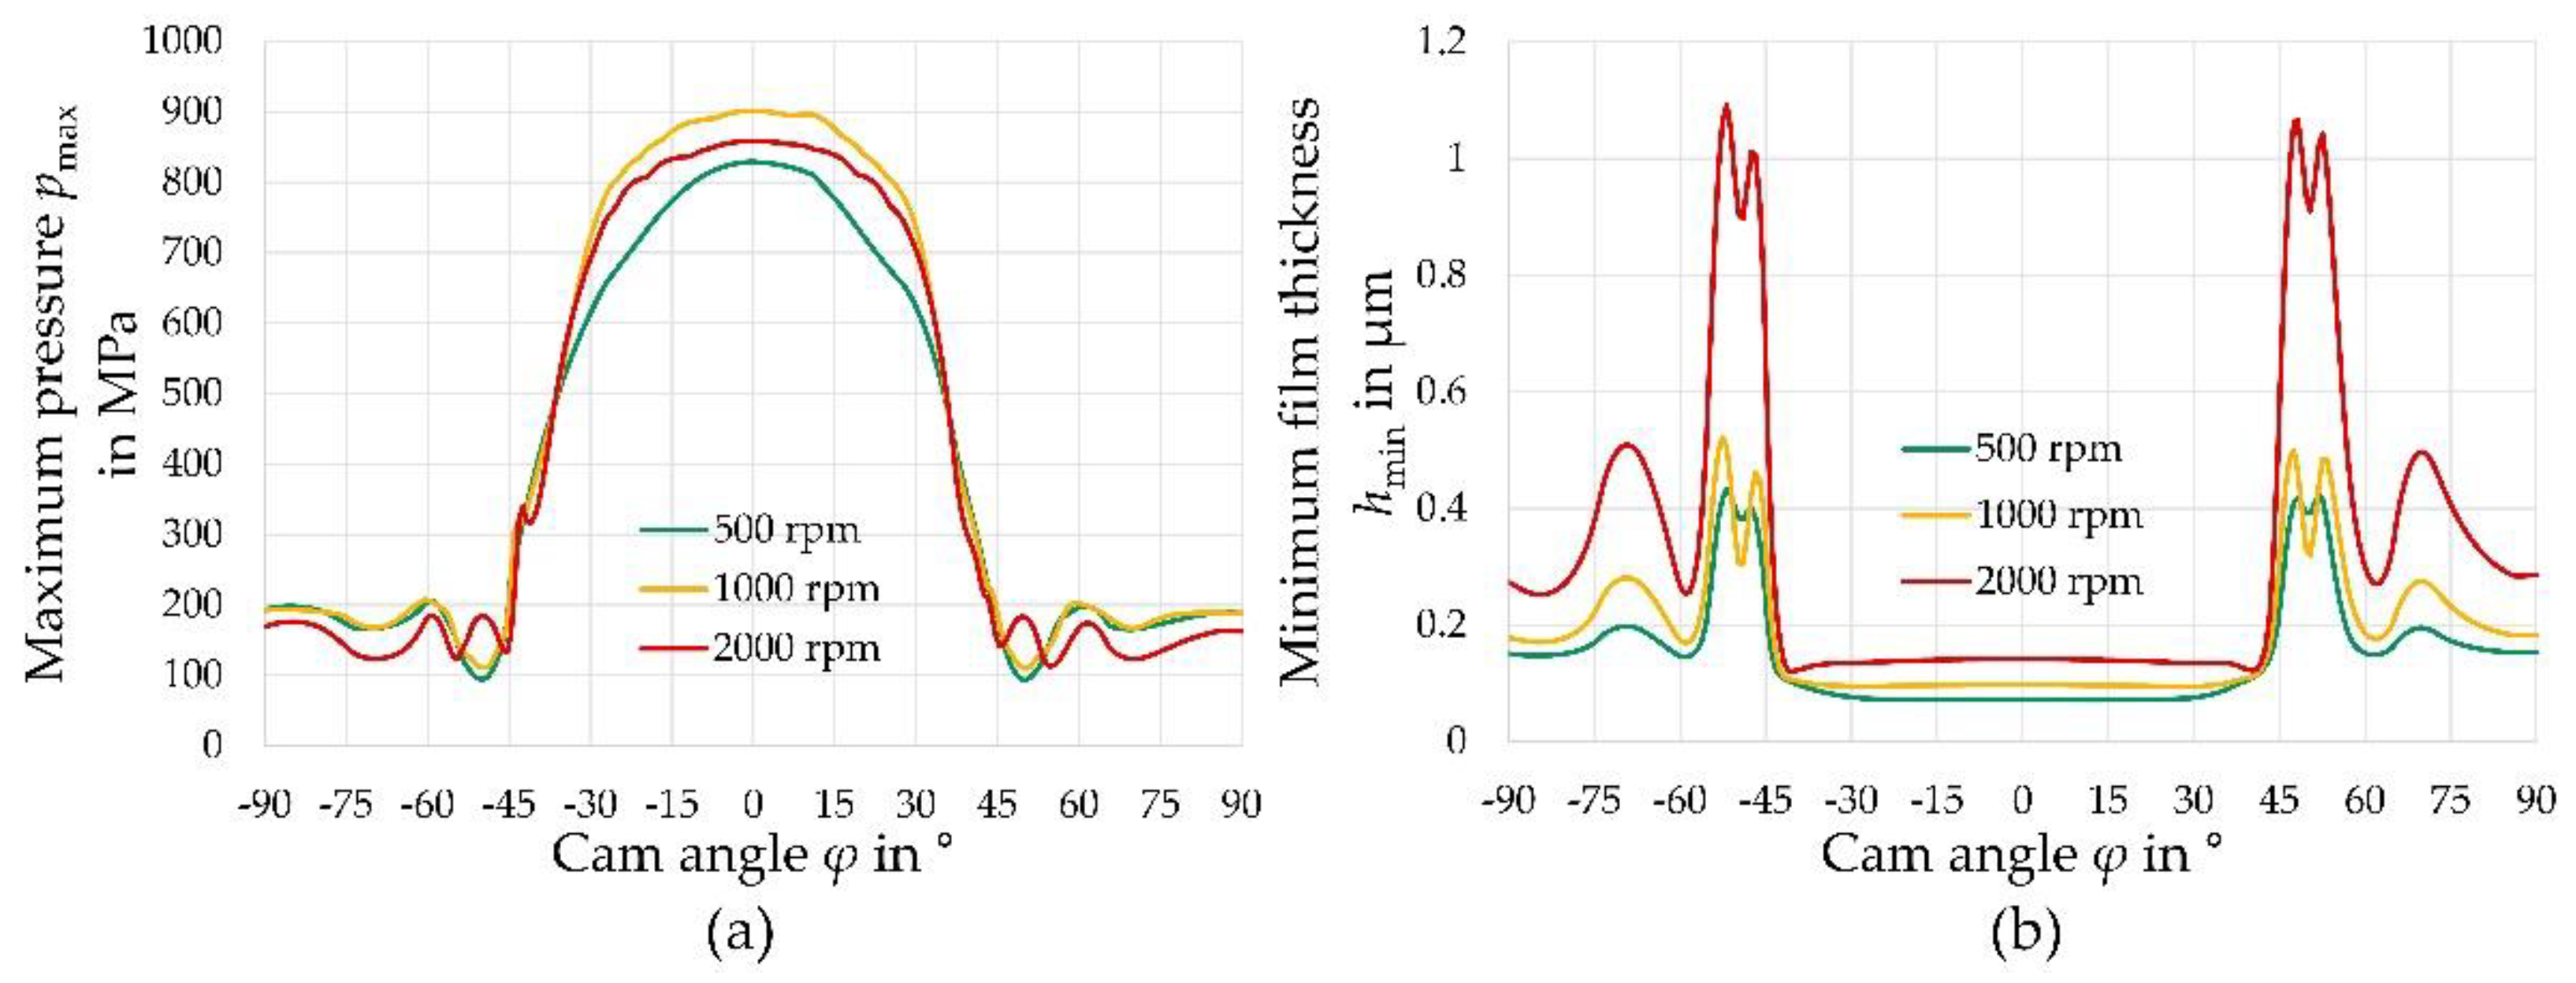
3.1. Pressure and Lubriant Gap Distribution

The time-dependent distribution of the pressure and lubrication gap height in the cam–tappet contact is an important criterion for describing the influence of edge effects. Figure 5 shows these for three selected points for the 500 rpm and the 2000 rpm load cases. It should be mentioned that, due to the scaling of all quantities to the reference condition, the dimensionless contact widths varied over time, and that the calculation area for the 2000 rpm load case was chosen to be larger, as described in Section 2.3.1. The contact area was significantly increased in the area of the pre-cam, and especially on the rising flank, due to the larger radii at these points. As a result, the pressure dropped significantly. The maximum pressure occurred at both speeds in the cam tip contact, with the lubrication gap reaching its minimum. The significantly higher sliding speeds at 2000 rpm favored the lubricant film buildup, which is why the lubricant gap was enlarged at all of the points in time that were evaluated. The pressure distribution, on the other hand, was approximately similar for both load cases, whereas, in the central contact area, a uniform distribution of the pressure and lubrication gap was formed, which is to be expected for line contacts, and the film build-up in the lateral edge areas deviated significantly. At the edges, there were thus an additional narrowing of the lubrication gap and a simultaneous increase in pressure. The effect was independent of the load case and could also be seen clearly over the complete cam cycle, including the times presented in Figure 5.
The differences between the individual load cases could also be demonstrated in the time courses. Figure 6 shows the maximum pressure and the minimum lubrication gap plotted over a half cam cycle. The pressure curves did vary between the individual load cases, but not to the extent that would be expected according to the normal force curves. The minimum lubricant film, on the other hand, increased significantly with an increasing speed, as expected. It should be noted that, strictly speaking, the curves given directly represent the values in the edge areas, since this is precisely where the minimum lubricant film and the maximum pressure occur (see Figure 5).

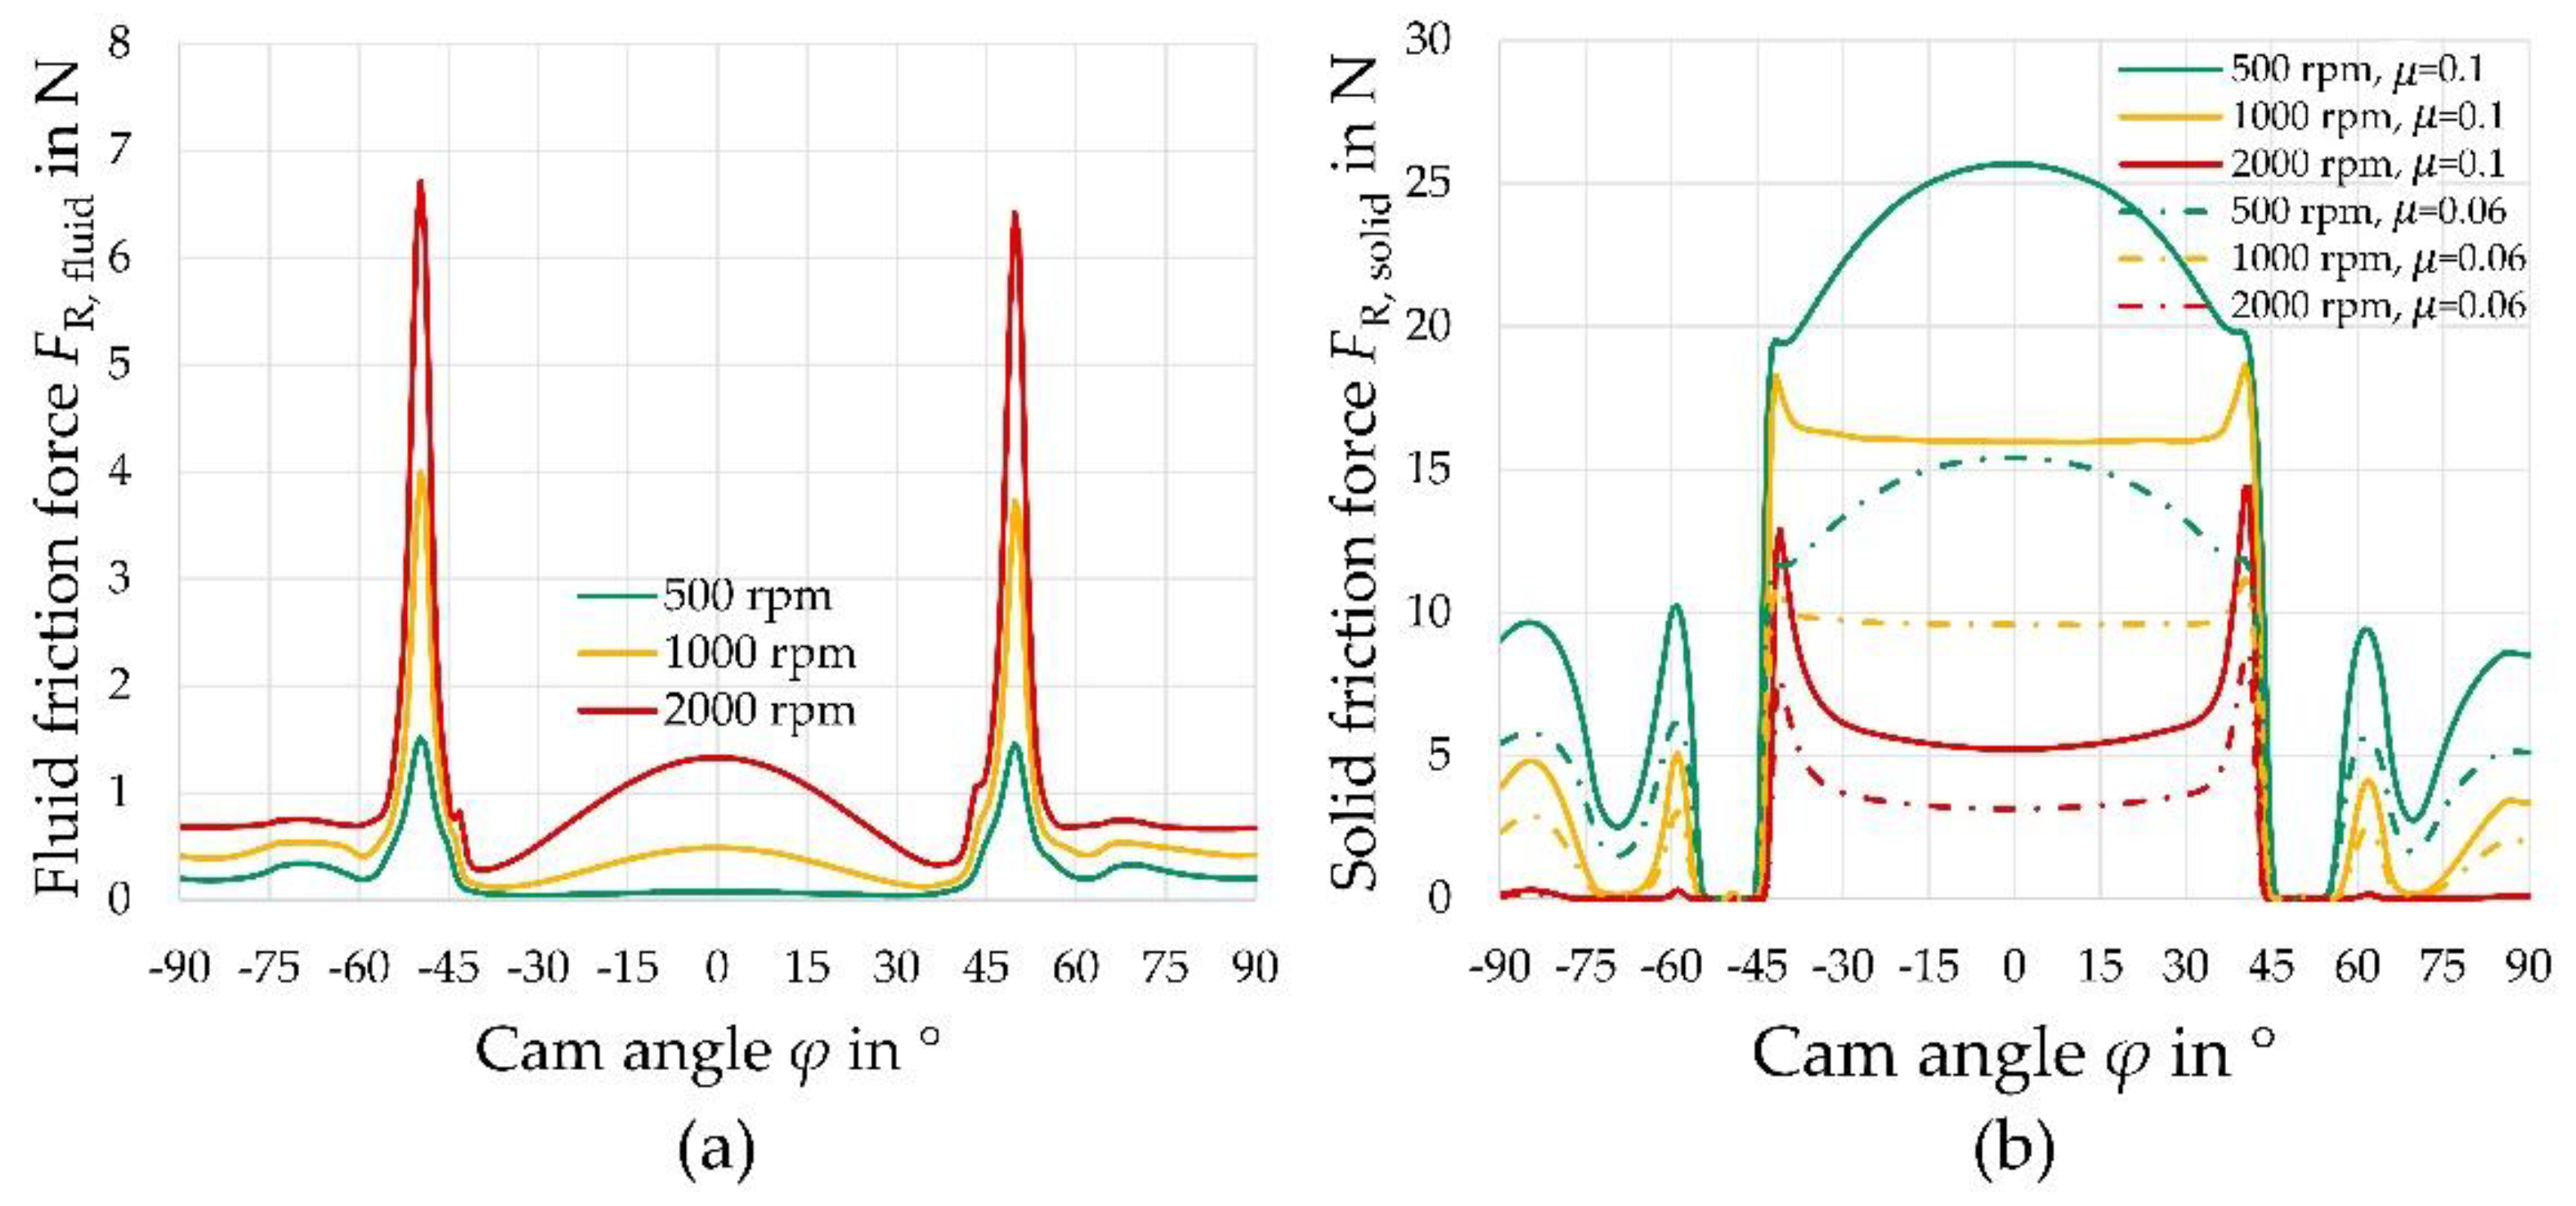
3.2. Friction in the Cam–Tappet Contact

To understand the friction and wear mechanisms, the expected friction forces are of central importance. These are shown in Figure 7 for the load cases considered, with a division in the fluid friction and solid friction.
Solid-state friction was dominant in all load cases and occurred mainly in the cam tip contact and in the pre-cam area. Only in the 2000 rpm load case was the speed high enough to build up a sufficiently large fluid film in the pre-cam and prevent solid-state friction. Only in the leading edge was a supporting lubricant film formed due to the large radius, and fluid friction predominated. In general, fluid friction increased with an increasing speed, whereas solid friction decreased significantly at the same time.

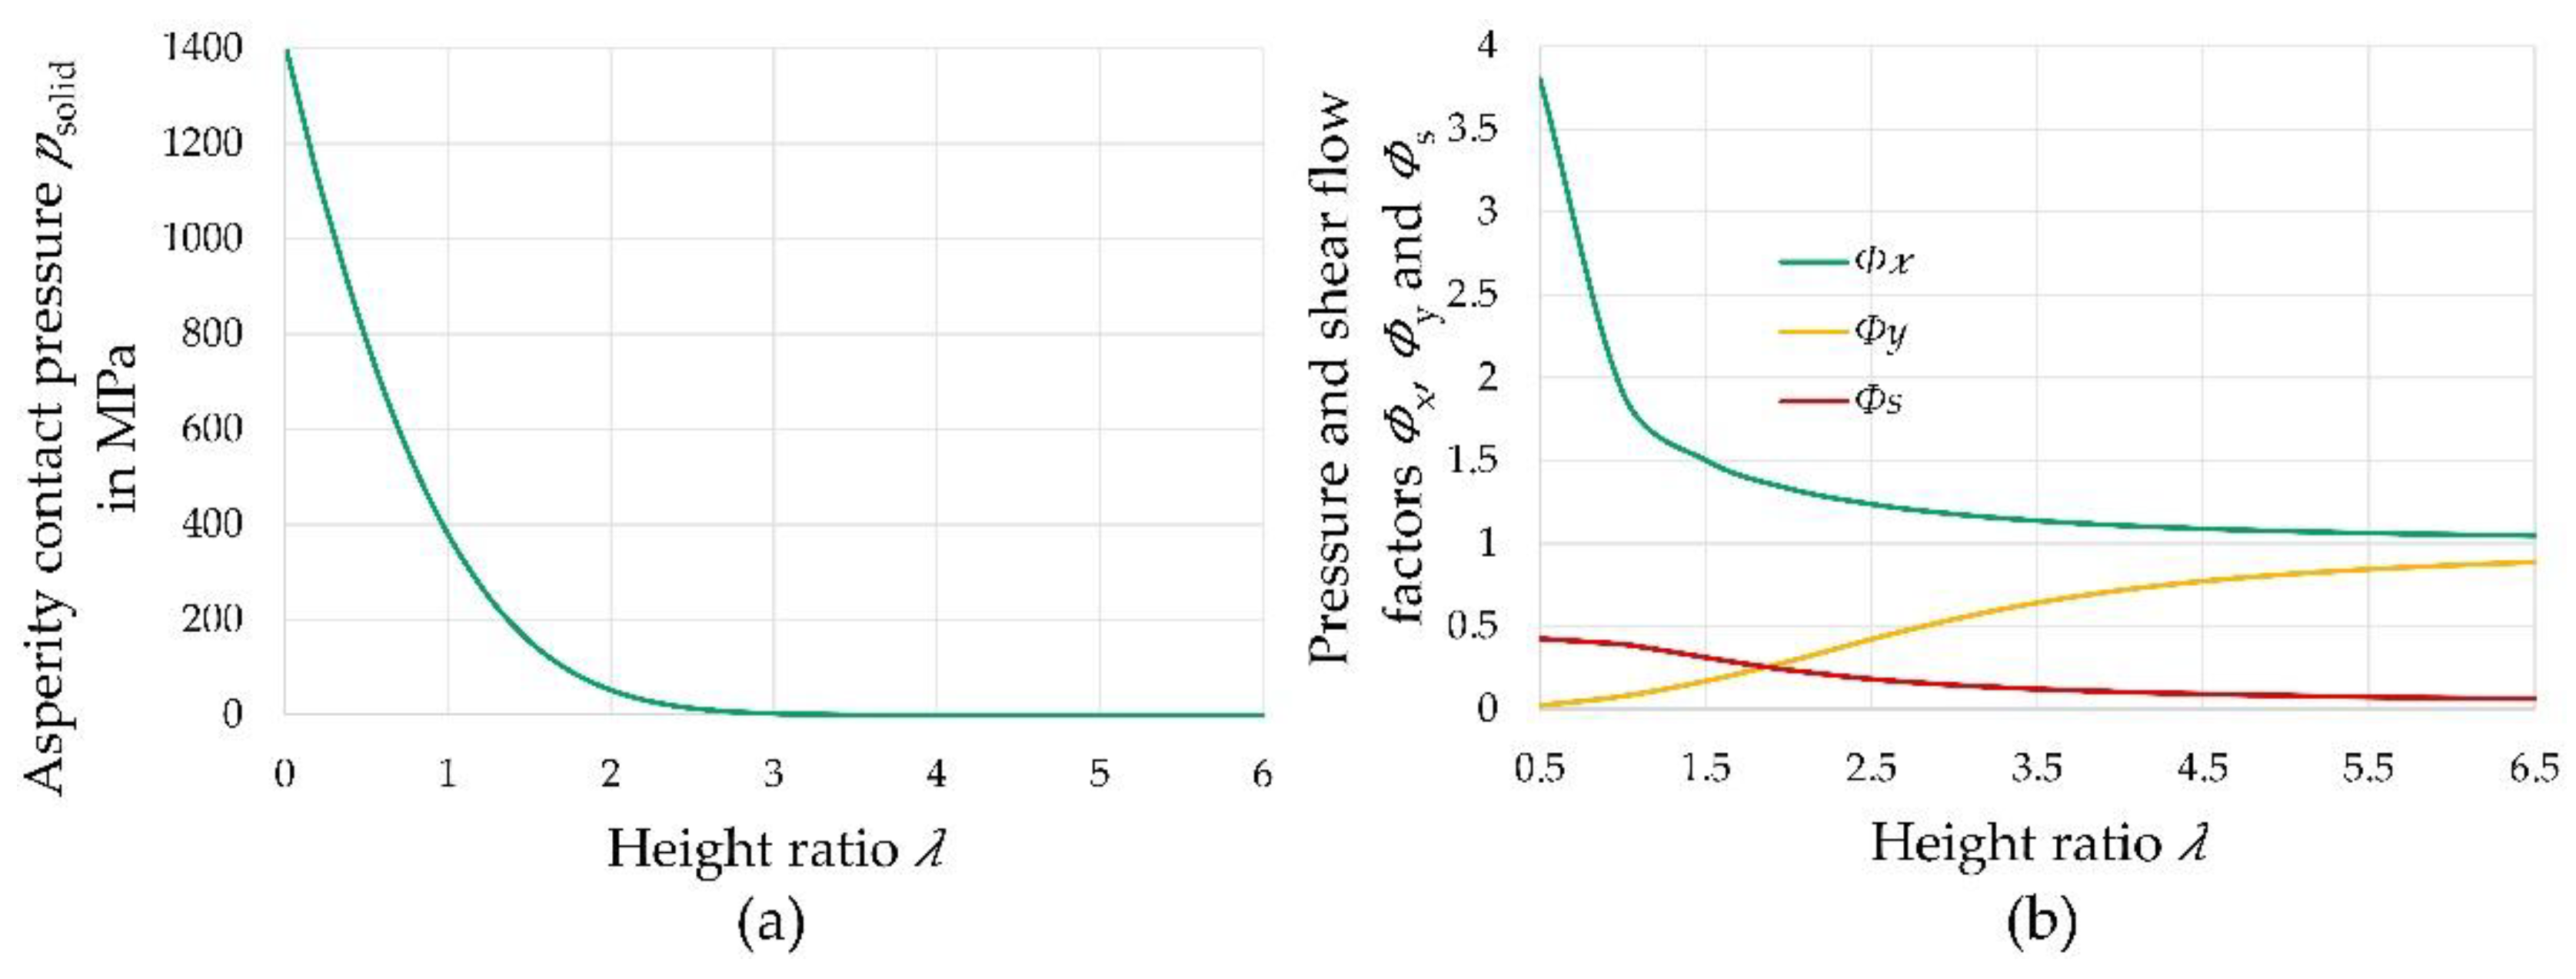
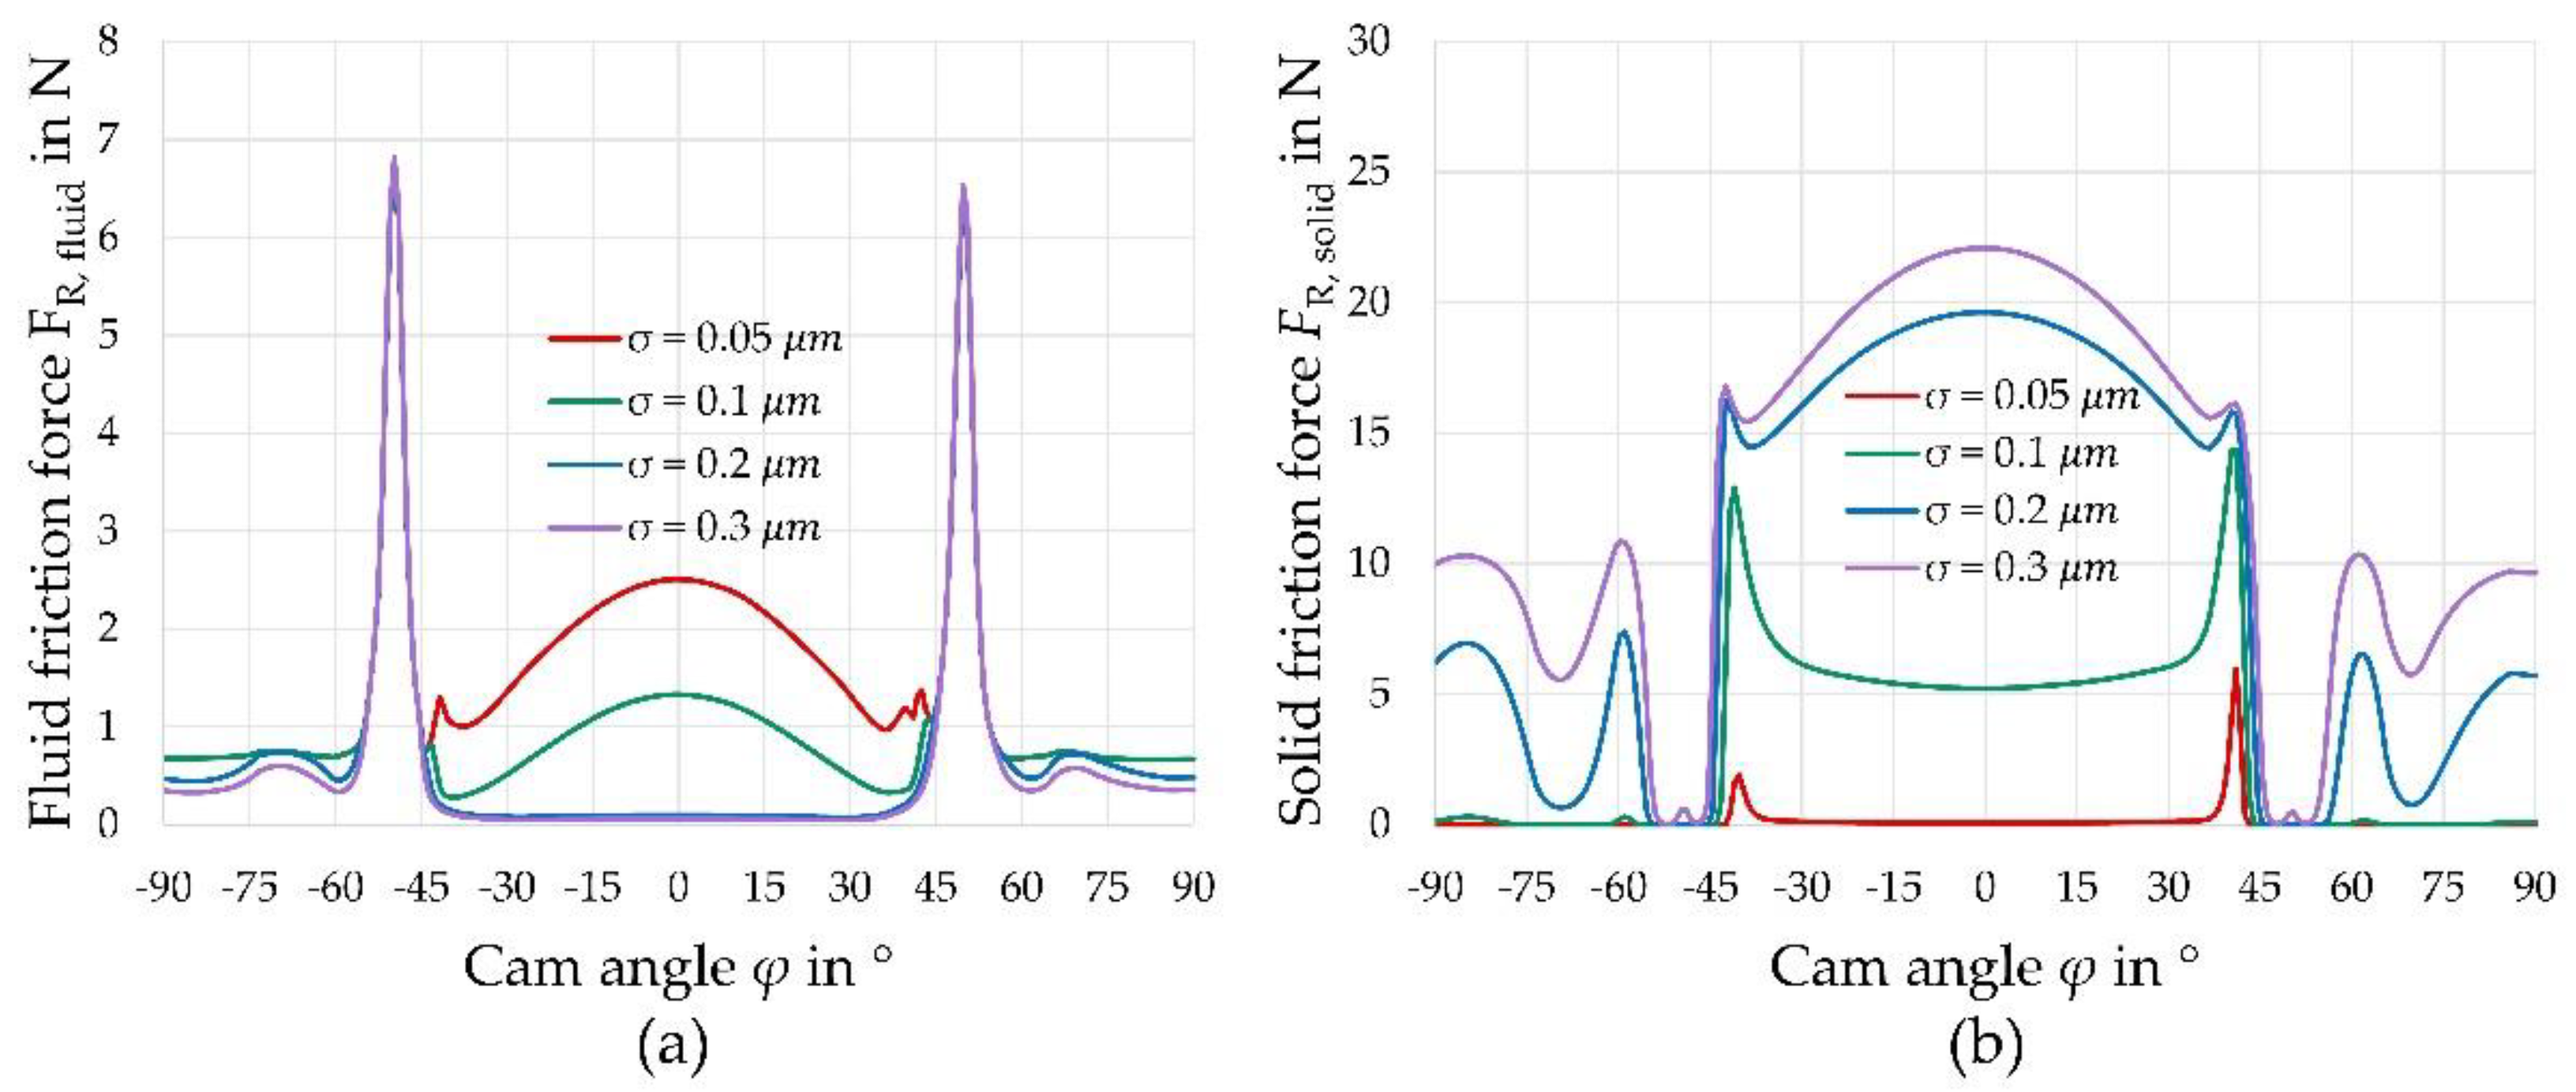
3.3. Influence of Surface Routhness on the Tribological Behaviour

Due to the pronounced mixed friction conditions, it can be assumed that the real surface asperities must have a major influence on the contact behavior. Therefore, the simulation was performed with different surface roughness, and, otherwise, identical boundary conditions. The resulting friction forces for the 2000 rpm load case are shown in Figure 8.
If a much smoother surface is assumed, hardly any mixed lubrication occurred, and a solid contact was only to be expected in the transition areas from and to the cam tip contact. The proportion of fluid friction increased significantly, but, overall, a considerable reduction in friction could be assumed. For significantly rougher contact pairings, on the other hand, hardly any fluid friction occurred, even for the evaluated 2000 rpm load case, and the contact was in the region of the boundary friction with a significantly increased proportion of solid contact.

4. Discussion

Even though the numerical description of the cam–tappet contact as a line contact describes the basic contact behavior well, important effects at the edges of the contact cannot be captured there, and certain deviations occur, as was also described by Shirzadegan [29] for the cam–roller follower contact. At the edges of the contact, the lack of hydrodynamic pressure on one side leads to a lower deformation and thus to a smaller lubrication gap height. As a result, the pressure increases within the edge areas. In these areas, there is thus an increased friction contribution and it can be assumed that the wear at the edges increases accordingly. This also fits with the typical wear phenomena on tappets in experimental tests. Based on the resulting pressure and lubrication gap distribution, an optimized edge geometry could be investigated, for example, to reduce friction and wear.
As already described in other papers on cam–tappet contact, there are pronounced mixed friction conditions over the entire cycle. The resulting friction force results mainly from the solid contact for all load cases considered, as was also the case in the studies of Lyu [32] for similar surface properties. The majority of the friction is accounted for by the cam tip contact. The friction forces determined for the three load cases also agree well, both qualitatively and quantitatively, with experimentally determined friction forces in the untreated cam–tappet contact presented by Marian [12]. However, it should be mentioned at this point that the assumption of the coefficient of friction is decisive for the quantitative determination of the friction force, since it is included linearly in the resulting values. When investigating the surface roughness, it becomes obvious that even small deviations have a tremendous effect on the tribological behavior in the contact. The high influence of the surface asperities on the tribological behavior was also presented by Lyu [32]. The consideration of the roughness in the simulation is thus essential, as, otherwise, the real mixed friction conditions are not represented correctly. The differences through the surface roughness sometimes significantly outweigh other influencing factors, which is why special attention should be paid to this factor in further simulations. For a more precise quantitative prediction of the friction forces, the fluid properties of the oil used should also be described in more detail, while also considering the thermal properties. This applies in particular to load cases with a high speed and a smooth surface, since the proportion of fluid friction becomes relevant there. In recent years, extensive studies were carried out on the quantitative determination of friction in EHL contacts. Habchi [55], for example, investigated the influence of the temperature and pressure on the thermal properties of a Shell T9 oil and described the reliability for a good description of the lubricant film height and frictional behavior. Liu [56] described in detail the fluid properties for a squalane model fluid and developed a simplified model for traction prediction. The same model fluid was also described by Björling [57], mentioning the importance of an accurate fluid description for a true prediction of EHL contact without experimental calibration. The findings of the simulation thus show how important the selection of the simulation approach and the influencing factors considered are for the benefit of the simulation. The selection of the simulation model must always be oriented to the problem, since a complete numerical contact description with all influencing factors is often not possible due to the numerical instabilities, and is also not reasonable for time efficiency reasons. For example, a thermal simulation of the line contact would be preferred for the investigation of a coating, whereas the simulation model presented here is designed both to enable a detailed description of uncoated contacts in terms of friction and to take edge effects outside of the central line contact into account. The model presented could thus be used in the future, for example, to allow for quantitative predictions of friction reduction through geometrical or surface changes. Further, the findings suggest that additional experimental investigation of the surface influence on the resulting friction forces in the cam–tappet contact might be promising for the model validation, as there are hardly any published results.

5. Conclusions

In this work, a simulation model was presented to describe the cam–tappet contact under near-application load conditions. In summary, the following findings can be summarized:
  • Effects at the edges of the line contact appear to have an important influence on the tribological behavior. The narrower lubrication gap and the increased pressure at these areas suggest that the edge areas might contribute decisively to increased wear;
  • The cam–tappet contact is in the mixed friction region, with the solid contact clearly dominating in the total friction force. The friction forces determined in the simulation agree well with those from experimental bench tests;
  • The surface properties of cams and tappets have a considerable effect on the lubricant film structure and thus on the friction and wear behavior of the tribological system. The influence of roughness outweighs many other influencing factors, and thus deserves special attention;
  • The selection of the simulation approach and the influencing variables should always be adapted to the aspect of the contact to be considered in order to find an optimal balance between accuracy and computational efficiency. The presented model is particularly suitable for the investigation of geometry adaptations and time-dependent friction force curves over the cycle.

Author Contributions

Conceptualization, C.O.; methodology, C.O.; software, C.O.; formal analysis, C.O. and S.T.; investigation, C.O.; resources, S.T.; data curation, C.O.; writing—original draft preparation, C.O.; writing—review and editing, S.T.; visualization, C.O.; supervision, S.T.; project administration, C.O. and ST.; funding acquisition, S.T. All authors have read and agreed to the published version of the manuscript.

Funding

This research was funded by the German Research Foundation (DFG) under Project 426217784 within the Priority Program SPP 1551 “Resource-efficient construction elements”.

Institutional Review Board Statement

Not applicable.

Informed Consent Statement

Not applicable.

Data Availability Statement

The numerical transient simulations under consideration typically generate very large amounts of data, which is why the complete results are not made available in a public database. For further information, please contact the authors.

Acknowledgments

C. Orgeldinger and S. Tremmel greatly acknowledge the continuous support of the University of Bayreuth. Furthermore, Max Marian from University of Erlangen-Nuremberg (FAU) is thanked for providing the surface data and experimental friction forces. This publication was funded by the Open Access Publishing Fund of the University of Bayreuth.

Conflicts of Interest

The authors declare no conflict of interest.

Nomenclature

a c Carreau parameter
b H e r t z Herzian contact half-wide
C Elasticity tensor
C u Speed correction factor
C F Force correction factor
C R Radius correction factor
E g Function of the cam edge geometry
F n Contact normal force
F R Friction force
F R , s o l i d Solid friction force
F R , f l u i d Fluid friction force
G c Critical shear stress
h Lubricant gap height
h liq Gap height with fluid
h m i n Minimum lubricant gap height
H Dimensionless lubricant gap height
H 0 Dimensionless distance between undeformed bodies
L Dimensionless contact length in y-direction
n c Carreau parameter
p Hydrodynamic pressure
p s o l i d Solid contact pressure
p c a v Cavitation pressure
p max Maximum pressure
P Dimensionless hydrodynamic pressure
P s o l i d Dimensionless solid contact pressure
P t o t Dimensionless total contact pressure
p H e r t z Hertzian contact pressure
R Cam radius
S y-axis scaling factor
t Time
T Dimensionless time
u m Mean entrainment velocity
x , y , z Coordinates
X , Y , Z Dimensionless coordinates
α η Pressure viscosity coefficient
γ Penalty function
γ Ratio of the x and y correlation lengths
γ ˙ Shear rate
δ ¯ Dimensionless elastic deformation
ε Strain tensor
η Viscosity
η 0 Base viscosity
η ¯ Dimensionless viscosity
η Second plateau viscosity
η l i q Viscosity of the liquid phase
θ Fractional film content
λ Lubricant gap height ratio
μ Coefficient of friction
ξ Penalty factor
ρ Density
ρ 0 Base density
ρ l i q Density of the liquid phase
ρ ¯ Dimensionless density
σ Stress tensor
τ Shear stress
φ Cam angle
ψ Term of the Reynolds equation
Ω Calculation area
Ω c Central calculation area
Nabla operator

References

  1. Holmberg, K.; Erdemir, A. Influence of Tribology on Global Energy Consumption, Costs and Emissions. Friction 2017, 5, 263–284. [Google Scholar] [CrossRef]
  2. Holmberg, K.; Andersson, P.; Erdemir, A. Global Energy Consumption Due to Friction in Passenger Cars. Tribol. Int. 2012, 47, 221–234. [Google Scholar] [CrossRef]
  3. Holmberg, K.; Erdemir, A. The Impact of Tribology on Energy Use and CO2 Emission Globally and in Combustion Engine and Electric Cars. Tribol. Int. 2019, 135, 389–396. [Google Scholar] [CrossRef]
  4. Serrano, J.R.; Novella, R.; Piqueras, P. Why the Development of Internal Combustion Engines Is Still Necessary to Fight against Global Climate Change from the Perspective of Transportation. Appl. Sci. 2019, 9, 4597. [Google Scholar] [CrossRef] [Green Version]
  5. Kalghatgi, G. Is It Really the End of Internal Combustion Engines and Petroleum in Transport? Appl. Energy 2018, 225, 965–974. [Google Scholar] [CrossRef]
  6. Bae, C.; Kim, J. Alternative Fuels for Internal Combustion Engines. Proc. Combust. Inst. 2017, 36, 3389–3413. [Google Scholar] [CrossRef]
  7. Lee, P.; Zhmud, B. Low Friction Powertrains: Current Advances in Lubricants and Coatings. Lubricants 2021, 9, 74. [Google Scholar] [CrossRef]
  8. Ciulli, E.; Fazzolari, F.; Pugliese, G. Contact Force Measurements in Cam and Follower Lubricated Contacts. Front. Mech. Eng. 2020, 6, 601410. [Google Scholar] [CrossRef]
  9. Van Helden, A.K.; van der Meer, R.J.; van Staaden, J.J.; van Gelderen, E. Dynamic Friction in Cam/Tappet Lubrication. SAE Trans. 1985, 94, 224–231. [Google Scholar]
  10. Kano, M. Super Low Friction of DLC Applied to Engine Cam Follower Lubricated with Ester-Containing Oil. Tribol. Int. 2006, 39, 1682–1685. [Google Scholar] [CrossRef]
  11. Dobrenizki, L.; Tremmel, S.; Wartzack, S.; Hoffmann, D.C.; Brögelmann, T.; Bobzin, K.; Bagcivan, N.; Musayev, Y.; Hosenfeldt, T. Efficiency Improvement in Automobile Bucket Tappet/Camshaft Contacts by DLC Coatings—Influence of Engine Oil, Temperature and Camshaft Speed. Surf. Coat. Technol. 2016, 308, 360–373. [Google Scholar] [CrossRef]
  12. Marian, M.; Weikert, T.; Tremmel, S. On Friction Reduction by Surface Modifications in the TEHL Cam/Tappet-Contact-Experimental and Numerical Studies. Coatings 2019, 9, 843. [Google Scholar] [CrossRef] [Green Version]
  13. Mabuchi, Y.; Yamashita, T.; Izumi, H.; Sekikawa, T.; Nishimura, K.; Hirano, S.; Moriguchi, Y. Examination of the Axial Shape of the Automotive Valvetrain Cam for Engine Friction Reduction. Tribol. Trans. 2017, 60, 1088–1098. [Google Scholar] [CrossRef]
  14. Ai, X.; Yu, H. A Numerical Analysis for the Transient EHL Process of a Cam-Tappet Pair in I. C. Engine. J. Tribol. 1989, 111, 413–417. [Google Scholar] [CrossRef]
  15. Dowson, D.; Taylor, C.M.; Zhu, G. A Transient Elastohydrodynamic Lubrication Analysis of a Cam and Follower. J. Phys. D Appl. Phys. 1992, 25, A313–A320. [Google Scholar] [CrossRef]
  16. Messé, S.; Lubrecht, A.A. Transient Elastohydrodynamic Analysis of an Overhead Cam/Tappet Contact. Proc. Inst. Mech. Eng. Part J J. Eng. Tribol. 2000, 214, 415–425. [Google Scholar] [CrossRef]
  17. Lubrecht, A.A.; Venner, C.H. Elastohydrodynamic Lubrication of Rough Surfaces. Proc. Inst. Mech. Eng. Part J J. Eng. Tribol. 1999, 213, 397–404. [Google Scholar] [CrossRef]
  18. Teodorescu, M.; Taraza, D.; Henein, N.A.; Bryzik, W. Simplified Elasto-Hydrodynamic Friction Model of the Cam-Tappet Contact. SAE Trans. 2003, 112, 1271–1282. [Google Scholar]
  19. Dowson, D.; Higginson, G.R. Elasto-Hydrodynamic Lubrication: International Series on Materials Science and Technology; Dowson, D., Higginson, G.R., Eds.; Pergamon Press: Oxford, UK; Elsevier: New York, NY, USA, 1977; ISBN 978-0-08-021302-6. [Google Scholar]
  20. Wang, J.; Yang, P. A Numerical Analysis for TEHL of Eccentric-Tappet Pair Subjected to Transient Load. J. Tribol. 2003, 125, 770–779. [Google Scholar] [CrossRef]
  21. Wang, J.; Venner, C.H.; Lubrecht, A.A. Influence of Surface Waviness on the Thermal Elastohydrodynamic Lubrication of an Eccentric-Tappet Pair. J. Tribol. 2013, 135, 021001. [Google Scholar] [CrossRef]
  22. Chong, W.; Teodorescu, M.; Rahnejat, H. Mixed Thermo-Elastohydrodynamic Cam-Tappet Power Loss in Low-Speed Emission Cycles. Int. J. Engine Res. 2014, 15, 153–164. [Google Scholar] [CrossRef] [Green Version]
  23. Raisin, J.; Fillot, N.; Vergne, P.; Dureisseix, D.; Lacour, V. Transient Thermal Elastohydrodynamic Modeling of Cam–Follower Systems: Understanding Performance. Tribol. Trans. 2016, 59, 720–732. [Google Scholar] [CrossRef]
  24. Habchi, W. Finite Element Modeling of Elastohydrodynamic Lubrication Problems; John Wiley & Sons: Hoboken, NJ, USA, 2018; ISBN 978-1-119-22514-0. [Google Scholar]
  25. Habchi, W.; Eyheramendy, D.; Vergne, P.; Morales-Espejel, G. A Full-System Approach of the Elastohydrodynamic Line/Point Contact Problem. J. Tribol. 2008, 130, 021501. [Google Scholar] [CrossRef]
  26. Wassim, H. Une Approche Éléments Finis avec Couplage fort des Problèmes de Lubrification Élastohydrodynamique: Application aux Fluides de très Faible Viscosité. Ph.D. Thesis, L’Institut National des Sciences Appliquées de Lyon, Lyon, France, 2008. Available online: http://docinsa.insa-lyon.fr/these/2008/habchi/these.pdf (accessed on 25 October 2021).
  27. Wu, W.; Wang, J.; Venner, C.H. Thermal Elastohydrodynamic Lubrication of an Optimized Cam–Tappet Pair in Smooth Contact. J. Tribol. 2016, 138, 021501. [Google Scholar] [CrossRef]
  28. Tsuha, N.A.H.; Nonato, F.; Cavalca, K.L. Formulation of a Reduced Order Model for the Stiffness on Elastohydrodynamic Line Contacts Applied to Cam-Follower Mechanism. Mech. Mach. Theory 2017, 113, 22–39. [Google Scholar] [CrossRef]
  29. Shirzadegan, M.; Almqvist, A.; Larsson, R. Fully Coupled EHL Model for Simulation of Finite Length Line Cam-Roller Follower Contacts. Tribol. Int. 2016, 103, 584–598. [Google Scholar] [CrossRef] [Green Version]
  30. Yu, C.; Meng, X.; Xie, Y. Numerical Simulation of the Effects of Coating on Thermal Elastohydrodynamic Lubrication in Cam/Tappet Contact. Proc. Inst. Mech. Eng. Part J J. Eng. Tribol. 2017, 231, 221–239. [Google Scholar] [CrossRef]
  31. Meng, X.; Yu, C.; Xie, Y.; Mei, B. Thermal Insulation Effect on EHL of Coated Cam/Tappet Contact during Start Up. Ind. Lubr. Tribol. 2018, 70, 917–926. [Google Scholar] [CrossRef]
  32. Lyu, B.; Meng, X.; Zhang, R.; Cui, Y. A Comprehensive Numerical Study on Friction Reduction and Wear Resistance by Surface Coating on Cam/Tappet Pairs under Different Conditions. Coatings 2020, 10, 485. [Google Scholar] [CrossRef]
  33. Marian, M.; Tremmel, S.; Wartzack, S. Microtextured Surfaces in Higher Loaded Rolling-Sliding EHL Line-Contacts. Tribol. Int. 2018, 127, 420–432. [Google Scholar] [CrossRef]
  34. Torabi, A.; Akbarzadeh, S.; Salimpour, M.; Khonsari, M.M. On the Running-in Behavior of Cam-Follower Mechanism. Tribol. Int. 2018, 118, 301–313. [Google Scholar] [CrossRef]
  35. Tang, H.; Wang, J.; Sun, N.; Zhu, J. Effect of Angular Speed of Cam on Oil Film Variation in the Line Contact Thermal EHL of a Cam-Tappet Pair. Ind. Lubr. Tribol. 2020, 72, 713–722. [Google Scholar] [CrossRef]
  36. Marian, M.; Orgeldinger, C.; Rothammer, B.; Nečas, D.; Vrbka, M.; Křupka, I.; Hartl, M.; Wimmer, M.A.; Tremmel, S.; Wartzack, S. Towards the Understanding of Lubrication Mechanisms in Total Knee Replacements—Part II: Numerical Modeling. Tribol. Int. 2021, 156, 106809. [Google Scholar] [CrossRef]
  37. Marian, M. Numerische Auslegung von Oberflächenmikrotexturen für geschmierte tribologische Kontakte; Friedrich-Alexander-Universität Erlangen-Nürnberg (FAU): Erlangen, Germany, 2021. [Google Scholar]
  38. Weschta, M. Untersuchungen zur Wirkungsweise von Mikrotexturen in elastohydrodynamischen Gleit/Wälz-Kontakten. Ph.D. Thesis, Friedrich-Alexander-Universität Erlangen-Nürnberg (FAU), Erlangen, Germany, 2017. [Google Scholar]
  39. Carreau, P.J. Rheological Equations from Molecular Network Theories. Trans. Soc. Rheol. 1972, 16, 99–127. [Google Scholar] [CrossRef]
  40. Bair, S. A Rough Shear-Thinning Correction for EHD Film Thickness. Tribol. Trans. 2004, 47, 361–365. [Google Scholar] [CrossRef]
  41. Roelands, C.J.A. Correlational Aspects of the Viscosity-Temperature-Pressure Relationship of Lubricating Oils. Ph.D. Thesis, TU Delft, Delft, The Netherlands, 1966. [Google Scholar]
  42. Lohner, T.; Ziegltrum, A.; Stemplinger, J.-P.; Stahl, K. Engineering Software Solution for Thermal Elastohydrodynamic Lubrication Using Multiphysics Software. Adv. Tribol. 2016, 2016, 6507203. [Google Scholar] [CrossRef] [Green Version]
  43. Hertz, H. Ueber die Berührung fester elastischer Körper. Journal für die reine und angewandte Mathematik 1882, 1882, 156–171. [Google Scholar] [CrossRef]
  44. Tan, X.; Goodyer, C.E.; Jimack, P.K.; Taylor, R.I.; Walkley, M.A. Computational Approaches for Modelling Elastohydrodynamic Lubrication Using Multiphysics Software. Proc. Inst. Mech. Eng. Part J J. Eng. Tribol. 2012, 226, 463–480. [Google Scholar] [CrossRef]
  45. Winkler, A.; Marian, M.; Tremmel, S.; Wartzack, S. Numerical Modeling of Wear in a Thrust Roller Bearing under Mixed Elastohydrodynamic Lubrication. Lubricants 2020, 8, 58. [Google Scholar] [CrossRef]
  46. Reynolds, O. On the Theory of Lubrication and Its Application to Mr. Beauchamp Tower’s Experiments, Including an Experimental Determination of the Viscosity of Olive Oil. Philos. Trans. R. Soc. Lond. 1886, 177, 157–234. [Google Scholar] [CrossRef]
  47. Marian, M.; Weschta, M.; Tremmel, S.; Wartzack, S. Simulation of Microtextured Surfaces in Starved EHL Contacts Using Commercial FE Software. Matls. Perf. Charact. 2017, 6, 165–181. [Google Scholar] [CrossRef]
  48. Zhao, Y.; Maietta, D.M.; Chang, L. An Asperity Microcontact Model Incorporating the Transition from Elastic Deformation to Fully Plastic Flow. J. Tribol. 2000, 122, 86–93. [Google Scholar] [CrossRef]
  49. Marian, M.; Grützmacher, P.; Rosenkranz, A.; Tremmel, S.; Mücklich, F.; Wartzack, S. Designing Surface Textures for EHL Point-Contacts—Transient 3D Simulations, Meta-Modeling and Experimental Validation. Tribol. Int. 2019, 137, 152–163. [Google Scholar] [CrossRef]
  50. Masjedi, M.; Khonsari, M.M. Film Thickness and Asperity Load Formulas for Line-Contact Elastohydrodynamic Lubrication With Provision for Surface Roughness. J. Tribol. 2012, 134, 011503. [Google Scholar] [CrossRef]
  51. Patir, N.; Cheng, H.S. An Average Flow Model for Determining Effects of Three-Dimensional Roughness on Partial Hydrodynamic Lubrication. J. Lubr. Technol. 1978, 100, 12–17. [Google Scholar] [CrossRef]
  52. Patir, N.; Cheng, H. Application of Average Flow Model to Lubrication between Rough Sliding Surfaces. J. Lubr. Technol. 1979, 101, 220–229. [Google Scholar] [CrossRef]
  53. The Finite Element Method for Fluid Dynamics, 7th ed.; Zienkiewicz, O.C.; Taylor, R.L.; Nithiarasu, P. (Eds.) Butterworth-Heinemann: Oxford, UK, 2014; ISBN 978-1-85617-635-4. [Google Scholar]
  54. Tribologie-Handbuch; Czichos, H.; Habig, K.-H. (Eds.) Springer Fachmedien Wiesbaden: Wiesbaden, Germany, 2015; ISBN 978-3-8348-1810-2. [Google Scholar]
  55. Habchi, W.; Vergne, P.; Bair, S.; Andersson, O.; Eyheramendy, D.; Morales-Espejel, G.E. Influence of Pressure and Temperature Dependence of Thermal Properties of a Lubricant on the Behaviour of Circular TEHD Contacts. Tribol. Int. 2010, 43, 1842–1850. [Google Scholar] [CrossRef]
  56. Liu, H.C.; Zhang, B.B.; Bader, N.; Venner, C.H.; Poll, G. Simplified Traction Prediction for Highly Loaded Rolling/Sliding EHL Contacts. Tribol. Int. 2020, 148, 106335. [Google Scholar] [CrossRef]
  57. Björling, M.; Habchi, W.; Bair, S.; Larsson, R.; Marklund, P. Towards the True Prediction of EHL Friction. Tribol. Int. 2013, 66, 19–26. [Google Scholar] [CrossRef] [Green Version]
Figure 1. Simplified structure of the cam–tappet contact (a) and the corresponding sections of the cam (b).
Lubricants 09 00106 g001
Figure 2. Load collective of the cam–tappet contact at different camshaft speeds. Mean entrainment speed u m (a) and contact normal force F n (b) are shown over cam cycle from pre-cam (approx. ±90°…±55°) via rising flank (approx. ±55°…±40°) to cam tip (approx. ±40°…0°).
Lubricants 09 00106 g002
Figure 3. Scaled FE calculation area Ω and representation of the mesh in the central contact area Ω c .
Lubricants 09 00106 g003
Figure 4. Solid-state contact pressure curve (a) and flux factors (b) depending on the height ratio λ = h σ .
Lubricants 09 00106 g004
Figure 5. Lubricant gap h (a,b) and total pressure p (c,d) for 500 rpm (a,c) and 2000 rpm (b,d) camshaft speed at pre-cam, rising flank and cam tip. In the center of the contact area, uniform distributions typical for line contacts were formed; at the edges, these deviated due to the edge geometry. The color scales of the enlargements are adjusted to show the edge effects. It should be noted that the length of the simulation area was extended to 10   b H e r t z for the 2000 rpm load case.
Lubricants 09 00106 g005
Figure 6. Maximum pressure p m a x   (a) and minimum lubricant gap h m i n (b) over one cam cycle for different load cases. The pressure curves were similar for all load cases, and the minimum lubricant film height increased considerably with increasing speed.
Lubricants 09 00106 g006
Figure 7. Fluid (a) and solid (b) friction forces over one cam cycle for different load cases using a combined surface roughness of σ = 0.1   μ m . Solid-state friction was dominant in all load cases and occurred primarily in cam tip contact. It decreased with increasing speed. Fluid friction occurred mainly in the area of the rising flank. The solid friction was additionally evaluated for a lower coefficient of friction. Note different axis scaling.
Lubricants 09 00106 g007
Figure 8. Fluid (a) and solid (b) friction forces dependent on the surface roughness at 2000 rpm. With increasing roughness, the solid friction increased considerably, whereas the proportion of fluid friction decreased. Note different axis scaling.
Lubricants 09 00106 g008
Table 1. Lubricant properties of the engine oil used.
Base density ρ 0 805 k g m 3
Base viscosity η 0 0.03   P a s
Pressure viscosity coefficient α η 1.31 10 8 P a 1
Critical shear stress G c 6   M P a
Second plateau viscosity η 0.2   η 0
Carreau parameter a c 2.2
Carreau parameter n c 0.8
Publisher’s Note: MDPI stays neutral with regard to jurisdictional claims in published maps and institutional affiliations.

