Correlation of Tribological Behavior and Fatigue Properties of Filled and Unfilled TPUs

 ,
,  and
and
Abstract
:1. Introduction
2. Experimental Details
2.1. Material
2.2. Wear Prediction Model
2.2.1. Panda’s Model
Description of Model
- NS: Total number of asperities encountered during sliding;
- η: Average asperity density per unit area in µm−2;
- As: Total area covered during the tribological test in µm2;
- µ: Coefficient of friction;
- H: Hardness in MPa, coverted from Shore D;
- Average radius of curvature at asperity tip in µm;
- Standard deviation of asperity heights in µm;
- Fracture toughness MPa·m0.5;
- Normalized mean separation in µm;
- Normalized deformation in µm;
- Critical normalized deformation;
- [13];
- Surface energy per unit area J·m−2.
- ν: Poisson’s ratio;
- K: Combined Young’s modulus of two surfaces in MPa;
- t: Fatigue ratio;
Parameter Generation
Experimental Deatils
2.2.2. Atkins Model
Description of Model
- a: Crack length (a0 initial crack length);
- N: Cycle number;
- A: Material constant;
- K: Stress intensity factor;
- n: Slope of the straight;
- ∆σ: Difference in applied stress.
- G: Energy release rate in J/m²;
- U: Energy required for crack growth (area under σ-ε curve) in J;
- A: Uncracked surface of specimen in mm²;
- t: Thickness of specimen in mm;
- L: Initial length of uncracked area in mm;
- a: Crack length in mm;
- W: Work of cracking in N/mm²;
- h0: Constant height of the testing area in mm;
- T: Tearing energy in J/m².
- B: Material constant in mm/cycle;
- m: Slope of the straight [–];
- a0: Initial crack length at which wear particles start to detach in mm.
Parameter Generation
Experimental Details
3. Results & Discussion
3.1. Comparison of Two Materials
3.1.1. Fatigue Tests
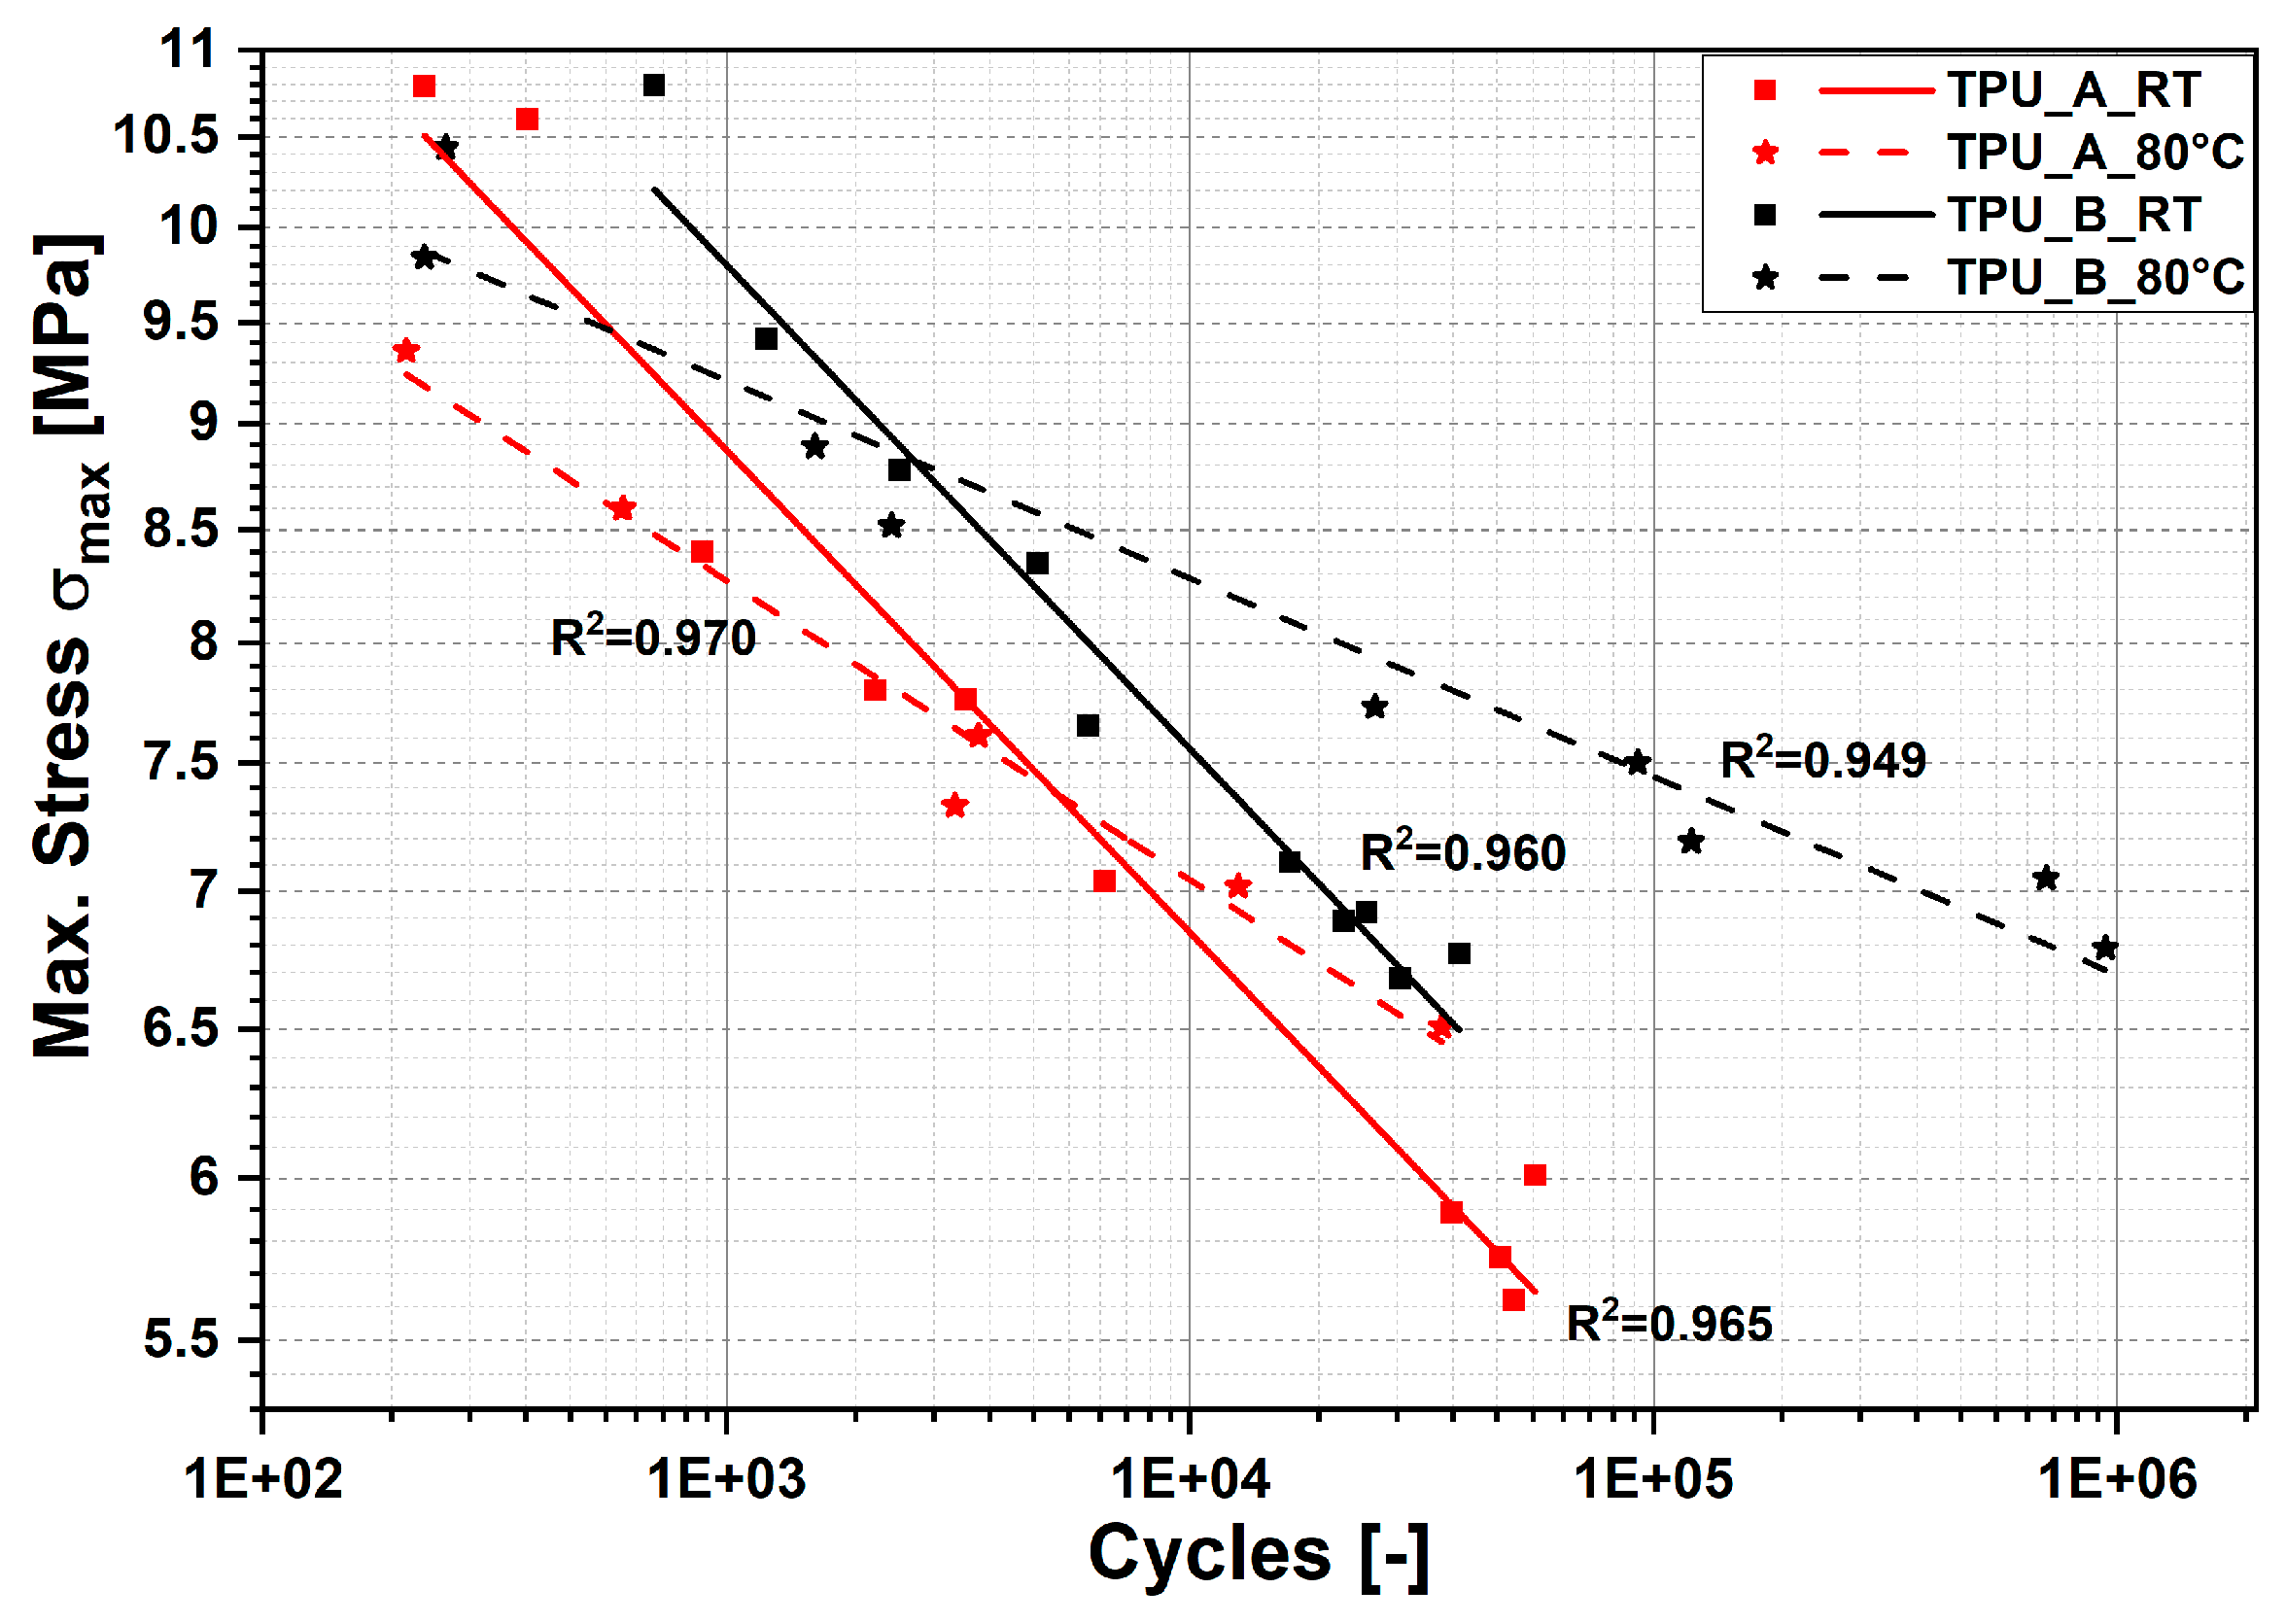
Stress–Cycle (S–N) Curve
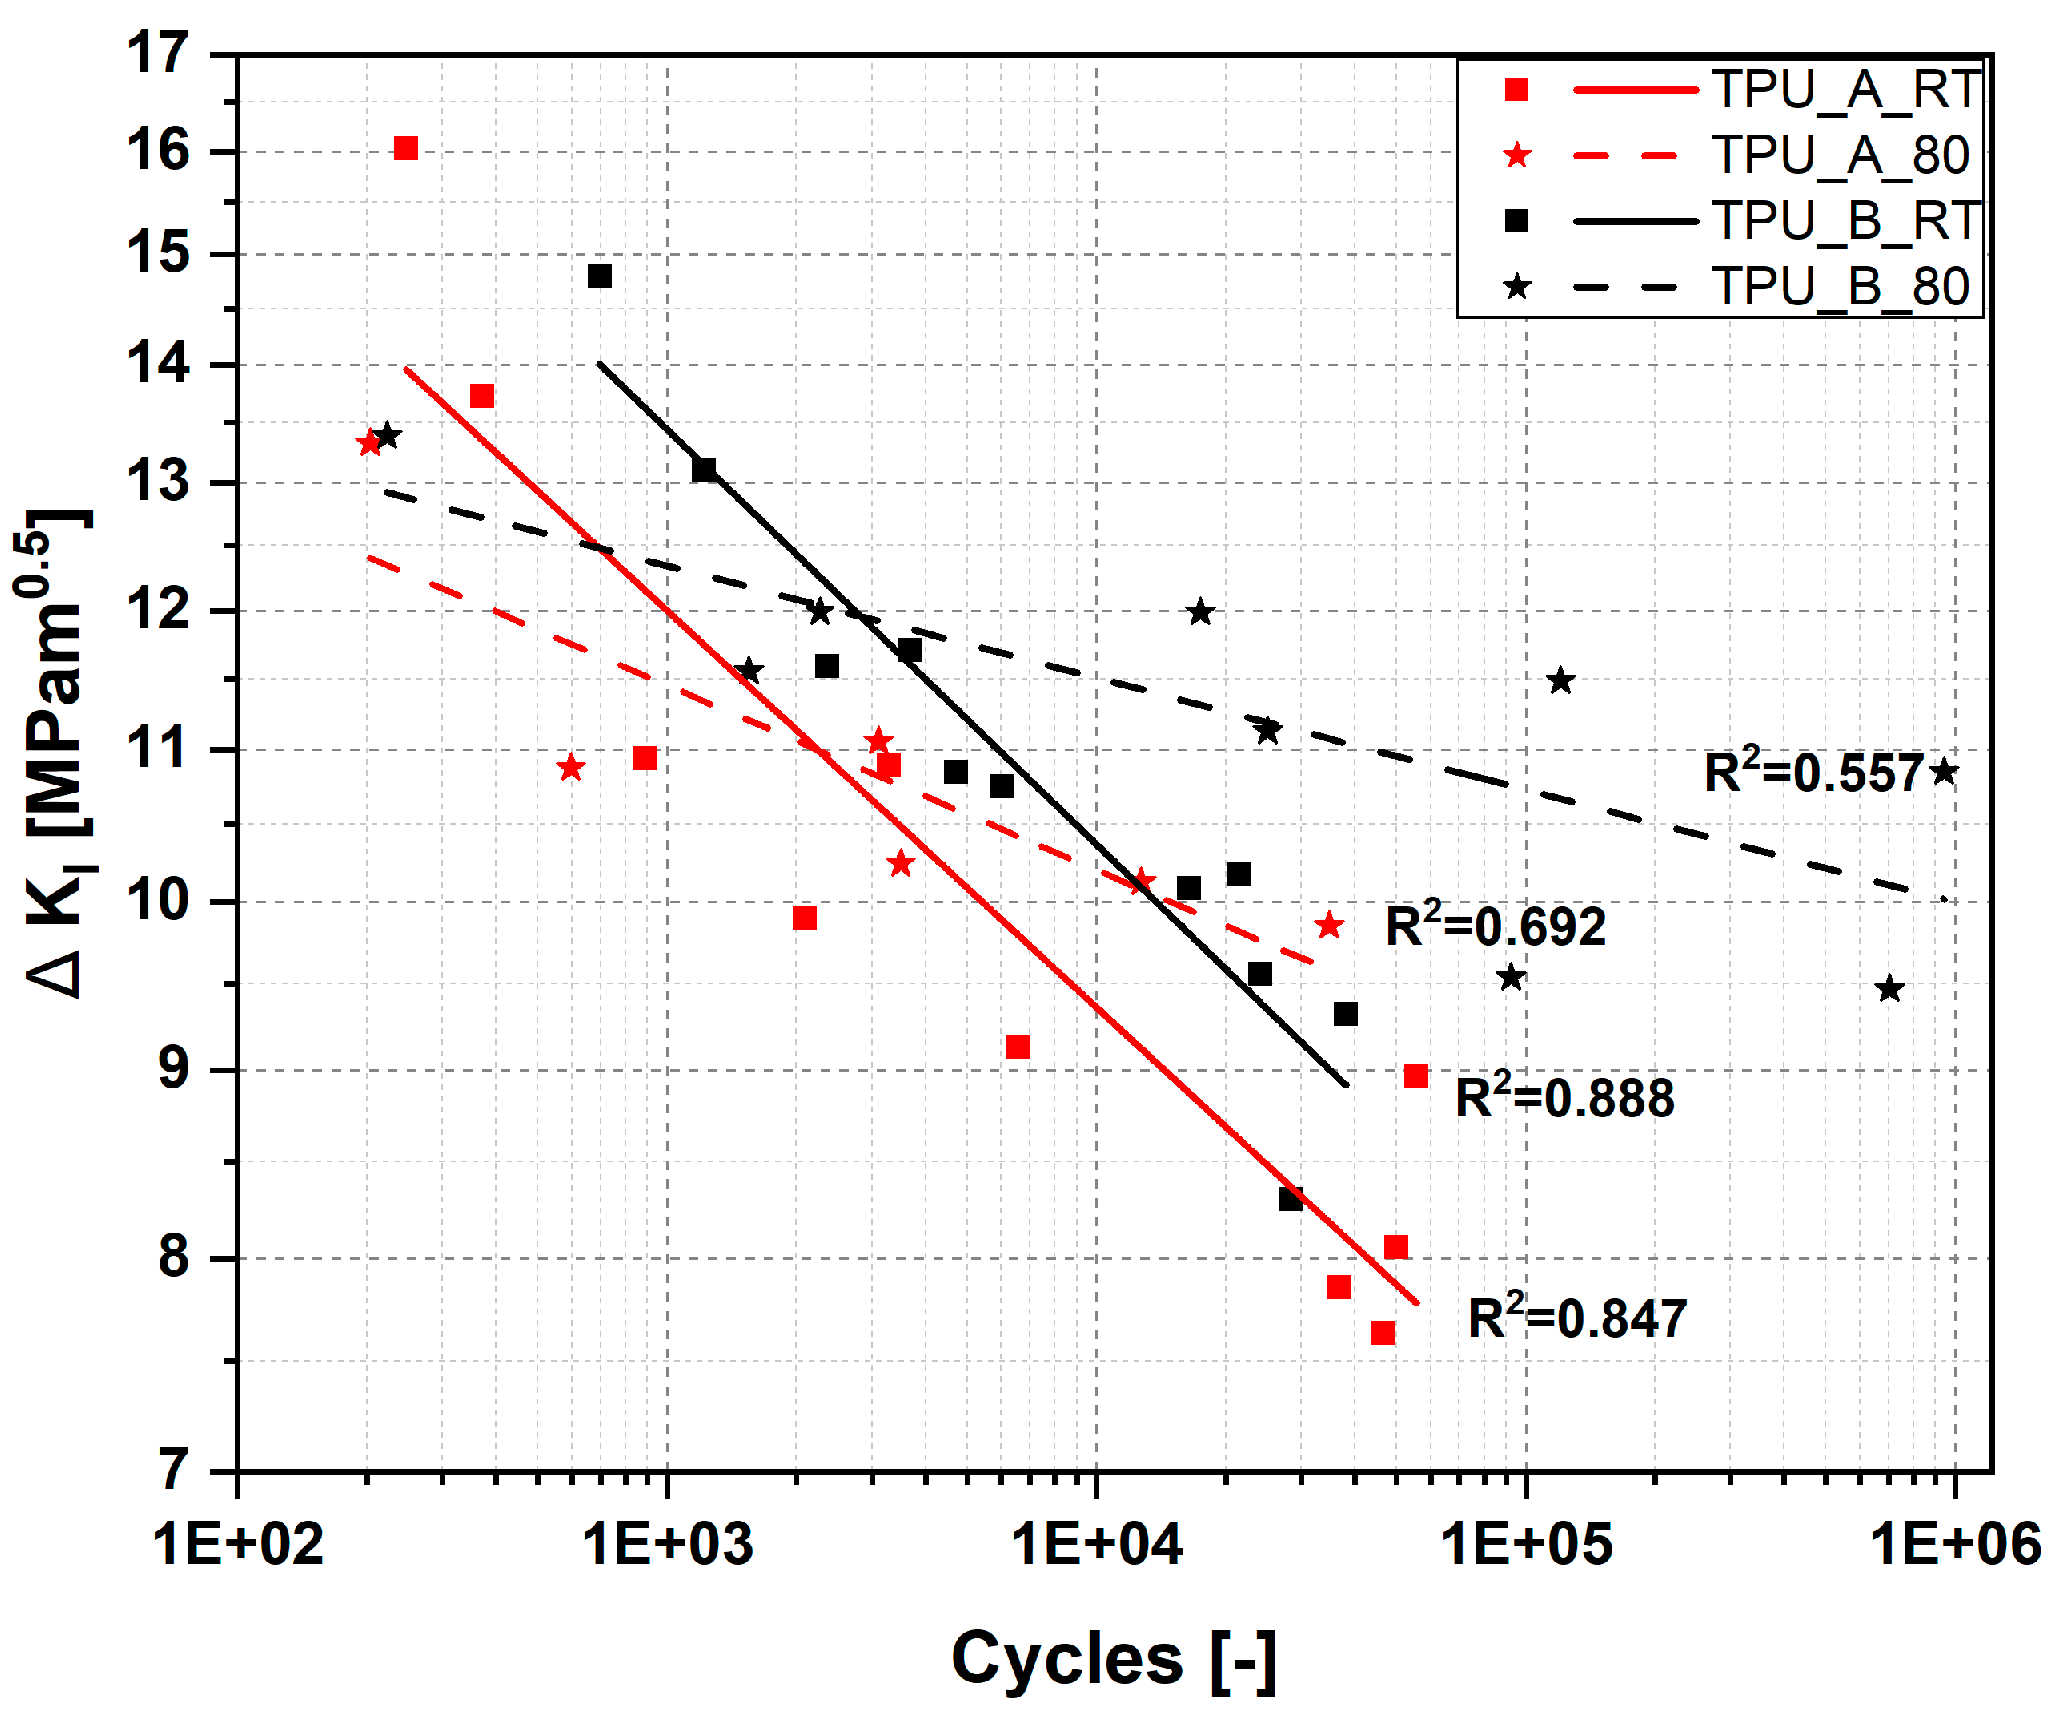
Stress Intensity Factor
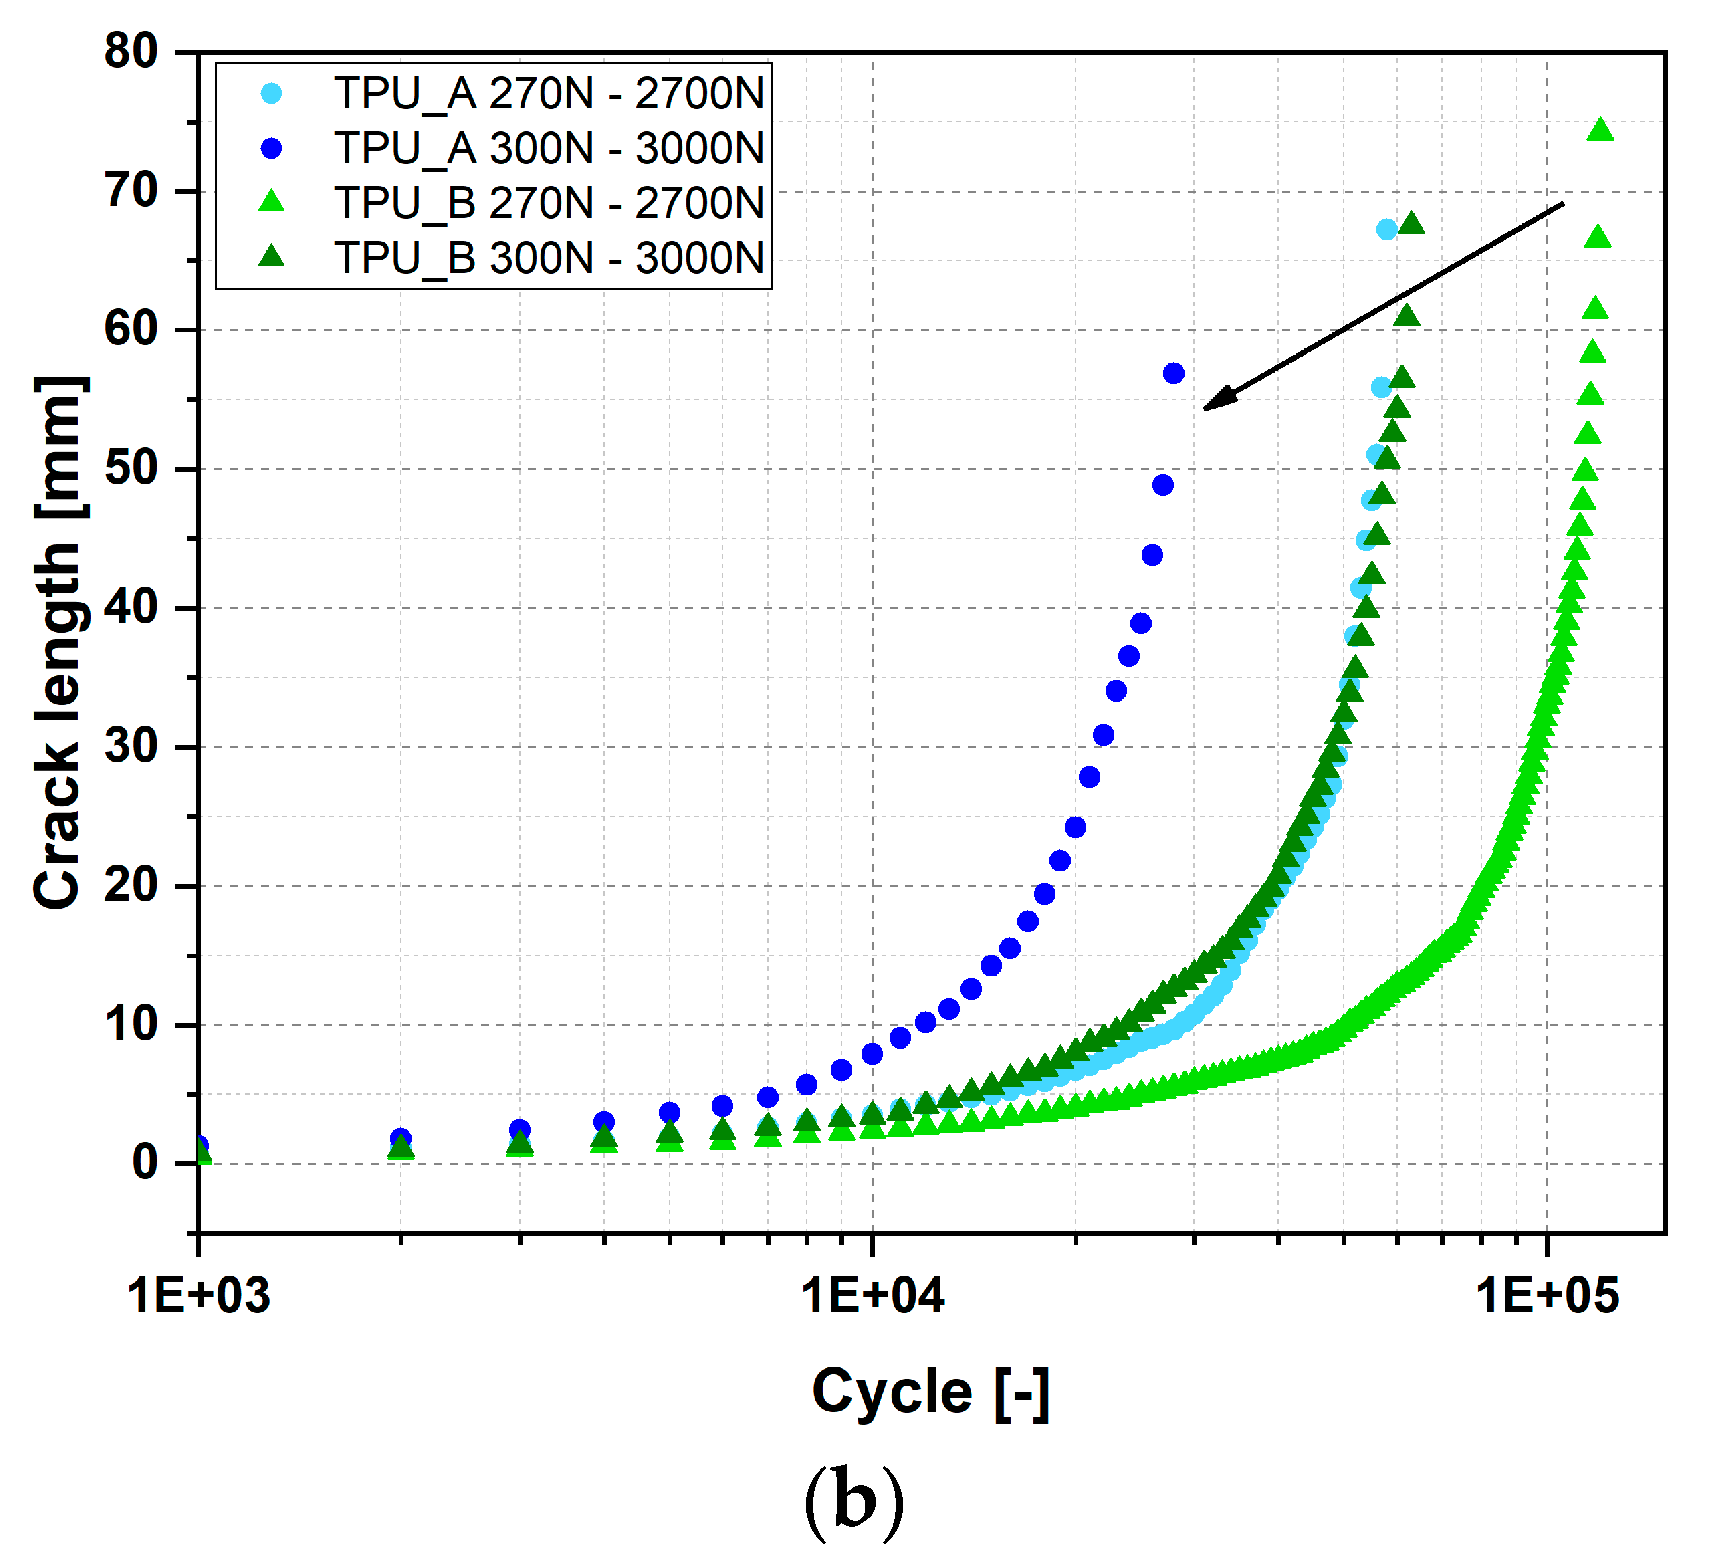
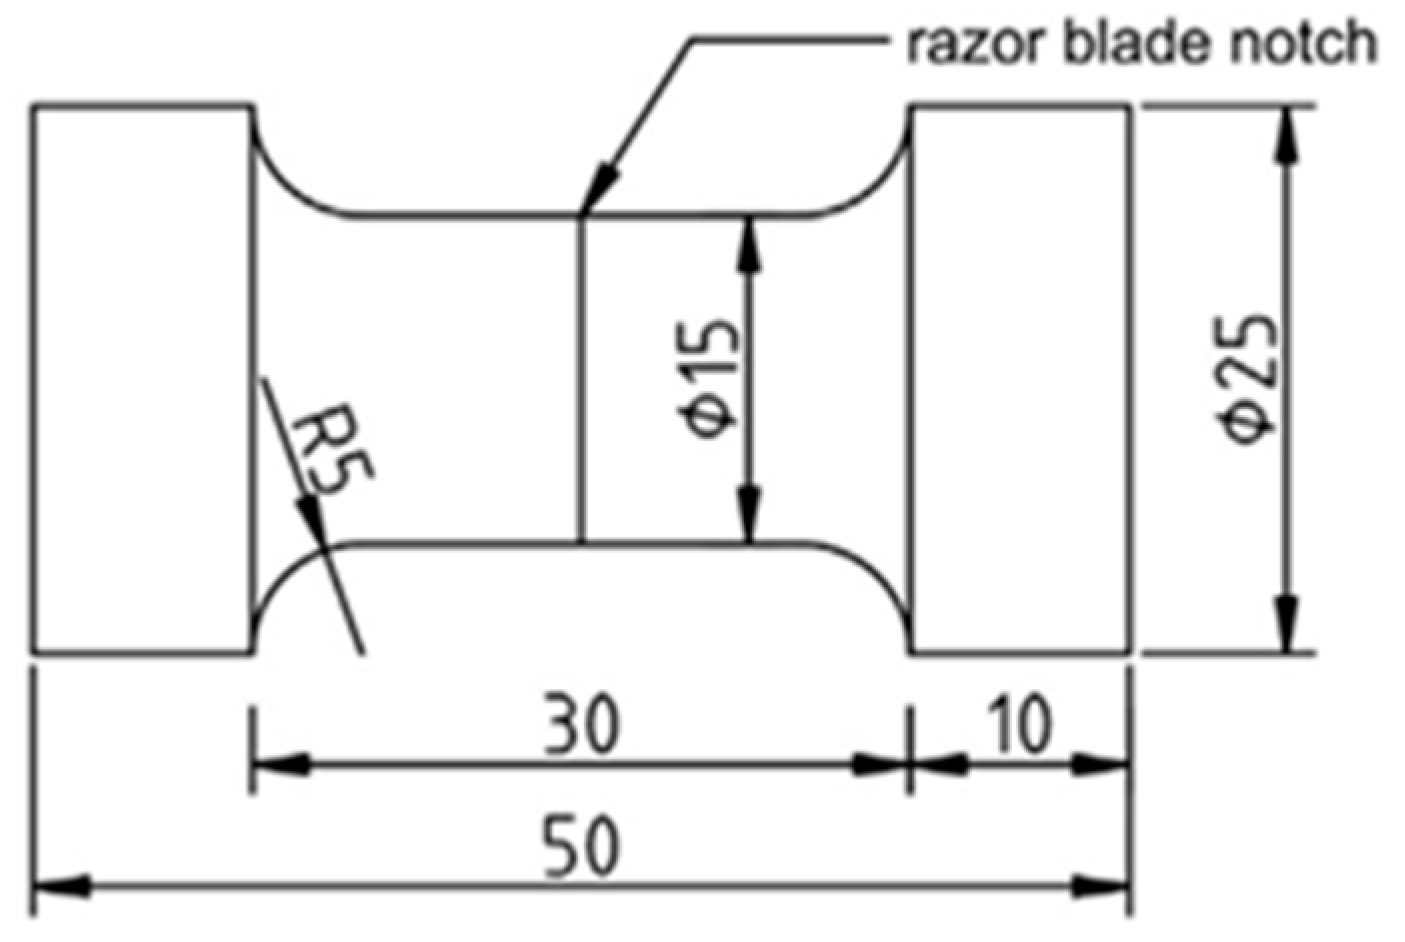
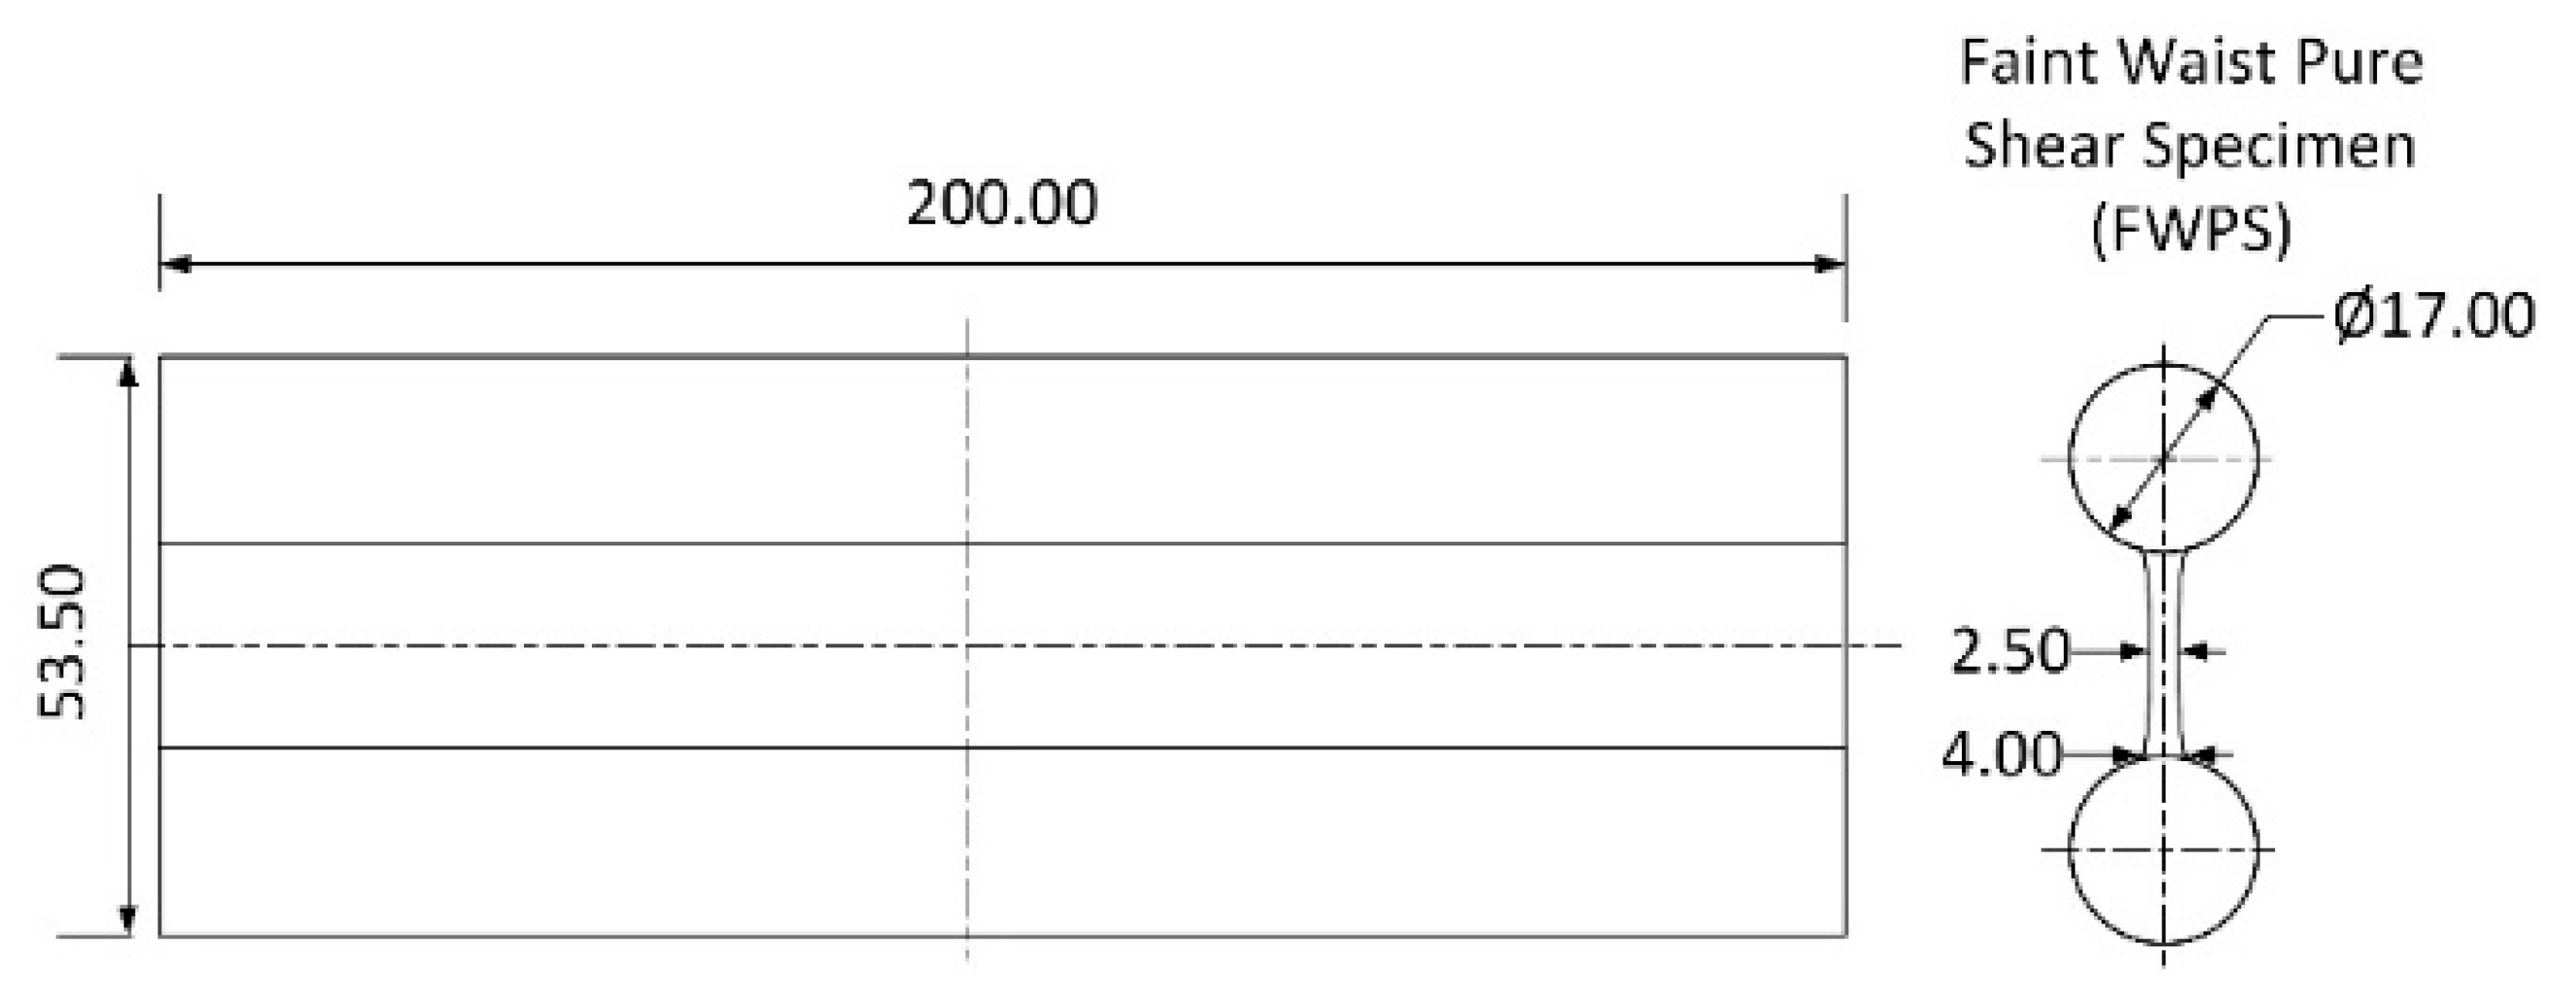
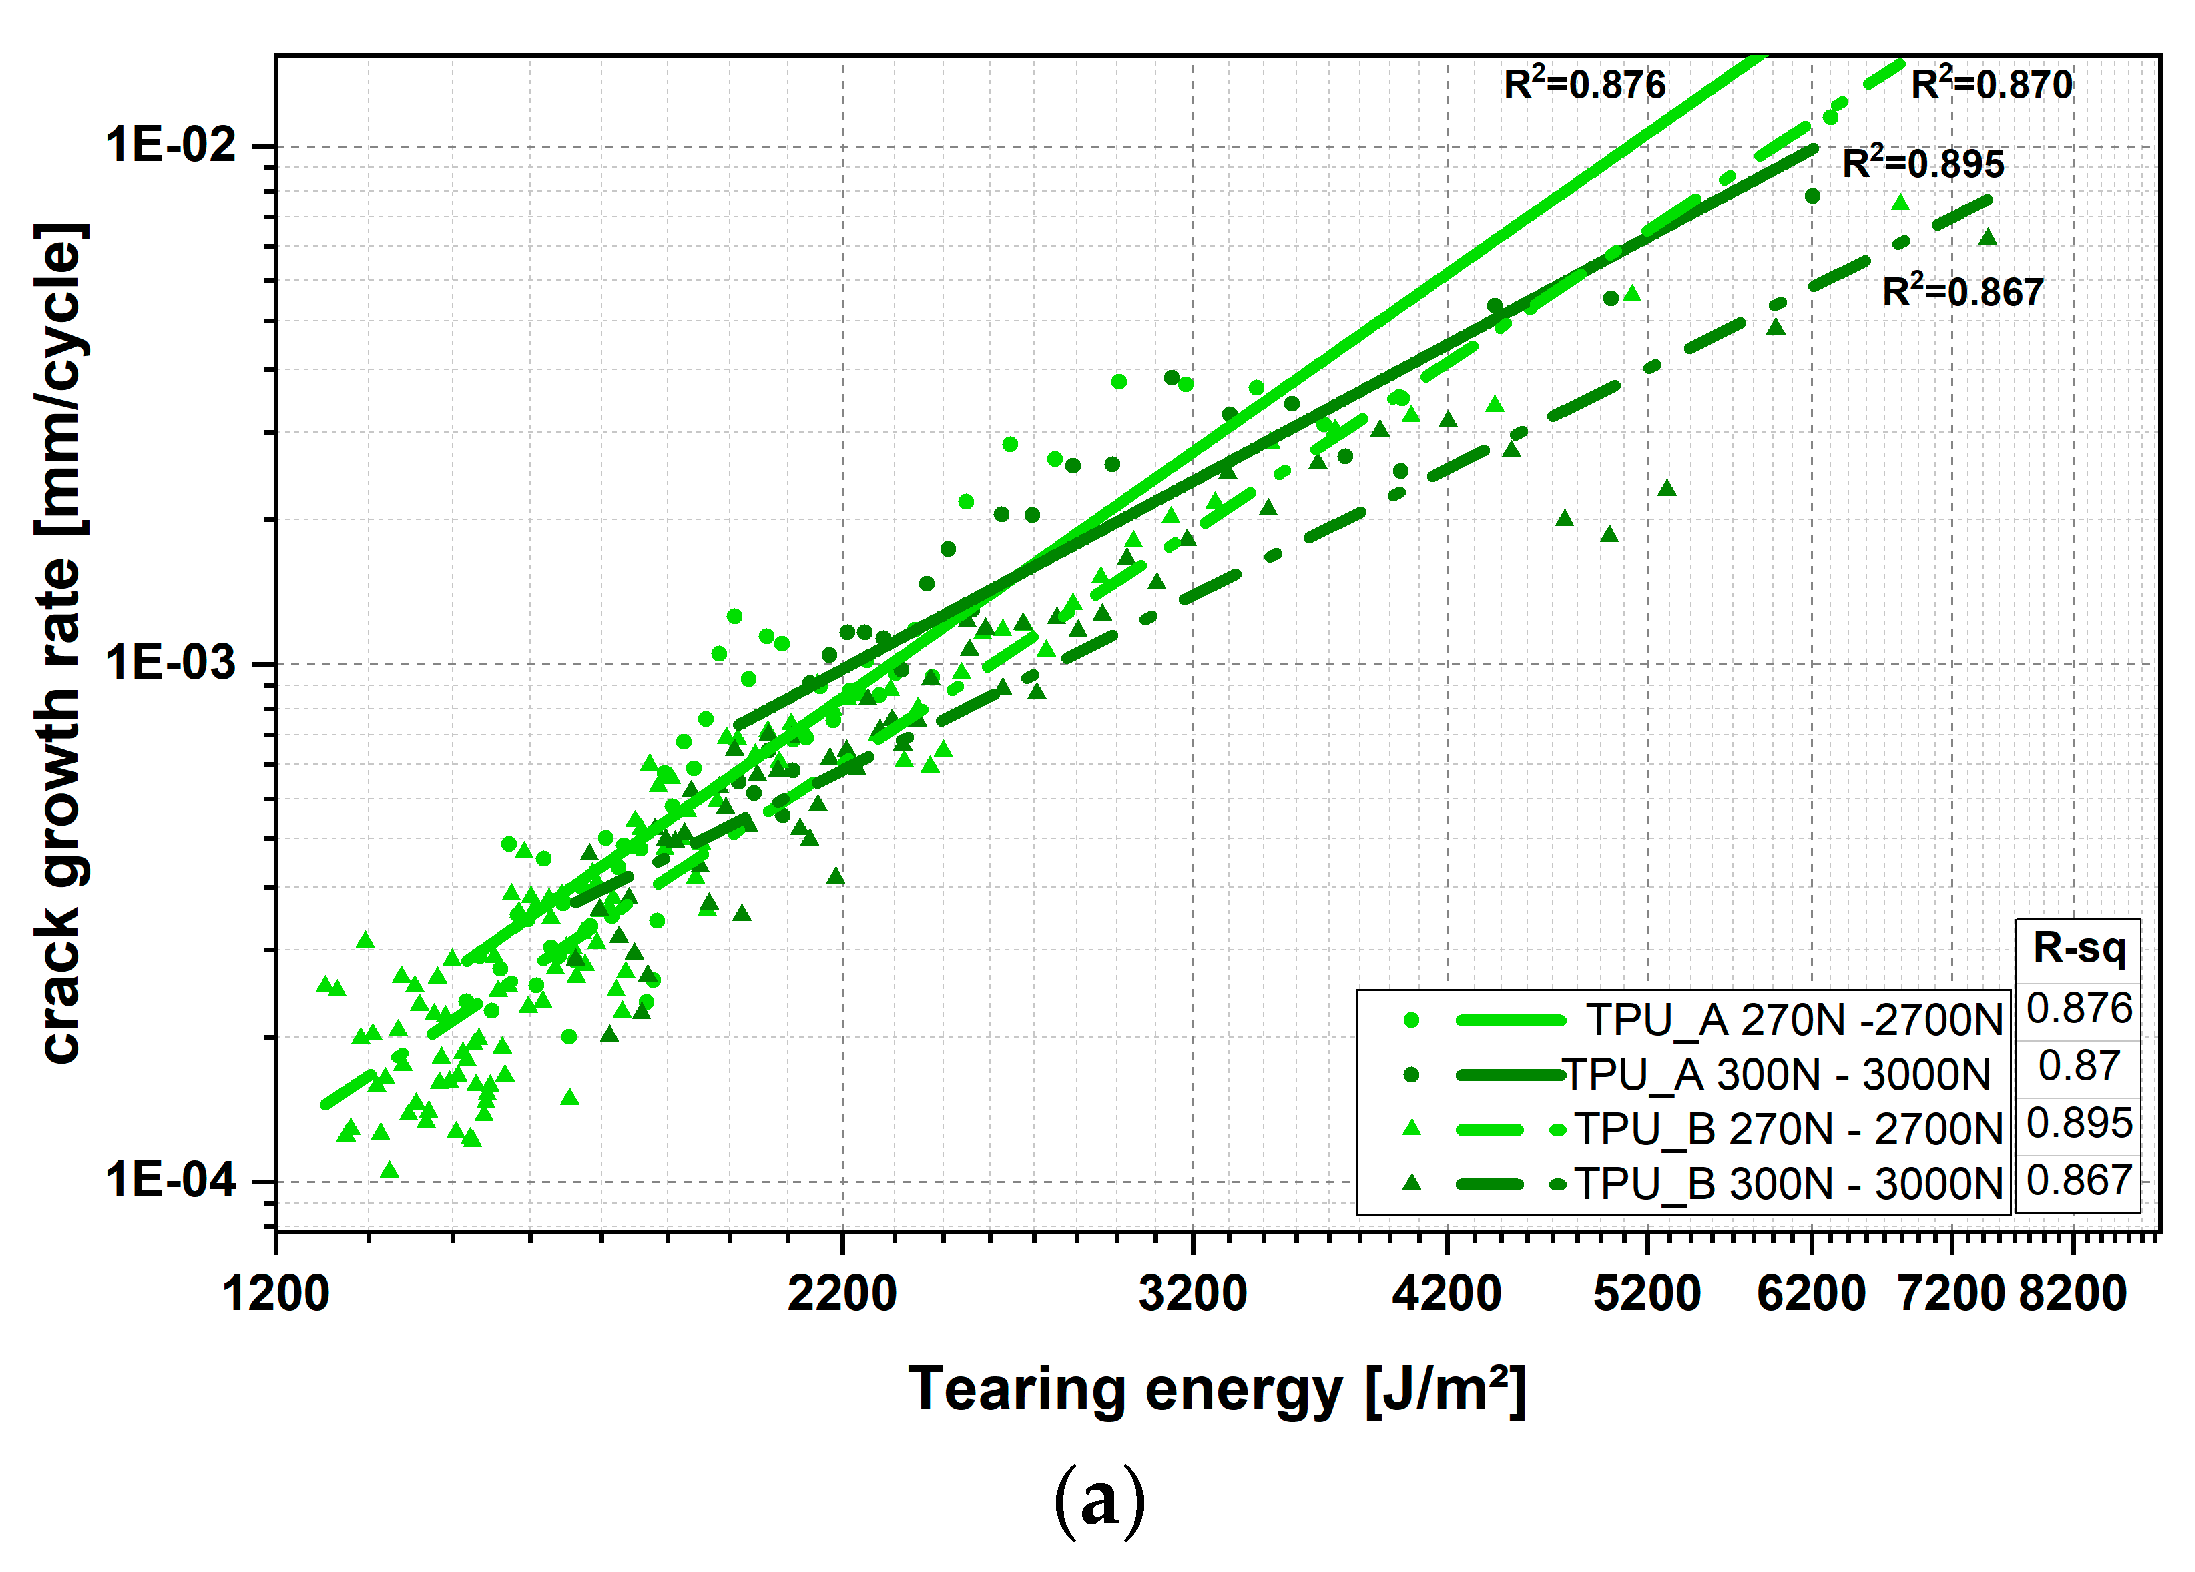
3.1.2. Crack Growth Tests
Tearing Energy Over Cycles
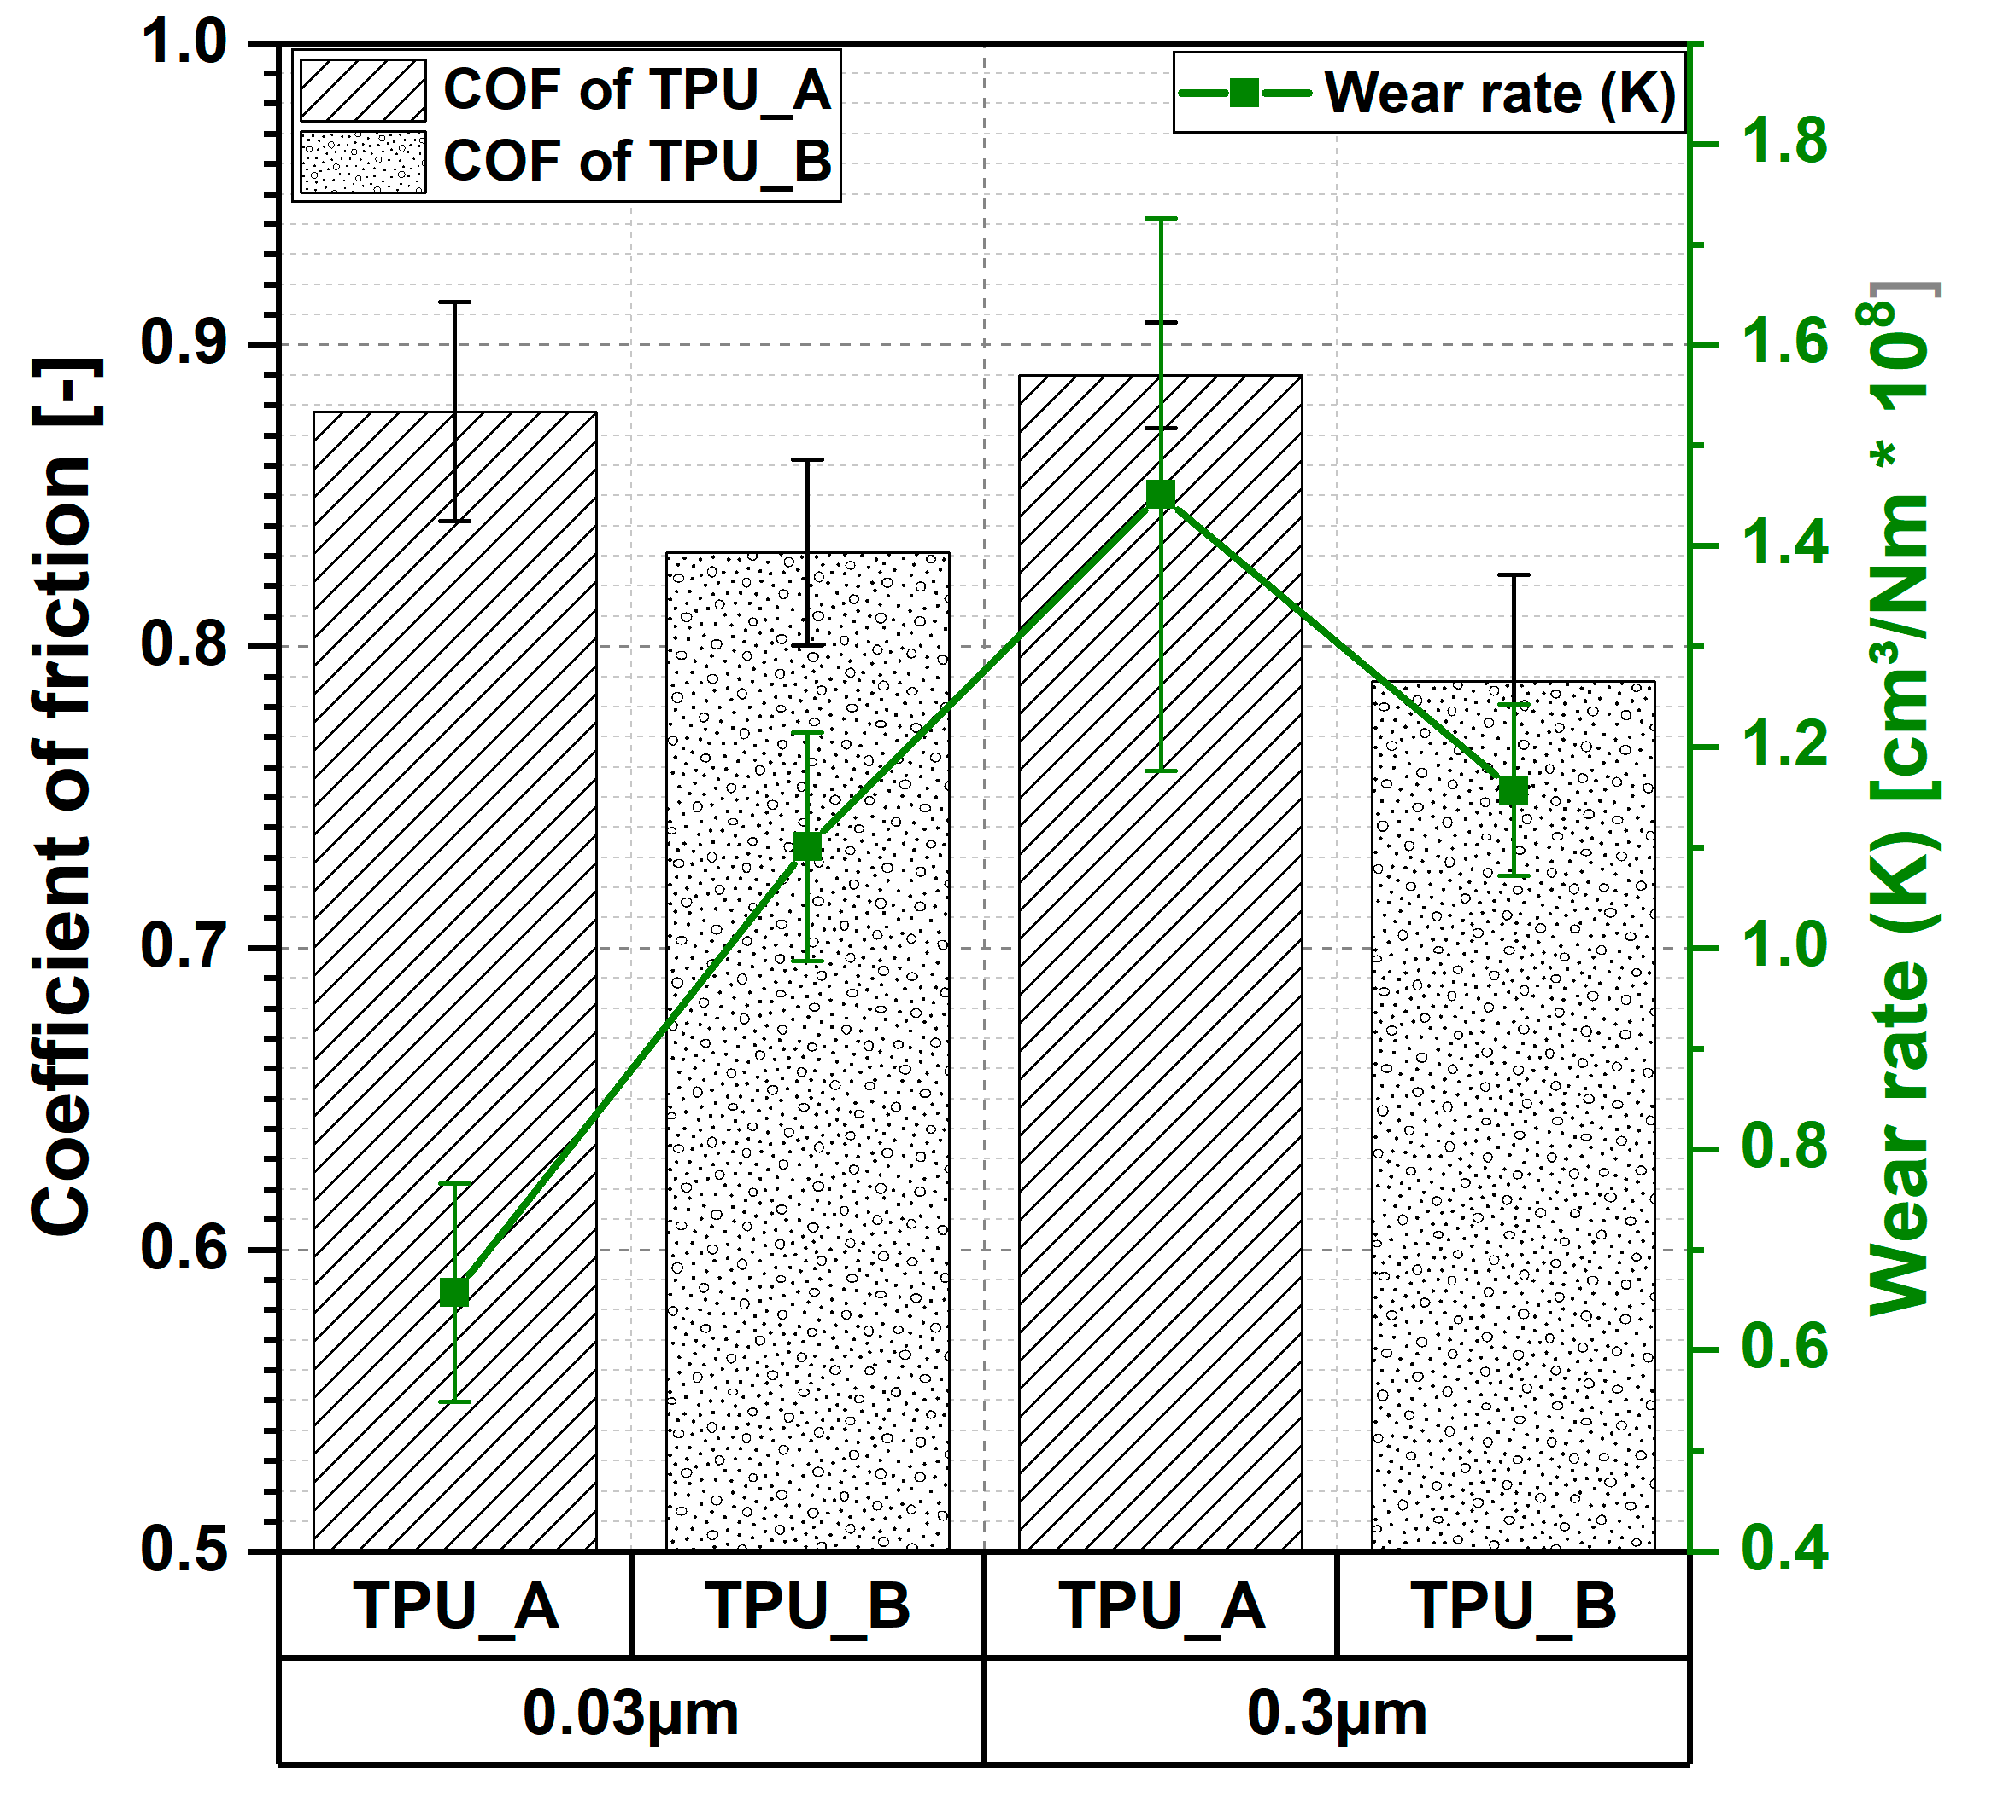
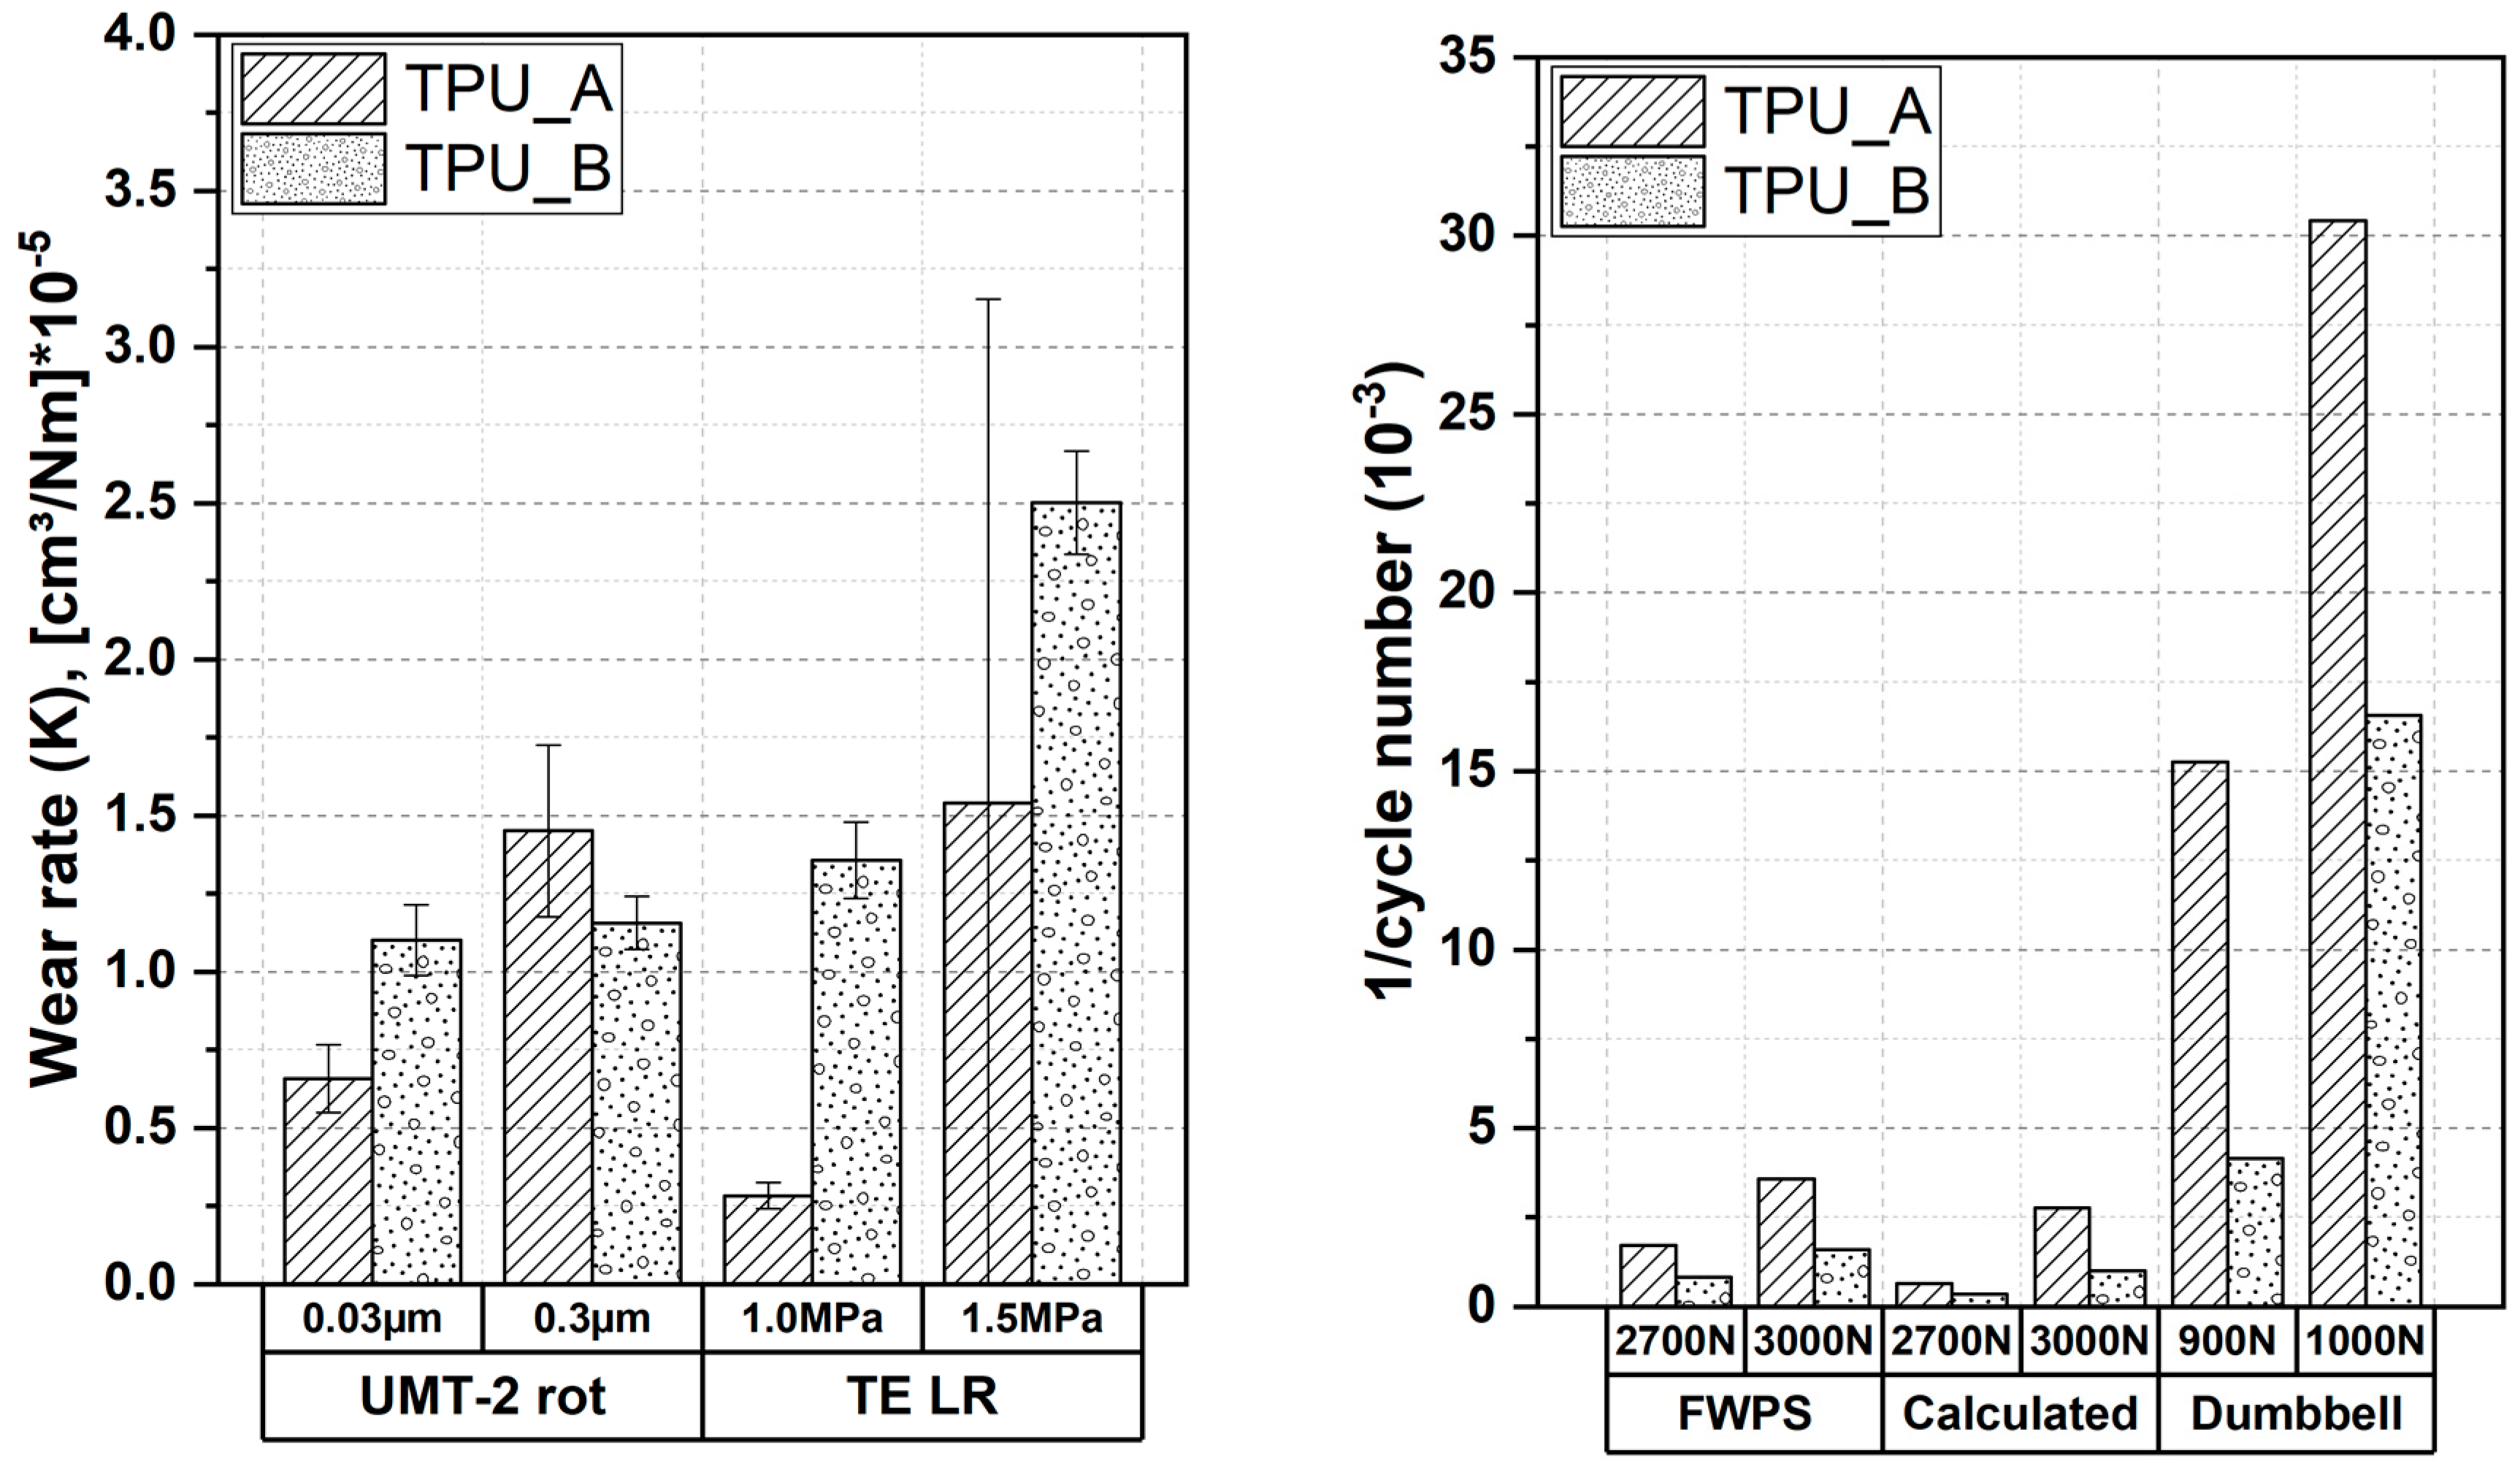
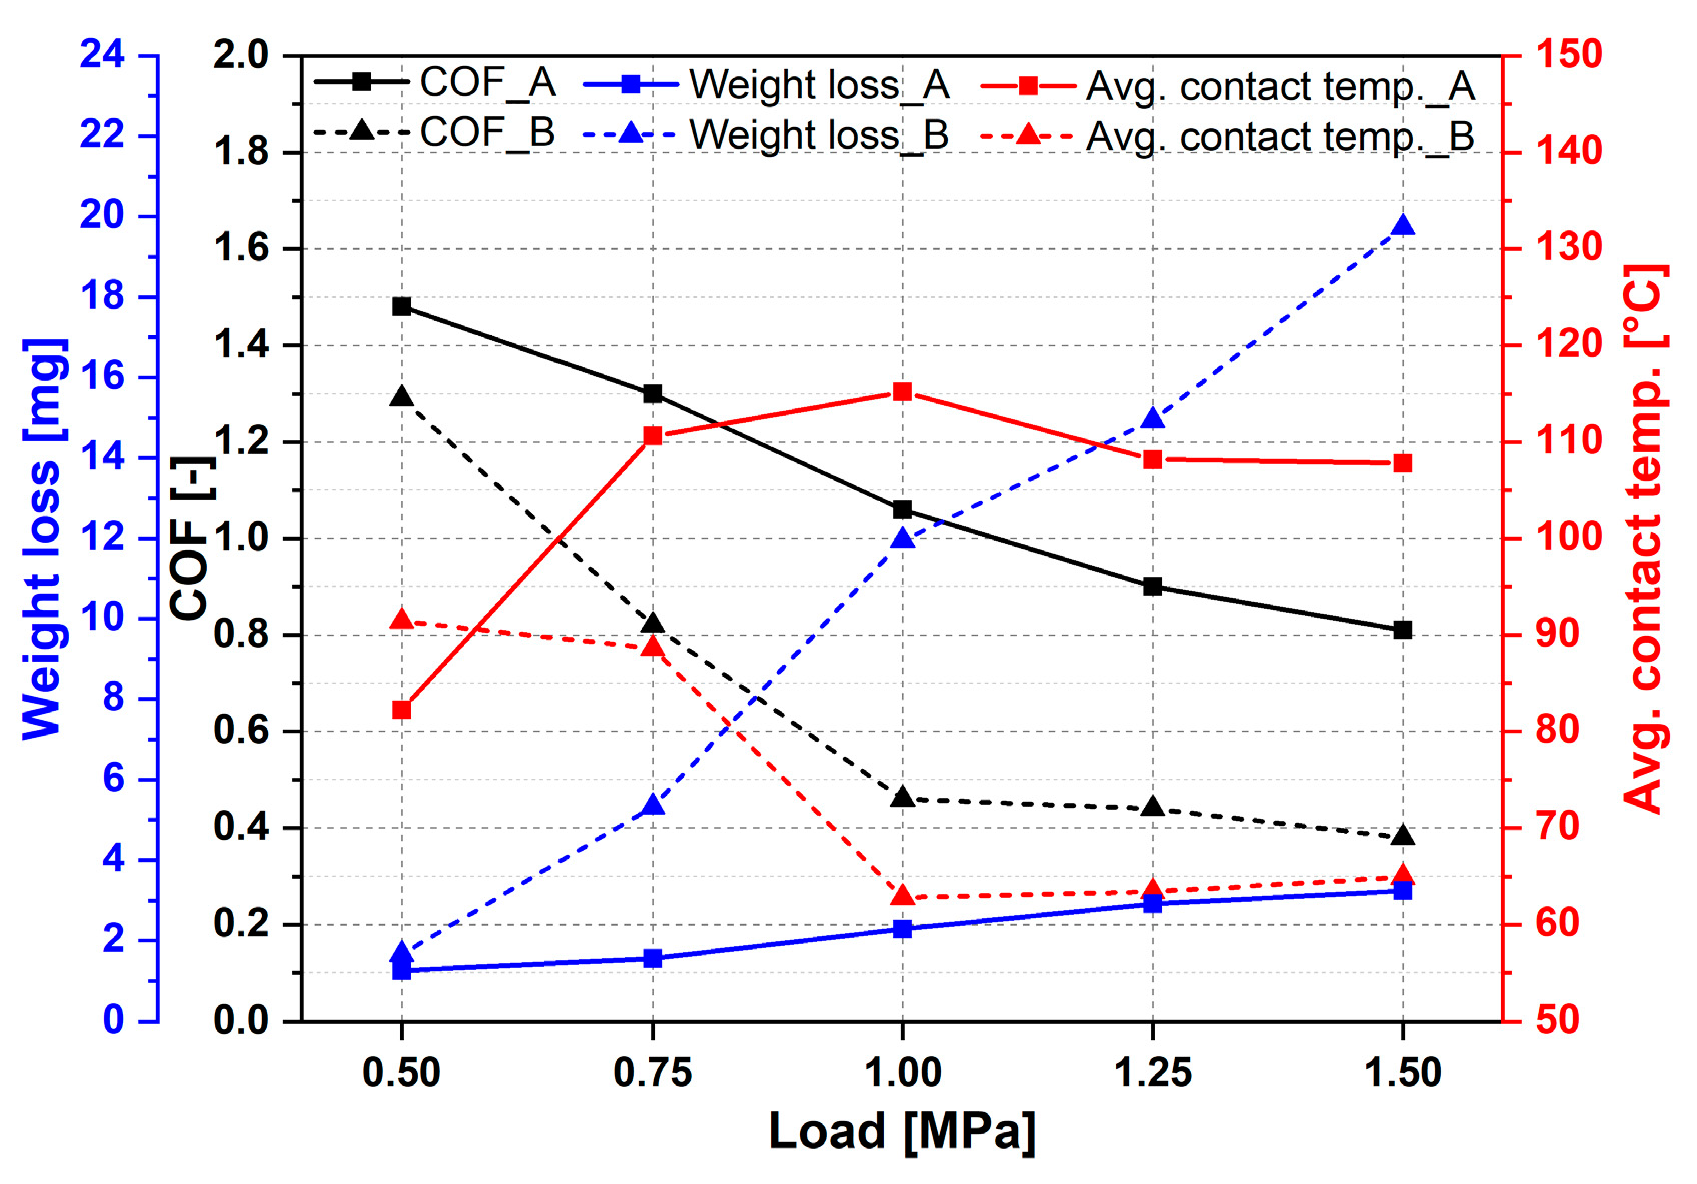
3.1.3. Tribological Tests
Load Ramp Tests
Pin on Disc Tests
3.2. Damage Analysis Proof
3.3. Verifications of Two Models
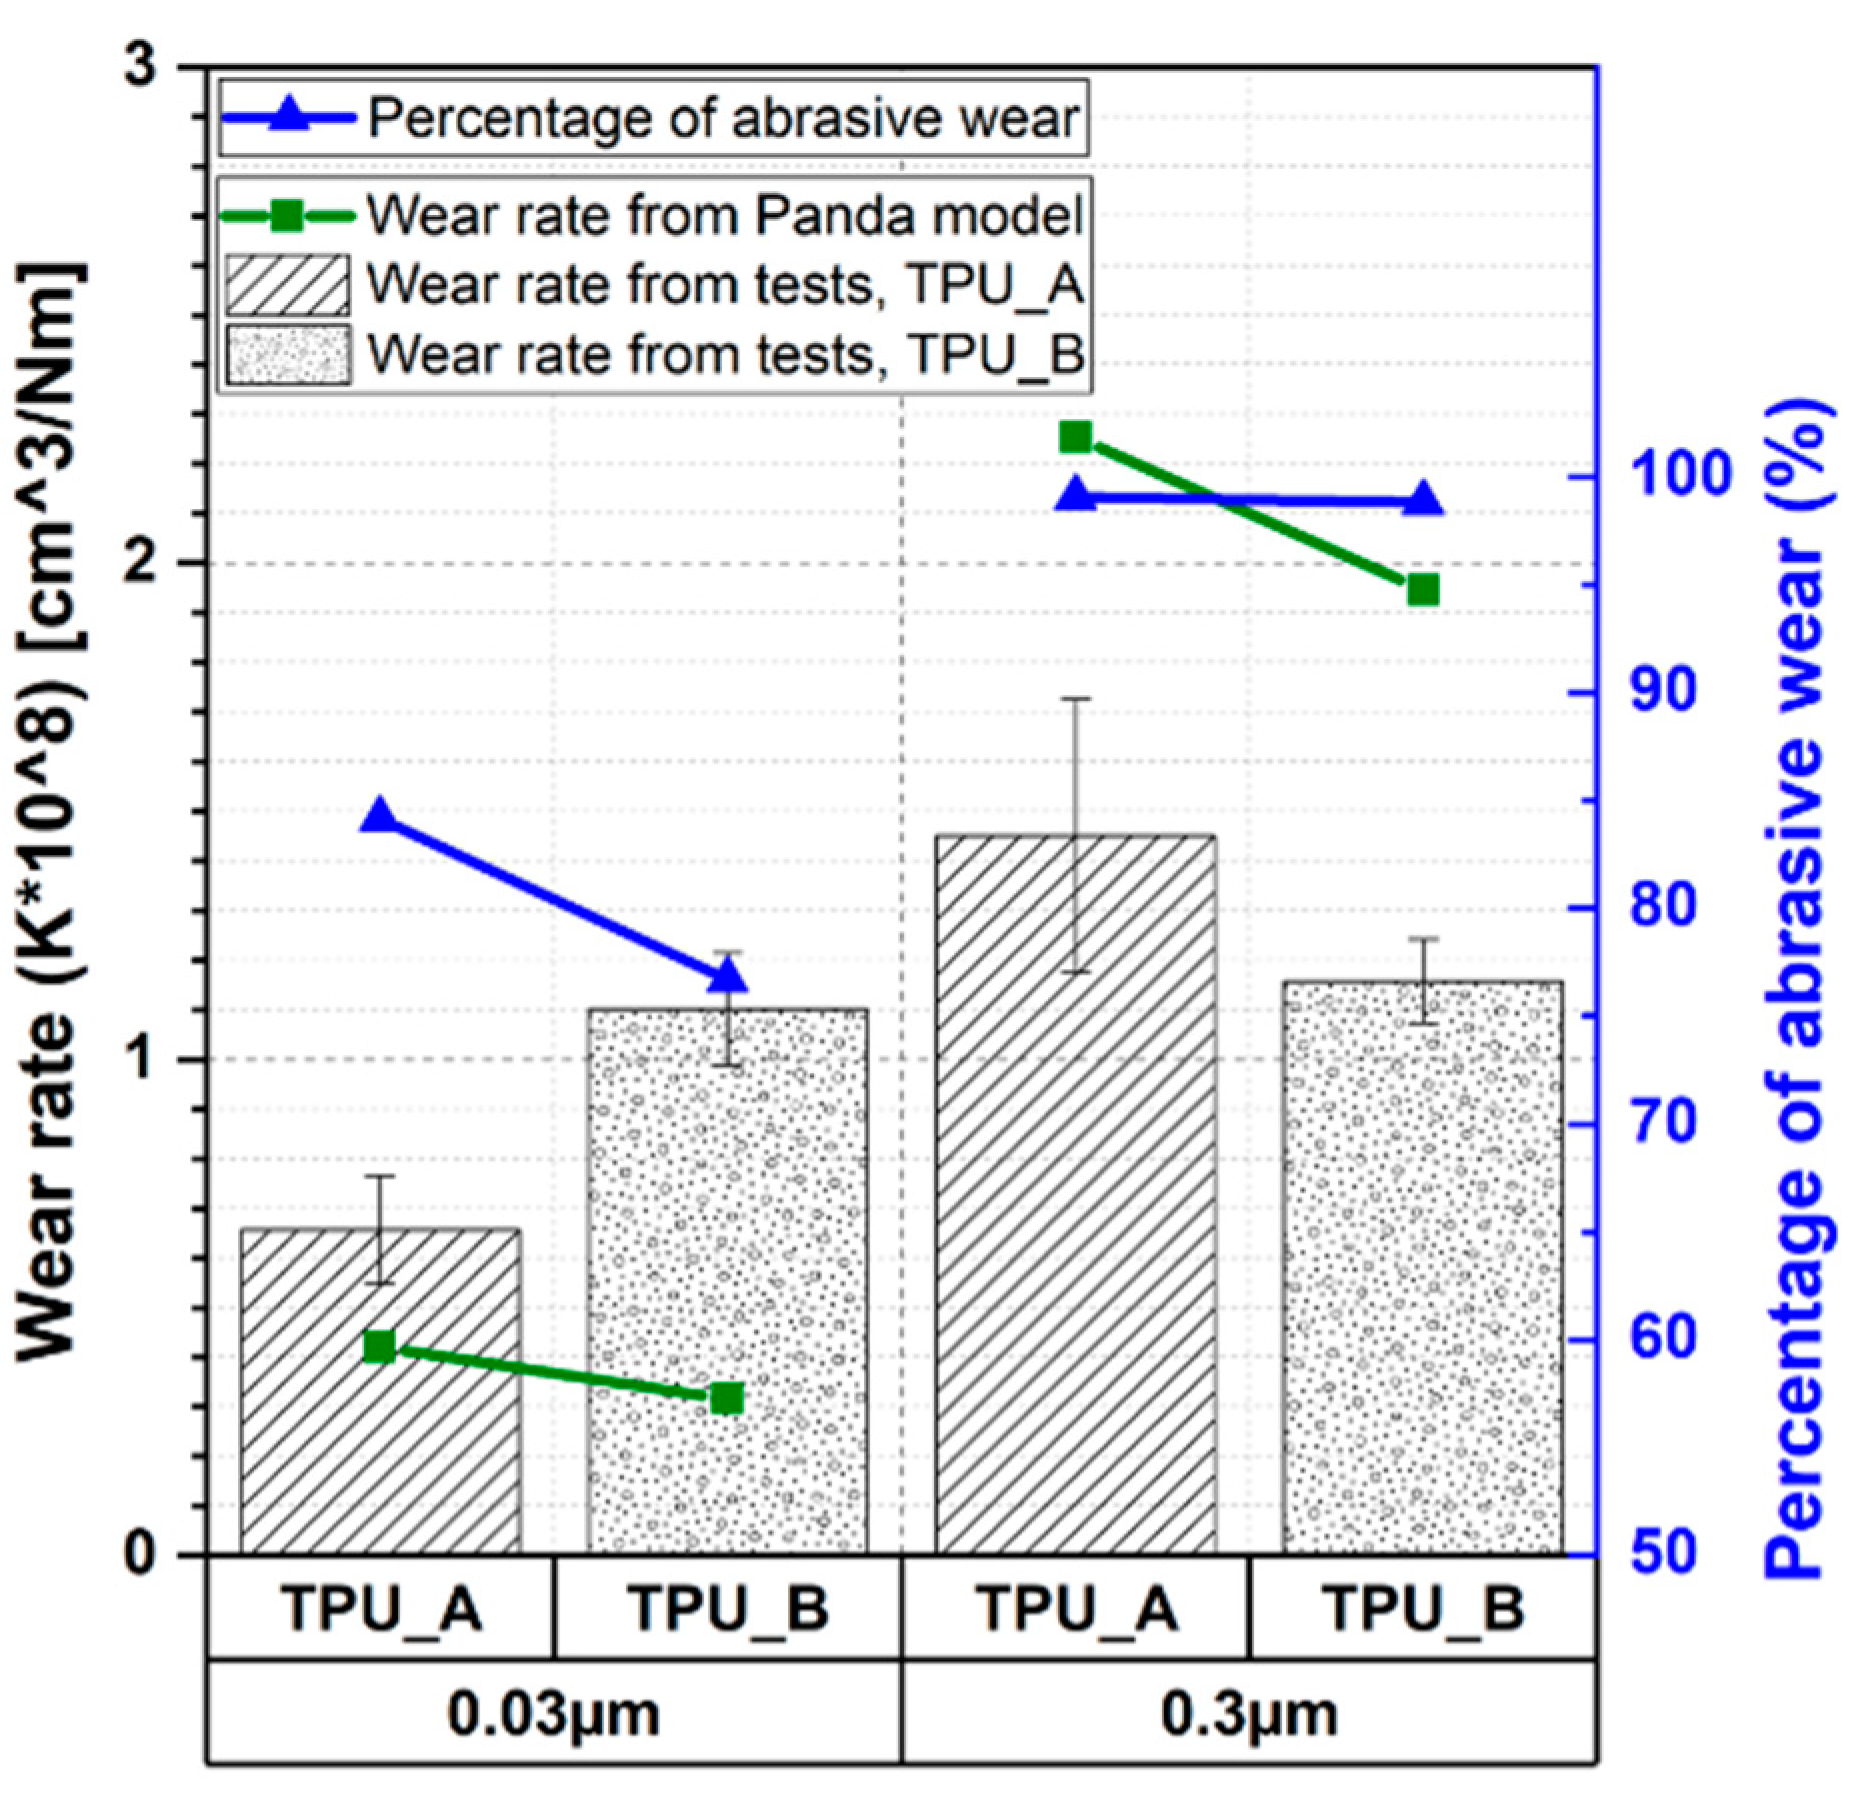
3.3.1. Panda’s Model

| Surfaces | σ (µm) | R (µm) | η (µm−2) | Sk | Ku | βSk | βKu |
|---|---|---|---|---|---|---|---|
| Rough ground | 0.68 | 1.211 | 7.39 × 10⁻⁴ | 0.06719 | 2.988 | 1.39 | 0.88 |
| Smooth polished | 0.26 | 2.28 | 7.60 × 10⁻⁴ | −0.215 | 3.367 | 1.99 | 0.96 |
- σ: Standard deviation of asperity heights;
- R: Average radius of curvature at asperity tip;
- η: Average asperity density per unit area;
- Sk: Skewness of asperity heights;
- Ku: Kurtosis of asperity heights;
- βSk: Weibull shape parameter from skewness;
- βKu: Weibull shape parameter from kurtosis.
| Materials | E (MPa) | H (MPa) | Sy (MPa) | ν | KIC (MPa m0.5) | t | γ (J m−2) | ρ (g/cm3) | α | |
|---|---|---|---|---|---|---|---|---|---|---|
| Rough | Smooth | |||||||||
| TPU_A | 17.2 ± 0.2 | 37.04 ± 0.57 | 10.5 ± 0.1 | 0.48 | 7.8 | 2.2 | 0.033 ± 0.001 | 1.196 ± 0.001 | 0.0694 | 0.1389 |
| TPU_B | 19.6 ± 0.3 | 41.27 ± 1.14 | 12 ± 0.2 | 0.48 | 8.9 | 2.0 | 0.037 ± 0.001 | 1.225 ± 0.001 | 0.0694 | 0.1042 |
| 100Cr6 steel | 2.1 × 10⁵ | 710 | 500 | 0.28 | - | - | - | 7.9 | ||
- E: Young’s modulus;
- H: Hardness, converted from Shore D [35];
- Sy: Yield strength; for TPU, the stress at 50% strain from tensile test was used.
- ν: Poisson’s ratio;
- KIC: Fracture toughness; the minimum values from dumbbell fatigue tests were used.
- t: Fatigue ratio; based on the empirical research.
- γ: Surface energy;
- ρ: Density;
- α: Factor of abrasive wear.
3.3.2. Atkins Model
3.3.3. Scope and Comparison of Both Models
4. Conclusions
- (1)
- Two models were verified to predict wear volume of filled and unfilled TPUs.
- (2)
- The fatigue properties were identified with dumbbell tests. Fillers show a beneficial effect on the fatigue property at both temperatures. However, inverse impacts of temperature on low and high stresses were identified. The crack growth rate was characterized by means of faint waist pure shear tests. Filled TPU shows a better crack growth resistance.
- (3)
- The tribological performance was characterized by various test configurations. An incubation period is necessary to generate a transfer film in the interface. Additionally, the influence of roughness of counterparts was identified.
- (4)
- Similar failure mechanisms were identified in dumbbell, FWPS, and tribological tests.
- (5)
- Panda’s model shows a better prediction for the tests with a rough counter surface, while the Atkins model is advantageous to predict the results of the tests with a smooth counter surface. For the tests with a rough counter surface, abrasive wear contributes to more than 96% of the total wear, whereas for a smooth counter surface, abrasive wear is still the primary wear origin, but fatigue wear is about 20% of the total wear. Therefore, for a test, which model is better depends mainly on which wear mechanism is dominant. However, a lot of work still needs to be done to predict the wear precisely. Several factors, e.g., transfer film, temperature, etc., which are essential to wear generation, are not taken into consideration in this study.
Author Contributions
Funding
Acknowledgments
Conflicts of Interest
References
- Drobny, J.G. Handbook of Thermoplastic Elastomers, 2nd ed.; Elsevier: Amsterdam, The Netherlands, 2014; ISBN 9780323221368. [Google Scholar]
- El-Sonbati, A.Z. Thermoplastic Elastomers; InTech: Rijeka, Croatia, 2012; ISBN 978-953-51-0346-2. [Google Scholar]
- Nguyen, D.A.; Lee, Y.R.; Raghu, A.V.; Jeong, H.M.; Shin, C.M.; Kim, B.K. Morphological and physical properties of a thermoplastic polyurethane reinforced with functionalized graphene sheet. Polym. Int. 2009, 58, 412–417. [Google Scholar] [CrossRef]
- Roy, S.; Srivastava, S.K.; Pionteck, J.; Mittal, V. Mechanically and Thermally Enhanced Multiwalled Carbon Nanotube-Graphene Hybrid filled Thermoplastic Polyurethane Nanocomposites. Macromol. Mater. Eng. 2015, 300, 346–357. [Google Scholar] [CrossRef]
- Suresha, B. Friction and Dry Slide Wear of Short Glass Fiber Reinforced Thermoplastic Polyurethane Composites. J. Reinf. Plast. Compos. 2010, 29, 1055–1061. [Google Scholar] [CrossRef]
- Barick, A.K.; Tripathy, D.K. Thermal and dynamic mechanical characterization of thermoplastic polyurethane/organoclay nanocomposites prepared by melt compounding. Mater. Sci. Eng. A 2010, 527, 812–823. [Google Scholar] [CrossRef]
- Pinto, U.A.; Visconte, L.L.Y.; Reis Nunes, R.C. Mechanical properties of thermoplastic polyurethane elastomers with mica and aluminum trihydrate. Eur. Polym. J. 2001, 37, 1935–1937. [Google Scholar] [CrossRef]
- Technical Committee ISO/TC 45 “Rubber and rubber products”. DIN ISO 7619-1:2012-02. Elastomere oder Thermoplastische Elastomere Bestimmung der Eindringhärte Teil_1: Durometer-Verfahren (Shore-Härte) (ISO_7619-1:2010); Beuth Verlag GmbH: Berlin, Germany, 2010. [Google Scholar]
- Technical Committee ISO/TC 61/SC 2/WG 1 “Static behavior”. DIN EN ISO 527-2:2012-06. Kunststoffe Bestimmung der Zugeigenschaften Teil_2: Prüfbedingungen für Form-und Extrusionsmassen (ISO_527-2:2012), Deutsche Fassung EN_ISO_527-2:2012; Beuth Verlag GmbH: Berlin, Germany, 2012. [Google Scholar]
- Panda, S.; Sarangi, M.; Roy Chowdhury, S.K. An Analytical Model of Mechanistic Wear of Polymers. J. Tribol. 2018, 140, 11609. [Google Scholar] [CrossRef]
- Omar, M.K.; Atkins, A.G.; Lancaster, J.K. The role of crack resistance parameters in polymer wear. J. Phys. D Appl. Phys. 1986, 19, 177–195. [Google Scholar] [CrossRef]
- Chang, W.R.; Etsion, I.; Bogy, D.B. An Elastic-Plastic Model for the Contact of Rough Surfaces. J. Tribol. 1987, 109, 257–263. [Google Scholar] [CrossRef]
- Fuller, K.N.G.; Tabor, D. The Effect of Surface Roughness on the Adhesion of Elastic Solids. Proc. R. Soc. A Math. Phys. Eng. Sci. 1975, 345, 327–342. [Google Scholar] [CrossRef]
- Bahadur, S. The development of transfer layers and their role in polymer tribology. Wear 2000, 245, 92–99. [Google Scholar] [CrossRef]
- Briscoe, B.J.; Sinha, S.K. Wear of polymers. Proc. Inst. Mech. Eng. Part J J. Eng. Tribol. 2002, 216, 401–413. [Google Scholar] [CrossRef]
- Rhee, S.H.; Ludema, K.C. Mechanisms of formation of polymeric transfer films. Wear 1978, 46, 231–240. [Google Scholar] [CrossRef] [Green Version]
- Technical Committee NA 152-03-03 AA “Surfaces”. DIN EN ISO 25178-1:2016-12. Geometrische Produktspezifikation_(GPS)_Oberflächenbeschaffenheit: Flächenhaft_Teil_1: Angabe von Oberflächenbeschaffenheit (ISO_25178-1:2016), Deutsche Fassung EN_ISO_25178-1:2016; Beuth Verlag GmbH: Berlin, Germany, 2016. [Google Scholar]
- Owens, D.K.; Wendt, R.C. Estimation of the surface free energy of polymers. J. Appl. Polym. Sci. 1969, 13, 1741–1747. [Google Scholar] [CrossRef]
- Rabel, W. Einige Aspekte der Benetzungstheorie und ihre Anwendung auf die Untersuchung und Veränderung der Oberflächeneigenschaften von Polymeren. Farbe und Lack 1971, 77, 997–1005. [Google Scholar]
- Kaelble, D.H. Dispersion-Polar Surface Tension Properties of Organic Solids. J. Adhes. 1970, 2, 66–81. [Google Scholar] [CrossRef]
- Schrittesser, B. Performance of Elastomers for High-Pressure Applications. Ph.D. Thesis, University of Leoben, Leoben, Austria, 2014. [Google Scholar]
- Stiller, T. InSitutribological and Fracture Mechanical Investigation of Thermoplastic Polyurethanes. Master’s Thesis, Montanuniversität Leoben, Leoben, Austria, 2013. [Google Scholar]
- Wang, C.H. Introduction to Fracture Mechanics; DSTO Aeronautical and Maritime Research Laboratory: Melbourne, Australia, 1996. [Google Scholar]
- Joelly, I.A. Assessment of Contact Pressure and Sliding Velocity on the Tribological Performance of TPU SEAL Materials for the Establishment of a Rating System. Master’s Thesis, Montanuniversität leoben, Leoben, Austria, 2011. [Google Scholar]
- Stachowiak, G.W.; Batchelor, A.W. Engineering Tribology; Elsevier: Amsterdam, The Netherlands, 1993; ISBN 0-444-89235-4. [Google Scholar]
- Stoček, R. Dynamische Rissausbreitung in Elastomerwerkstoffen. Dissertation, Technische Universität Chemnitz, Chemnitz, Germany, 2011. [Google Scholar]
- Gdoutos, E.E.; Daniel, I.M.; Schubel, P. Fracture Mechanics of Rubbe; Socirety of Rubber Science and Technology Japan: Tokyo, Japan, 2003. [Google Scholar]
- Benthem, J.P.; Koiter, W.T. Asymptotic approximations to crack problems. In Methods of Analysis and Solutions of Crack Problems; Sih, G.C., Ed.; Springer: Dordrecht, The Netherlands, 1973; pp. 131–178. ISBN 978-90-481-8246-6. [Google Scholar]
- Schieppati, J.; Schrittesser, B.; Wondracek, A.; Robin, S.; Holzner, A.; Pinter, G. Impact of temperature on the fatigue and crack growth behavior of rubbers. Procedia Struct. Integr. 2018, 13, 642–647. [Google Scholar] [CrossRef]
- Schallamach, A. The Load Dependence of Rubber Friction. Proc. Phys. Soc. B 1952, 65, 657–661. [Google Scholar] [CrossRef]
- Grün, F.; Sailer, W.; Gódor, I. Visualization of the processes taking place in the contact zone with in-situ tribometry. Tribol. Int. 2012, 48, 44–53. [Google Scholar] [CrossRef]
- Gódor, I.; Schiffer, J.; Grün, F.; Schwarz, T.; Major, Z. Tribological Behaviour of Unfilled and Filled TPU Materials. In Proceedings of the 14th Nordic Symposium on Tribology, Storforsen, Sweden, 8–11 June 2010; p. 59. [Google Scholar]
- Hausberger, A.; Major, Z.; Theiler, G.; Gradt, T. Observation of the adhesive- and deformation- contribution to the friction and wear behaviour of thermoplastic polyurethanes. Wear 2018, 412, 14–22. [Google Scholar] [CrossRef]
- Wang, C.; Hausberger, A.; Nothdurft, P.; Lackner, J.; Schwarz, T. The Potential of Tribological Application of DLC/MoS2 Coated Sealing Materials. Coatings 2018, 8, 267. [Google Scholar] [CrossRef]
- Pampush, J.D.; Daegling, D.J.; Vick, A.E.; McGraw, W.S.; Covey, R.M.; Rapoff, A.J. Technical note: Converting durometer data into elastic modulus in biological materials. Am. J. Phys. Anthropol. 2011, 146, 650–653. [Google Scholar] [CrossRef]


| Shore D | Density [g/cm3] | Thermal Conductivity [W/mK] | Dynamic Mechanical Analysis (2Hz) | ||||
|---|---|---|---|---|---|---|---|
| Temperature [°C] | Storage Modulus [MPa] | Loss Modulus [MPa] | Loss Factor | ||||
| TPU_A | 46 ± 0.71 | 1.196 ± 0.001 | 0.209 ± 0.001 | 23 | 100.07 ± 6.87 | 17.68 ± 2.10 | 0.1763 ± 0.009 |
| 80 | 42.08 ± 0.36 | 1.74 ± 0.09 | 0.0413 ± 0.0018 | ||||
| TPU_B | 49 ± 1.58 | 1.225 ± 0.001 | 0.229 ± 0.001 | 23 | 110.97 ± 7.37 | 19.70 ± 2.37 | 0.1771 ± 0.0095 |
| 80 | 47.57 ± 0.34 | 1.95 ± 0.10 | 0.0410 ± 0.0018 | ||||
| TPU_A | TPU_B | |
|---|---|---|
| 0.5 MPa | 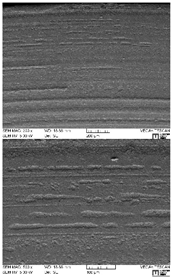 |  |
| 1.0 MPa | 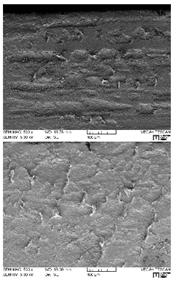 | 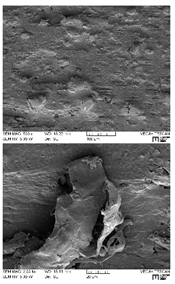 |
| 1.5 MPa | 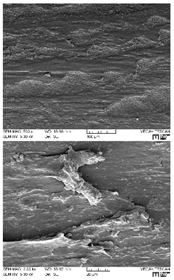 |  |
| Tribo | Dumbbell | FWPS | |
|---|---|---|---|
| TPU_A |  |  | 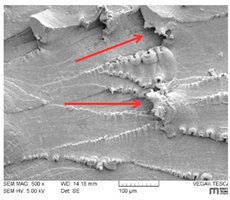 |
| TPU_B | 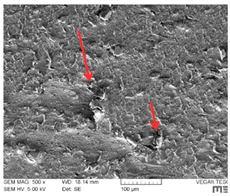 | 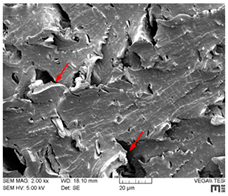 | 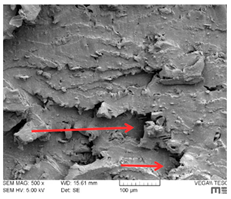 |
© 2019 by the authors. Licensee MDPI, Basel, Switzerland. This article is an open access article distributed under the terms and conditions of the Creative Commons Attribution (CC BY) license (http://creativecommons.org/licenses/by/4.0/).
Share and Cite
Wang, C.; Stiller, T.; Hausberger, A.; Pinter, G.; Grün, F.; Schwarz, T. Correlation of Tribological Behavior and Fatigue Properties of Filled and Unfilled TPUs. Lubricants 2019, 7, 60. https://doi.org/10.3390/lubricants7070060
Wang C, Stiller T, Hausberger A, Pinter G, Grün F, Schwarz T. Correlation of Tribological Behavior and Fatigue Properties of Filled and Unfilled TPUs. Lubricants. 2019; 7(7):60. https://doi.org/10.3390/lubricants7070060
Chicago/Turabian StyleWang, Chao, Tanja Stiller, Andreas Hausberger, Gerald Pinter, Florian Grün, and Thomas Schwarz. 2019. "Correlation of Tribological Behavior and Fatigue Properties of Filled and Unfilled TPUs" Lubricants 7, no. 7: 60. https://doi.org/10.3390/lubricants7070060