Article

Experimental and Numerical Simulation of the Dynamic Frictional Contact between an Aircraft Tire Rubber and a Rough Surface

by
Iulian Rosu
1,
Hélène L. Elias-Birembaux
1,*,
Frédéric Lebon
1,
Hagen Lind
2 and
Matthias Wangenheim
2
1
LMA CNRS UPR 7051, Aix-Marseille University, Centrale Marseille, 4 impasse Nikola Tesla, CS40006, 13453 Marseille Cedex 13, France
2
Institute of Dynamics and Vibration Research, Leibniz University Hannover, Appelstr. 11, D-30167 Hannover, Germany
*
Author to whom correspondence should be addressed.
Lubricants 2016, 4(3), 29; https://doi.org/10.3390/lubricants4030029
Submission received: 15 January 2016 / Revised: 30 June 2016 / Accepted: 21 July 2016 / Published: 17 August 2016
(This article belongs to the Special Issue Numerical Simulation of Static and Dynamic Friction)

Abstract

:
This paper presents a numerical simulation of an aircraft tire in contact with a rough surface using a variable friction coefficient dependent on temperature and contact pressure. A sliding facility was used in order to evaluate this dependence of the friction coefficient. The temperature diffusion throughout the tire cross-section was measured by means of thermocouples. Both frictional heating and temperature diffusion were compared to numerical two- and three- dimensional simulations. An adequate temperature prediction could be obtained. In future simulations, wear should be taken into account in order to have a more accurate simulation especially in the case of high pressures and slipping velocities. A 3D finite element model for a rolling tire at a velocity of 37.79 knots (19.44 m/s) and in a cornering phase was investigated using a variable friction coefficient dependent on temperature and pressure. The numerical simulation tended to predict the temperature of the tire tread after a few seconds of rolling in skidding position, the temperature of the contact zone increases to 140 °C. Further investigations must be carried out in order to obtain the evolution of the temperature observed experimentally. The authors would like to point out that for confidentiality reasons, certain numerical data could not be revealed.

Graphical Abstract

1. Introduction

Aircraft tires are subject to very high performance requirements when providing directional control and braking during the maneuvering of the airplane on the ground. The tires must not only support the aircraft’s weight, and transmit acceleration and braking forces to the runway surface, but also supply the forces necessary for the directional control of the aircraft [1]. It is well known that the directional capacity of an aircraft is measured by the friction coefficient [2]; this is the measurement of the contact area forces as a fraction of the aircraft’s weight. In the field of aeronautics, NASA carried out the first experimental and related studies [3,4,5] on the thermal aspect (influence of temperature and its distribution) of the evolution of the friction coefficient between the tire and the ground. Subsequently, many other studies also investigated the interaction of various phenomena in the contact area, with the friction coefficient [6,7,8]. As friction is the major factor for generating forces on the aircraft through the tire, it is extremely important to have an accurate characterization of the magnitude and direction of the frictional force generated at the ground/tire interface. Generally, the normalized tire friction coefficient μ = Fy/Fz is used in most tire friction models, where Fy is the tangential friction force at the tire/runway interface and Fz is the vertical loading on the tire (Figure 1). Thus, μ is the sliding friction coefficient, this being a nonlinear function depending principally on the velocity of the tire. Grosch [9] studied different vulcanized rubber tires and described the dependence of the friction coefficient on sliding velocity, temperature and surface roughness. He explained that friction is due to energy dissipation when rubber is compressed and released by asperities. The friction coefficient also depends on several airplane factors (loading, velocity, slip ratio, slip angle) [10,11,12], tire factors (tire type, inflation pressure, tread design, rubber composition) [13], runway surface conditions (roughness, dryness and wetness) [14] and also environmental factors (weather conditions and contamination) [15,16].
Persson studied tire rubber friction in the context of road vehicle tires and also the role of surfaces in contact [17,18,19]. He developed a theory on the influence of temperature on the rubber friction coefficient called “flash temperature” [19]. He showed that rubber friction depends on the sliding history (memory effects), which is crucial for an accurate description of rubber friction. For rubber sliding on a hard rough substrate, the history dependence of the friction is mainly due to frictional heating in the rubber/surface contact region. Most solid surfaces have a roughness of many different orders of magnitude. When calculating the friction force, it is necessary to include the viscoelastic deformations at all length scales. The energy dissipation results in the localized heating of the rubber. Since the viscoelastic properties of rubber-like materials are extremely temperature- dependent, it is necessary to include the localized temperature increase in the analysis. At very low sliding velocities, the temperature increase is negligible due to heat diffusion. However, for velocities in the order of 0.01 m/s, localized heating does indeed play a role. Persson showed, that in a typical case, the temperature increase results in a decrease of rubber friction with increasing sliding velocity (if the sliding velocity is above 0.01 m/s).
In precedent papers [20,21,22], FEM models are proposed to simulate the aircraft tire behavior in contact with the runway and coupled thermo-mechanical analysis procedures are discussed. The entire frictional work is converted to heat. The contact/friction state is governed by a variable friction coefficient depending on the sliding velocity, contact pressure and temperature. The present paper presents the numerical simulation of an aircraft tire in contact with a rough surface, using a variable friction coefficient dependent on temperature and contact pressure. Firstly, a sliding facility with rubber block samples under sliding conditions is used, under different fixed vertical pressures, with a constant sliding velocity. The friction coefficient was determined and the thermal evolution of the rubber samples discussed. Secondly, experimental tests were carried out in order to simulate the frictional heating phenomenon developed in the tire tread, using an external heat source. In these studies, experimental parameters corresponding to the real parameters of an aircraft tire in rolling conditions (vertical loading, velocity, inflation pressure and skidding angle) have been used. Two- and three-dimensional numerical simulations were conducted for sliding and thermal diffusion. Finally, a three-dimensional finite element model for a rolling tire at a velocity of 37.79 knots (19.44 m/s) in a cornering mode was investigated using a variable friction coefficient dependent on temperature and pressure. The thermal evolution of the tire rubber during this rolling phase was compared to experimental data.

Rubber Block Frictional Heat

Tread rubber characteristics play a crucial role in tire force generation; they describe tread stiffness, friction properties and heat generation. Energy loss and modulus vary, not only from one compound to another, but also depending on stress frequency and on temperature. Tread rigidity is directly related to the rubber shear modulus G”, as rubber becomes softer when its bulk temperature increases; tread rigidity will depend on the tire temperature increase. Higher cornering stiffness is obtained at a lower tire tread temperature [23]. Fevrier et al. demonstrate the mechanisms involved in the relative slippage between the tire tread and runway. The first mechanism is the frequency excitation of the material by the runway surface texture. The rubber is distorted when it comes into contact with rough spots on the runway, thus leading to energy loss (hysteresis). The second mechanism is molecular adhesion. As regards the energy balance, both hysteresis and adhesion result from the transformation of mechanical energy in the contact zone. Thus, friction is not only a mechanical process but is also related to the thermal evolution of the rubber, which means that a thermo-mechanical contact model is essential for a reliable description of the frictional behavior.
Kainradl et al. [24] also studied the thermal evolution of the tire tread in a rolling phase. They demonstrate that the tire tread temperature rise is due to frictional heating, which does not significantly affect the temperature profiles within the tire carcass structure. However, these tread temperature peaks probably have a significant influence on tread wear rates. It is well known that the maximum friction level developed by a worn tire is shown to be more sensitive to variations in tread temperature and velocity. It was observed that a tire in cornering or braking conditions at a high angle produced molten rubber deposits on the runway surface and tread temperatures high enough to cause the rubber to undergo changes in its chemical composition [3]. For all these reasons, a profound study of tread rubber in skidding positions is primordial, in order to establish a dynamic friction coefficient dependence on contact pressure, sliding velocity and temperature. In the literature, few experiments have been realized to determine the temperature rise in the contact area between an aircraft tire rubber and a rigid, rough runway [4,5].

2. Experimental and Numerical Studies: Materials and Methods

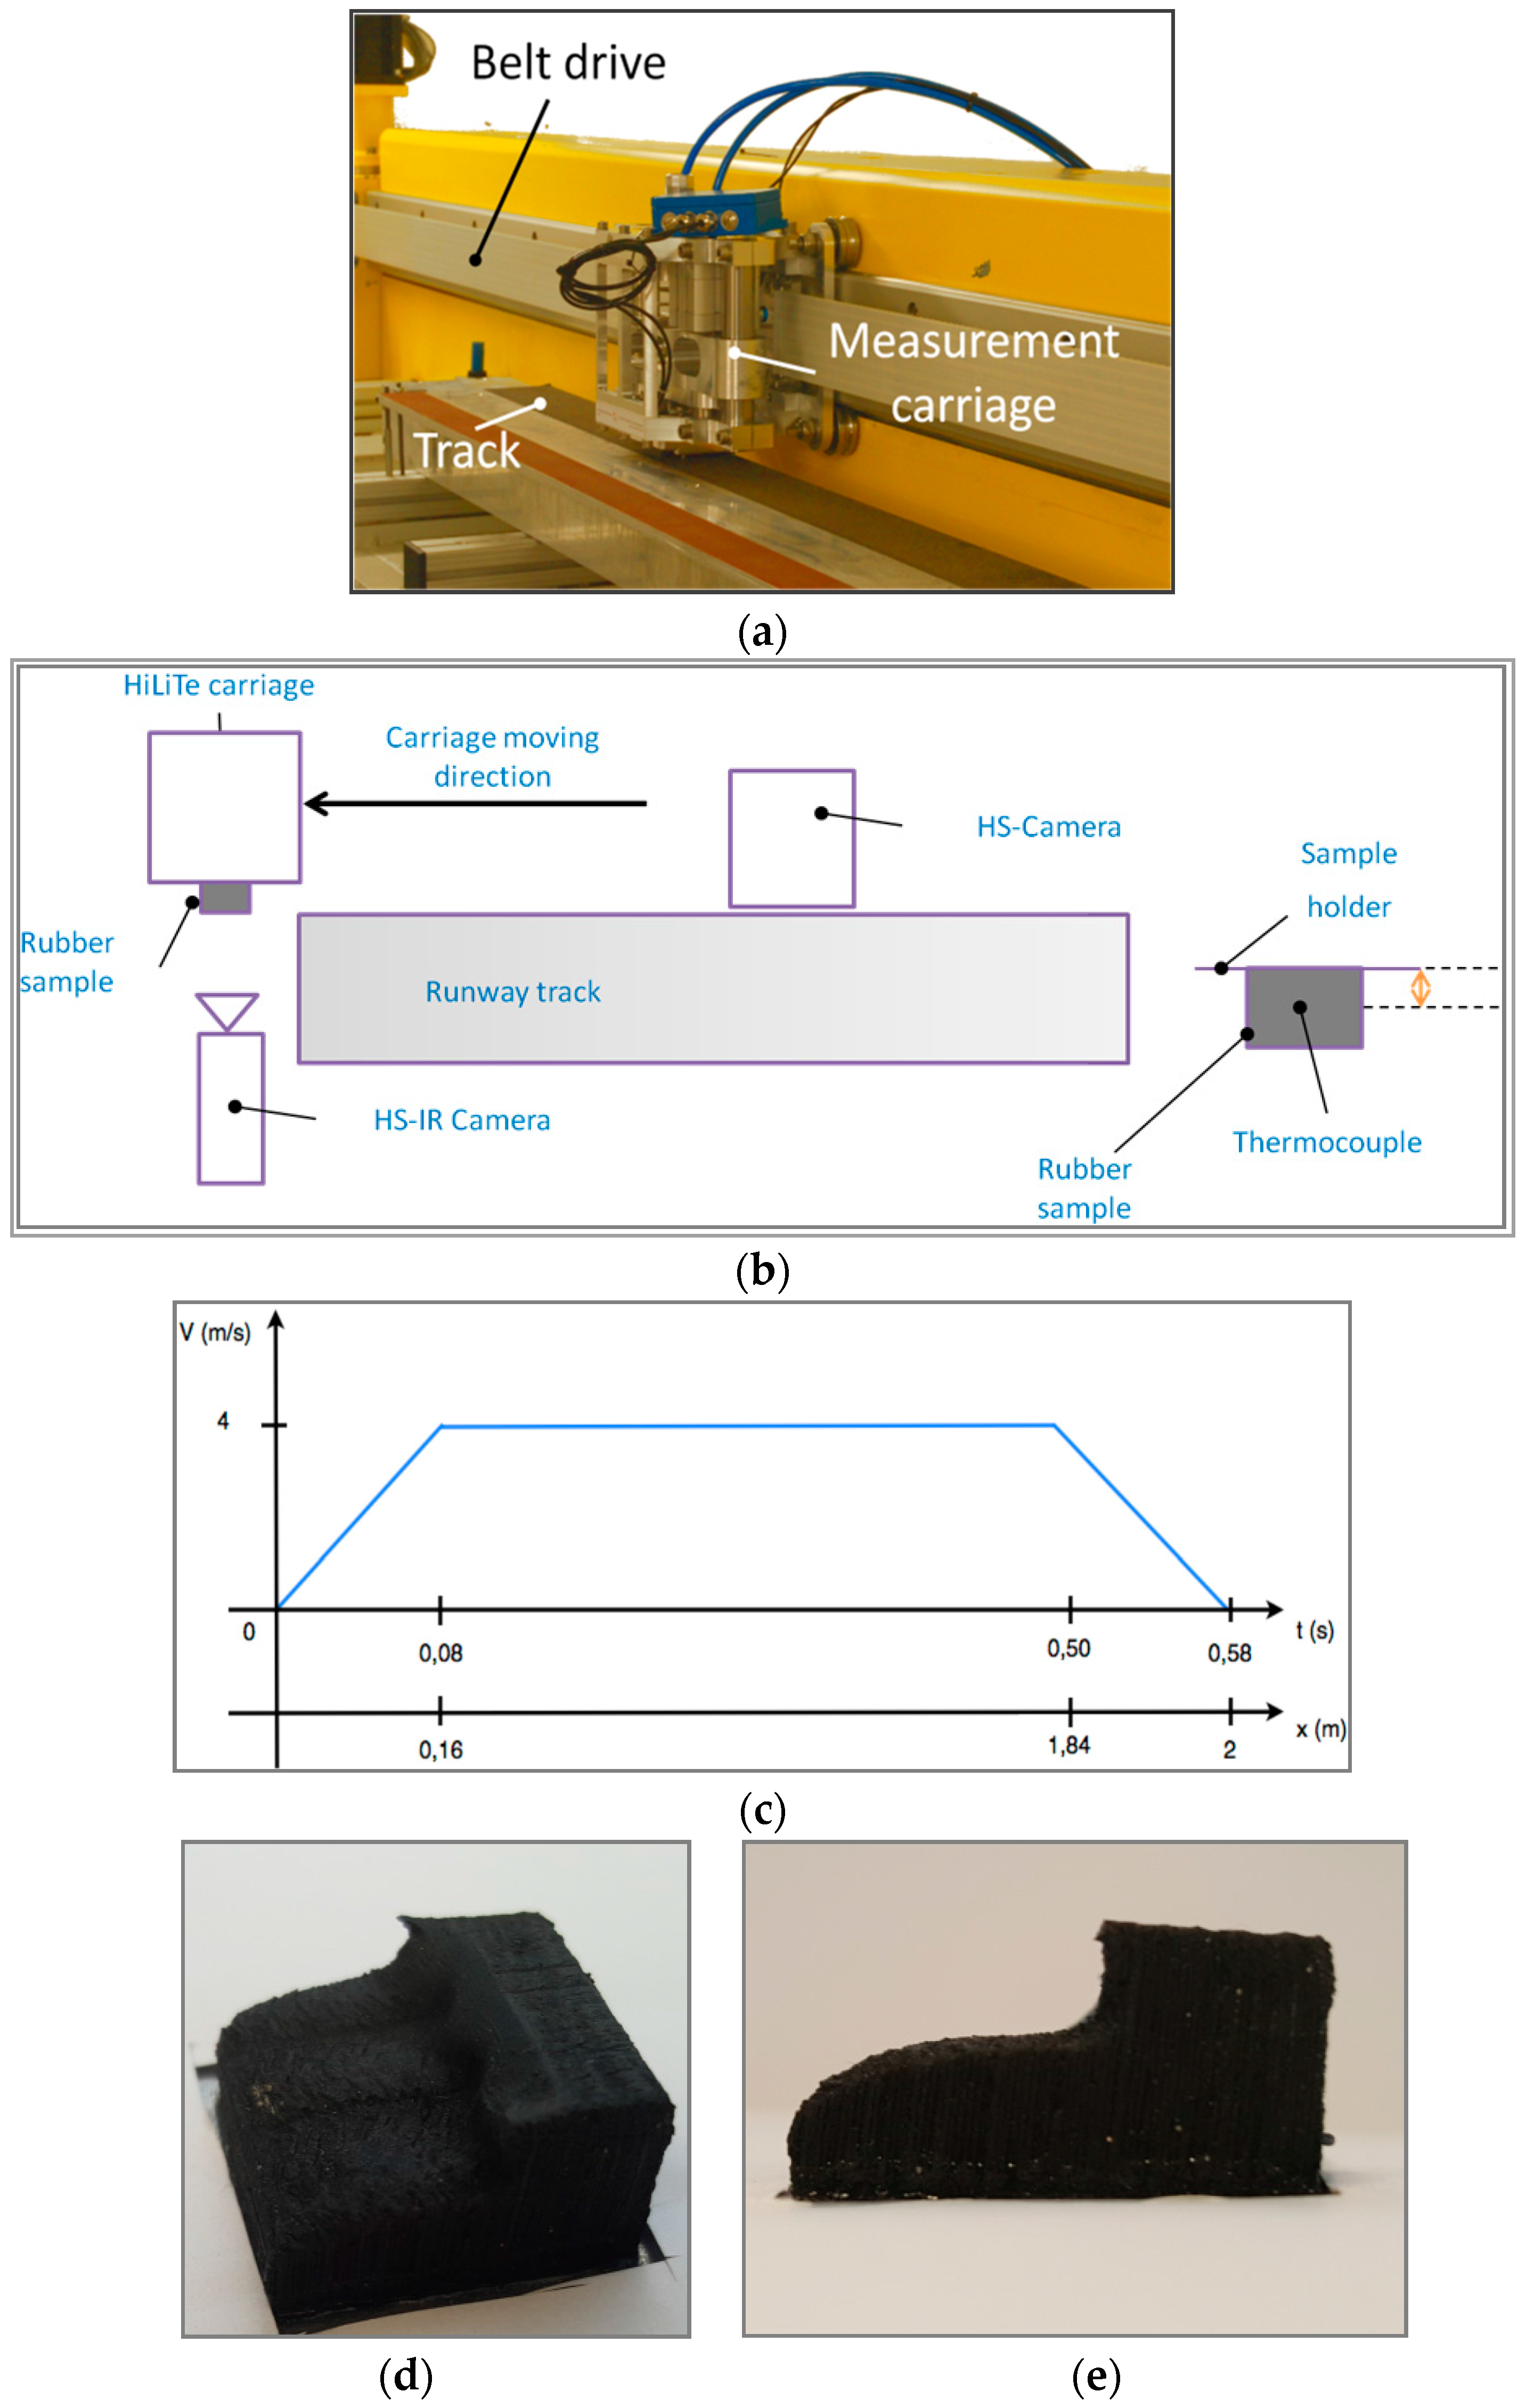
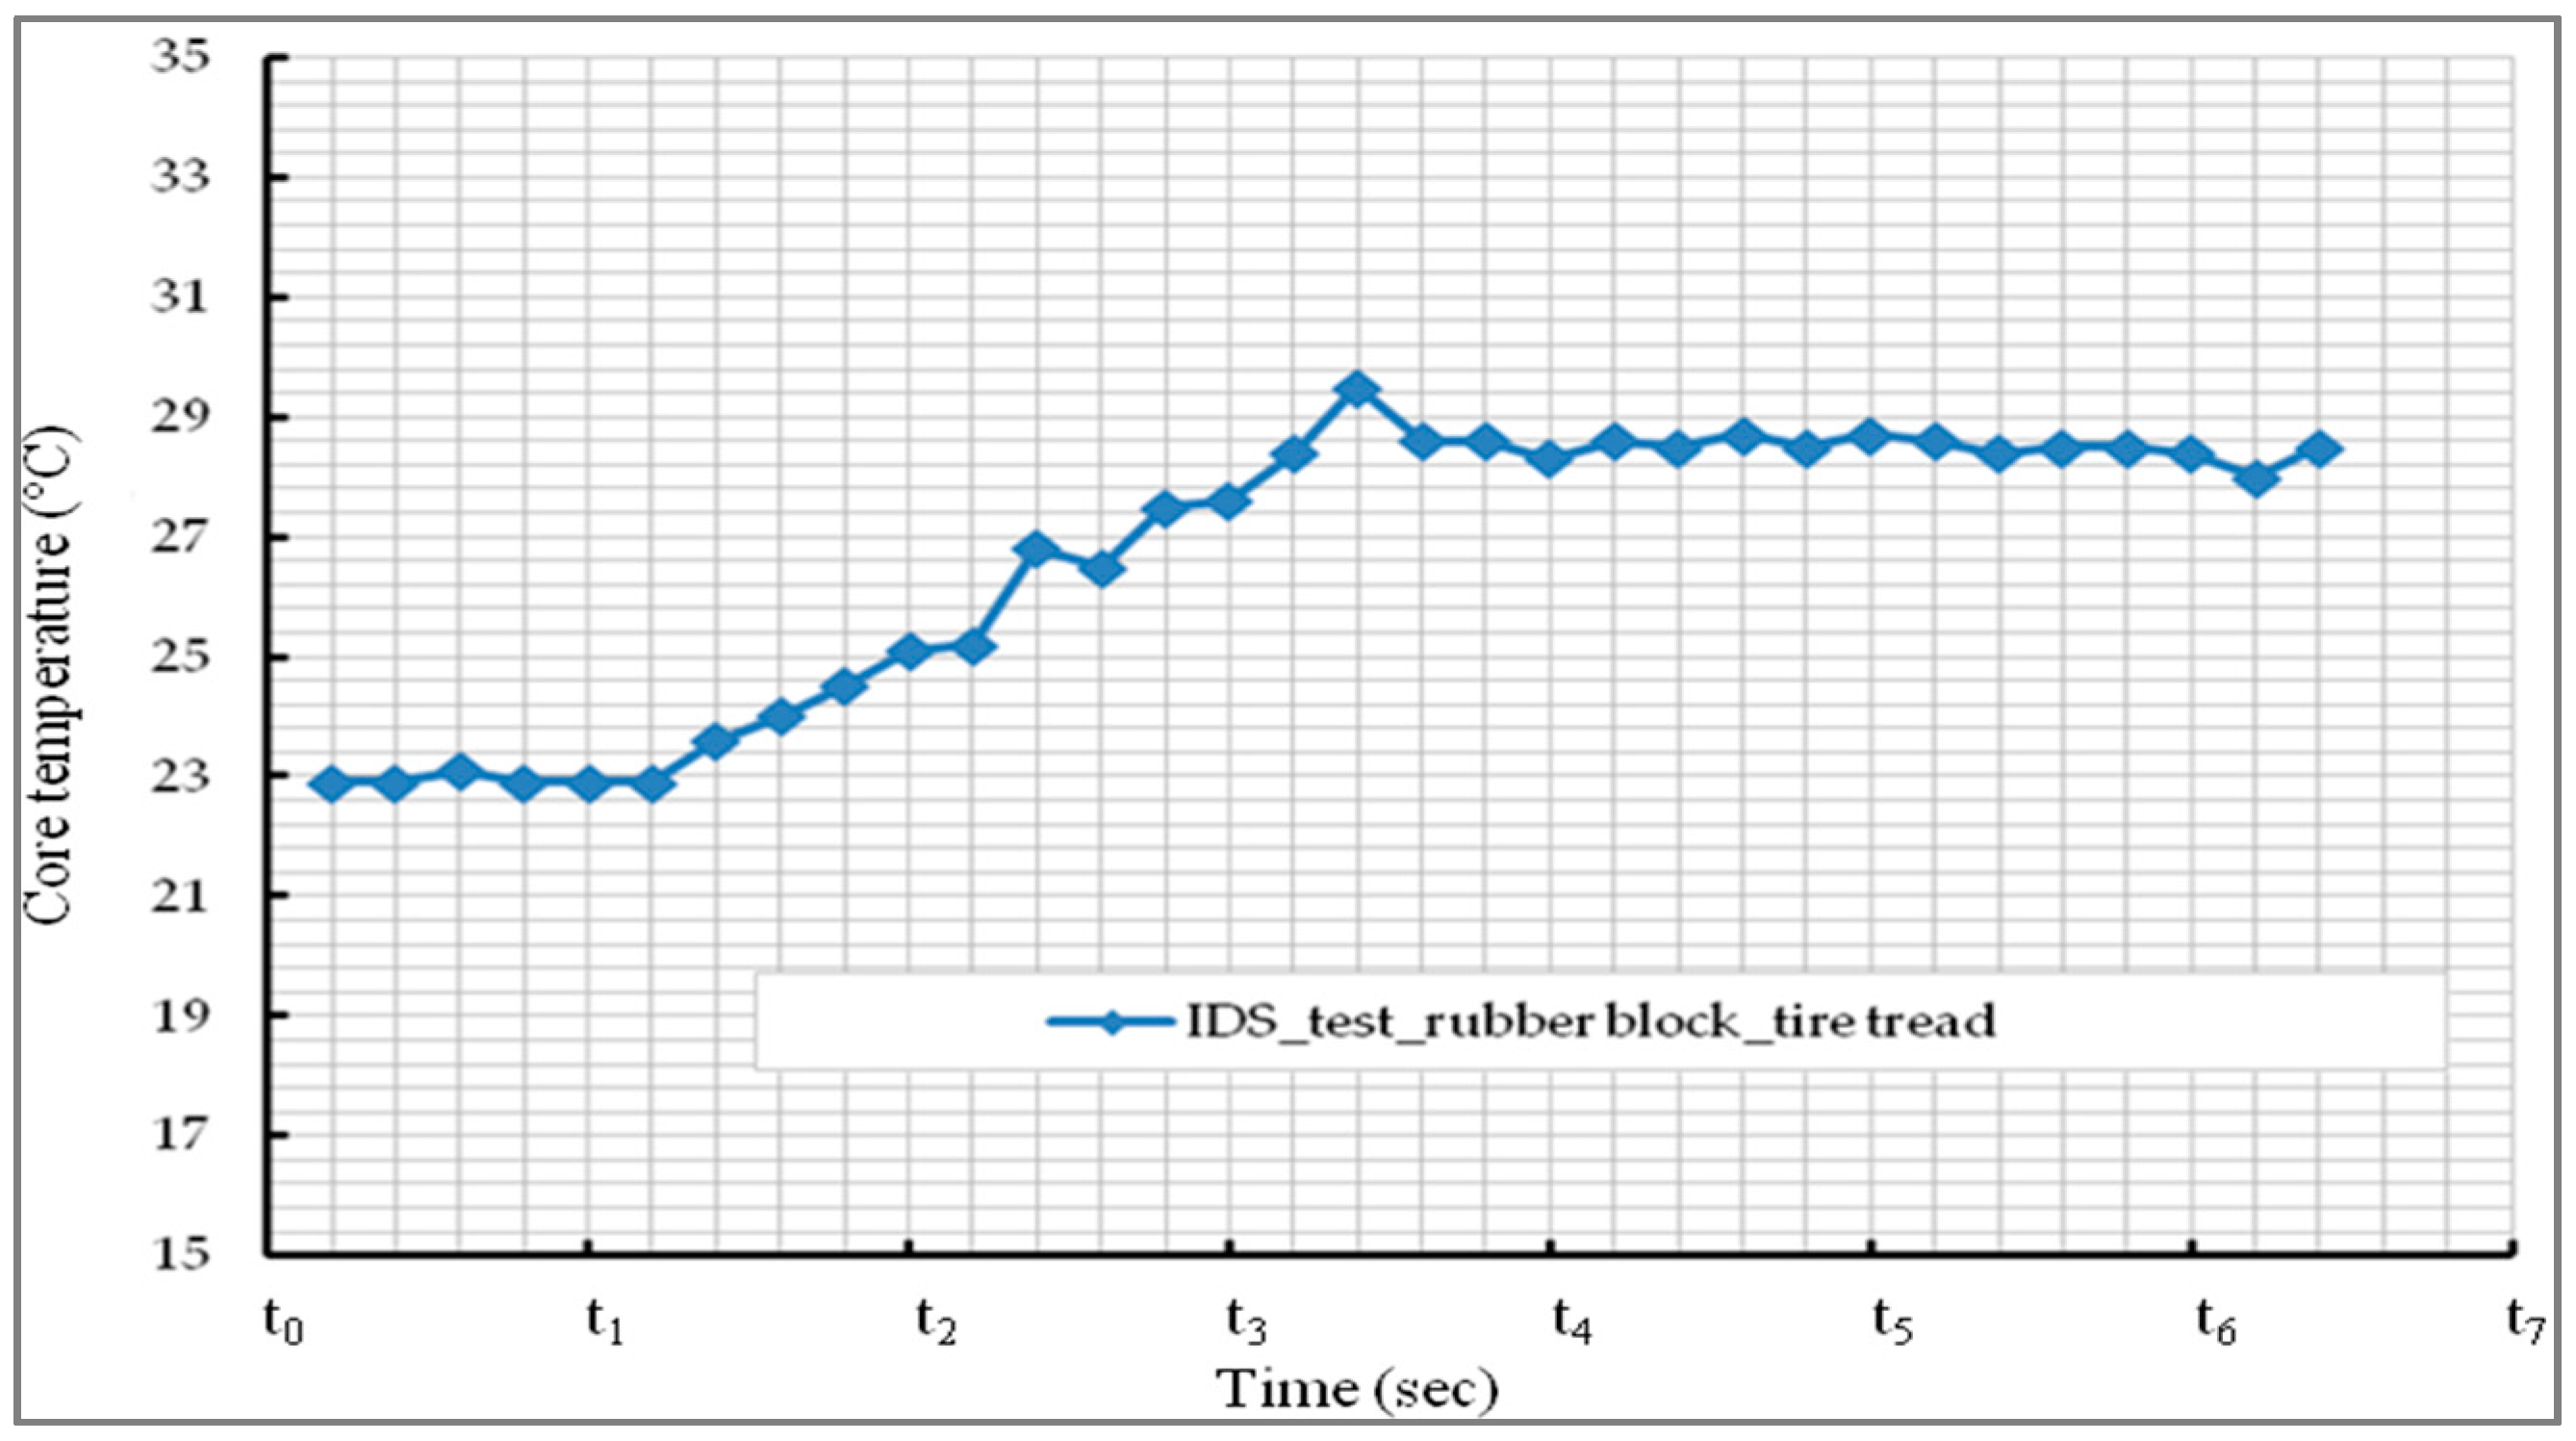
2.1. Experimental Study: Frictional Heating

The aim of this study is to identify tire tread behavior in a sliding situation. It was therefore important to design an experiment that could provide necessary data for comparison with numerical simulation. The experimental investigations were performed on the High Speed Linear Friction Tester (HiLiTe), (Figure 2a) at the Institute of Dynamics and Vibration Research (IDS) at Leibniz Universität Hannover, Germany. With this test rig, sliding friction and sticktion measurements can be performed over a wide velocity range (0.1–10 m/s) and with vertical forces up to 1 kN. The ambient temperature can be controlled between −20 °C and +55 °C. Typically, the sliding friction of tire tread samples is tested on several surfaces, such as asphalt or concrete test tracks, and also on snow and ice. Experiments at positive ambient temperatures can be carried out in dry, damp or wet conditions. Whilst friction and vertical force are measured with standard equipment, additional test equipment must be used to measure the sample temperature and contact temperature. The experiments for this study were performed on a concrete test track, the rubber tread samples measured 20 × 20 mm on the contact area and 10 mm in thickness. The sample was bonded onto the sample mounting plate and fitted with a thermocouple 6 mm from the contact area, which was implanted into a borehole and thermally connected by heat conductive paste, Figure 2b. The velocity profile is trapezoidal; it is formed in a short acceleration phase, then a phase of constant velocity v = 4 m/s followed by a short deceleration phase. The overall track length is 2 m (Figure 2c). The experiments were realized at 20 °C. As well as the measurement of friction force, normal force, and the sample core temperature, the temperature in the contact area was measured with an infrared camera, at the end of the track, see Figure 2b. Simultaneously, a high speed camera was used to record lateral images of the deformed block while sliding.
Figure 2d,e present, respectively, the final shape and the profile of the rubber sample after sliding. The rubber sample was subject to considerable wear; such a high level degradation could not be achieved without taking into account a strong link between the heating history and wear, which is a highly non-linear phenomenon. Another parameter to take into account is the split coefficient of the heat generated by friction between the rubber, the sample and the track surface.

2.2. Experimental Study: Simulated Frictional Heating of the Tire Tread by an External Heat Source

The main objective of this test is to determine the temperature evolution of the tire tread, by means of a simple temperature increase experiment. Here the frictional heating of the tire tread is replaced by an external heat source, after which the thermal diffusion throughout the tire cross-section is measured. The experimental test consists of increasing the temperature of the tire tread over a fixed time, using a heat source (Figure 3b, zone 1) at a pre-determined temperature. The temperature evolution was measured simultaneously, at the outer surfaces ((zones 1, 3), Figure 3b), using two external sensors facing the tire tread (zone 1) and the groove (zone 3). The thermal evolution inside the tire structure was also recorded ((zones 2, 4), Figure 3b) by means of an additional two infrared sensors (Figure 3a, top). The heat flow is vertical to the tire tread surface.
Figure 4 presents the temperature evolution of various tire tread zones. As can be observed, for the thermal evolutions corresponding to the heated zone (zone (1), triangles), the time shifted increases compared to the temperature inside the tire tread (zone (2)), and smaller values were noted (blue solid). Concerning the grooves, the evolution profile appears very similar to that of the tread (red solid). However, we can notice that, after the end of the heating, marked by the vertical line (Figure 4), the groove temperature continues to rise for a short time before reaching a plateau. This proves that the temperature is “stored” and “diffused” throughout the tire rubber and, at the same time, that the rubber has a very low conductivity coefficient.

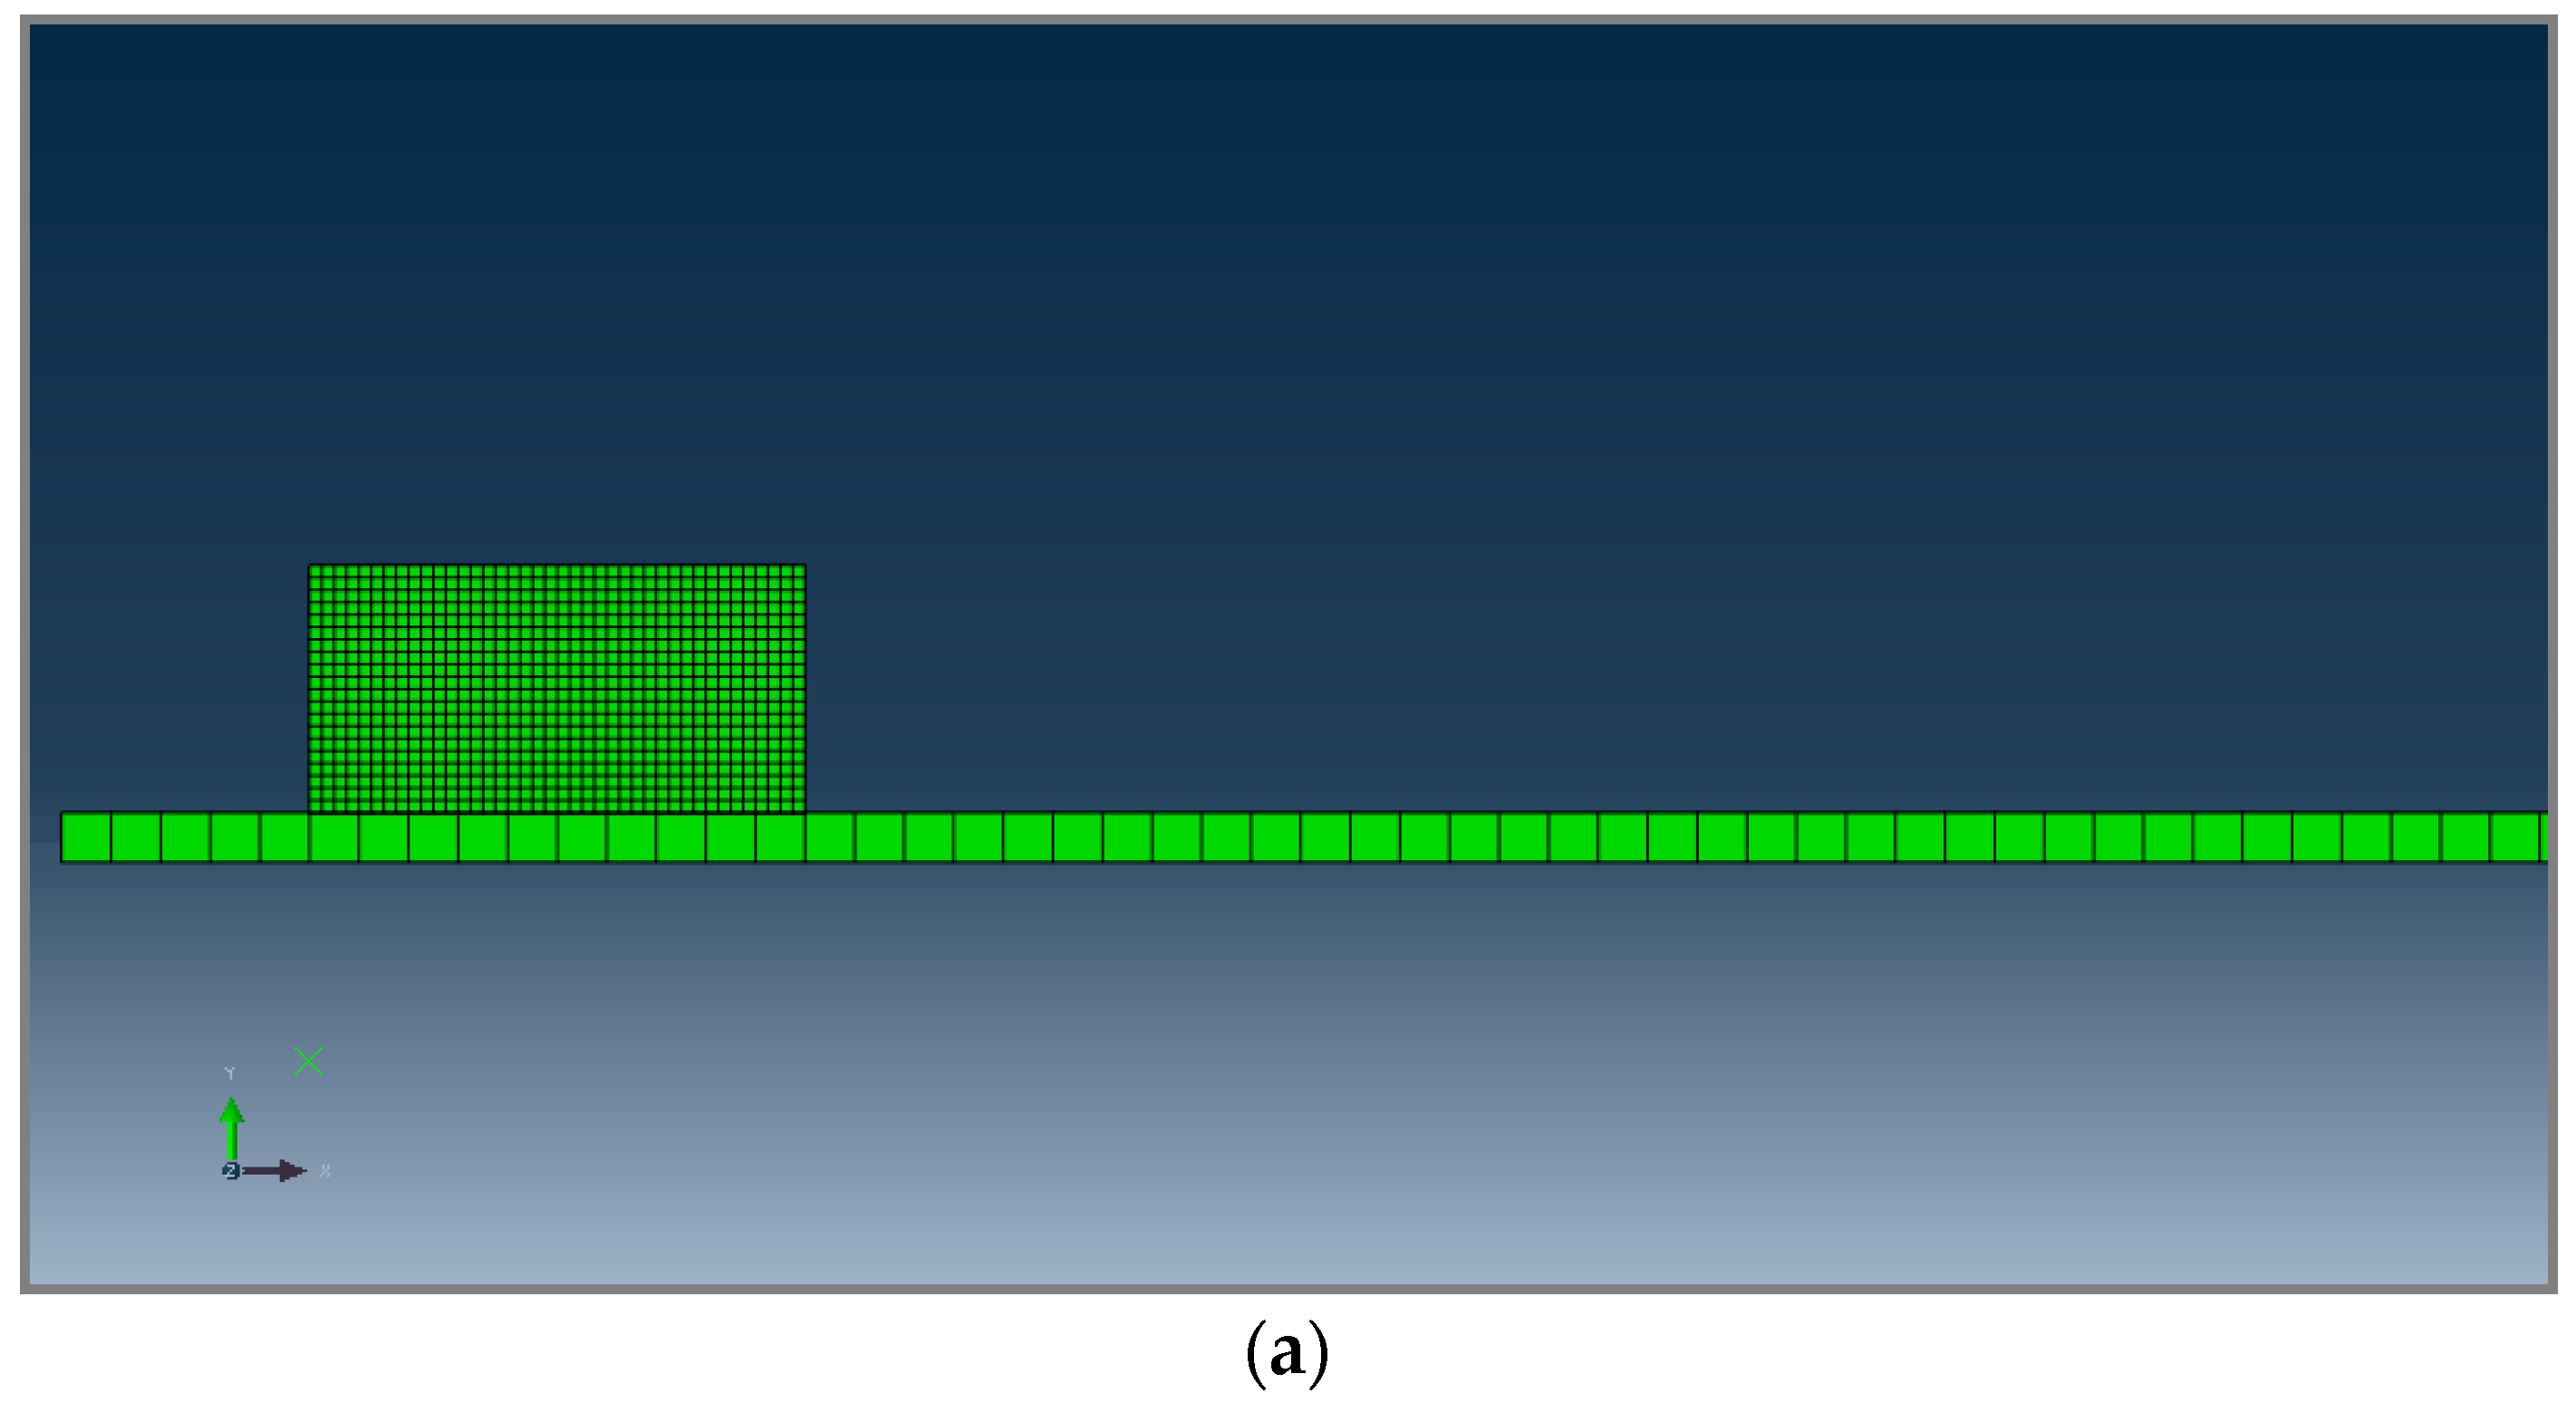
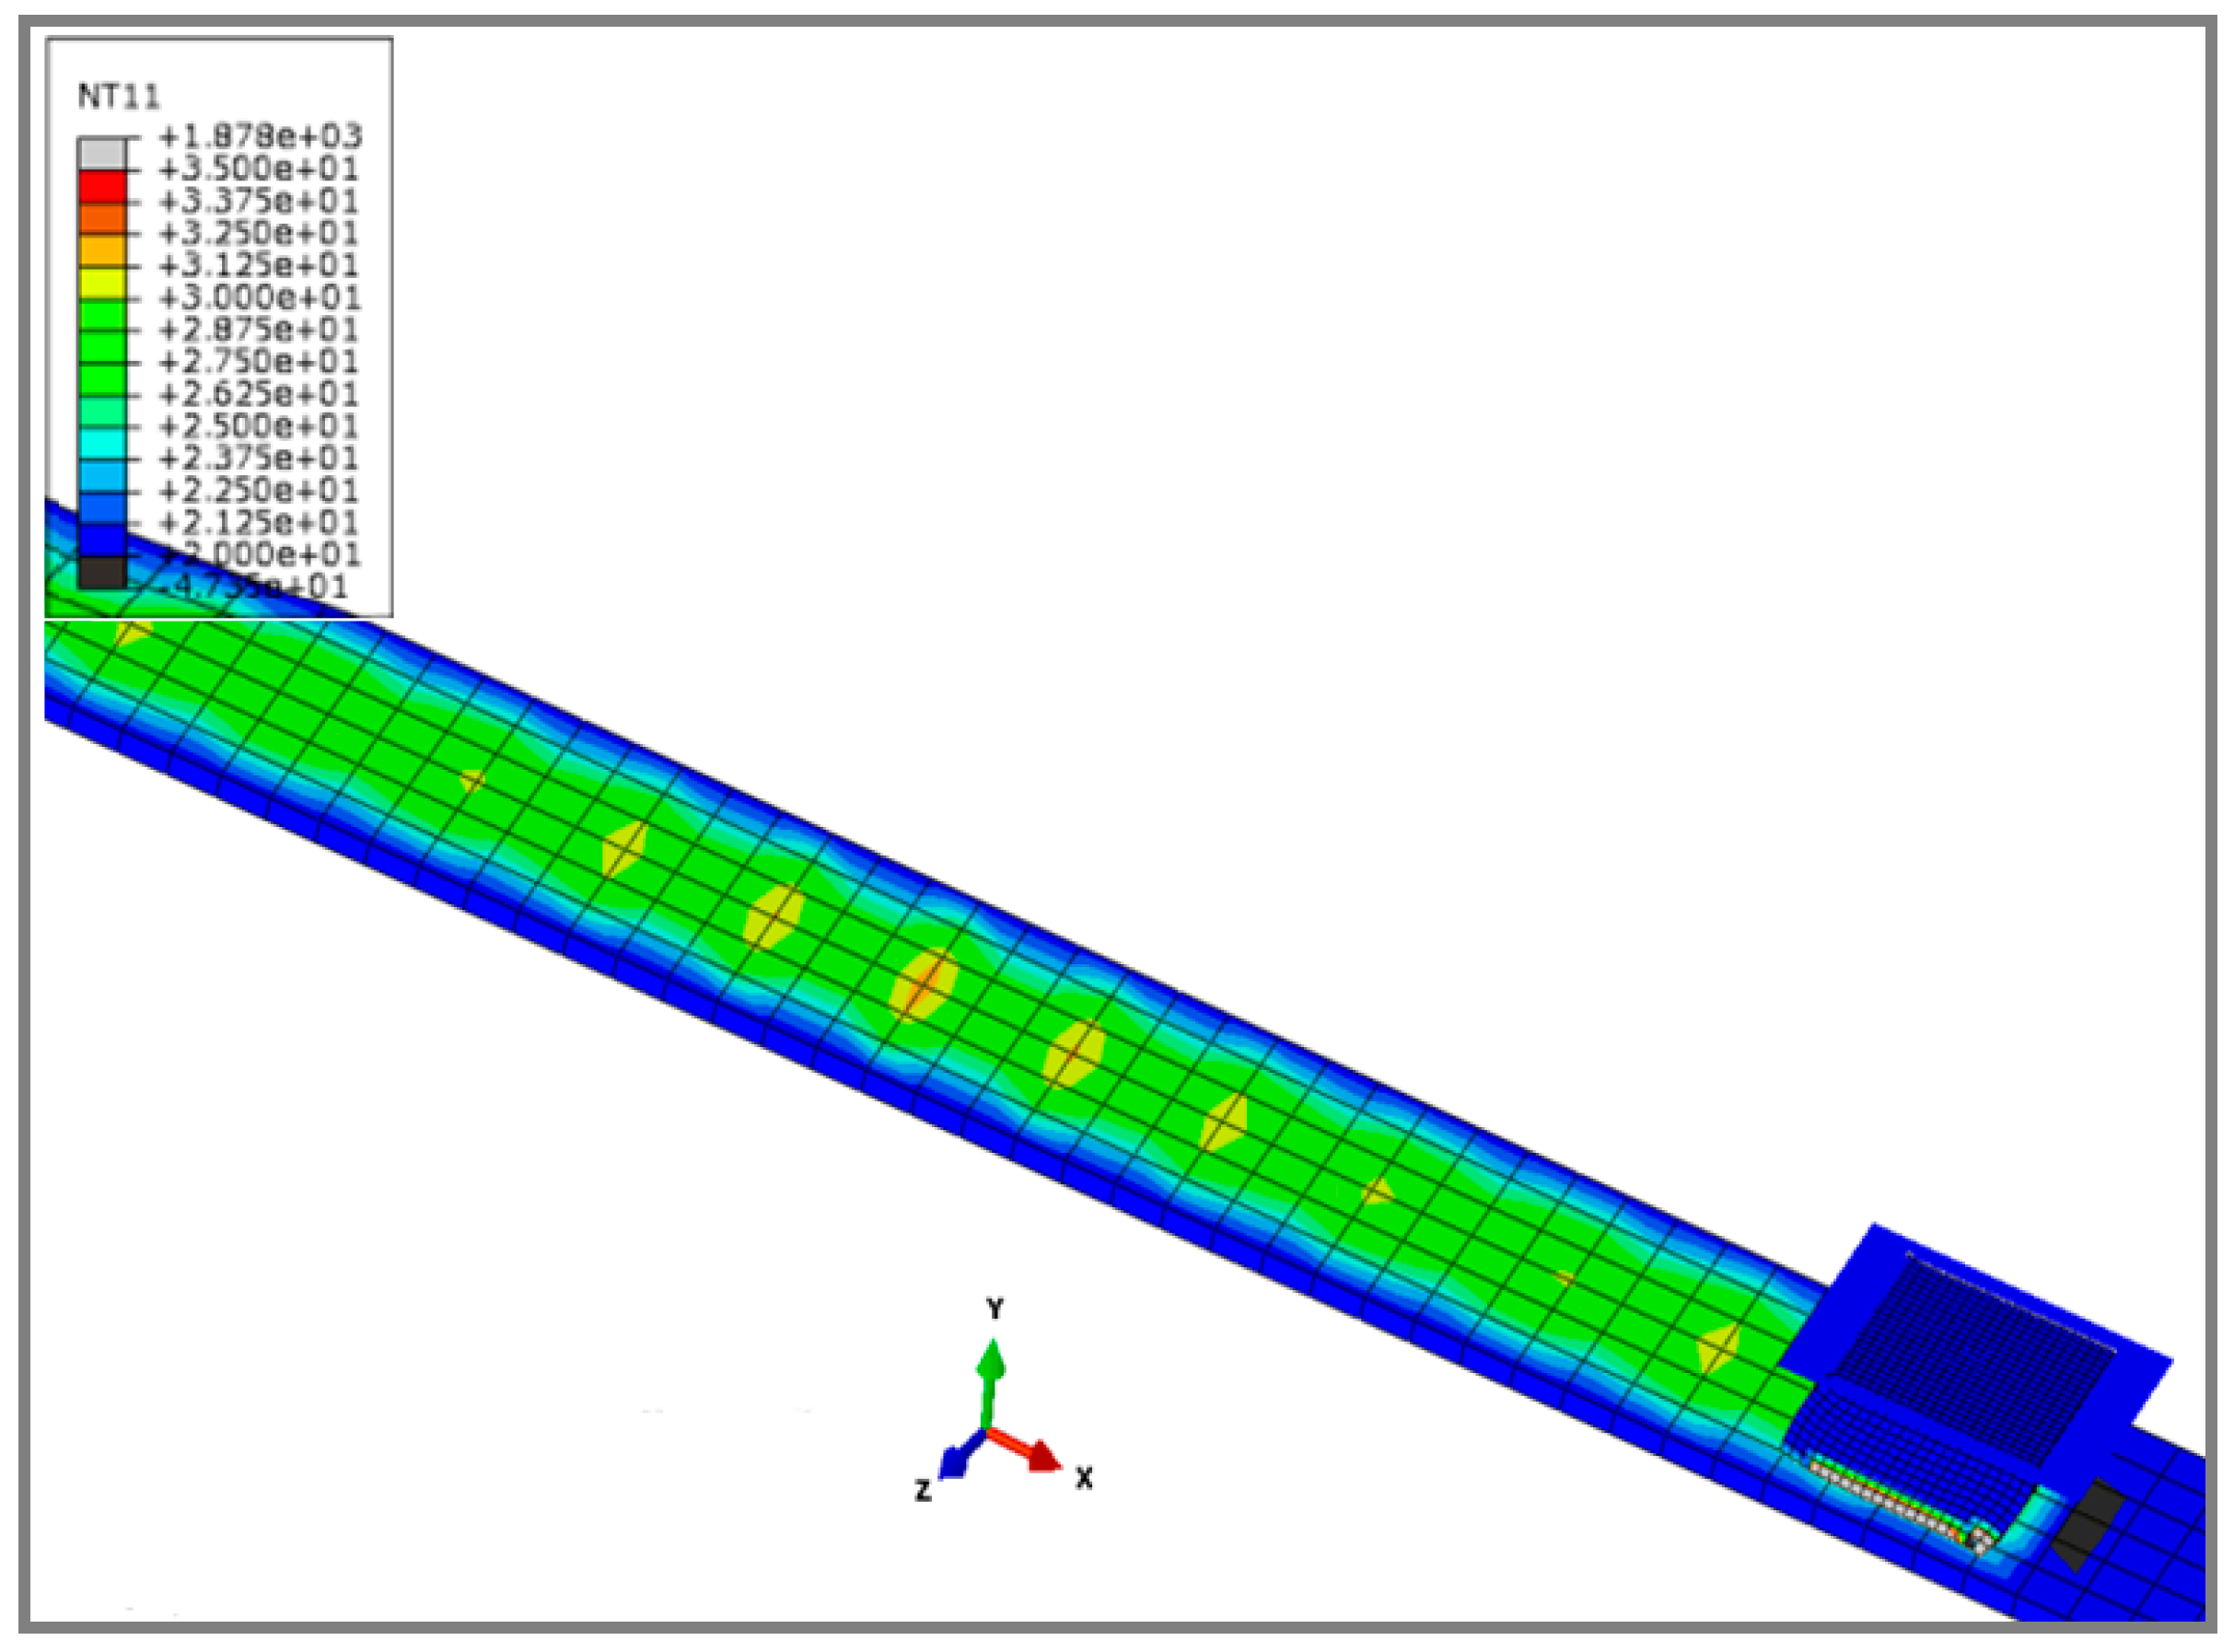
2.3. Numerical Simulation/Heating of the Tire Tread

Figure 5 illustrates a comparison between the experimental measurements and the simulated temperature evolution of the tire tread rubber (zone (2), Figure 3b) for an equivalent external heat source. The numerical simulation was carried out using a numerical specimen identical to the physical specimen.
A good correlation is obtained between the simulated temperature of the tire tread and that actually measured. Figure 6 presents the internal thermal evolution of the rubber block observed during sliding (IDS test, Figure 2b). As can be observed, the core temperature increases during the first instants of sliding; a plateau is rapidly attended. It can be concluded that the temperature increase of rubber produced by sliding on a rough surface, or by heat diffusion, leads to a similar evolution in the tire tread rubber (Figure 5 and Figure 6). Whatever the mechanism of heating, by friction or by heat diffusion, the thermal evolution of the rubber remains identical.

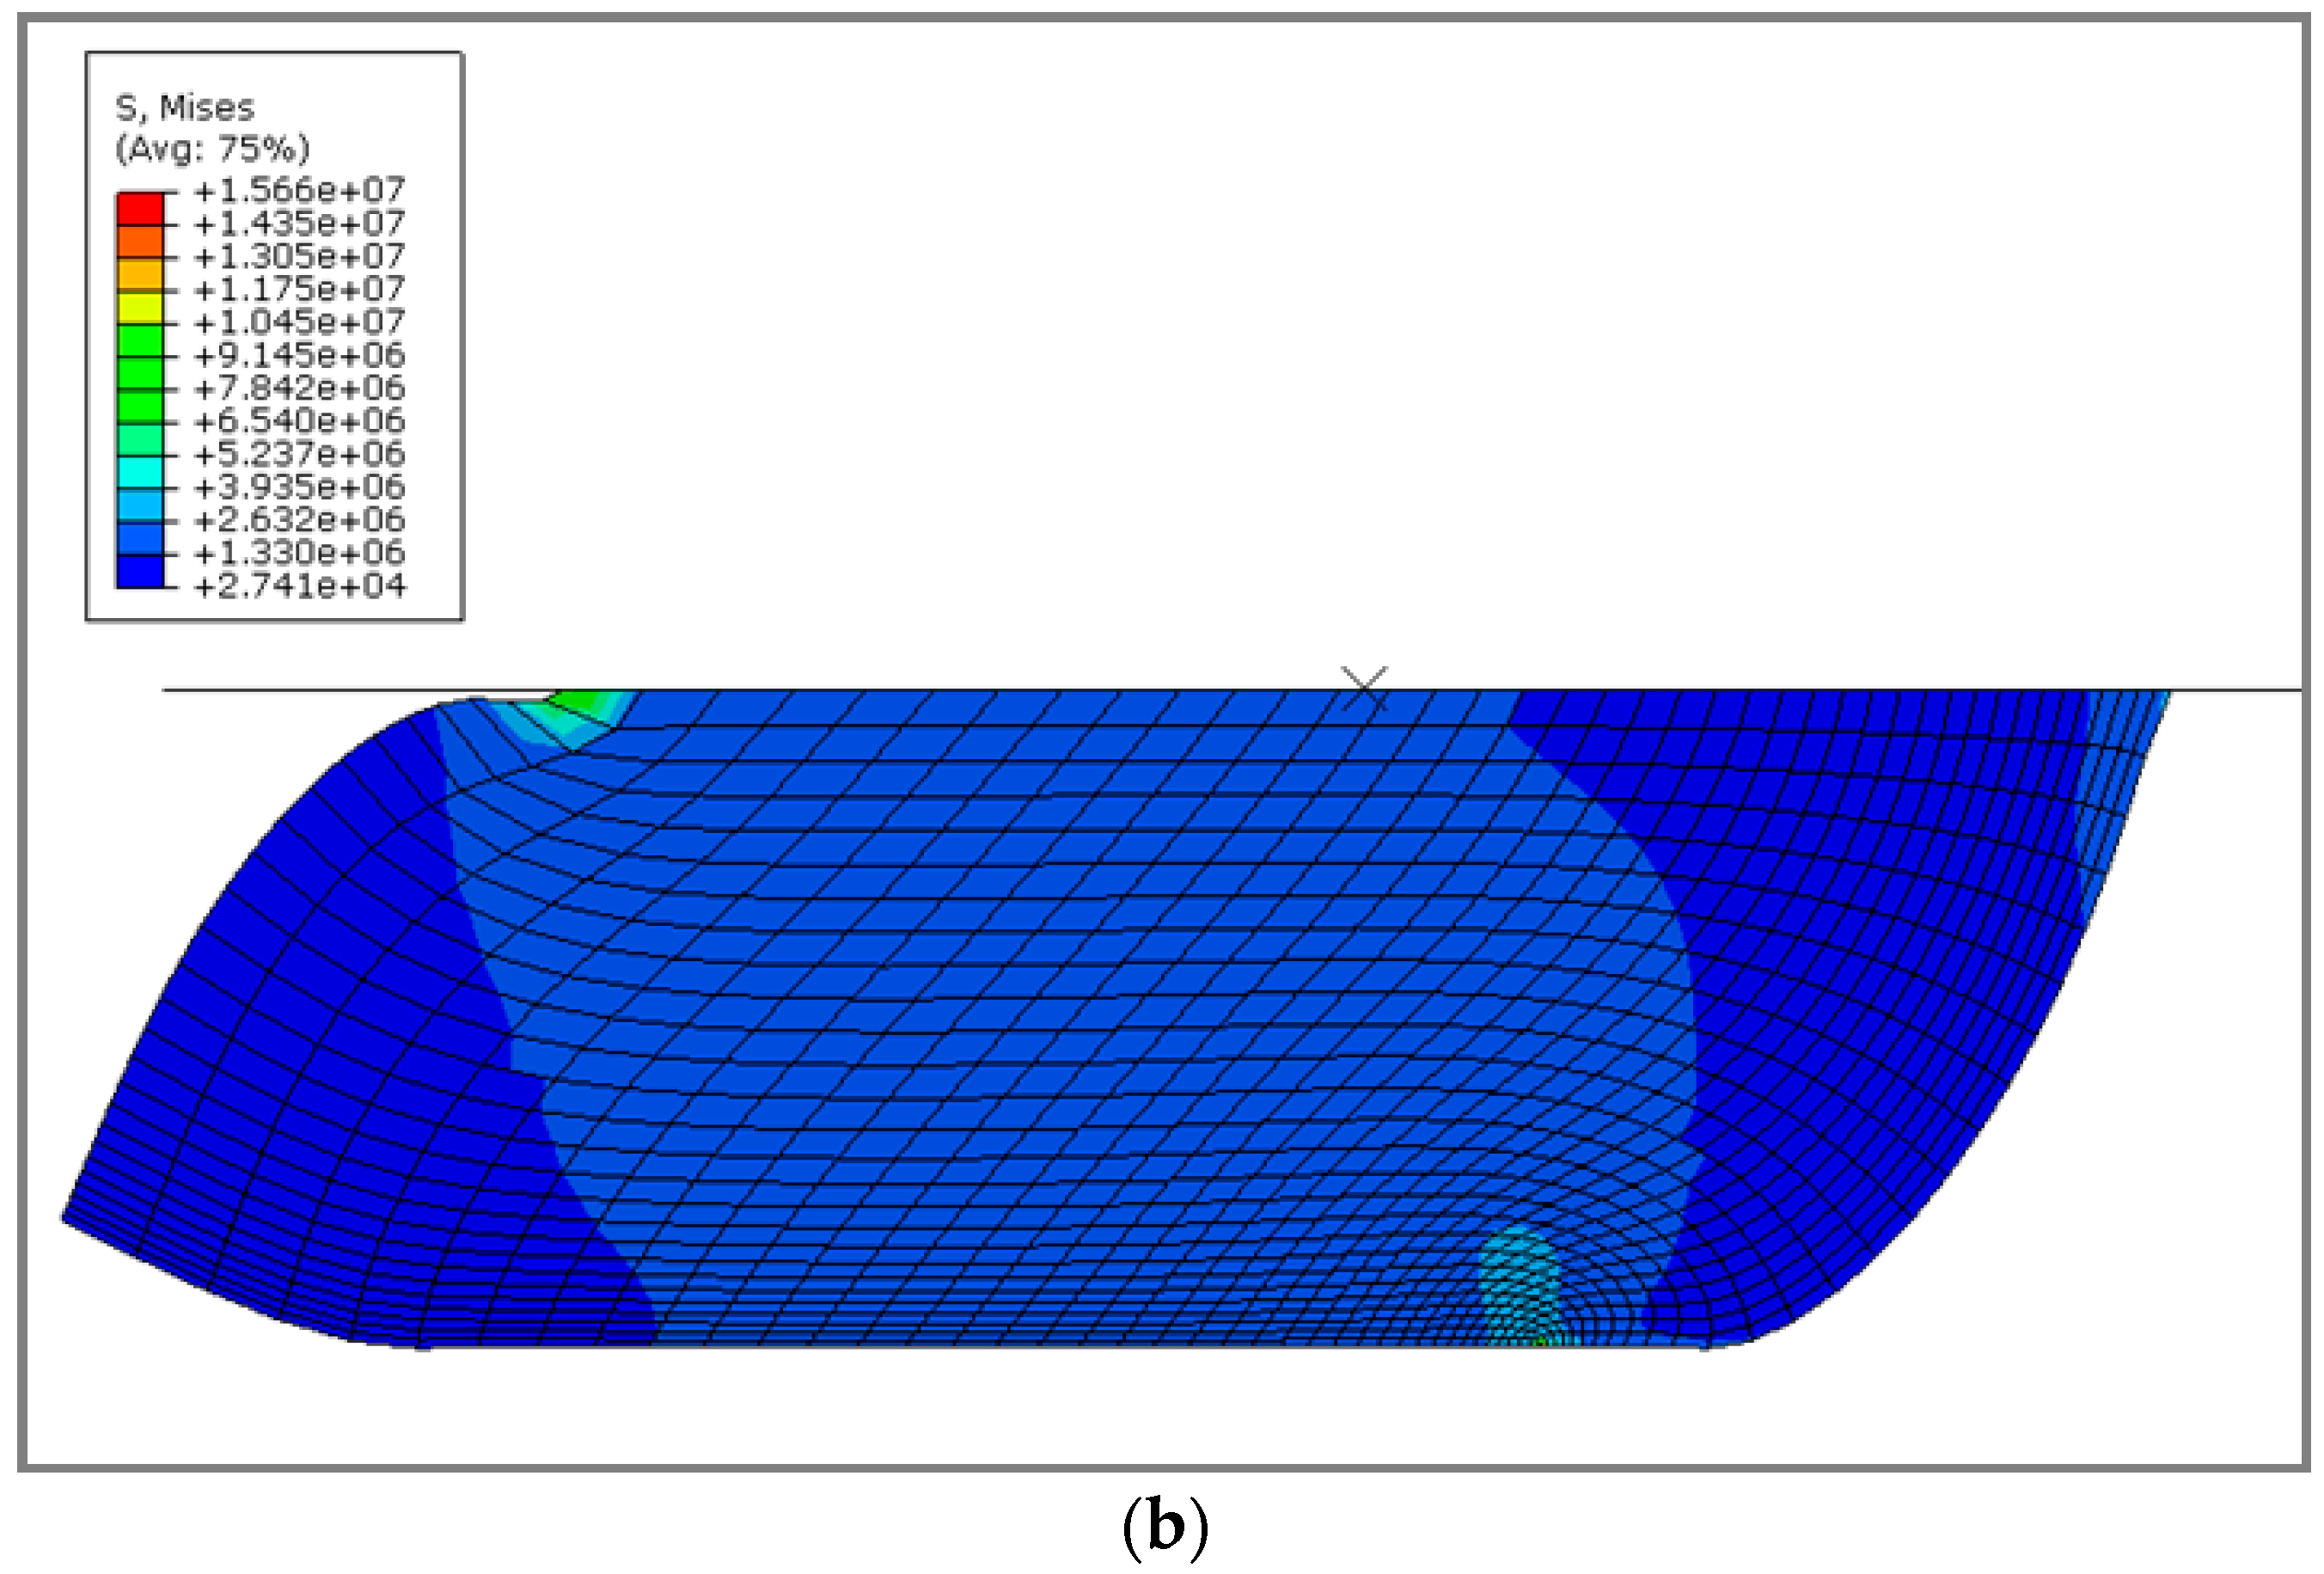
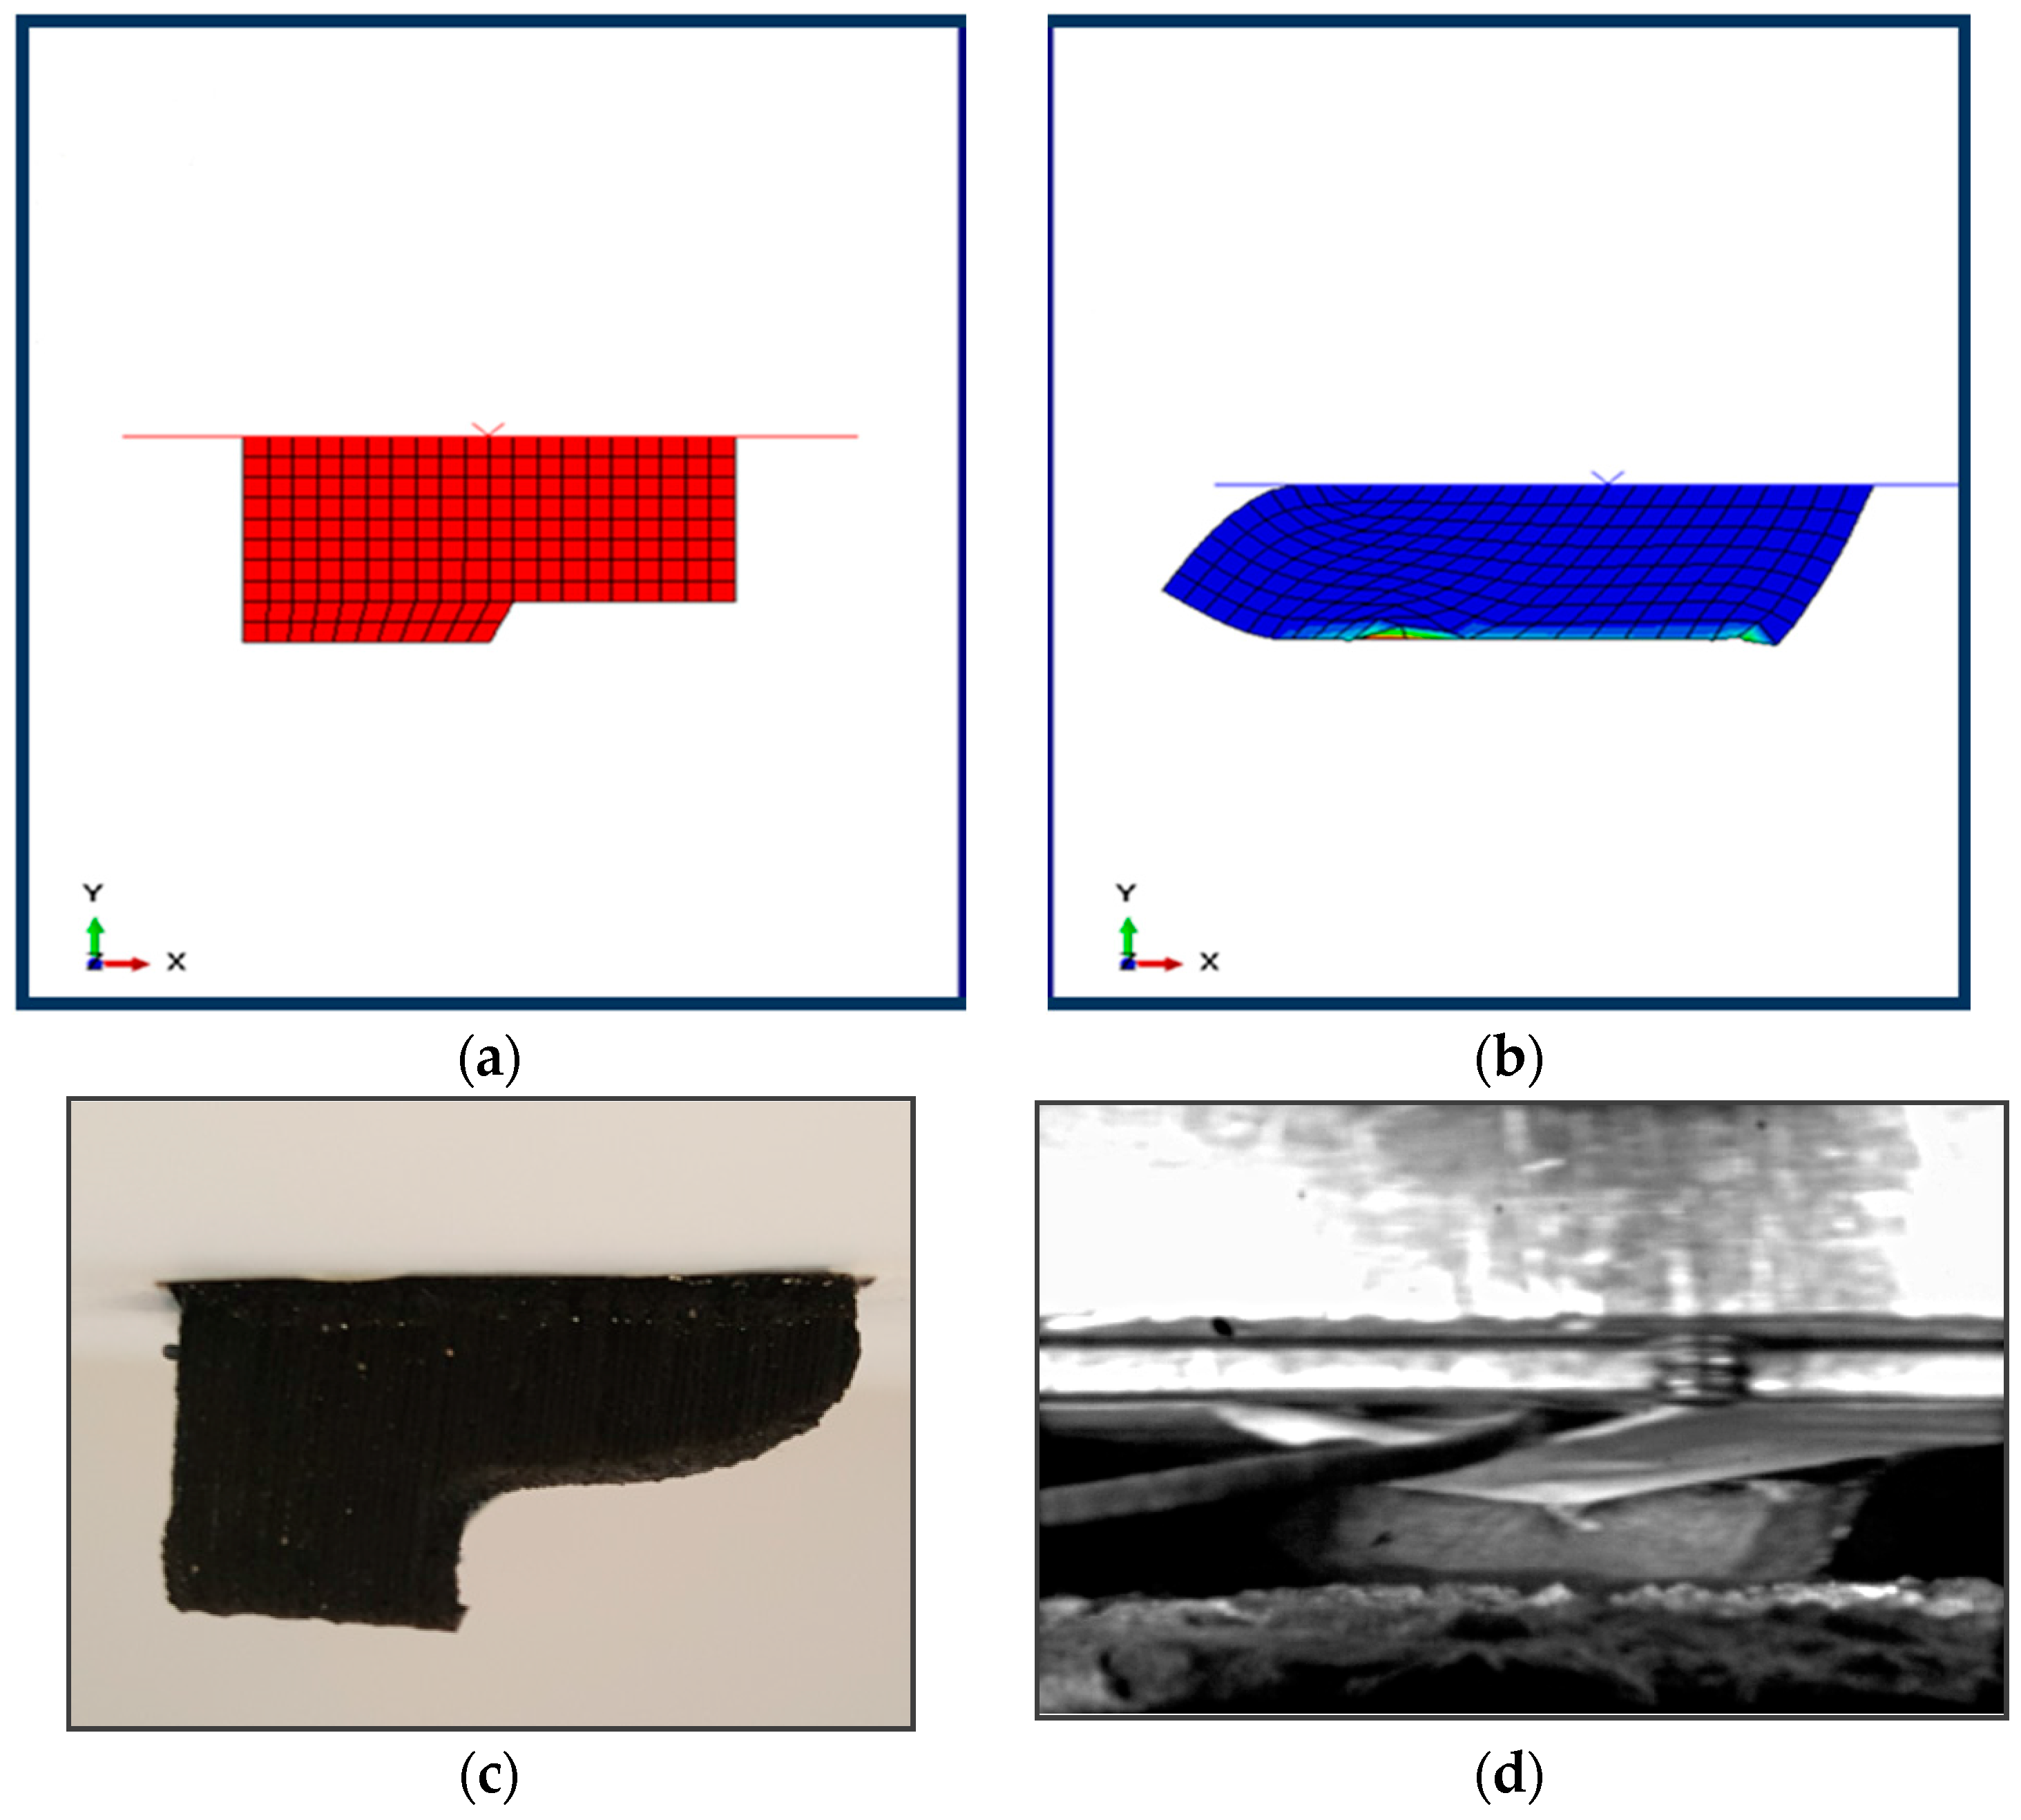
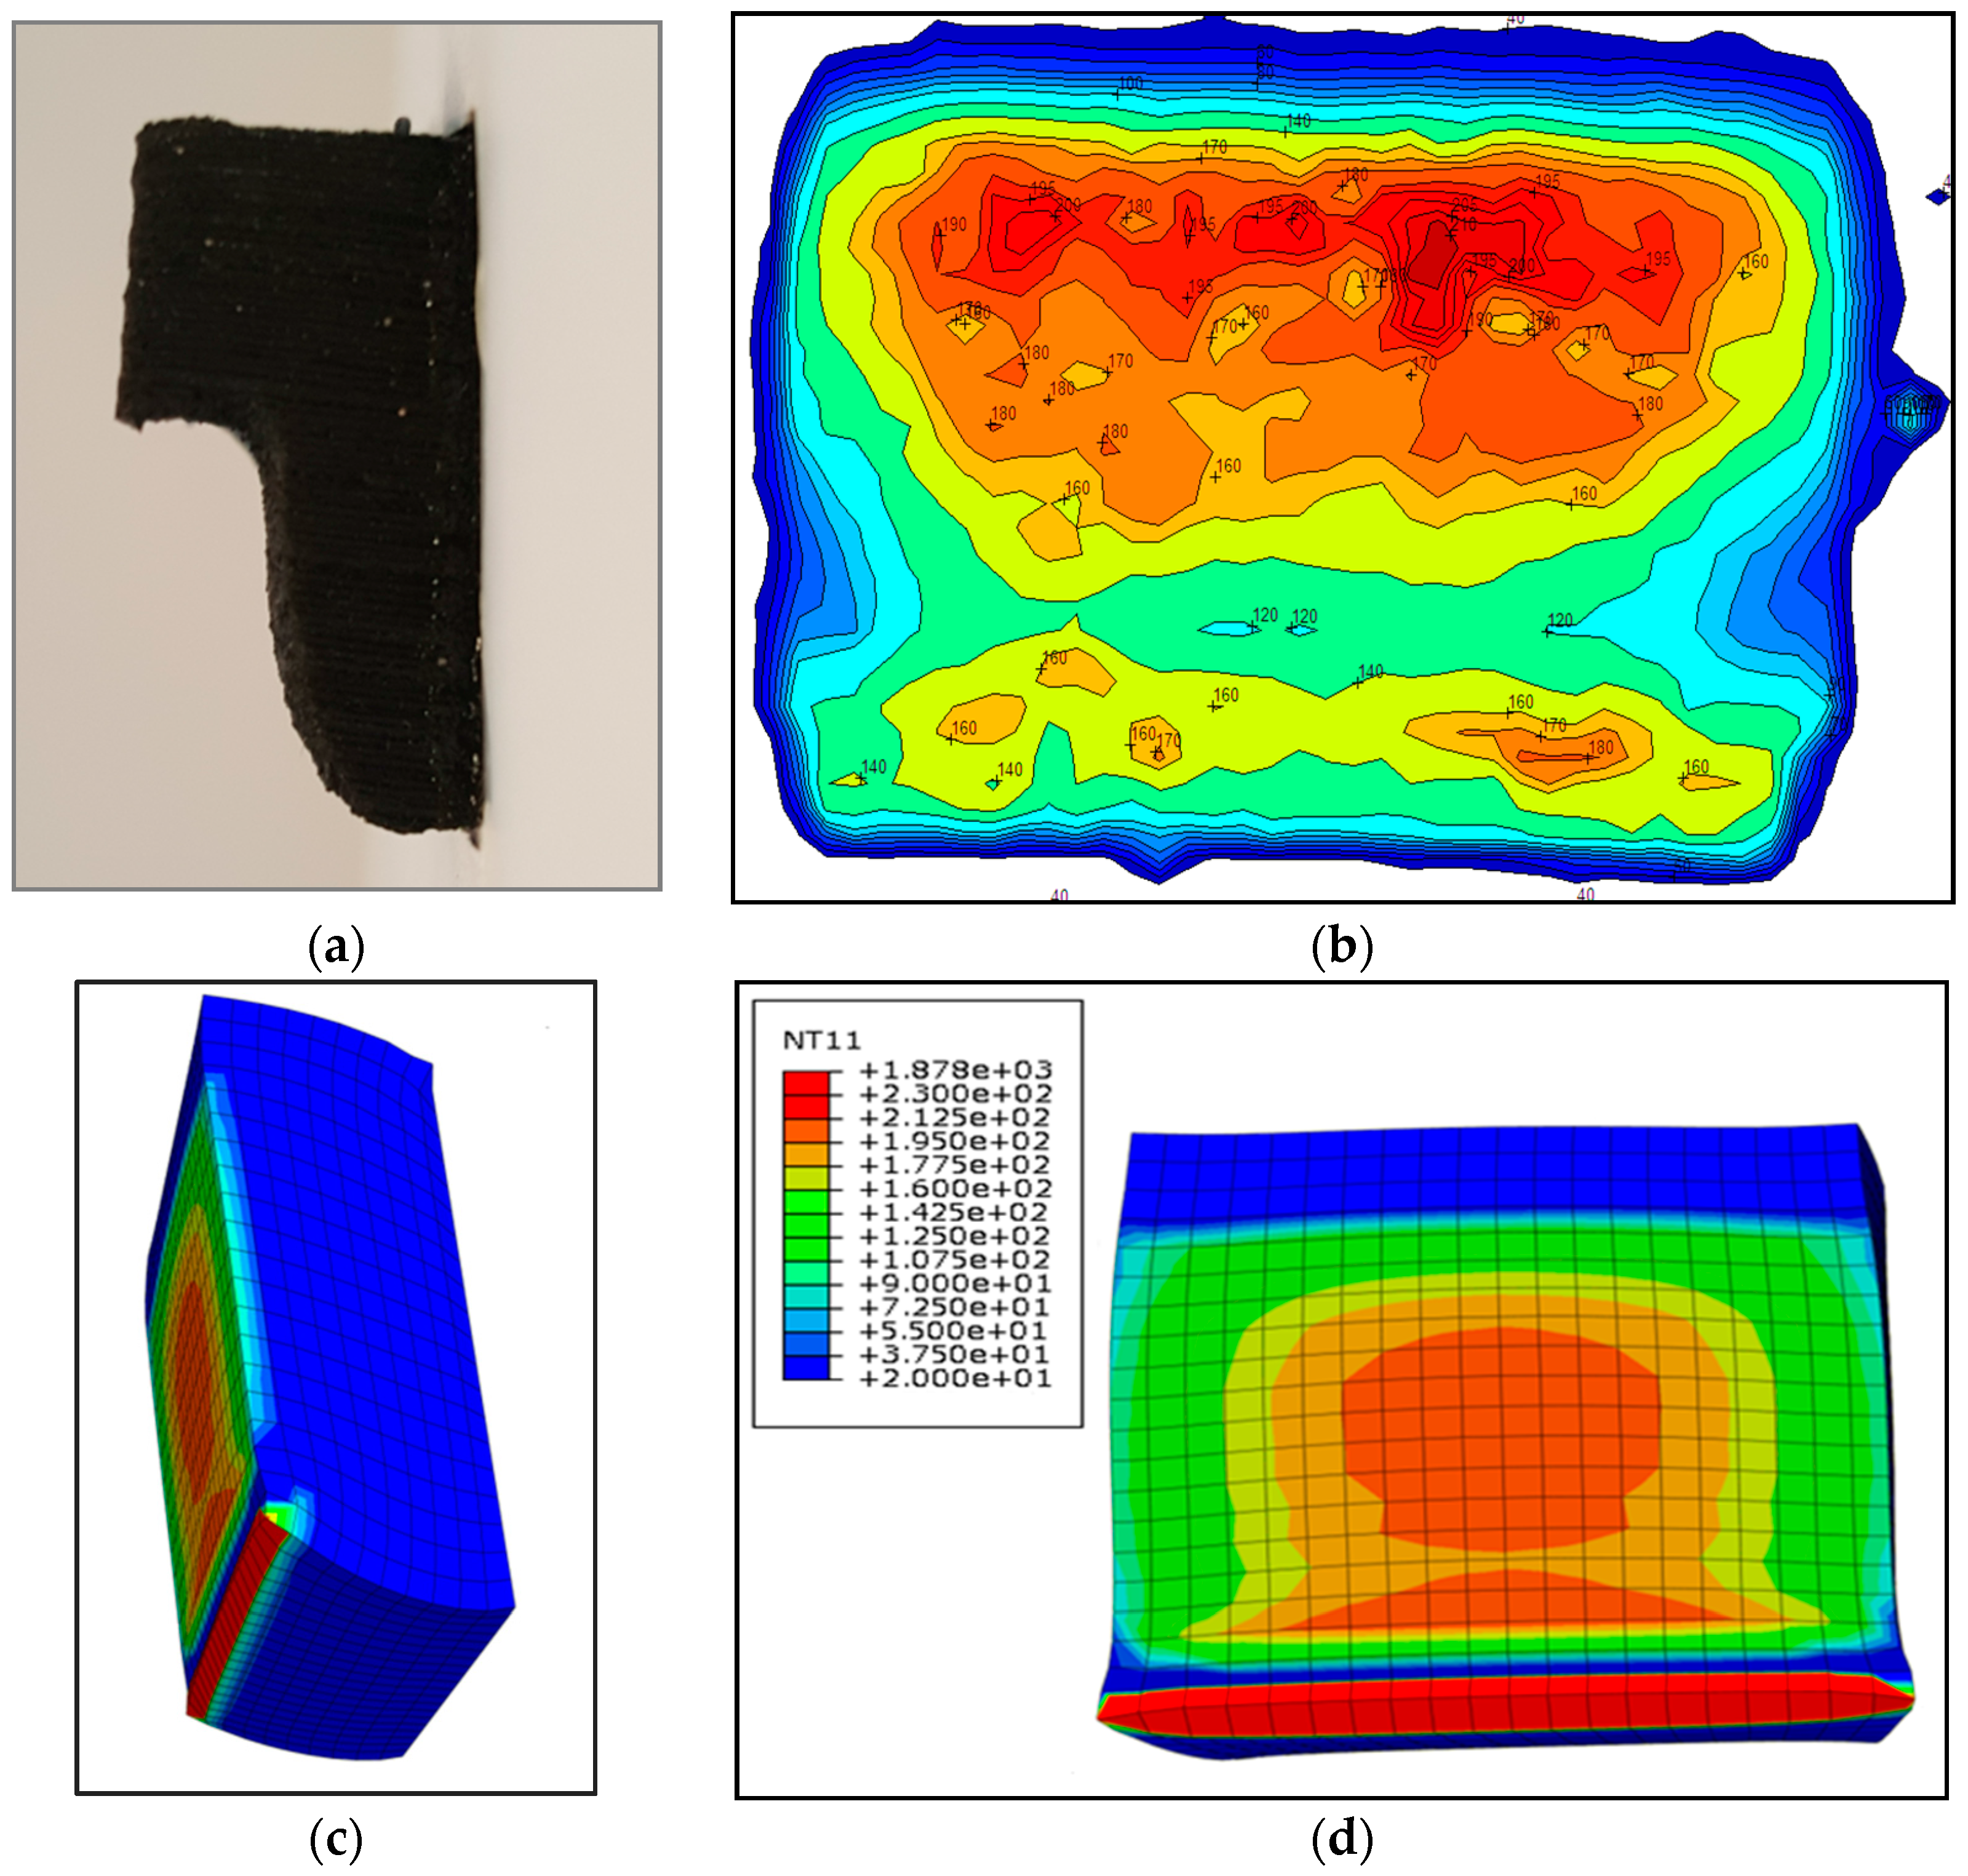
2.4. Numerical Simulation of a Sliding Rubber Block

The aim of this study is to establish the simulation procedure for the frictional behavior of the tire tread rubber. The complexity of this approach is related to the thermo-mechanical characteristics of rubber, its non-linear viscoelastic behavior, and also to the stability of numerical simulations at high localized deformations. The numerical simulations have been developed taking into account the high geometrical deformations using ABAQUS as a finite element code with a friction coefficient, and viscoelastic parameters determined experimentally. The hyper-elastic behavior of rubber is based on the Mooney-Rivlin model [25,26]. This model is widely used in tire modeling [27,28,29]. A macroscopic approach is adopted in all simulations, which means that neither the roughness of the track surface nor the molecular structure of rubber chains was taken into account. The rubber is considered as a homogenous, isotropic and incompressible material.
A first two-dimensional finite element simulation is investigated. This simulation is based on the assumption of a plane strain state in the cross-section of the rubber block; coupled temperature-displacement plane strain elements (CPE4RHT, four-node bilinear displacement and temperature, reduced integration with hourglass control, hybrid with constant pressure) were applied. Figure 7a presents the rubber sample sliding on a concrete track. The FE simulation is performed in two steps: during the first step a constant pressure of 2.5 MPa is applied to the top of the rubber block by means of a rigid plate. In the second step, the block is moved with a constant sliding velocity of 4 m/s. Figure 7b shows the numerical shape after sliding. Figure 8c,d, present, respectively, the shape of the rubber sample at the end of first test-run and the experimental test.
Figure 8a presents a full 2D image of the eroded initial shape of the rubber sample corresponding to the experimental specimen (Figure 8c). Figure 8b shows the numerical results with respect to the same rubber sample, while taking into account the final eroded shape of the specimen by means of an “eroded initial shape”. In this case, the rubber block is loaded with 2.5 MPa and sliding at 4 m/s. This deformed shape is in good correlation with the rubber block tested using the Hannover facility (Figure 8d).
Figure 9 presents a full 3D numerical simulation for a rubber block loaded with 2.5 MPa and sliding on a deformable concrete track at a fixed velocity of 4 m/s. Coupled temperature-displacement elements (C3D8RHT, eight-node tri-linear displacement and temperature, reduced integration with hourglass control, hybrid with constant pressure) were used in this simulation.
As already mentioned, the numerical simulation of a sliding rubber sample demonstrates the same tendencies as the friction rig results. Figure 10a presents the profile of an experimental specimen of a rubber sample observed after the first sliding step. The thermal evolution of the contact zone of the rubber sample was measured using an infrared camera (Figure 2b), and the temperature of each area of the contact zone is shown in Figure 10b. The numerical simulation presented in Figure 10d, shows the temperature variations between 170 °C and 195 °C (orange code) in the upper part of the contact zone which can also be observed on the experimental block (orange patch, Figure 10b). However, a very high temperature was noted at the edge of the numerical rubber block (Figure 10b, red zone); it appears to reveal the first abrasion zone. The sliding sample is subject to several mechanical and thermal mechanisms: the heating of the sliding surface leads to wear. The contact rubber layer of the rubber sample wears out and a new undamaged surface comes into contact. This new surface undergoes a temperature rise until wear appears again and thus the process of repeated (heating/wearing) leads to the final eroded shape shown in Figure 10a. The numerical simulation results shown in Figure 10c do not take into account this erosion mechanism, as the temperature of the leading edge rises to 1800 °C. As previously mentioned, the experimental test shows a very high level of abrasion and this phenomenon needs to be taken into consideration. Within the ABAQUS code [30], a method could be adopted, based on a new modified geometry (new mesh) for each step of sliding. This method will be discussed in a future study.
From these present studies, it can be concluded that pressure and temperature have a considerable influence on the aircraft tire wear phenomenon which needs to be taken into account in future simulations. It must also be mentioned that a specific mesh could be used in the case of a constant wear ratio and a constant number of elements, and the rubber block could be divided into sub- zones, each zone having its own heating history.

3. Finite Element Model of a Rolling Tire

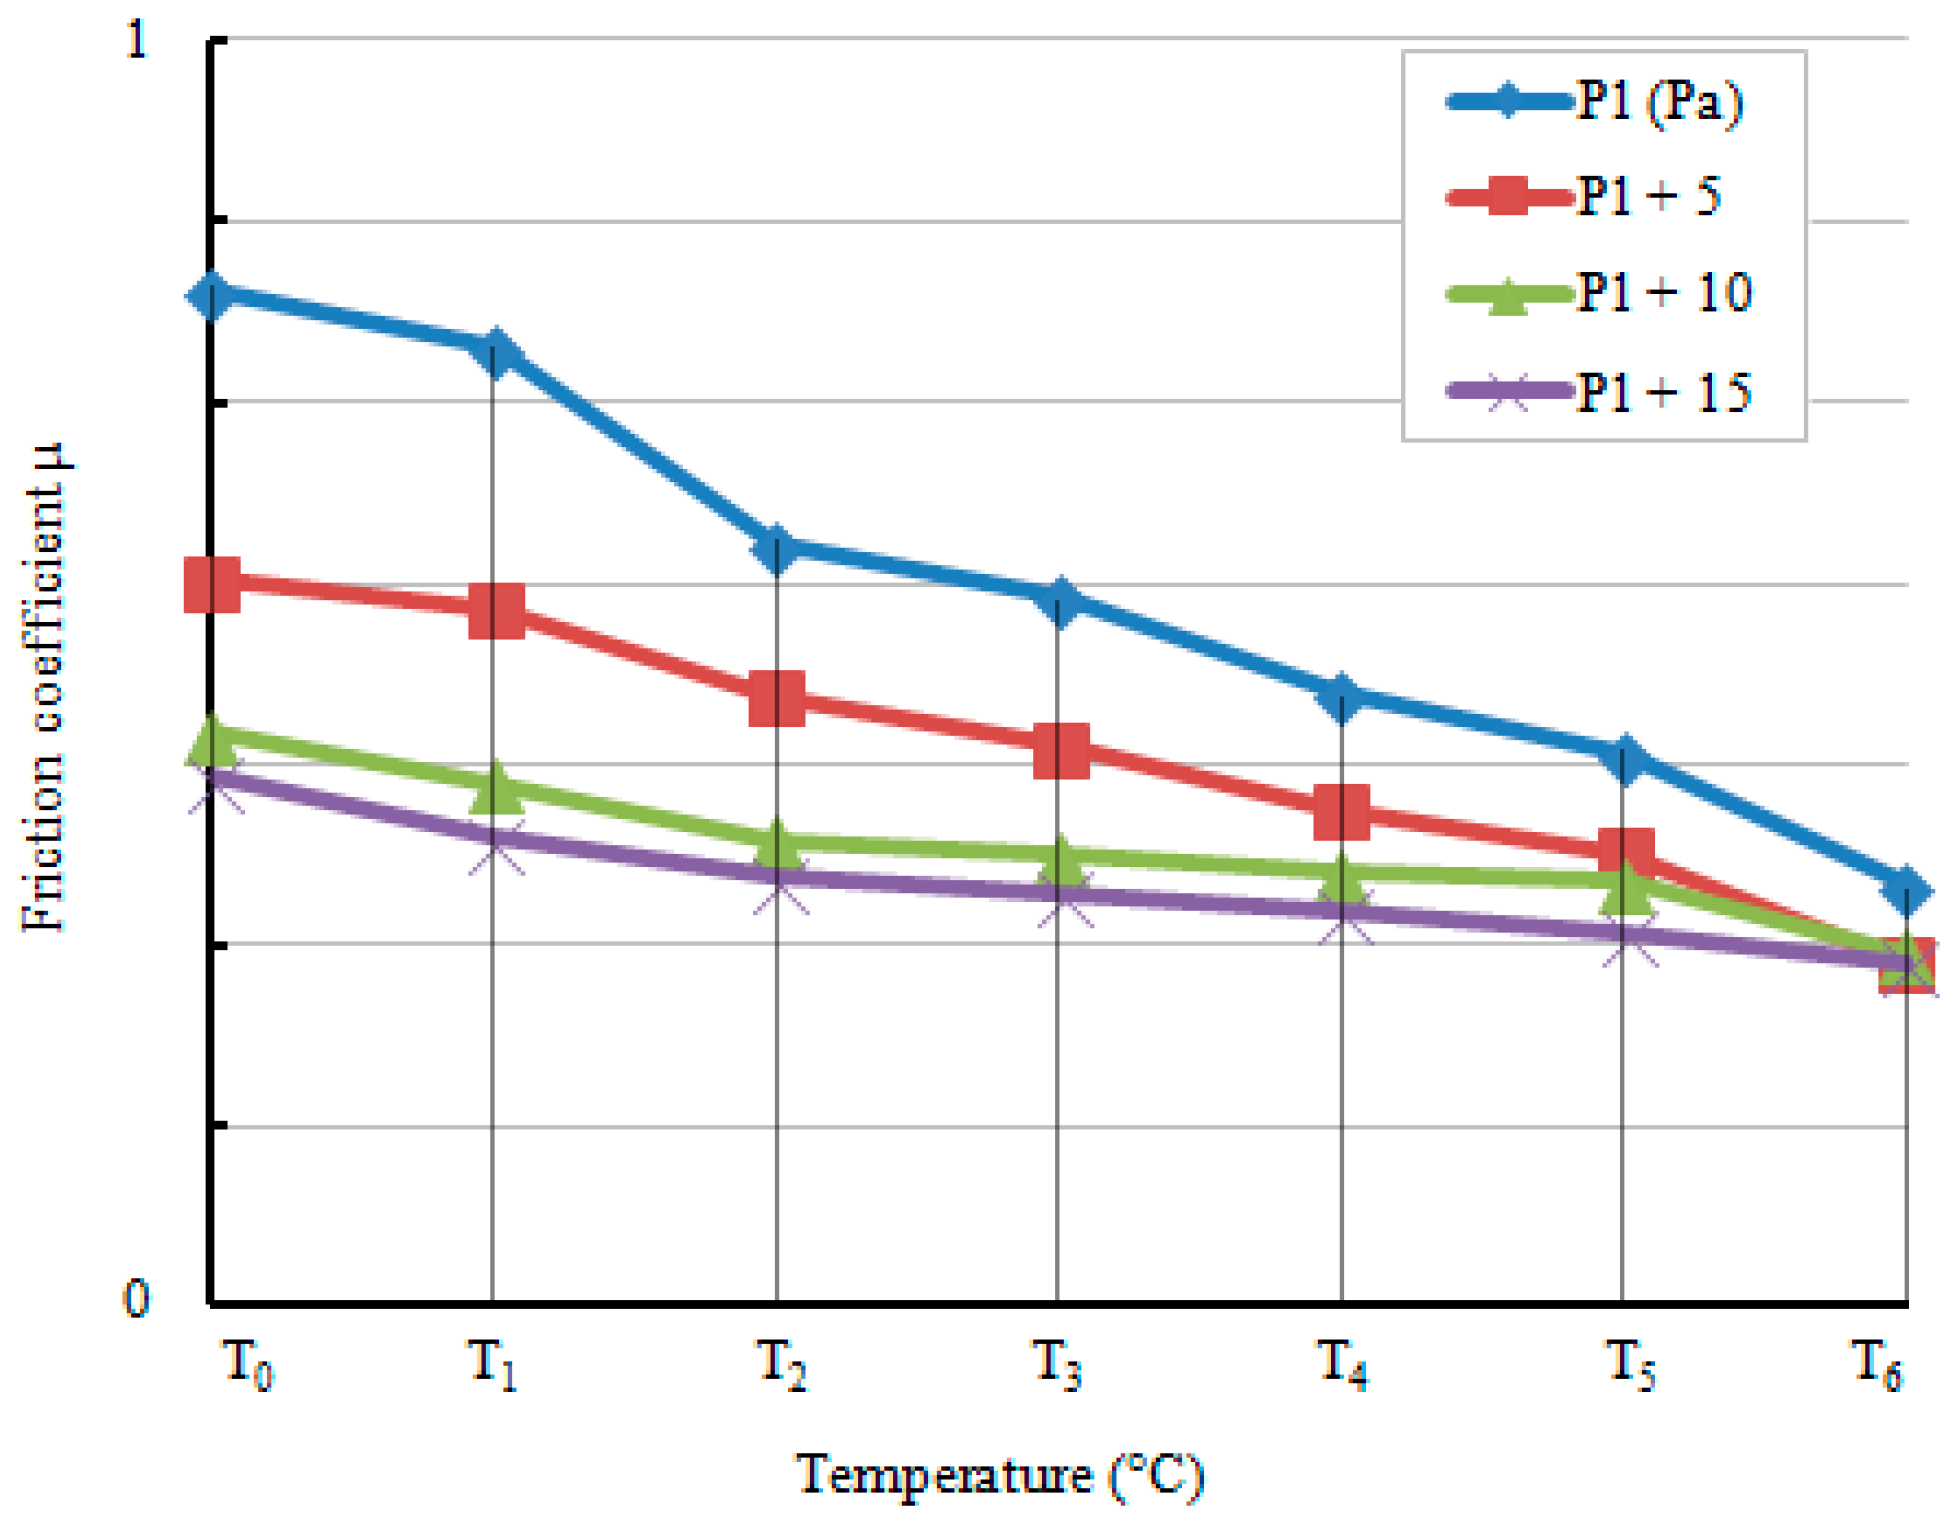
FEM of a Rolling Tire Using a Variable Friction Coefficient

In a precedent study, a purely mechanical finite element analysis of a rolling tire was investigated [22]. The model was able to predict the cornering behavior of an aircraft tire in contact with a flat rigid body. The Coulomb friction was modeled using a stiffness method [12] that permits some relative motion of the surfaces.
In this section, a thermo-mechanical model was proposed in order to predict the friction coefficient μ, the self-aligning torque Mz and the thermal evolution of a rolling tire. A classical rolling (CR) method based on the Lagrangian formulation was used along with a variable friction coefficient μ (P,T) dependent on the contact pressure and temperature. The contact aspect is modeled in a soft-contact manner using exponential pressure-overclosure regularization, where the clearance C0 and the contact pressure at zero clearance λ0 are defined, based on a numerical sensitivity study. A Prony model was used for the viscoelastic behavior of the rubber. Concerning the friction coefficient, the IDS facility (High Speed Linear Friction Tester, Figure 2b) was used once more in order to identify the dependence of the friction coefficient on temperature and pressure. The experiments for this study were performed on an asphalt test track, and rubber tread samples measuring 20 × 20 mm on the contact area and 10 mm in thickness were used. Experimental results are shown in Figure 11 which presents the variation of the friction coefficient as a function of the ambient temperatures of the test track, for different given contact pressures (corresponding to the real pressures applied on the aircraft tire). As can be noted, for a given contact pressure, the temperature increase results in a decrease in the friction coefficient values. Figure 12 illustrates the variation of the friction coefficient as a function of the contact pressure for different given ambient temperatures of the test track. Here, for a given contact temperature, the friction coefficient decreases with the increase of the contact pressure. These variations of the friction coefficient were taken into account and applied in the numerical simulations.
A cornering tire loaded at vertical force Fz, running at a velocity of 37.79 knots (19.44 m/s) and a fixed skidding angle, is presented. The temperature of the tire tread increases significantly after a few seconds of cornering, and the rubber reaches an external high temperature which is close to the critical temperature at which the rubber is deposited on the concrete surface [3]. An experimental test was realized on an aircraft tire, and the thermal evolution of the contact zone of the aircraft tire tread was recorded during both rolling and skidding phases using an infrared camera (Figure 13a). Figure 13b shows the experimental data of the thermal evolution of the contact zone in the cornering conditions of an aircraft tire under load, running at a velocity of 37.79 knots and for a given slip angle β1 for a given time (t6). The blue solid presents the three stages of the skidding test. In the first stage, the tire is skidded from 0° to β1°. In the second stage, the tire is kept rolling at β1° for a given time, and in the last stage, the tire is moved from the skidding position (at β1°) to the initial position (at 0°). The red line (Figure 13b,d) reveals the heating of the tire tread after a few seconds of skidding, during the first stage of the skidding test.
Figure 13d presents the thermal evolution in contact zone of tire tread during the first seconds of skidding (between t0 and t1 seconds). As can be noted, the numerical simulation tends to predict the maximum temperature of the tire tread after a few seconds of rolling in skidding mode (first stage of the skidding test). Even if the temperature of the contact zone increases to 140 °C, the experimental data shows a different tendency for the initial gradient. That difference could be related to the rolling test conditions, to the thermal conductivity of the runway surface and to the inelastic deformation, one of the most important mechanisms which leads to self-heating. Further investigations must be carried out in order to obtain the same evolution of the temperature observed experimentally.

4. Conclusions

In this paper, a numerical simulation of an aircraft tire in contact with a rough surface, using a variable friction coefficient depending on temperature and contact pressure, is presented. Firstly, a sliding facility was used in order to evaluate this dependence of the friction coefficient. The thermal evolution of rubber block samples under the sliding condition is also discussed. Additional experimental tests were realized in order to simulate the frictional heating phenomenon developed in the tire tread using an external heat source. In these studies, all experimental parameters were chosen, being similar to the real parameters of aircraft tires in rolling and skidding conditions (vertical loading, velocity, inflation pressure and skidding angle). Both frictional heating and temperature diffusion were compared to numerical 2D and 3D simulations and similar temperature prediction could be obtained. The final shapes of the rubber samples at the end of the experiment sliding procedures clearly show a high-level wear which needs be taken into consideration in future simulations.
A 3D finite element model for a rolling tire in the cornering phase was investigated using a variable friction coefficient dependent on temperature and contact pressure. The numerical simulation tended to predict the temperature of the tire tread after a few seconds of rolling in skidding position; however, further investigations must be carried out in order to obtain the evolution of the temperature observed experimentally.

Author Contributions

Hagen Lind and Matthias Wangenheim, from the Institute of Dynamics and Vibration Research (IDS), Leibniz Universität Hannover, performed the experiments concerning the determination of the friction coefficient and the frictional heating of the tire tread rubber; Iulian Rosu and Hélène L. Elias-Birembaux carried out the numerical and experimental simulations and analyzed the data. All authors were involved in the preparation of the manuscript.

Conflicts of Interest

The authors declare no conflict of interest.

References

  1. Sakai, H.; Araki, K. Thermal engineering analysis of rubber vulcanization and tread temperature during severe sliding of a tire. Tire Sci. Technol. 1999, 27, 22–47. [Google Scholar] [CrossRef]
  2. Moore, D.F. Friction and wear in rubbers and tyres. Wear 1980, 61, 273–282. [Google Scholar] [CrossRef]
  3. Tanner, J.A.; Dreher, R.C.; Strubb, S.M.; Smith, E.G. Tire Tread Temperatures during Antiskid Braking and Cornering on a Dry Runway; NASA Technical Paper 2009; National Aeronautics and Space Administration: Washington, DC, USA, 1982.
  4. McCarty, J.L.; Tanner, J.A. Temperature Distribution in Aircraft Tire at Low Ground Speed; NASA Technical Report 2195; NASA Lewis Research Center: Cleveland, OH, USA, 1983.
  5. Clark, S.K.; Dogde, R.N. Heat Generation in Aircraft Tire Under Free Rolling Conditions; NASA Technical Report 3629; Michigan University Department of Mechanical Engineering and Applied Mechanics: Ann Arbor, MI, USA, 1982. [Google Scholar]
  6. Eichhorn, U.; Roth, J. Prediction and monitoring of tyre/road friction. In Proceedings of the XXIV FISITA Congress, London, UK, 7–11 June 1992; Volume 2, pp. 67–74.
  7. Bui, Q.V.; Ponthot, J.P. Estimation of rubber sliding friction from asperity interaction modeling. Wear 2002, 252, 150–160. [Google Scholar] [CrossRef]
  8. Lebon, F. Contact problems with friction: Models and simulations. Simul. Model. Pract. Theory 2003, 11, 449–463. [Google Scholar] [CrossRef]
  9. Grosch, K.A. The relation between friction and visco-elastic properties of rubber. Proc. R. Soc. Lond. Ser. A Math. Phys. Sci. 1963, 274, 21–39. [Google Scholar] [CrossRef]
  10. Kongo Kondé, A. Modélisation du Roulement D’un Pneumatique D’avion. Ph.D. Thesis, Aix-Marseille University, Marseille, France, 2011. [Google Scholar]
  11. Kongo Kondé, A.; Rosu, I.; Lebon, F.; Brardo, O.; Devésa, B. On the modeling of aircraft tire. Aerosp. Sci. Technol. 2013, 27, 67–75. [Google Scholar] [CrossRef]
  12. Kongo Kondé, A.; Rosu, I.; Lebon, F.; Seguin, L.; Brardo, O.; Troude, F.; Devésa, B. Thermomechanical couplings in aircraft tire rolling/sliding modeling. Adv. Mater. Res. 2011, 274, 81–90. [Google Scholar] [CrossRef]
  13. McCarty, J.L.; Yager, T.J.; Riccitiello, S.R. Wear, Friction and Temperature Characteristics of an Aircraft Tire Undergoing Braking and Cornering; NASA Technical Paper 1569; NASA Langley Research Center: Hampton, VA, USA, 1979.
  14. McCarty, J.L. Wear and Related Characteristics of an Aircraft Tire during Braking; NASA Technical Note, D-6963; National Aeronautics and Space Administration: Washington, DC, USA, 1972.
  15. Henry, J.J. Evaluation of Pavement Friction Characteristics: A Synthesis of Highway Practice, NCHRP Synthesis 291; Transportation Research Board, National Research Council: Washington, DC, USA, 2000. [Google Scholar]
  16. Hall, J.W.; Smith, K.L.; Titus-Glover, L.; Wambold, J.C.; Yager, T.J.; Rado, Z. Guide for Pavement Friction; National Cooperative Highway Research Program, Transportation Research Board of the National Academies: Washington, DC, USA, 2009. [Google Scholar]
  17. Persson, B.N.J. On the theory of rubber friction. Surf. Sci. 1998, 401, 445–454. [Google Scholar] [CrossRef]
  18. Persson, B.N.J.; Albohar, O.; Tartaglino, U.; Volokitin, A.I.; Tosatti, E. On the nature of surface roughness with application to contact mechanics, sealing, rubber friction and adhesion. J. Phys. Condens. Matter 2005, 17, R1–R62. [Google Scholar] [CrossRef] [PubMed]
  19. Persson, B.N.J. Rubber friction: Role of the flash temperature. J. Phys. Condens. Matter 2006, 18, 7789–7823. [Google Scholar] [CrossRef] [PubMed]
  20. Elias-Birembaux, L.; Rosu, I.; Lebon, F. Thermo-mechanical modelling of the aircraft tyre cornering. Mach. Dyn. Res. 2013, 37, 29–36. [Google Scholar]
  21. Rosu, I.; Elias-Birembaux, L.; Lebon, F. Thermo-viscoelastic modeling of the aircraft tire cornering. Adv. Mater. Res. 2015, 1099, 80–86. [Google Scholar] [CrossRef]
  22. Elias-Birembaux, L.; Rosu, I.; Lebon, F. Thermo-viscoelastic modeling of aircraft tire cornering. In Proceedings of the 30th International Conference of Polymer Processing Society, Cleveland, OH, USA, 6–12 June 2014.
  23. Fevrier, P.; Le Maitre, O. Tire temperature modeling: Application to race tires. In Proceedings of the VDI 13th International Congress Numerical Analysis and Simulation in Vehicle Engineering, Wurzburg, Germany, 27–28 September 2006.
  24. Kainradl, P.; Kaufmann, G. Heat generation in pneumatic tires. Rubber Chem. Technol. 1976, 49, 823–861. [Google Scholar] [CrossRef]
  25. Mooney, M. A theory of large elastic deformation. J. Appl. Phys. 1940, 11, 582–592. [Google Scholar] [CrossRef]
  26. Rivlin, R.S. Large elastic deformations of isotropic materials. IV. Further developments of the general theory. Philos. Trans. R. Soc. Lond. 1948, 241, 379–397. [Google Scholar] [CrossRef]
  27. Lin, Y.J.; Hwang, S.J. Temperature prediction of rolling tires by computer simulation. Math. Comput. Simul. 2004, 67, 235–249. [Google Scholar] [CrossRef]
  28. Lahellec, N.; Mazerolle, F.; Michel, J.C. Second-order estimate of the macroscopic behaviour of periodic hyperelastic composites: Theory and experimental validation. J. Mech. Phys. Solids 2004, 52, 27–49. [Google Scholar] [CrossRef]
  29. Yanjin, G.; Guoqun, Z.; Gang, C. Influence of belt cord angle on radial tire under different rolling states. J. Reinf. Plast. Compos. 2006, 25, 1059–1077. [Google Scholar] [CrossRef]
  30. Dassault Systèmes. ABAQUS/Standard; Theory Manual and Example Problems Manual; Release 6.12; Dassault Systèmes: Waltham, MA, USA, 2011. [Google Scholar]
Figure 1. Forces and moments definitions on a tire.
Lubricants 04 00029 g001
Figure 2. (a) High Speed Linear Tester (HiLiTe); (b) test set-up for contact temperature and deformation measurements; (c) test phases; (d,e) final sample shape after sliding phase on concrete test track.
Lubricants 04 00029 g002
Figure 3. (a) Heating setting; (b) tire tread and sensors positions, zone (1) presents the tire tread zone where the heating was applied, zone (2) presents the internal part of tire tread where an infrared sensor was installed, zone (3) presents the groove area where an external sensor is used to measure the temperature, zone (4) presents the internal part of the groove where an infrared sensor was used to measure the thermal evolution.
Lubricants 04 00029 g003
Figure 4. Thermal evolution of tire tread zones for 60 °C of external heating.
Lubricants 04 00029 g004
Figure 5. Comparison between experimental and numerical simulation, heating of tire tread by external heat source, LMA data.
Lubricants 04 00029 g005
Figure 6. Internal temperature evolution of a rubber block in a sliding test, IDS test, Hannover.
Lubricants 04 00029 g006
Figure 7. (a) The 2D numerical specimen; (b) specimen shape after sliding, Von Mises’s stress distribution.
Lubricants 04 00029 g007aLubricants 04 00029 g007b
Figure 8. (a) Numerical specimen, rubber sample shape with initial eroded zone; (b) typical lateral view of deformed, worn sample form; (c) rubber sample final shape; (d) rubber test sample during sliding at the liner friction tester.
Lubricants 04 00029 g008
Figure 9. The 3D view of a rubber block on a runway track, thermal evolution of the contact zone, the temperatures are presented in °C (NT11).
Lubricants 04 00029 g009
Figure 10. (a) Experimental specimen, a rubber sample shape after the sliding step; (b) experimental measurement, thermal evolution of a rubber sample/contact zone at the end of the sliding step (in °C); (c) numerical specimen, rubber sample shape after first sliding; (d) numerical simulation typical lateral view of the deformed specimen’s final shape appearance, thermal evolution in the contact zone, the temperatures are presented in °C (NT11).
Lubricants 04 00029 g010
Figure 11. IDS experimental results, variation of friction coefficient as function of the ambient temperature of the test track, for different given contact pressures.
Lubricants 04 00029 g011
Figure 12. IDS experimental results, variation of friction coefficient as function of contact pressure for different given ambient temperatures.
Lubricants 04 00029 g012
Figure 13. (a) Experimental measurement; (b) experimental data, thermal evolution of the contact zone during the skidding test for a given skidding angle β1; (c) numerical simulation, thermal evolution of the contact zone of the tire during a cornering stage (the temperatures are presented in °C (TEMP); (d) thermal evolution of the contact zone during the first seconds of skidding (first stage of skidding test), comparison between experimental test and numerical simulation.
Lubricants 04 00029 g013

