
Tribo-Mechanisms of Carbon Nanotubes: Friction and Wear Behavior of CNT-Reinforced Nickel Matrix Composites and CNT-Coated Bulk Nickel


Abstract
:1. Introduction
2. Results and Discussion
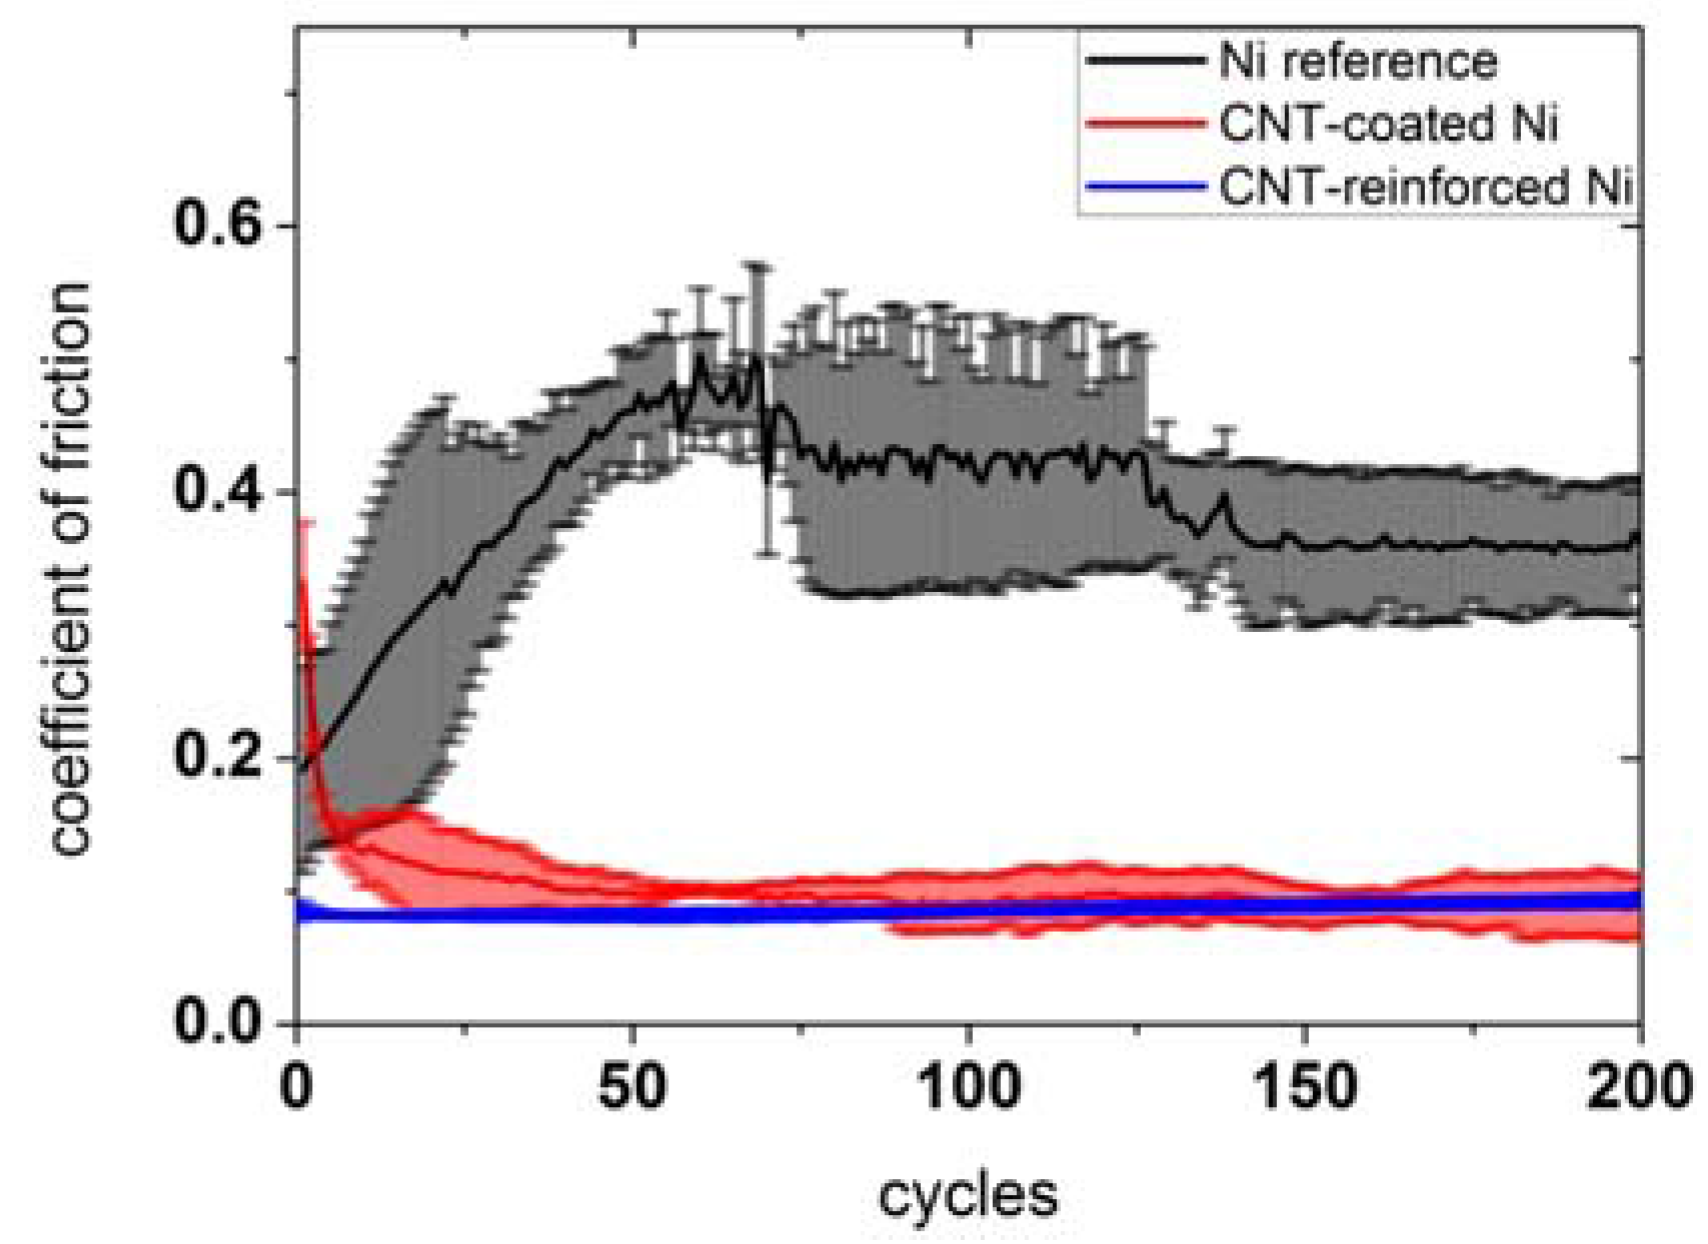
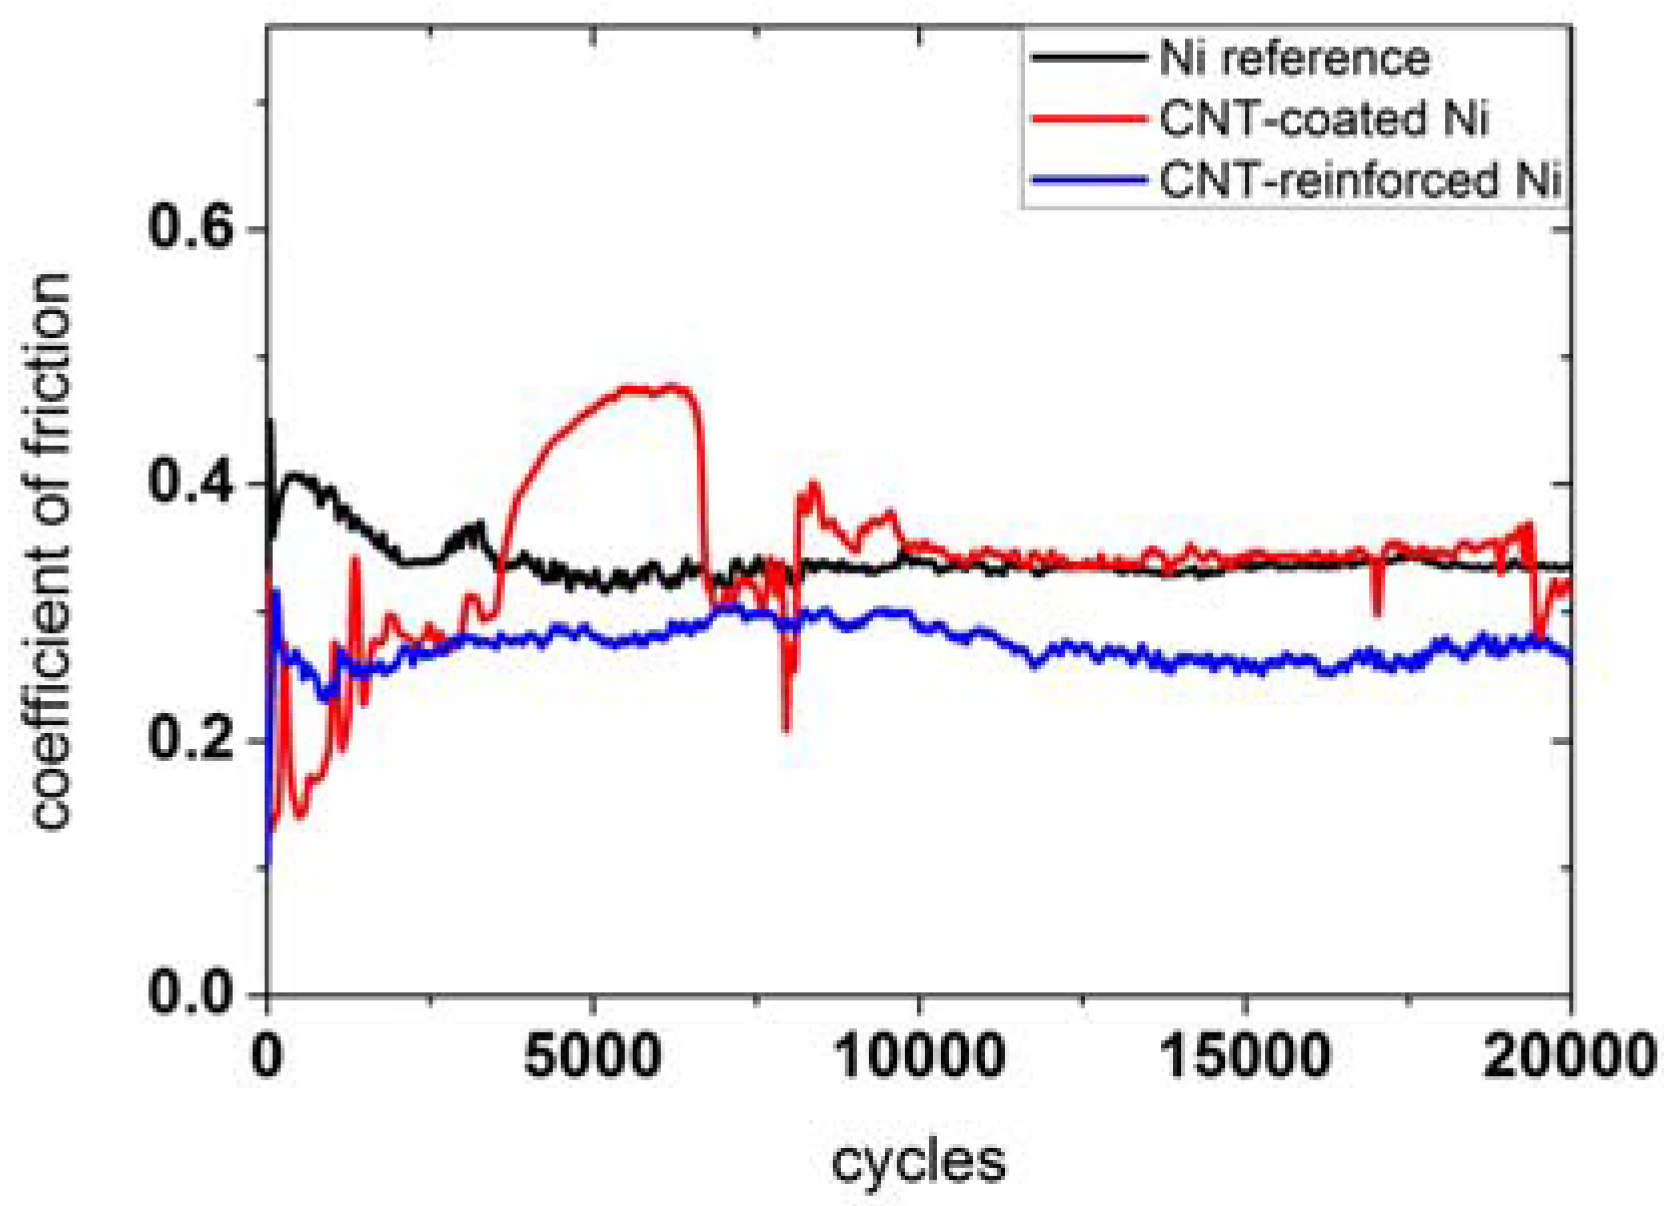
2.1. Frictional Behavior
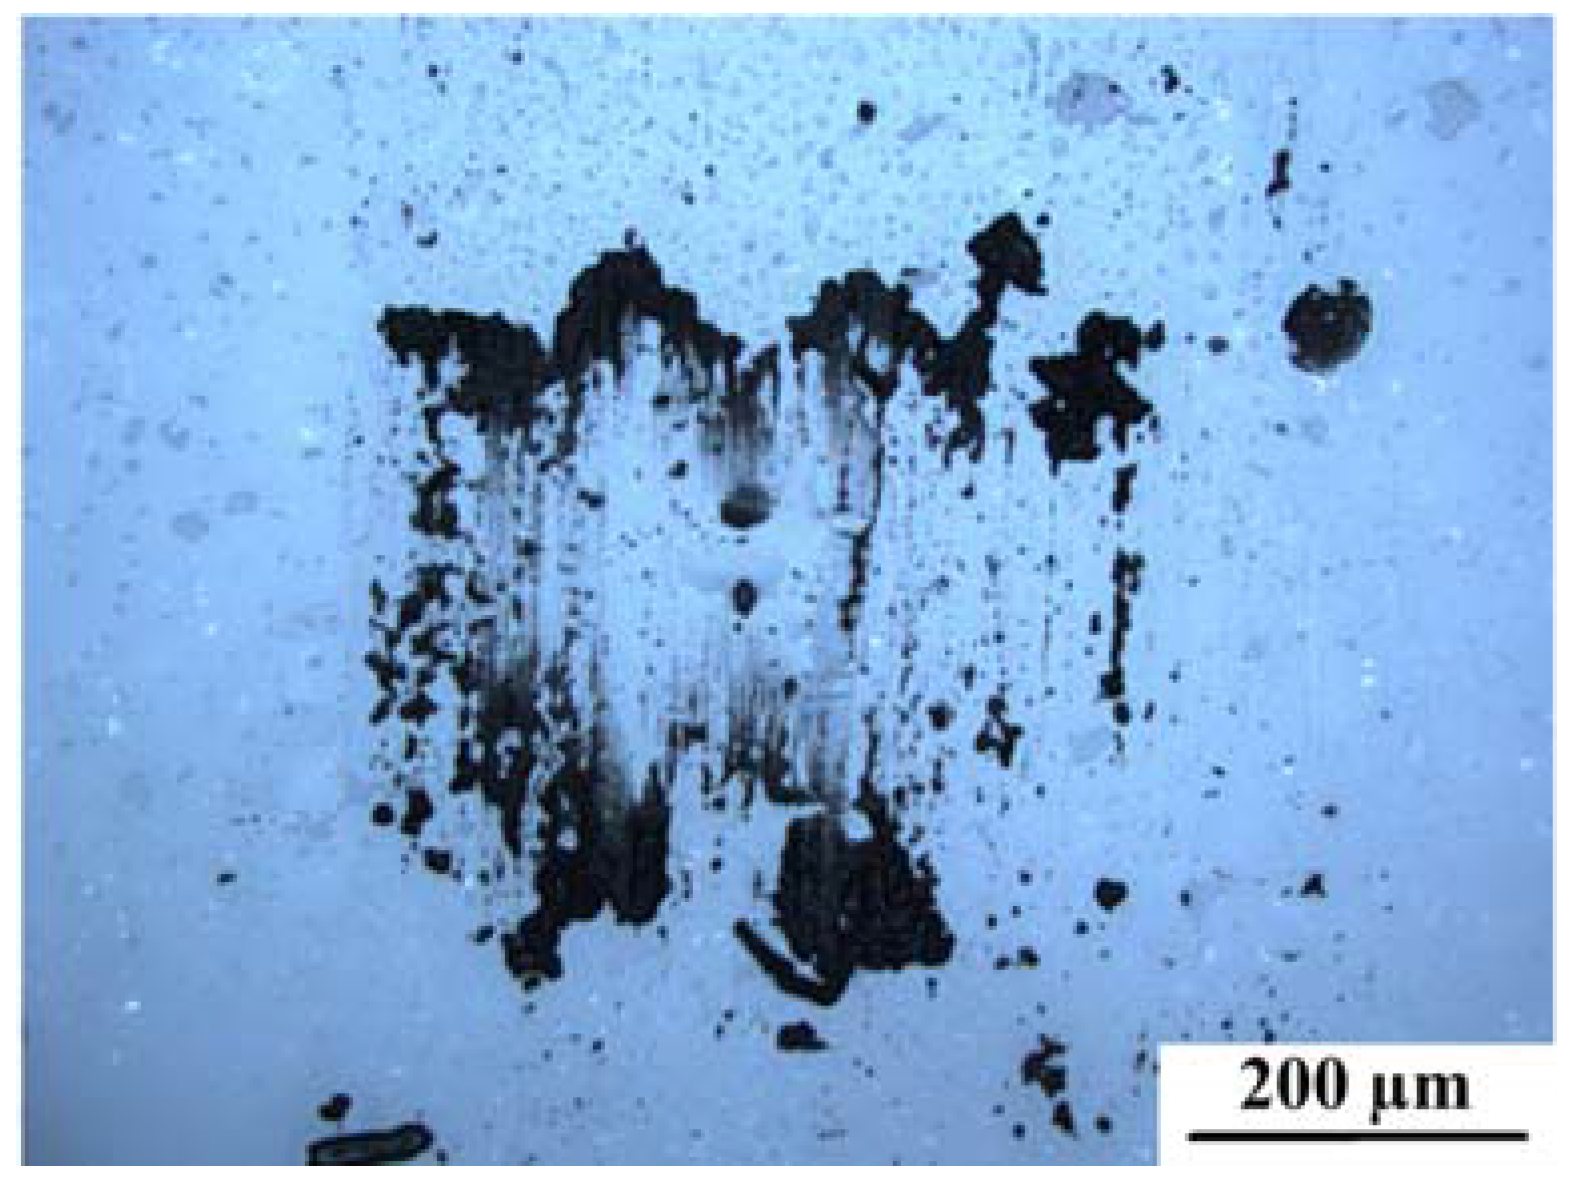
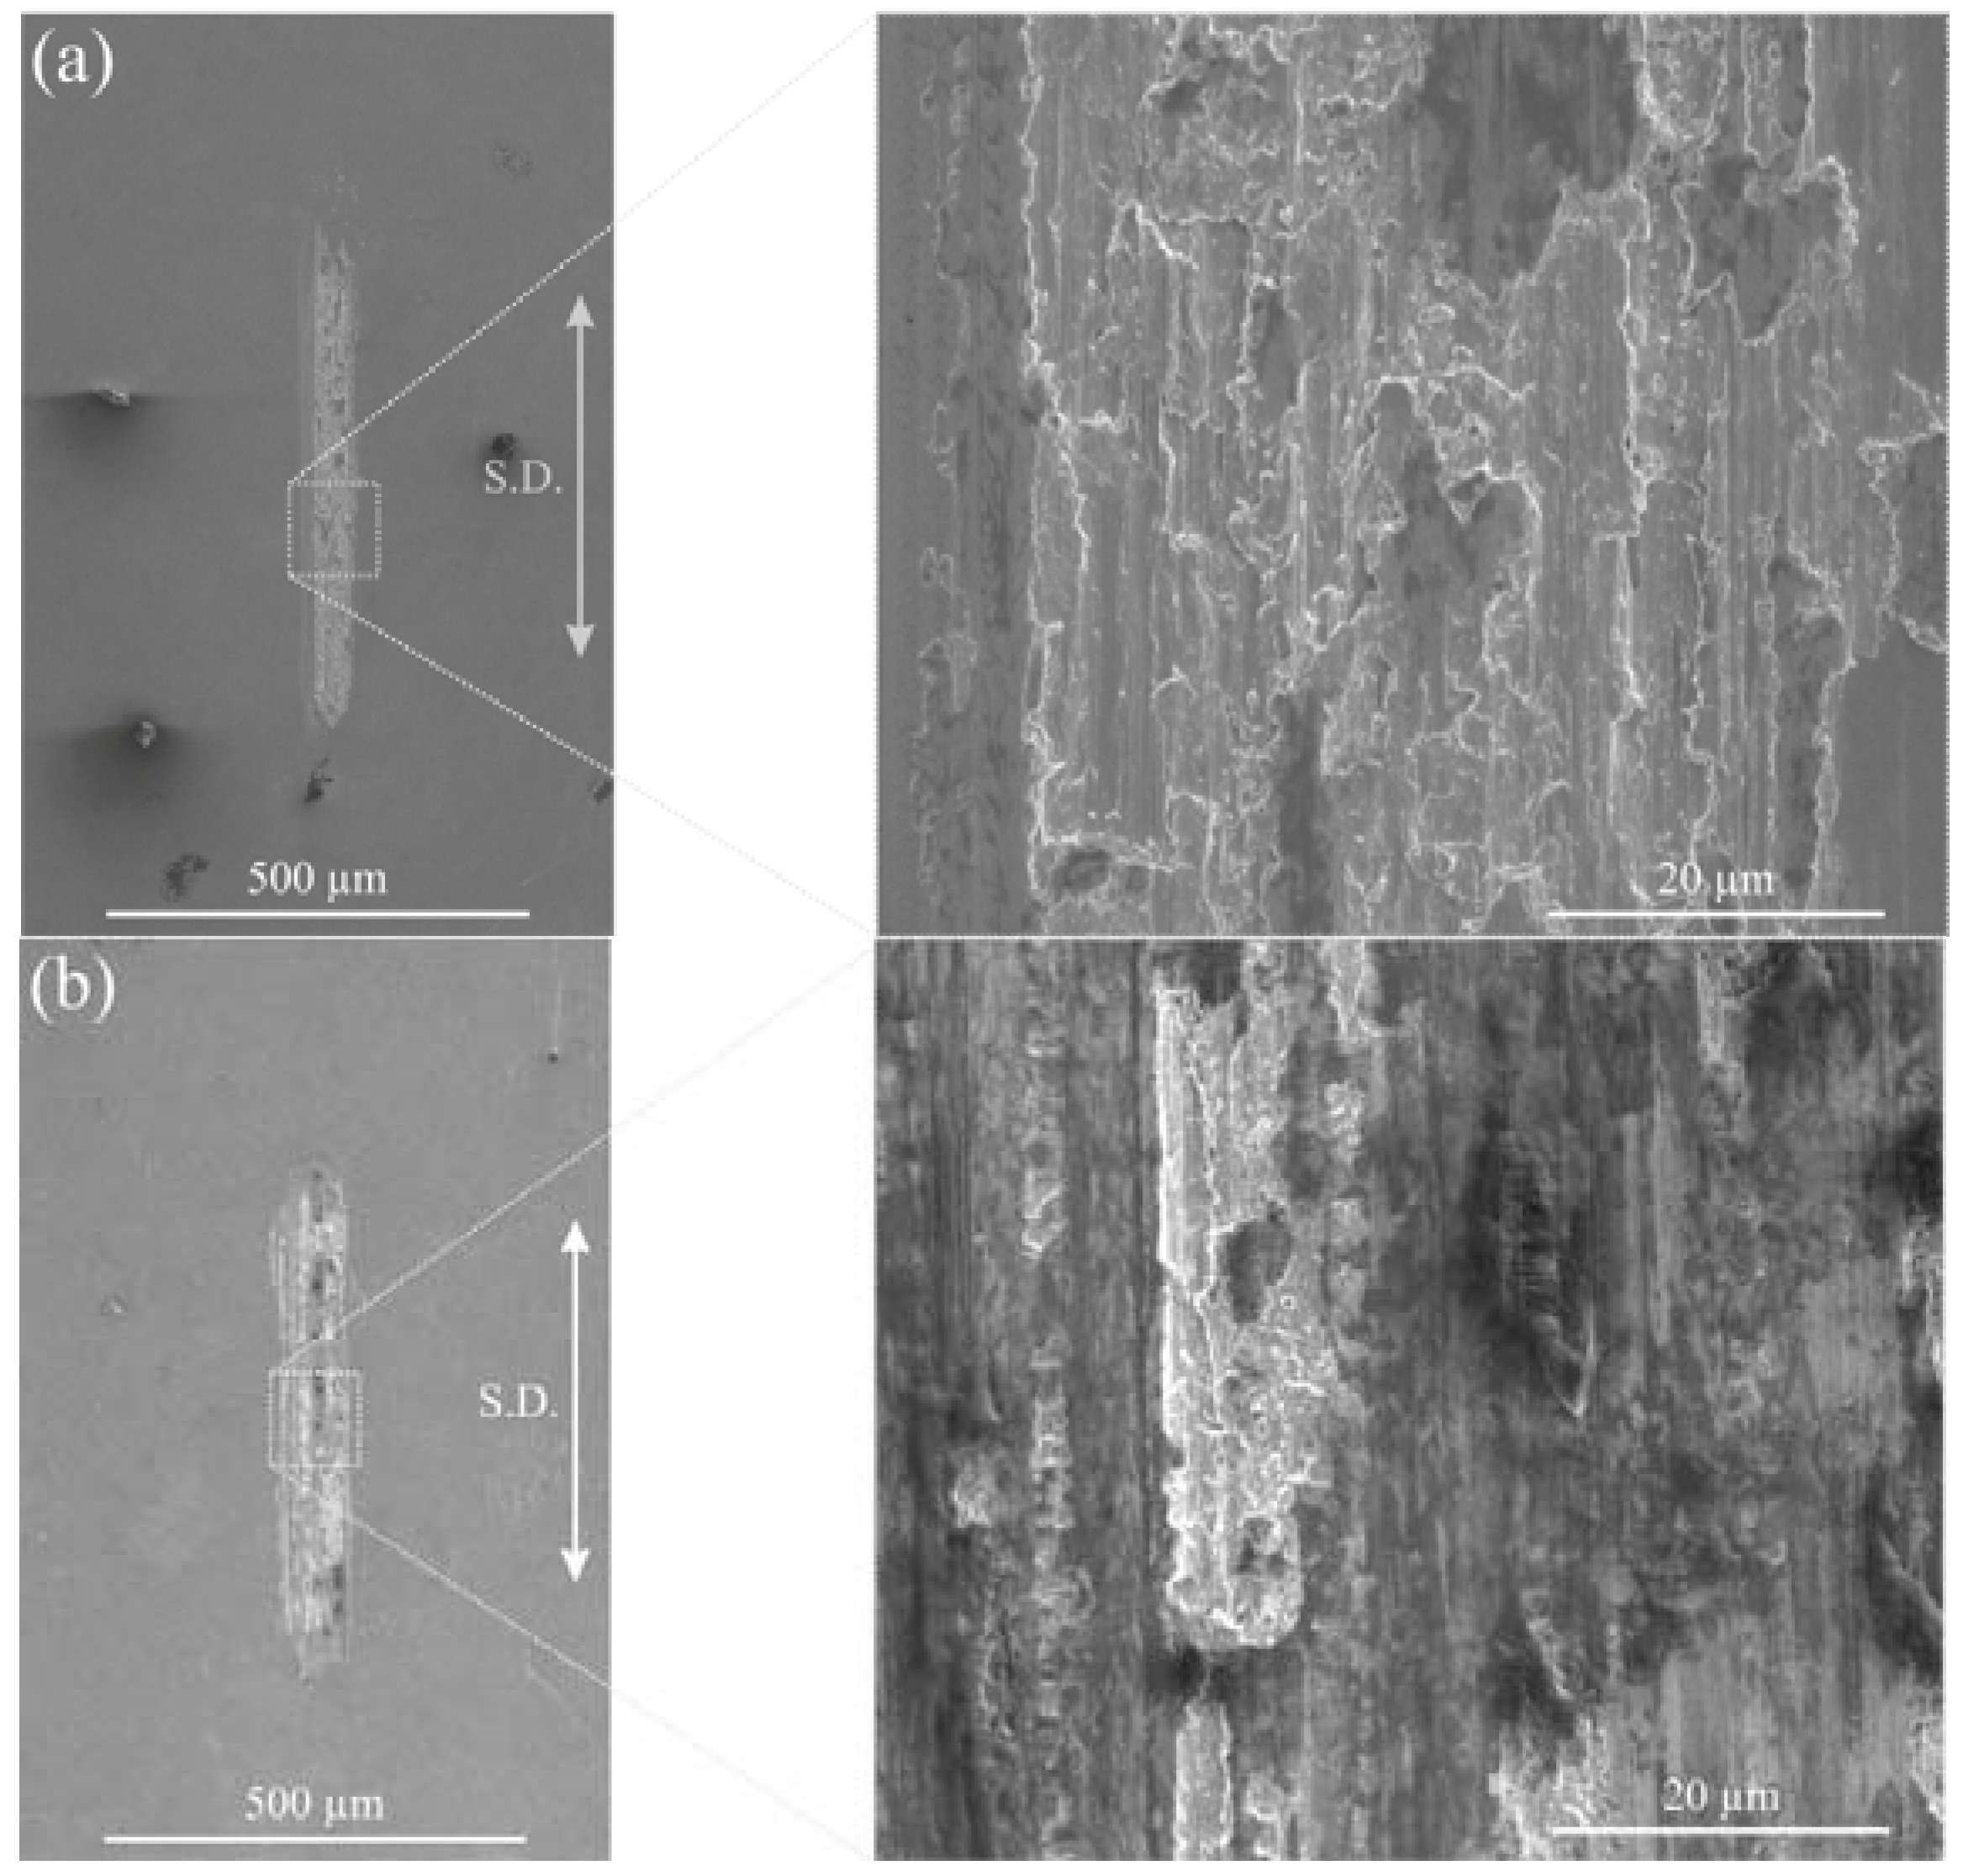
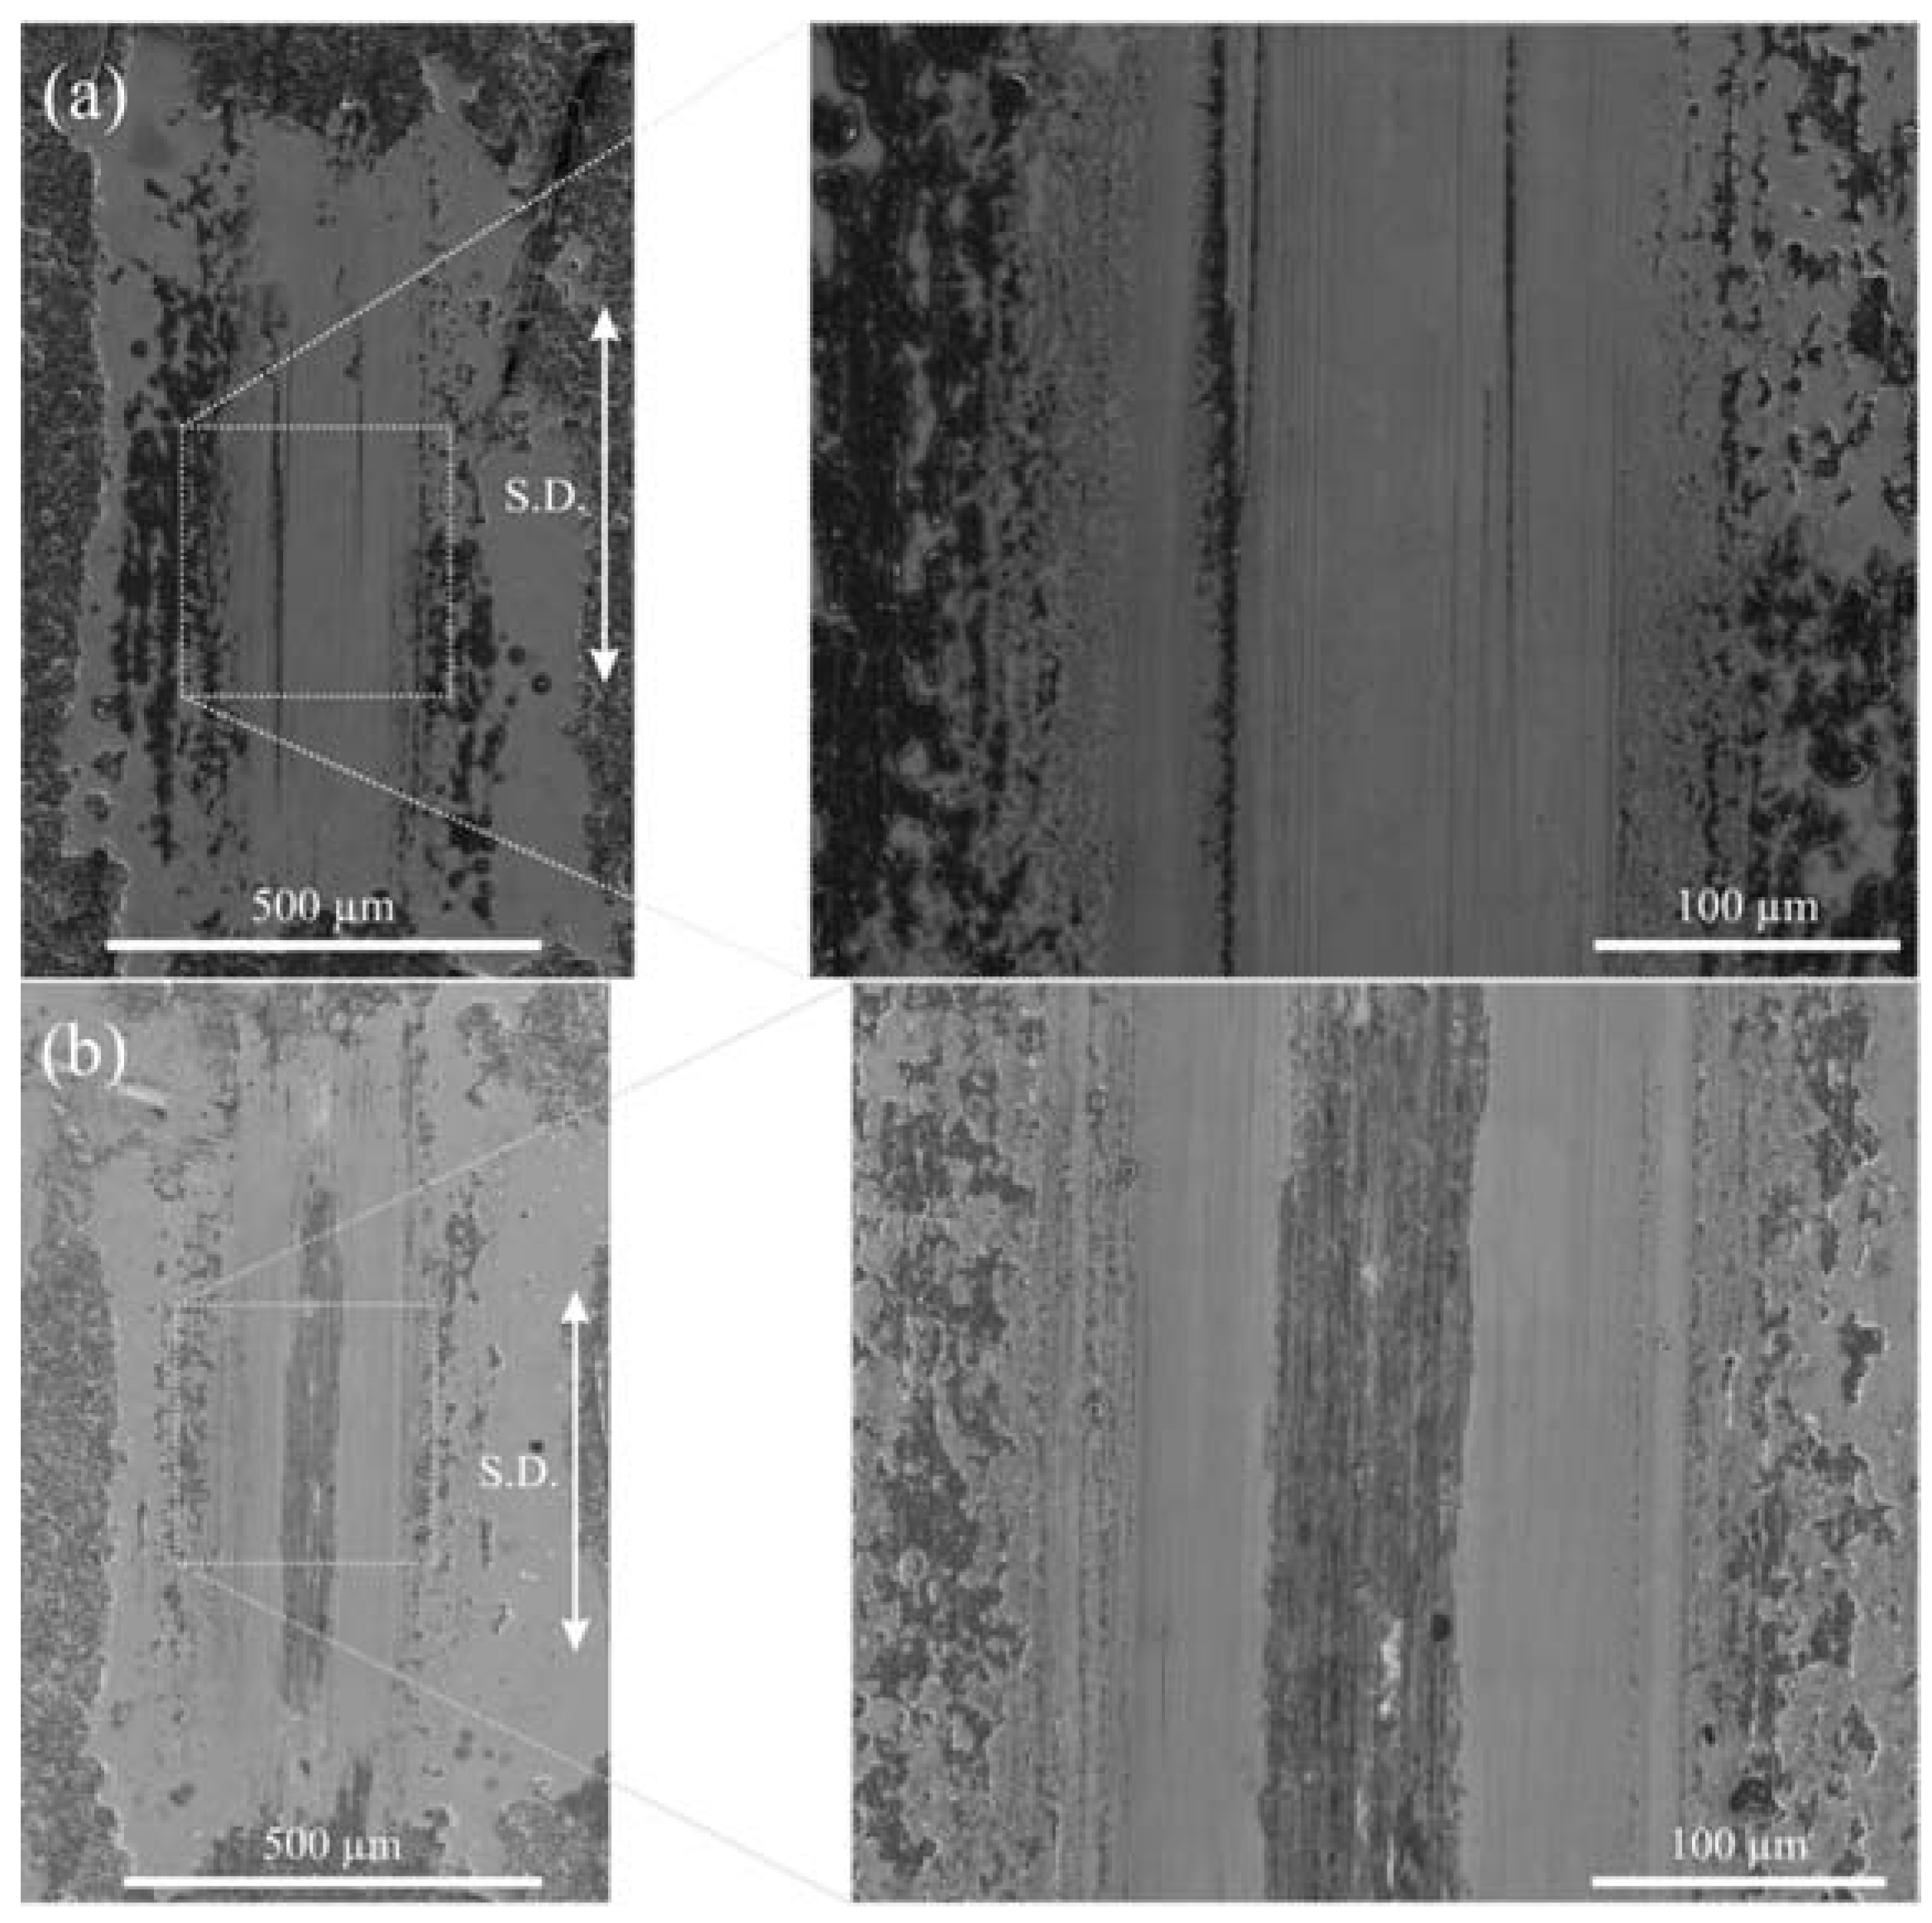
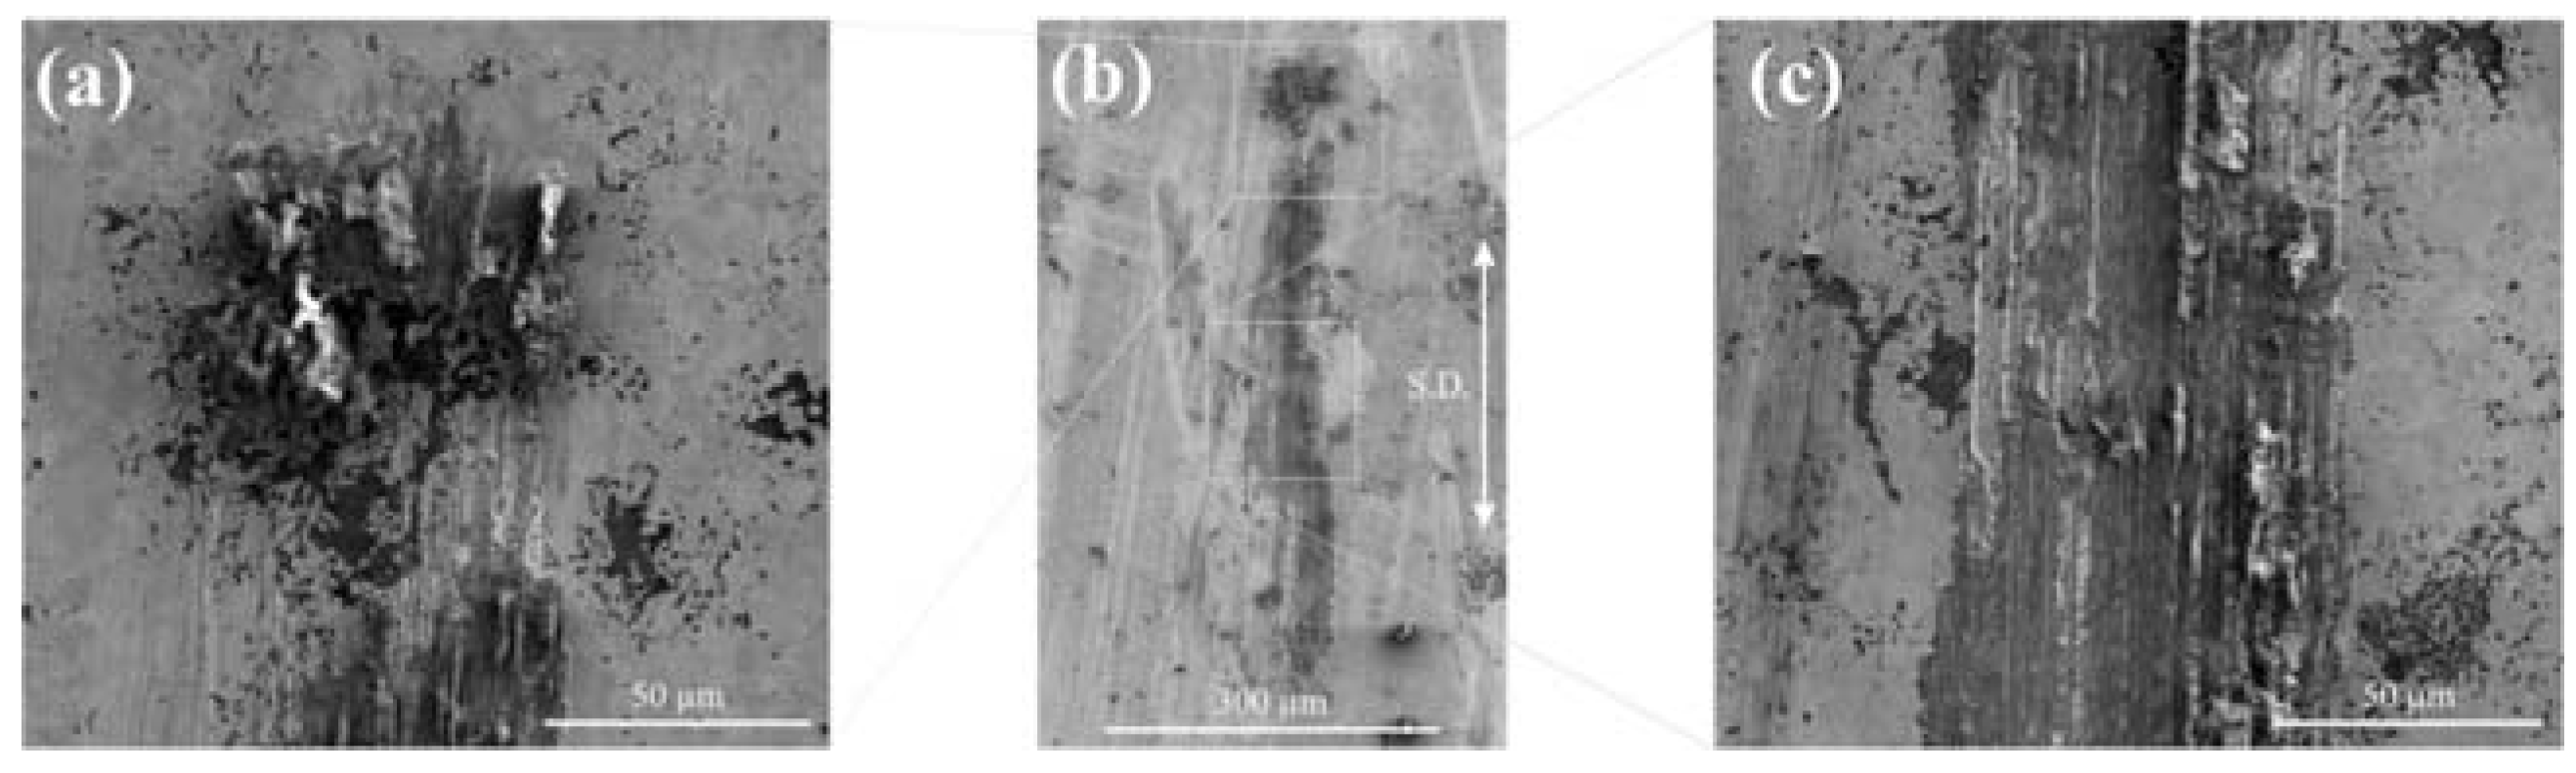
2.2. Wear Behavior
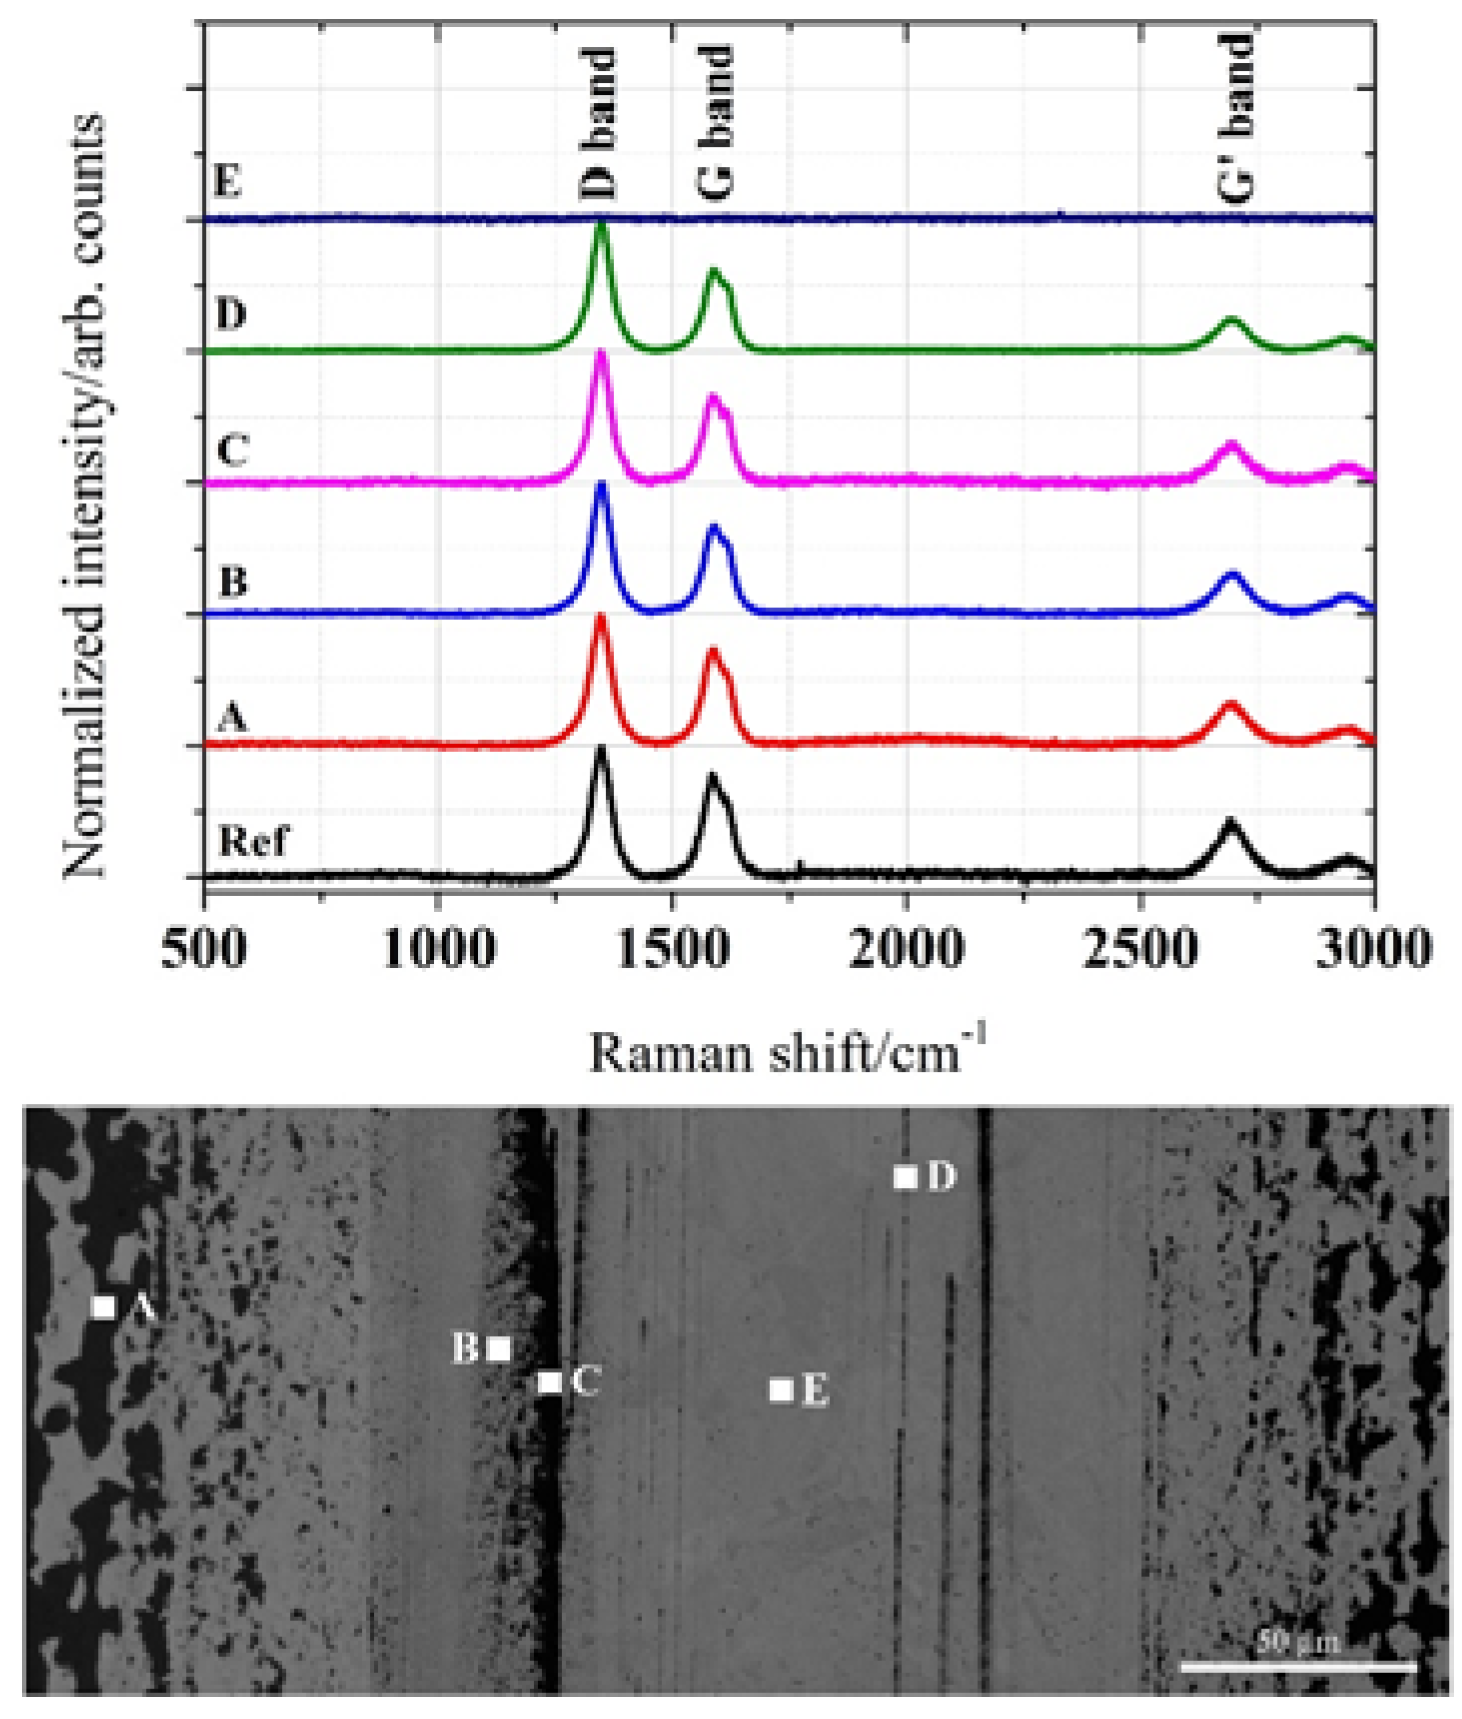
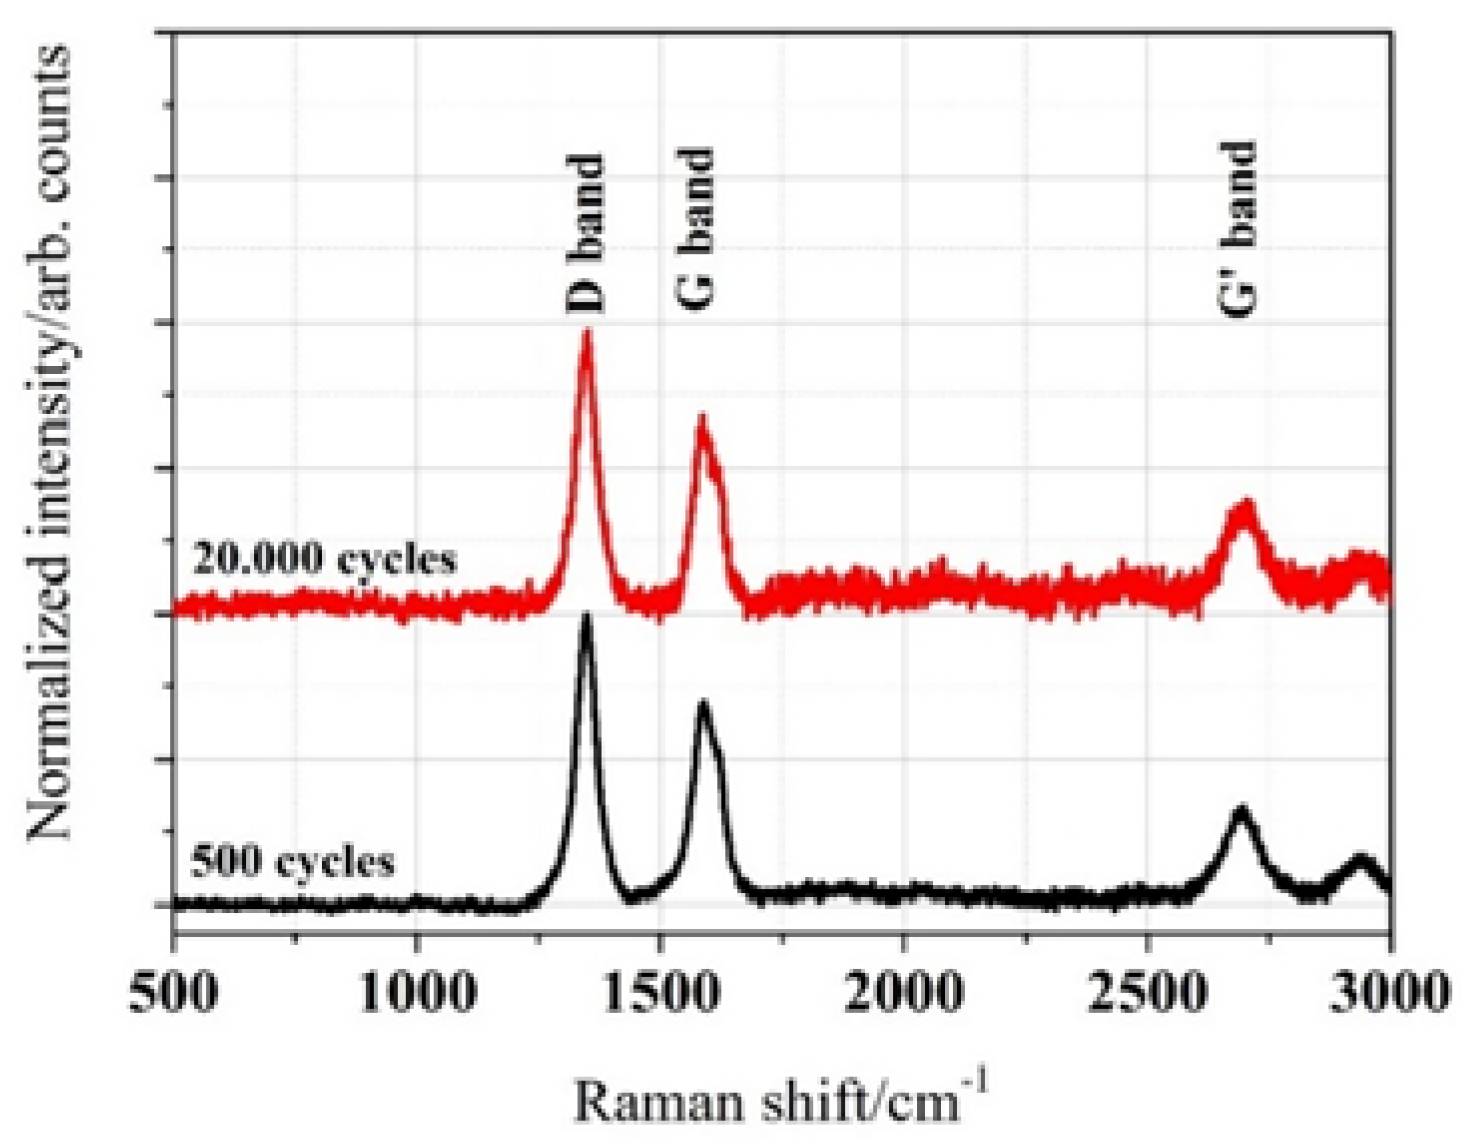
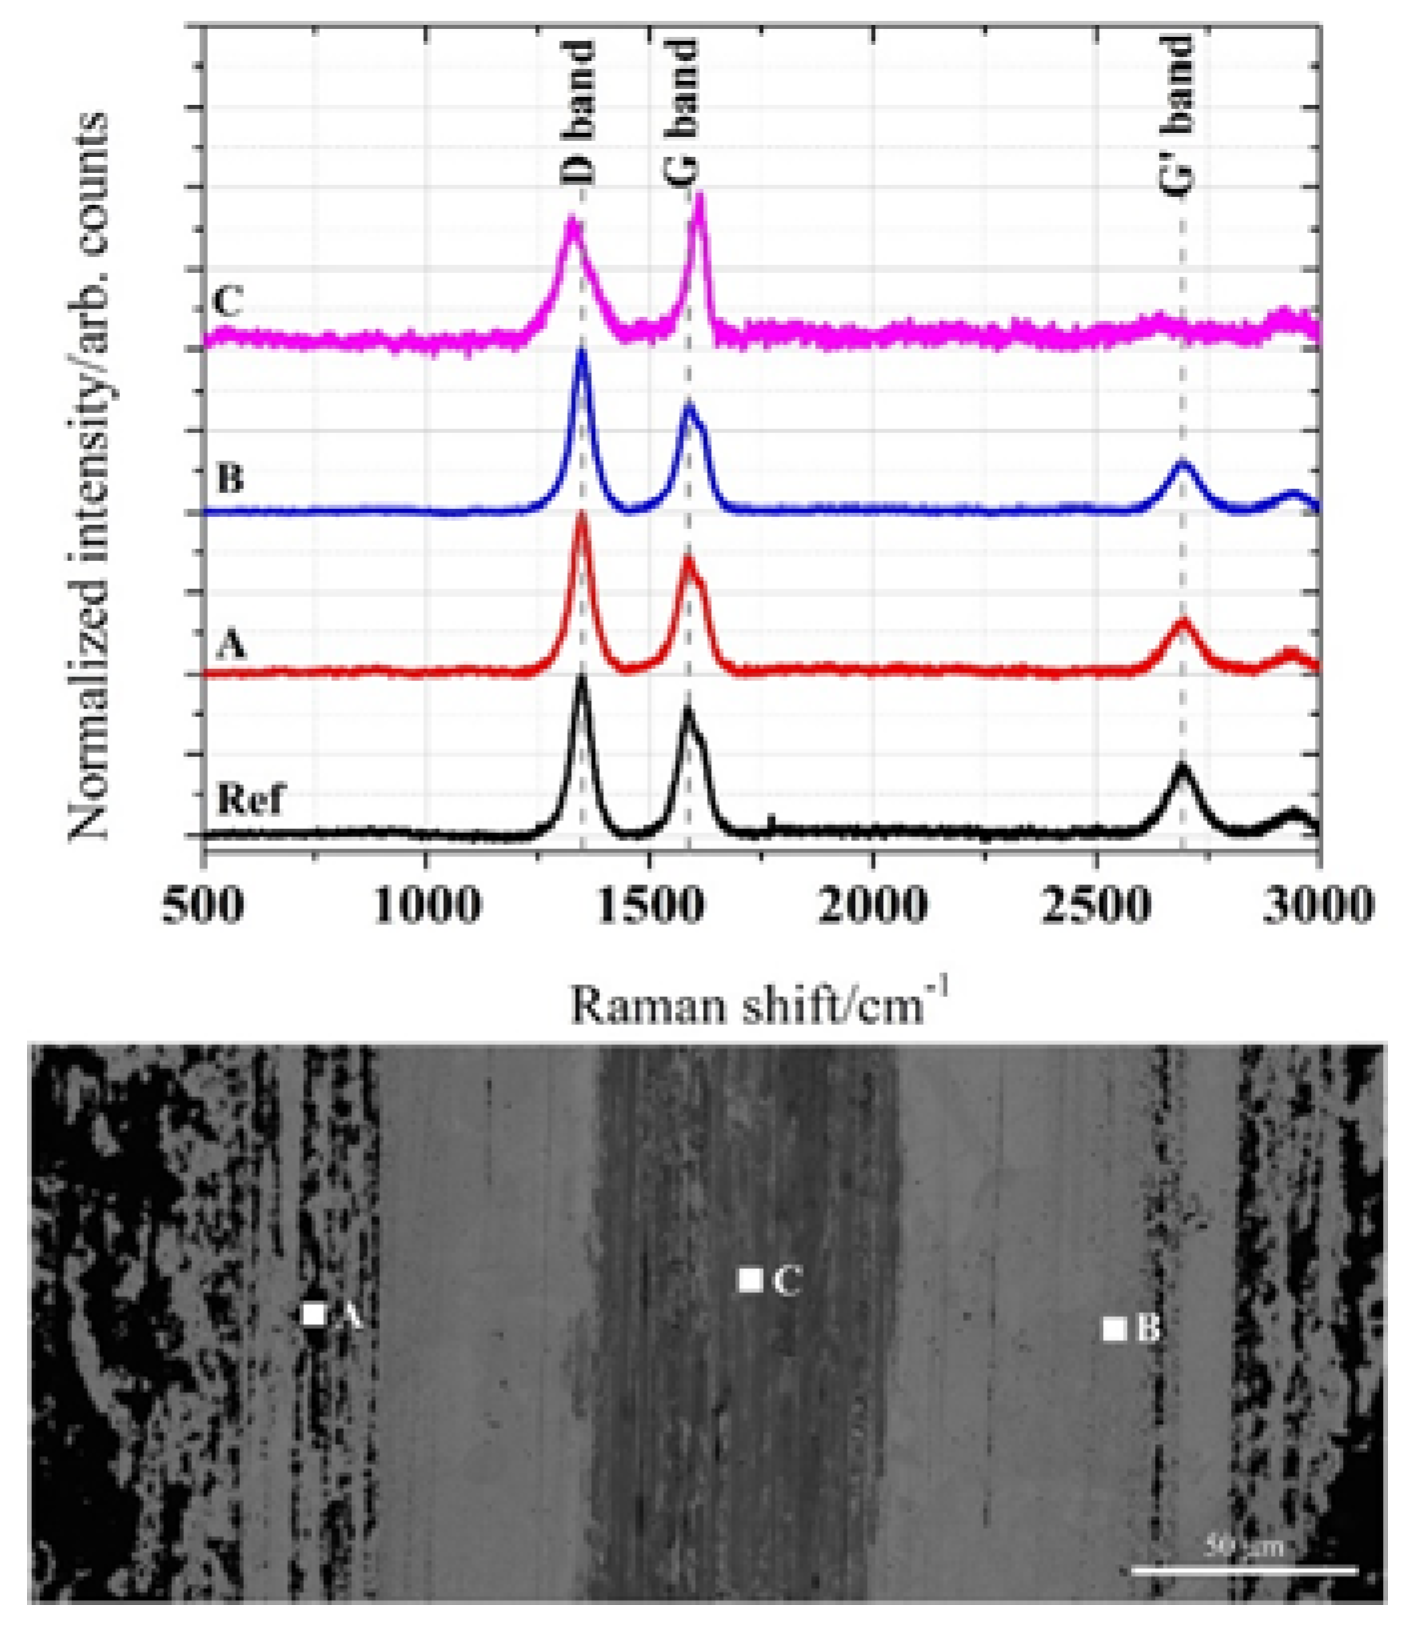
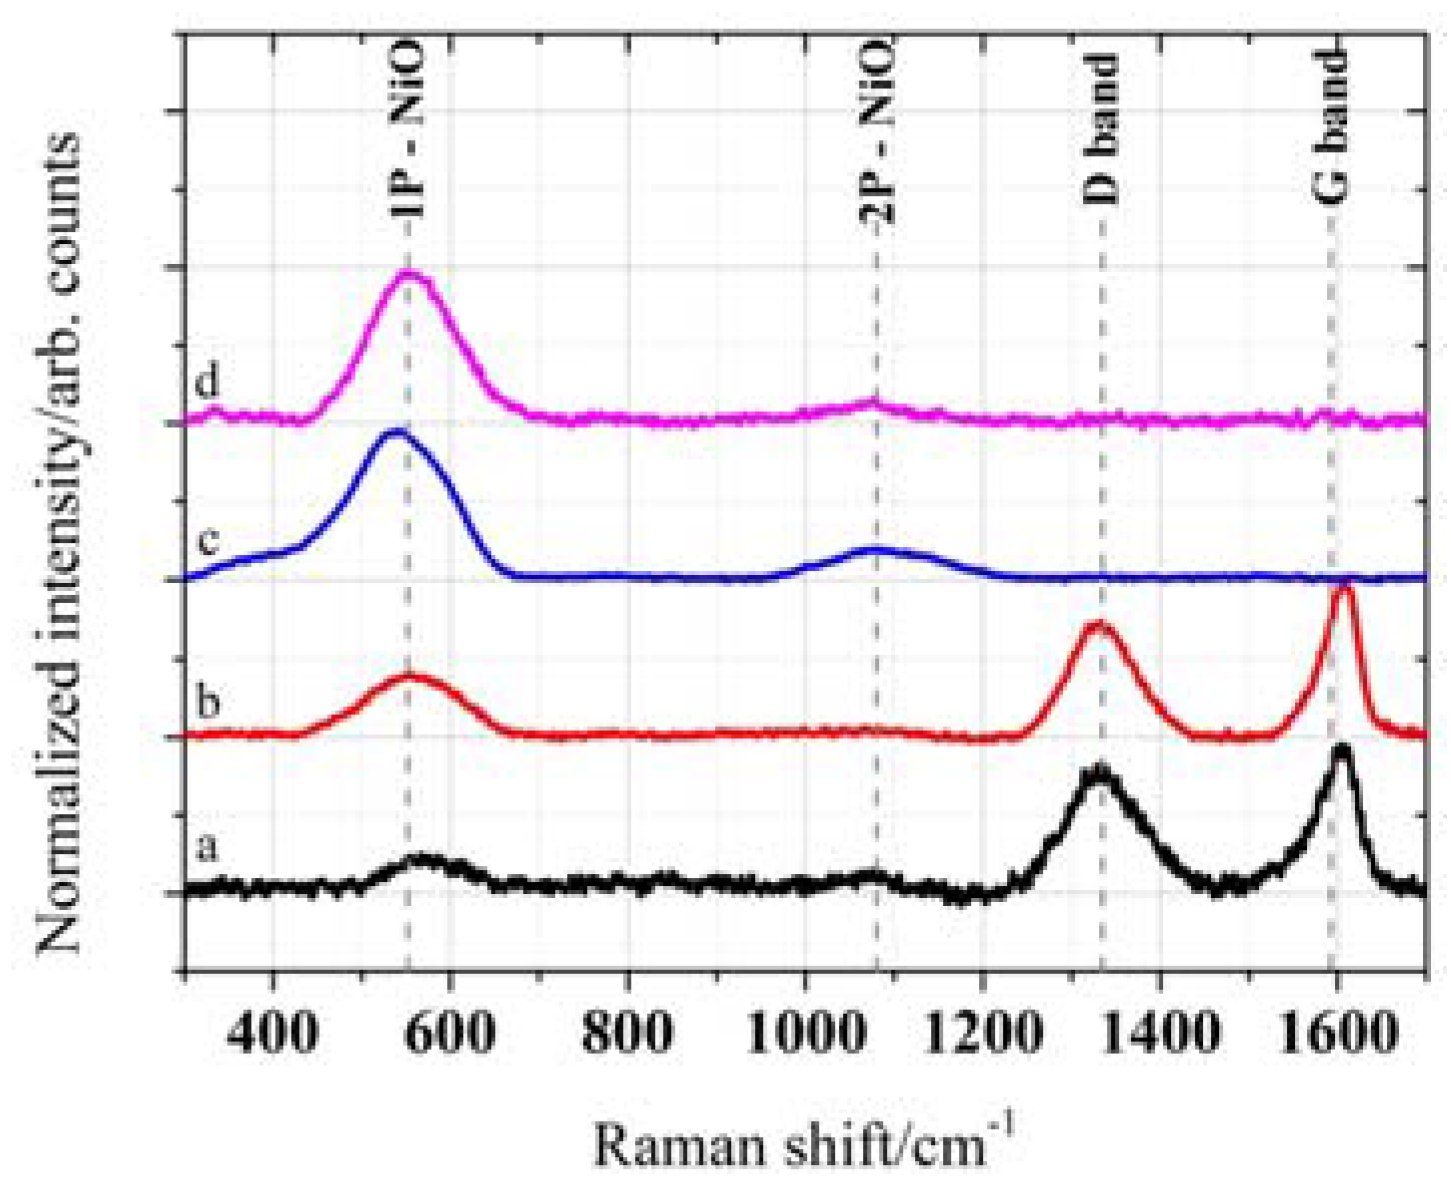
2.3. Structural and Chemical Analysis of the Wear Tracks
3. Experimental Section
3.1. Materials
3.2. Chemical Characterization and Wear Track Analysis
3.3. Tribological Experiments
4. Conclusions
Acknowledgments
Author Contributions
Conflicts of Interest
References
- Lu, Y.; Liaw, P.K. The mechanical properties of nanostructured materials. JOM 2001, 53, 31–35. [Google Scholar] [CrossRef]
- Kim, P.; Shi, L.; Majumdar, A.; McEuen, P. Thermal transport measurements of individual multiwalled nanotubes. Phys. Rev. Lett. 2001, 87, 215502. [Google Scholar] [CrossRef] [PubMed]
- Chen, W.X.; Tu, J.P.; Wang, L.Y.; Gan, H.Y.; Xu, Z.D.; Zhang, X.B. Tribological application of carbon nanotubes in a metal-based composite coating and composites. Carbon 2003, 41, 215–222. [Google Scholar] [CrossRef]
- Kim, K.T.; Cha, S.I.; Hong, S.H. Hardness and wear resistance of carbon nanotube reinforced Cu matrix nanocomposites. Mater. Sci. Eng. A 2007, 449–451, 46–50. [Google Scholar] [CrossRef]
- Scharf, T.W.; Neira, A.; Hwang, J.Y.; Tiley, J.; Banerjee, R. Self-lubricating carbon nanotube reinforced nickel matrix composites. J. Appl. Phys. 2009, 106. [Google Scholar] [CrossRef]
- Tan, J.; Yu, T.; Xu, B.; Yao, Q. Microstructure and wear resistance of nickel–carbon nanotube composite coating from brush plating technique. Tribol. Lett. 2006, 21, 107–111. [Google Scholar] [CrossRef]
- Guiderdoni, C.; Estournès, C.; Peigney, A.; Weibel, A.; Turq, V.; Laurent, C. The preparation of double-walled carbon nanotube/Cu composites by spark plasma sintering, and their hardness and friction properties. Carbon 2011, 49, 4535–4543. [Google Scholar] [CrossRef]
- Dorri Moghadam, A.; Omrani, E.; Menezes, P.L.; Rohatgi, P.K. Mechanical and tribological properties of self-lubricating metal matrix nanocomposites reinforced by carbon nanotubes (CNTs) and graphene—A review. Compos. Part B Eng. 2015, 77, 402–420. [Google Scholar] [CrossRef]
- Omrani, E.; Moghadam, A.; Menezes, P.L.; Rohatgi, P.K. New emerging self-lubricating metal matrix composites for tribological applications. Ecotribology 2016, 63–103. [Google Scholar] [CrossRef]
- Hirata, A.; Yoshioka, N. Sliding friction properties of carbon nanotube coatings deposited by microwave plasma chemical vapor deposition. Tribol. Int. 2004, 37, 893–898. [Google Scholar] [CrossRef]
- Hu, J.J.; Jo, S.H.; Ren, Z.F.; Voevodin, A.; Zabinski, J.S. Tribological behavior and graphitization of carbon nanotubes grown on 440C stainless steel. Tribol. Lett. 2005, 19, 119–125. [Google Scholar] [CrossRef]
- Miyoshi, K.; Street, K.W., Jr.; Vander Wal, R.L.; Andrews, R.; Sayir, A. Solid lubrication by multiwalled carbon nanotubes in air and in vacuum. Tribol. Lett. 2005, 19, 191–201. [Google Scholar] [CrossRef]
- Dickrell, P.L.; Pal, S.K.; Bourne, G.R.; Muratore, C.; Voevodin, A.; Ajayan, P.M.; Schadler, L.S.; Sawyer, W.G. Tunable friction behavior of oriented carbon nanotube films. Tribol. Lett. 2006, 24, 85–90. [Google Scholar] [CrossRef] [Green Version]
- Zhang, X.; Luster, B.; Church, A.; Muratore, C.; Voevodin, A.; Kohli, P.; Aouadi, S.; Talapatra, S. Carbon nanotube-MoS2 composites as solid lubricants. ACS Appl. Mater. Interfaces 2009, 1, 735–739. [Google Scholar] [CrossRef] [PubMed]
- Arai, S.; Fujimori, A.; Murai, M.; Endo, M. Excellent solid lubrication of electrodeposited nickel-multiwalled carbon nanotube composite films. Mater. Lett. 2008, 62, 3545–3548. [Google Scholar] [CrossRef]
- Chen, C.S.; Chen, X.H.; Xu, L.S.; Yang, Z.; Li, W.H. Modification of multi-walled carbon nanotubes with fatty acid and their tribological properties as lubricant additive. Carbon 2005, 43, 1660–1666. [Google Scholar] [CrossRef]
- Peng, Y.; Hu, Y.; Wang, H. Tribological behaviors of surfactant-functionalized carbon nanotubes as lubricant additive in water. Tribol. Lett. 2006, 25, 247–253. [Google Scholar] [CrossRef]
- Lu, H.F.; Fei, B.; Xin, J.H.; Wang, R.H.; Li, L.; Guan, W.C. Synthesis and lubricating performance of a carbon nanotube seeded miniemulsion. Carbon 2007, 45, 936–942. [Google Scholar] [CrossRef]
- Kristiansen, K.; Zeng, H.; Wang, P.; Israelachvili, J.N. Microtribology of Aqueous Carbon Nanotube Dispersions. Adv. Funct. Mater. 2011, 21, 4555–4564. [Google Scholar] [CrossRef]
- Coleman, J.N. Liquid-Phase Exfoliation of Nanotubes and Graphene. Adv. Funct. Mater. 2009, 19, 3680–3695. [Google Scholar] [CrossRef]
- Avilés, F.; Cauich-Rodríguez, J.V.; Moo-Tah, L.; May-Pat, A.; Vargas-Coronado, R. Evaluation of mild acid oxidation treatments for MWCNT functionalization. Carbon 2009, 47, 2970–2975. [Google Scholar] [CrossRef]
- Karousis, N.; Tagmatarchis, N.; Tasis, D. Current progress on the chemical modification of carbon nanotubes. Chem. Rev. 2010, 110, 5366–5397. [Google Scholar] [CrossRef] [PubMed]
- Dyke, C.A.; Tour, J.M. Solvent-free functionalization of carbon nanotubes. J. Am. Chem. Soc. 2003, 125, 1156–1157. [Google Scholar] [CrossRef] [PubMed]
- Vaisman, L.; Wagner, H.D.; Marom, G. The role of surfactants in dispersion of carbon nanotubes. Adv. Colloid Interface Sci. 2006, 128–130, 37–46. [Google Scholar] [CrossRef] [PubMed]
- Zhao, Y.-L.; Stoddart, J.F. Noncovalent Functionalization of Single-Walled Carbon Nanotubes. Acc. Chem. Res. 2009, 42, 1161–1171. [Google Scholar] [CrossRef] [PubMed]
- Reinert, L.; Zeiger, M.; Suarez, S.; Presser, V.; Mücklich, F. Dispersion analysis of carbon nanotubes, carbon onions, and nanodiamonds for their application as reinforcement phase in nickel metal matrix composites. RSC Adv. 2015, 5, 95149–95159. [Google Scholar] [CrossRef]
- Cheng, Q.; Debnath, S.; Gregan, E.; Byrne, H.J. Ultrasound-Assisted SWNTs Dispersion: Effects of Sonication Parameters and Solvent Properties. J. Phys. Chem. C 2010, 114, 8821–8827. [Google Scholar] [CrossRef]
- Variava, M.F.; Church, T.L.; Harris, A.T.; Minett, A.I. Polyol-assisted functionalization of carbon nanotubes—A perspective. J. Mater. Chem. A 2013, 1, 8509. [Google Scholar] [CrossRef]
- Suárez, S.; Rosenkranz, A.; Gachot, C.; Mücklich, F. Enhanced tribological properties of MWCNT/Ni bulk composites – Influence of processing on friction and wear behaviour. Carbon 2014, 66, 164–171. [Google Scholar] [CrossRef]
- Chen, X.H.; Chen, C.S.; Xiao, H.N.; Liu, H.B.; Zhou, L.P.; Li, S.L.; Zhang, G. Dry friction and wear characteristics of nickel/carbon nanotube electroless composite deposits. Tribol. Int. 2006, 39, 22–28. [Google Scholar] [CrossRef]
- Dickrell, P.L.; Sinnott, S.B.; Hahn, D.W.; Raravikar, N.R.; Schadler, L.S.; Ajayan, P.M.; Sawyer, W.G. Frictional anisotropy of oriented carbon nanotube surfaces. Tribol. Lett. 2005, 18, 59–62. [Google Scholar] [CrossRef]
- Colonna, F.; Fasolino, A.; Meijer, E.J. Graphitization of single-wall nanotube bundles at extreme conditions: Collapse or coalescence route. Phys. Rev. B 2013, 88, 165416. [Google Scholar] [CrossRef]
- Bakshi, S.R.; Agarwal, A. An analysis of the factors affecting strengthening in carbon nanotube reinforced aluminum composites. Carbon 2011, 49, 533–544. [Google Scholar] [CrossRef]
- Hwang, J.Y.; Neira, A.; Scharf, T.W.; Tiley, J.; Banerjee, R. Laser-deposited carbon nanotube reinforced nickel matrix composites. Scr. Mater. 2008, 59, 487–490. [Google Scholar] [CrossRef]
- Suarez, S.; Soldera, F.; González Oliver, C.; Acevedo, D.; Mücklich, F. Thermomechanical Behavior of Bulk Ni/MWNT Composites Produced via Powder Metallurgy. Adv. Eng. Mater. 2012, 14, 499–502. [Google Scholar] [CrossRef]
- Suarez, S.; Lasserre, F.; Mücklich, F. Mechanical properties of MWNT/Ni bulk composites: Influence of the microstructural refinement on the hardness. Mater. Sci. Eng. A 2013, 587, 381–386. [Google Scholar] [CrossRef]
- Suarez, S.; Lasserre, F.; Prat, O.; Mücklich, F. Processing and interfacial reaction evaluation in MWNT/Ni bulk composites. Phys. Status Solidi 2014, 211, 1555–1561. [Google Scholar] [CrossRef]
- Blau, P.J. On the nature of running-in. Tribol. Int. 2005, 38, 1007–1012. [Google Scholar] [CrossRef]
- Shafiei, M.; Alpas, A.T. Friction and Wear Mechanisms of Nanocrystalline Nickel in Ambient and Inert Atmospheres. Metall. Mater. Trans. A 2007, 38, 1621–1631. [Google Scholar] [CrossRef]
- Lehman, J.H.; Terrones, M.; Mansfield, E.; Hurst, K.E.; Meunier, V. Evaluating the characteristics of multiwall carbon nanotubes. Carbon 2011, 49, 2581–2602. [Google Scholar] [CrossRef]
- Jorio, A.; Dresselhaus, M.; Dresselhaus, G. Carbon Nanotubes: Advanced Topics in the Synthesis, Structure, Properties and Applications; Springer-Verlag: Heidelberg, Germany, 2008; p. 720. [Google Scholar]
- Tuinstra, F.; Koenig, J.L. Raman Spectrum of Graphite. J. Chem. Phys. 1970, 53, 1126–1130. [Google Scholar] [CrossRef]
- Pimenta, M.A.; Dresselhaus, G.; Dresselhaus, M.S.; Cançado, L.G.; Jorio, A.; Saito, R. Studying disorder in graphite-based systems by Raman spectroscopy. Phys. Chem. Chem. Phys. 2007, 9, 1276–1291. [Google Scholar] [CrossRef] [PubMed]
- Creighton, J.A.; Withnall, R. The Raman spectrum of gallium metal. Chem. Phys. Lett. 2000, 326, 311–313. [Google Scholar] [CrossRef]
- DiLeo, R.A.; Landi, B.J.; Raffaelle, R.P. Purity assessment of multiwalled carbon nanotubes by Raman spectroscopy. J. Appl. Phys. 2007, 101, 064307. [Google Scholar] [CrossRef]
- Mironova-Ulmane, N.; Kuzmin, A.; Steins, I.; Grabis, J.; Sildos, I.; Pärs, M. Raman scattering in nanosized nickel oxide NiO. J. Phys. Conf. Ser. 2007, 93, 012039. [Google Scholar] [CrossRef]
- Mironova-Ulmane, N.; Kuzmin, A.; Grabis, J.; Sildos, J.; Voronin, V.I.; Berger, I.F.; Kazantsev, V.A. Structural and Magnetic Properties of Nickel Oxide Nanopowders. Solid State Phenom. 2011, 168–169, 331–334. [Google Scholar] [CrossRef]


| Position | ID/IG | IG′/ID | XCG (cm−1) | ΓG (cm−1) | La (nm) |
|---|---|---|---|---|---|
| Reference | 1.247 | 0.435 | 1593.0 | 73.9 | 15.4 |
| A | 1.360 | 0.319 | 1593.9 | 62.3 | 14.1 |
| B | 1.461 | 0.314 | 1594.4 | 79.1 | 13.2 |
| C | 1.511 | 0.313 | 1593.1 | 75.9 | 12.7 |
| D | 1.591 | 0.251 | 1594.8 | 75.6 | 12.1 |
| E | --- | --- | --- | --- | --- |
| Position | ID/IG | IG’/ID | XCG (cm−1) | ΓG (cm−1) | La (nm) |
|---|---|---|---|---|---|
| Reference | 1.247 | 0.435 | 1593.0 | 73.9 | 15.4 |
| A | 1.373 | 0.303 | 1592.3 | 80.2 | 14.0 |
| B | 1.493 | 0.294 | 1594.2 | 93.8 | 12.9 |
| C | --- | --- | 1607.1 | --- | --- |
| Position | ID/IG | IG′/ID | XCG (cm−1) | ΓG (cm−1) | La (nm) |
|---|---|---|---|---|---|
| Reference | 1.247 | 0.435 | 1593.0 | 73.9 | 15.4 |
| 500 | 1.436 | 0.336 | 1594.1 | 73.8 | 13.4 |
| 20,000 | 1.521 | 0.387 | 1594.9 | 84.5 | 12.6 |
© 2016 by the authors; licensee MDPI, Basel, Switzerland. This article is an open access article distributed under the terms and conditions of the Creative Commons Attribution (CC-BY) license (http://creativecommons.org/licenses/by/4.0/).
Share and Cite
Reinert, L.; Suárez, S.; Rosenkranz, A. Tribo-Mechanisms of Carbon Nanotubes: Friction and Wear Behavior of CNT-Reinforced Nickel Matrix Composites and CNT-Coated Bulk Nickel. Lubricants 2016, 4, 11. https://doi.org/10.3390/lubricants4020011
Reinert L, Suárez S, Rosenkranz A. Tribo-Mechanisms of Carbon Nanotubes: Friction and Wear Behavior of CNT-Reinforced Nickel Matrix Composites and CNT-Coated Bulk Nickel. Lubricants. 2016; 4(2):11. https://doi.org/10.3390/lubricants4020011
Chicago/Turabian StyleReinert, Leander, Sebastian Suárez, and Andreas Rosenkranz. 2016. "Tribo-Mechanisms of Carbon Nanotubes: Friction and Wear Behavior of CNT-Reinforced Nickel Matrix Composites and CNT-Coated Bulk Nickel" Lubricants 4, no. 2: 11. https://doi.org/10.3390/lubricants4020011
APA StyleReinert, L., Suárez, S., & Rosenkranz, A. (2016). Tribo-Mechanisms of Carbon Nanotubes: Friction and Wear Behavior of CNT-Reinforced Nickel Matrix Composites and CNT-Coated Bulk Nickel. Lubricants, 4(2), 11. https://doi.org/10.3390/lubricants4020011