Article

Comparative Performance of Ni- and Fe-Based Mixed Alloy Brazed Coatings via Laser Remelting


1
Department of Materials and Manufacturing Engineering, Faculty of Mechanical Engineering, Politehnica University Timişoara, Bv. Mihai Viteazu 1, 300222 Timisoara, Romania
2
Institute of Mechanical Engineering, Westphalian University of Applied Sciences, Neidenburger Str. 43, 45897 Gelsenkirchen, Germany
3
Chair of Materials Science and Additive Manufacturing, School of Mechanical Engineering and Safety Engineering, University of Wuppertal, Gaußstraße 20, 42119 Wuppertal, Germany
*
Authors to whom correspondence should be addressed.
Lubricants 2026, 14(4), 142; https://doi.org/10.3390/lubricants14040142
Submission received: 19 February 2026 / Revised: 25 March 2026 / Accepted: 27 March 2026 / Published: 29 March 2026

Abstract

Traditionally, repairing coated substrates requires completely removing damaged, wear-resistant layers before recoating. This process leads to high costs, extended downtime, and material waste. Flexible brazing tapes, which are composed of alloy powder and an organic binder, offer an alternative to full coating removal for targeted repairs. Despite this, the process of vacuum brazing these tapes may lead to the formation of defects, including pores caused by trapped gases or residual binder, which compromise coating durability and corrosion resistance. This study focuses on the utilization of laser remelting as a method for post-processing nickel- and iron-based mixed alloy brazing tapes, with the aim of improving the integrity of the coating. Surface quality was assessed via microscopy and microhardness testing by systematically varying laser power, scanning speed, and hatch distance. Among the parameters studied, the most suitable laser parameter combination was found to be 350 W laser power, 250 mm/s scanning speed, and a hatch distance of 0.02 mm. These parameters yielded crack- and pore-free coatings with a remelting depth of 160.3 ± 17.2 µm and a microhardness of 701 ± 23 HV1, which is an 85% increase over as-brazed samples. Wear testing revealed a reduced coefficient of friction, and electrochemical corrosion tests showed lower corrosion current density and enhanced repassivation behavior in remelted coatings. These improvements demonstrate that laser remelting significantly enhances the microstructure, hardness, wear resistance, and corrosion performance of brazed coatings, providing an effective method for localized repair while minimizing material consumption and processing duration.

1. Introduction

Wear and corrosion result in substantial annual costs worldwide [1,2], affecting industries through expensive maintenance and repairs, as well as operational downtime. An effective way to mitigate these issues is to apply protective coatings. Among various materials, NiCrBSi is widely used due to its excellent wear resistance, corrosion protection, and strong adhesion properties [3,4]. Beyond the economic burden, nowadays, conserving raw materials is more important than ever, especially critical and strategic raw materials, such as nickel [5,6].
Functionally graded material (FGM) coatings are a promising strategy for improving resource efficiency and performance. These advanced composite coatings exhibit continuous variation in composition and microstructure throughout their thickness [7,8,9]. FGMs are engineered to gradually transition between different materials, leveraging the advantageous properties of each constituent while mitigating their respective limitations. A wide range of material combinations is possible, which can be tailored to specific application requirements. For example, an FGM could have a corrosion-resistant stainless-steel base that gradually changes into a hard, wear-resistant NiCrBSi surface layer. Nevertheless, the lifespan of coated components remains limited, necessitating periodic repair and maintenance to restore functionality. Complete removal and reapplication of coatings is costly and time-consuming. Targeted repair of damaged sections has become a practical and efficient strategy for the reutilization of components. Conventional repair technologies include surface welding, spraying, or electroplating; however, these often result in repaired layers with limited wear resistance and a short lifespan [10]. Some techniques, such as electric arc spraying, require two conductive wires [11], limiting their applicability to alloys available in wire shape. Powder-based feedstocks are widely used but pose significant health, environmental, and safety concerns [12,13]. Airborne powders can create hazards, including fire and explosion risks, as well as eye and skin irritation, allergic reactions, and respiratory issues upon inhalation [12,13,14].
While coatings are typically produced in controlled environments equipped with safety measures, such as fume extraction systems, repair work is frequently conducted on-site, where such controls may be limited or impossible to realize. This discrepancy increases the risk of powder exposure during repair operations. To address this challenge, the incorporation of alloy powders into brazing tape bound by organic binders effectively retains the powder, thereby reducing its release into the environment. This approach notably diminishes airborne powder hazards, thereby enhancing worker safety without compromising coating quality.
Brazing is a joining technique commonly used for joining dissimilar materials [15,16]. A comprehensive overview of brazing and recent advances is provided in the work of Byungmin Ahn [17]. Vacuum brazing employs uniform, thermal radiation heating in a vacuum, thereby facilitating efficient energy utilization, reducing contamination, and enhancing joint quality [17,18]. Zheng et al. [19] used vacuum discharge plasma brazing to create WC-Ni wear-resistant coatings for soil-engaging components. By incorporating wear-resistant WC particles into Ni-based brazing alloy, the coating’s durability and wear performance is enhanced, while a strong metallurgical bond to the substrate is ensured.
To improve vacuum brazing and further enhance wear resistance, it is possible to achieve additional improvements in coating quality and performance through the implementation of post-processing techniques. Remelting is a thermal post-treatment that has been shown to improve coating density, bonding to the substrate and mechanical properties. Common methods include furnace, flame, plasma torch, and laser remelting [20]. The utilization of furnace, flame and plasma torch remelting is widespread due to the relatively low costs associated with these methods. Nevertheless, precise parameter control remains challenging, resulting in unfavorable thermal effects (areas that are underheated or overheated) [21]. Laser technology instead offers a number of advantages, including reduced thermal distortion, minimal dilution, a dense and refined microstructure, and enhanced functional properties [10,21]. Soffel et al. [22] investigated the laser remelting process using numerical simulation and experimental analysis. The sample with remelting exhibited a more uniform adhesion to the substrate, and the remelting process aims to enhance quality by minimizing defects in metal additive manufacturing and repair. Comparing as-cladded with subsequently laser-remelted surfaces, Zhao et al. [23] found an improved surface quality and reduced defects in their laser-remelted samples. To evaluate the influence of laser remelting on the microstructure and tensile properties of Ni3Al, Wu et al. [24] conducted a remelting parameter study. They observed microstructural changes, including a refinement of the microstructure, which resulted in an enhancement of the sample’s tensile properties.
Our research investigates laser remelting of brazing tapes as an alternative repair method for FGM coatings. To the best of our knowledge, this has not been previously investigated. By binding alloy powders within an organic binder, brazing tapes significantly reduce powder release during on-site repairs, where conventional safety infrastructure is often limited or unavailable. This provides a safer working environment while maintaining the functional integrity of the repaired coatings. In this study, we investigated brazing tapes composed of 80 wt.% NiCrBSi and 20 wt.% 316L stainless-steel mixture to conserve nickel and facilitate integration with FGMs comprising these alloys. This Ni-Fe composition is designed to leverage the corrosion resistance and wear properties of both materials for repair applications in harsh environments (maritime environment). Our objective is to evaluate the feasibility of using these brazing tapes for localized repair, focusing on their performance under relevant corrosive and tribological conditions. In pursuit of this objective, we conducted a comparison between as-brazed and laser-remelted coatings to assess the effectiveness of laser post-treatment in improving coating density, microstructure, hardness, wear resistance, and corrosion behavior. The brazing tapes were manufactured following established protocols, and the most suitable laser remelting parameters were determined through a systematic parametric study.

2. Materials and Methods

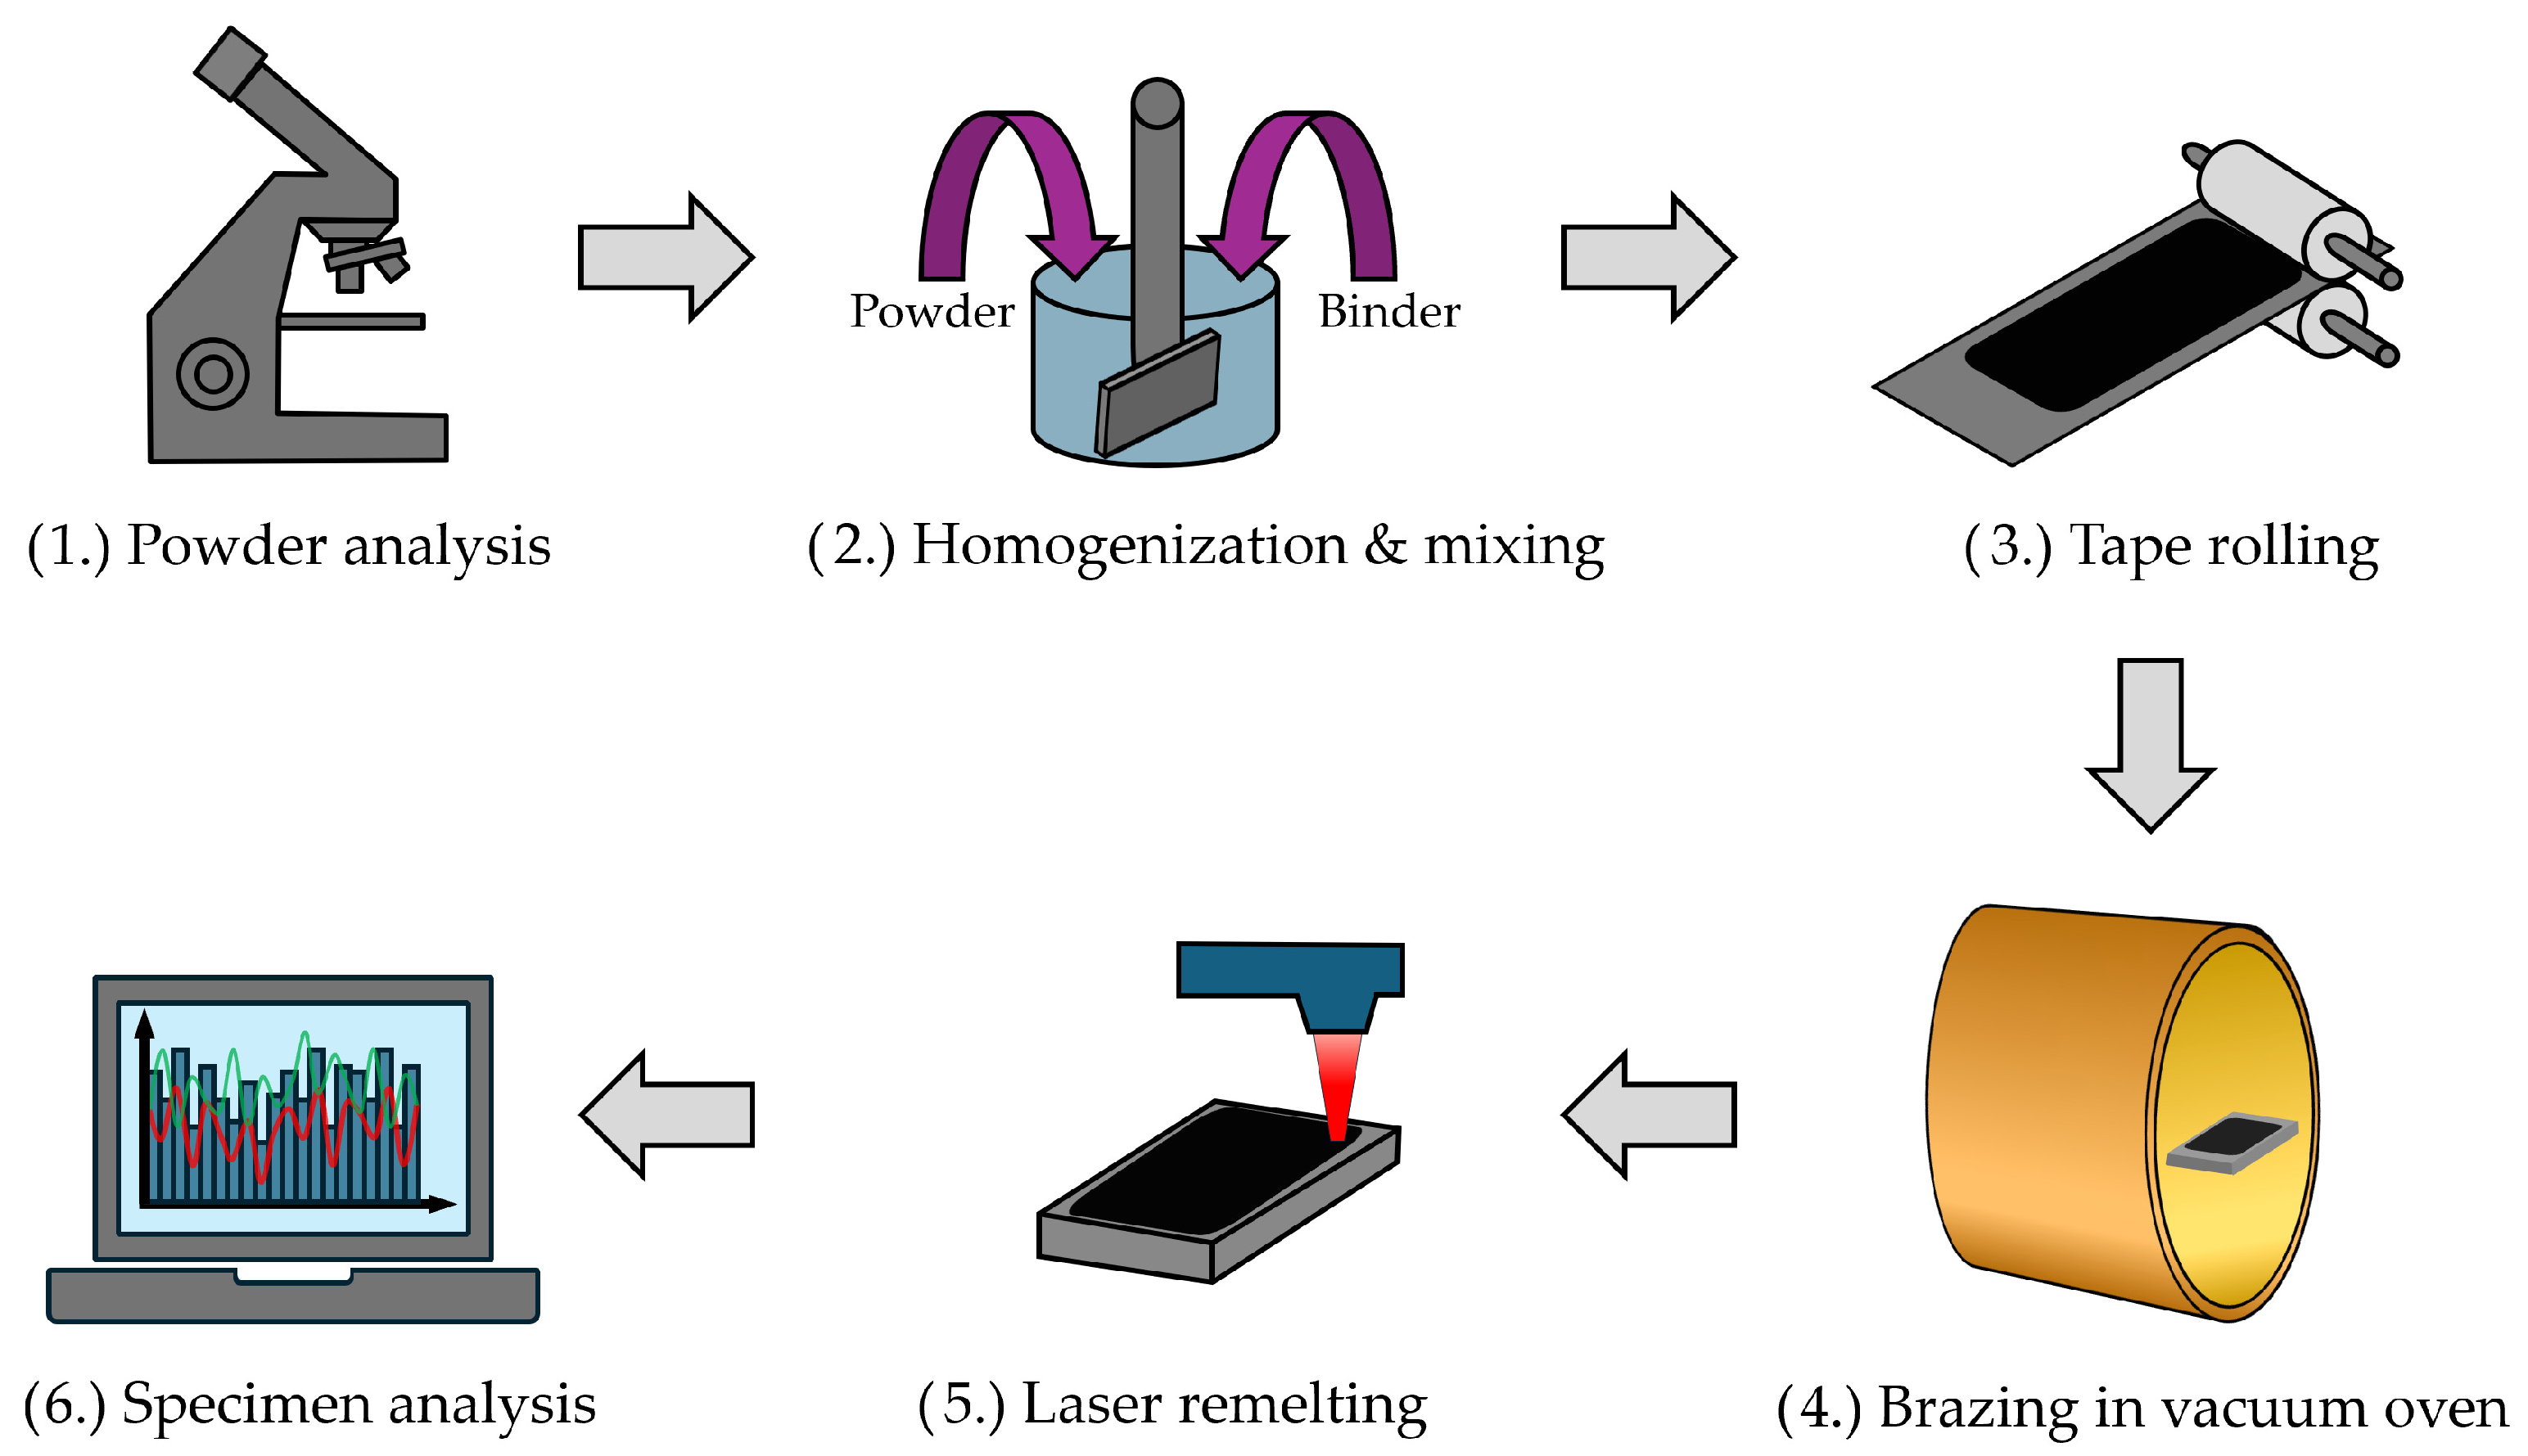
The tapes were manufactured according to the procedure described by Dragoș Toader Pascal [25], with the individual steps shown in Figure 1. The process includes: powder analysis, mixing powder and binder, tape rolling, brazing the tapes in a vacuum oven, laser remelting, and specimen analysis.
The brazing tapes consist of two commonly used powders: a NiCrBSi powder, N-481-HV2 (LSN Diffusion Limited, Llandybie, UK), which has a particle size range of 20–53 µm, and a stainless-steel powder, for AM 316L 15–45 VG (Höganäs AB, Höganäs, Sweden), with a particle size range of 15–45 µm. The mixing ratio is 80 wt.% NiCrBSi to 20 wt.% stainless-steel powder. The chemical composition of the powders is displayed in Table 1.
Powder quality and particle shape were evaluated in top views and cross-sections using a Zeiss Gemini Sigma 300 VP scanning electron microscope (SEM; Carl Zeiss AG, Oberkochen, Germany).
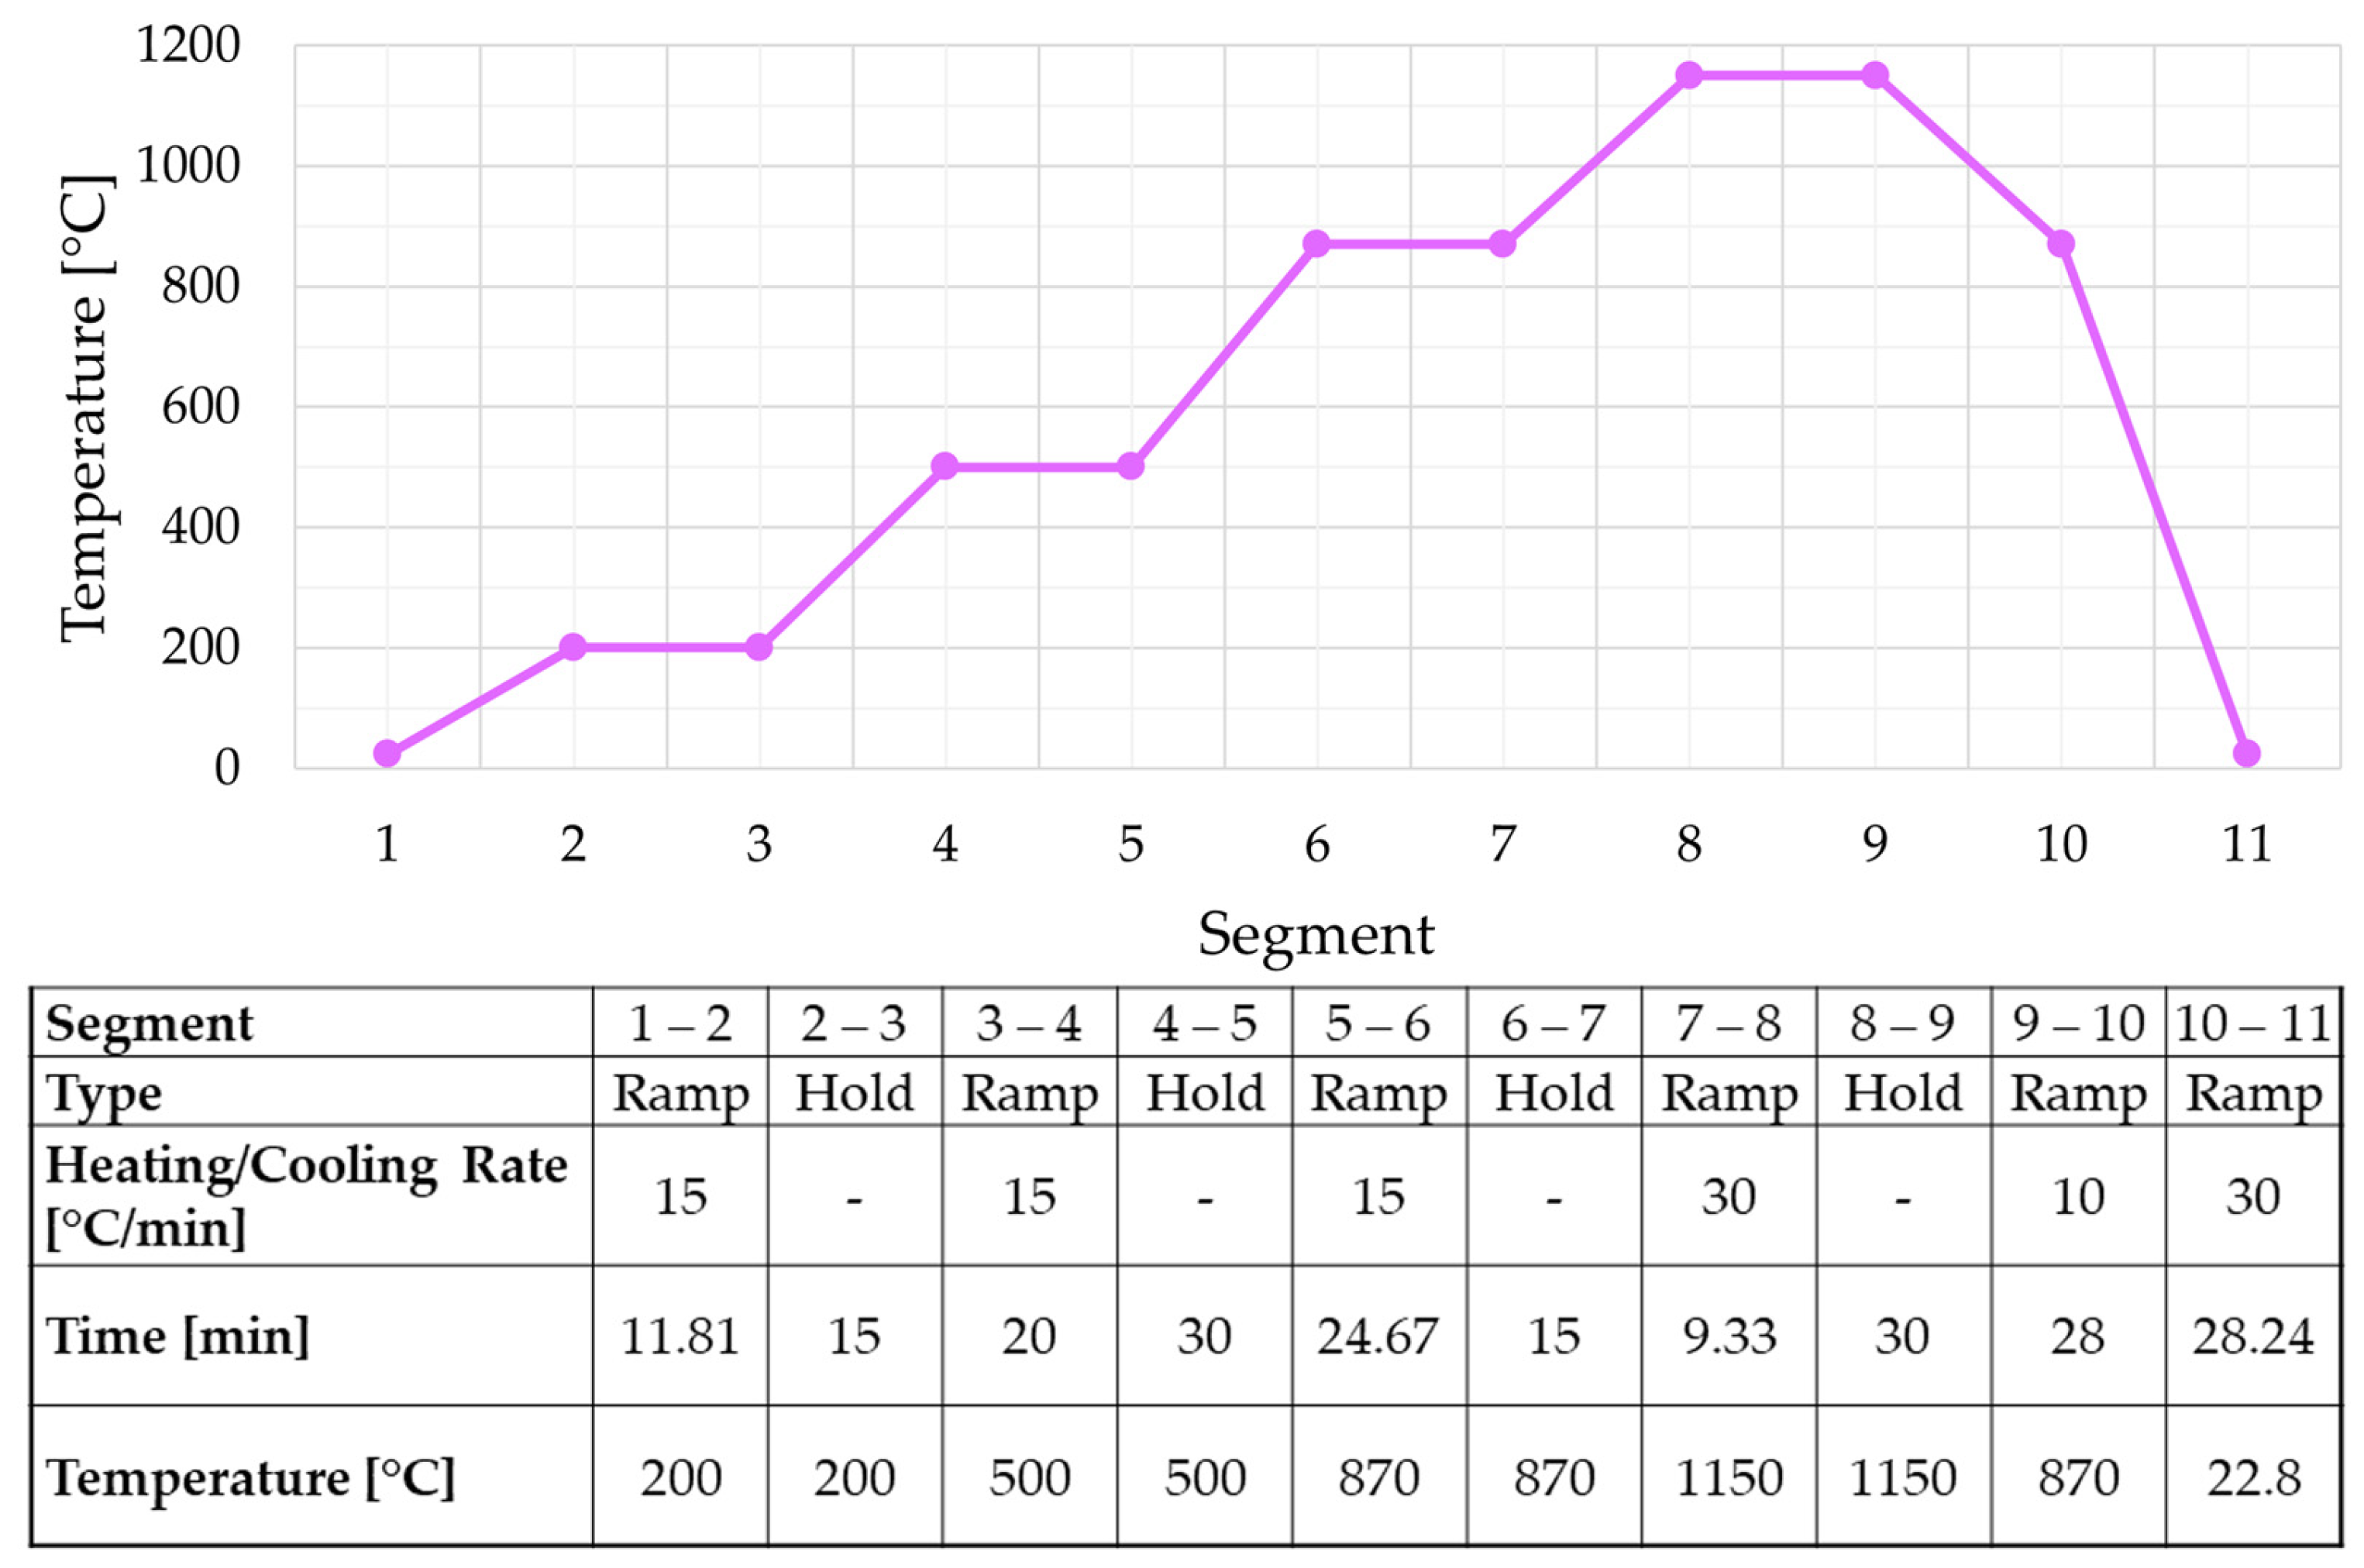
Both powders were mechanically mixed to achieve a homogeneous blend. An organic binder, Aleene’s Tack-It Over & Over (Paisley Crafts LLC, Fresno, CA, USA), was added to the homogenous mixture to enable the tape production (powder–binder ratio: 19:1). First, the powder–binder mixture was shaped into a ball and rolled to a thickness of 1.5 mm using the DRM F150 RE sheet rolling mill (Durston Tools, Fountain Hills, AZ, USA). Then, sections were cut from the rolled tape and applied to a 30 × 30 × 5 mm 1.4571 substrate. Following this, the samples were brazed in a vacuum oven HITHERM 80-200 (HITEC Materials Dr. Ing. Keschtkar GmbH & Co. KG, Karlsruhe, Germany), according to the temperature curve and segments shown in Figure 2.
After a stable vacuum of approximately 3.0 × 10⁻⁴ mbar was achieved, the furnace heated up from room temperature to 200 °C with 15 °C/min (segment 1 to 2). In segments 2 to 3, the temperature was maintained for 15 min to ensure that the water and other volatile solvents in the organic binder could evaporate. In the next step (segments 3 to 4), the temperature increased from 200 °C to 500 °C at a rate of 15 °C/min. This temperature was maintained for 30 min to enable binder evaporation (segment 4 to 5). Within the next segment (5 to 6), the temperature increased from 500 °C to 870 °C at a rate of 15 °C/min. This temperature is just below the solidus temperature of the NiCrBSi powder and was held for 15 min (segment 6 to 7) to achieve temperature homogeneity. For the ramp to the brazing temperature, at 1150 °C (segment 7 to 8), a rate of 30 °C/min was selected to avoid distortion or influence on metallurgical properties. The brazing temperature was held for 30 min. In the first cooling step, a cooling rate of 10 °C/min was selected to prevent residual stresses resulting from high temperature gradients (segment 9 to 10). In the subsequent cooling process, starting below the solidus temperature and up to room temperature, a cooling rate of 30 °C/min was used.
Despite precautions and the vacuum atmosphere, pores can arise from trapped gases or binder residues. Since these pores impair the integrity of the tape (e.g., corrosion occurs preferentially at such defects), the samples were laser-remelted. For remelting, the Powder Bed Fusion-Laser (PBF-L) system Aconity mini 3D (Aconity3D GmbH, Herzogenrath, Germany) was used. Any residual powder from previous experiments was completely removed from the PBF-L system, and the powder slider was deactivated. The build platform was lowered to enable laser focus on top of the brazing tapes. The remelting parameters are displayed in Table 2.
The PBF-L system has an Ytterbium fiber as a laser source. Process-related gases are extracted in the opposite direction to the scan direction to reduce pore formation. Previous research [5] indicates the advantage of bidirectional strategies over monodirectional ones. Therefore, bidirectional scanning was used. The parameter study was conducted using 1 cm2 remelted areas; for comparison with the as-brazed coatings, areas of 9 cm2 were remelted.
Given that no prior studies have been conducted on brazing tapes utilizing laser remelting, there are no established classification methods or evaluation standards. Thus, the evaluation of the studied parameters was conducted in relation to the quality of the coating obtained and general expectations for an ideal coating: absence of defects (such as cracks and pores), and a smooth surface to reduce surface finish efforts. Accordingly, the remelted samples were grouped in the following three-level scheme. A microscopic top-view analysis using a confocal scanning laser microscope (CLSM), Keyence VK-X200 with a Keyence VK-X250 control unit (Keyence Corporation, Osaka, Japan), was used to identify samples that were deemed unsuitable for further cross-sectional analysis. The whole remelted area was evaluated (see Section 3 for representative CLSM images):
  • Good: The sample shows no defects in top view. These parameters were further investigated in cross-section.
  • Medium: The sample exhibits minor defects, which need to be further investigated. These parameters were further investigated in cross-section, but their defects, such as the propagation depth of cracks, need to be evaluated.
  • Bad: The sample exhibits a significant number of defects on the surface and is not suitable for further examination.
To minimize personal influence, each evaluation parameter (cracks, macropores, micropores, and surface topography) was independently considered based on the scoring model method. The following ratings were assigned based on the evaluation criteria, which included the number and size of micro-/macropores (pores with a diameter exceeding 50 µm were classified as macropores), the number and size of cracks, surface evenness, and height difference:
  • A score of 2 (None in the evaluation table) is assigned when no imperfections in the designated category are discernible, as it represents the desired quality. However, it should be noted that this evaluation was not used for the surface evaluation, since the surface will be finished subsequently.
  • A score of 1 (Low or Good in the evaluation table) is assigned for a small number of defects. Within the entire remelting area, this means that the following numbers/values for the individual parameters must be met: a maximum of 15 micropores with a diameter less than 50 µm; the absence of macropores; the absence of cracks; a uniform surface with a maximum total height variation of 50 µm.
  • A score of 0.5 (Medium in the evaluation table) is assigned for a moderate number of defects. Within the entire remelting area, this means that the following numbers/values for the individual parameters must be met: 15 to 30 micropores with a diameter less than 50 µm; less than 5 macropores; less than 5 cracks; a slightly uneven but generally uniform surface, with a total height variation of 50 to 80 µm.
  • A score of 0 (High or Bad in the evaluation table) is given for a high number of defects. Within the entire remelting area, this means that the following values for the individual parameters were exceeded: more than 30 micropores with a diameter less than 50 µm; more than 5 macropores; more than 5 cracks; an uneven surface with a total height variation exceeding 80 µm.
The total score of each sample was calculated by summing the scores across all categories. Based on these total scores, the top five samples exhibiting the highest scores were further evaluated in cross-sectional analysis.
These remaining specimens were metallographically prepared in cross-sections (320-500-1000-2000-4000 grit SiC-paper; 3 µm diamond suspension) and evaluated using CLSM. In cross-sections, the propagation depth of any present cracks was checked; if they only appear superficial, they will most likely be removed during surface finish. Additionally, using ImageJ (version 1.53k; developed by Wayne Rasband at the National Institutes of Health in Bethesda, MD, USA), the CLSM cross-sections were further analyzed. Within a rectangular area measuring 1000 × 600 pixels (approx. 1350 × 825 µm), the CLSM images were converted into binary. The Threshold function distinguishes between different grayscales. As cracks and pores appear darker than the metallic matrix due to their depression, the percentage amount can be estimated. As the grayscale is about the same for porosity and cracks, a separation is not possible.
Subsequently, the microhardness evolution was determined on the remelted samples in cross-sections using the microhardness tester ZHVµ (ZwickRoell GmbH & Co. KG, Ulm, Germany). Using a test load of 9.807 N (Vickers hardness load level: HV1), the indenter was applied to the specimens for 10 s, with five measurements taken in each region. Comparing microhardness evaluation in cross-section enables the final identification of the best remelting parameters.
Following this comprehensive evaluation, the laser remelting parameter configuration that achieved the highest overall coating quality and mechanical performance was identified. This parameter set is considered the best parameter within the scope of this research and was applied to remelt larger sample areas of 9 cm2 for comparative analysis in relation to as-brazed coatings.
The sliding wear behavior and the coefficient of friction (COF) were investigated using the pin-on-disc (POD) method of the TRB3 tribometer (Anton Paar Germany GmbH, Ostfildern, Germany). The specimen’s surface was metallographically prepared (Ra 1.6) and subsequently degreased to achieve the same starting conditions. The test parameters are displayed in Table 3. Measurements were conducted on three remelted samples and three as-brazed samples to ensure reliable results.
Phase identification of coatings was performed using X-ray diffraction (XRD) on a MiniFlex 600 (Rigaku Corporation, Tokyo, Japan). The measurements were conducted in the 2Θ range of 20° to 100° with a scan rate of 5°/min.
The polarization curves for the corrosion tests were recorded using the CEC/TH three-electrode cell setup (Radiometer Analytic SAS, Villeurbanne, France). For data acquisition and control, the VoltaMaster 4 software (Radiometer Analytical SAS, Villeurbanne, France) was used. The remelted, as-brazed sample served as the working electrode (exposed area: 1 cm2). A platinum electrode served as the counter electrode, while a saturated calomel electrode was utilized as the reference electrode. NiCrBSi coatings are commonly used in seawater environments. To simulate seawater conditions, a 3.5% NaCl solution served as the electrolyte. The potentiodynamic measurements were carried out at room temperature (22.8 °C), with a scan rate of 16 mV/min within a potential range of −800 up to +600 mV (three times for each set of samples).

3. Results and Discussion

3.1. Parameter Study

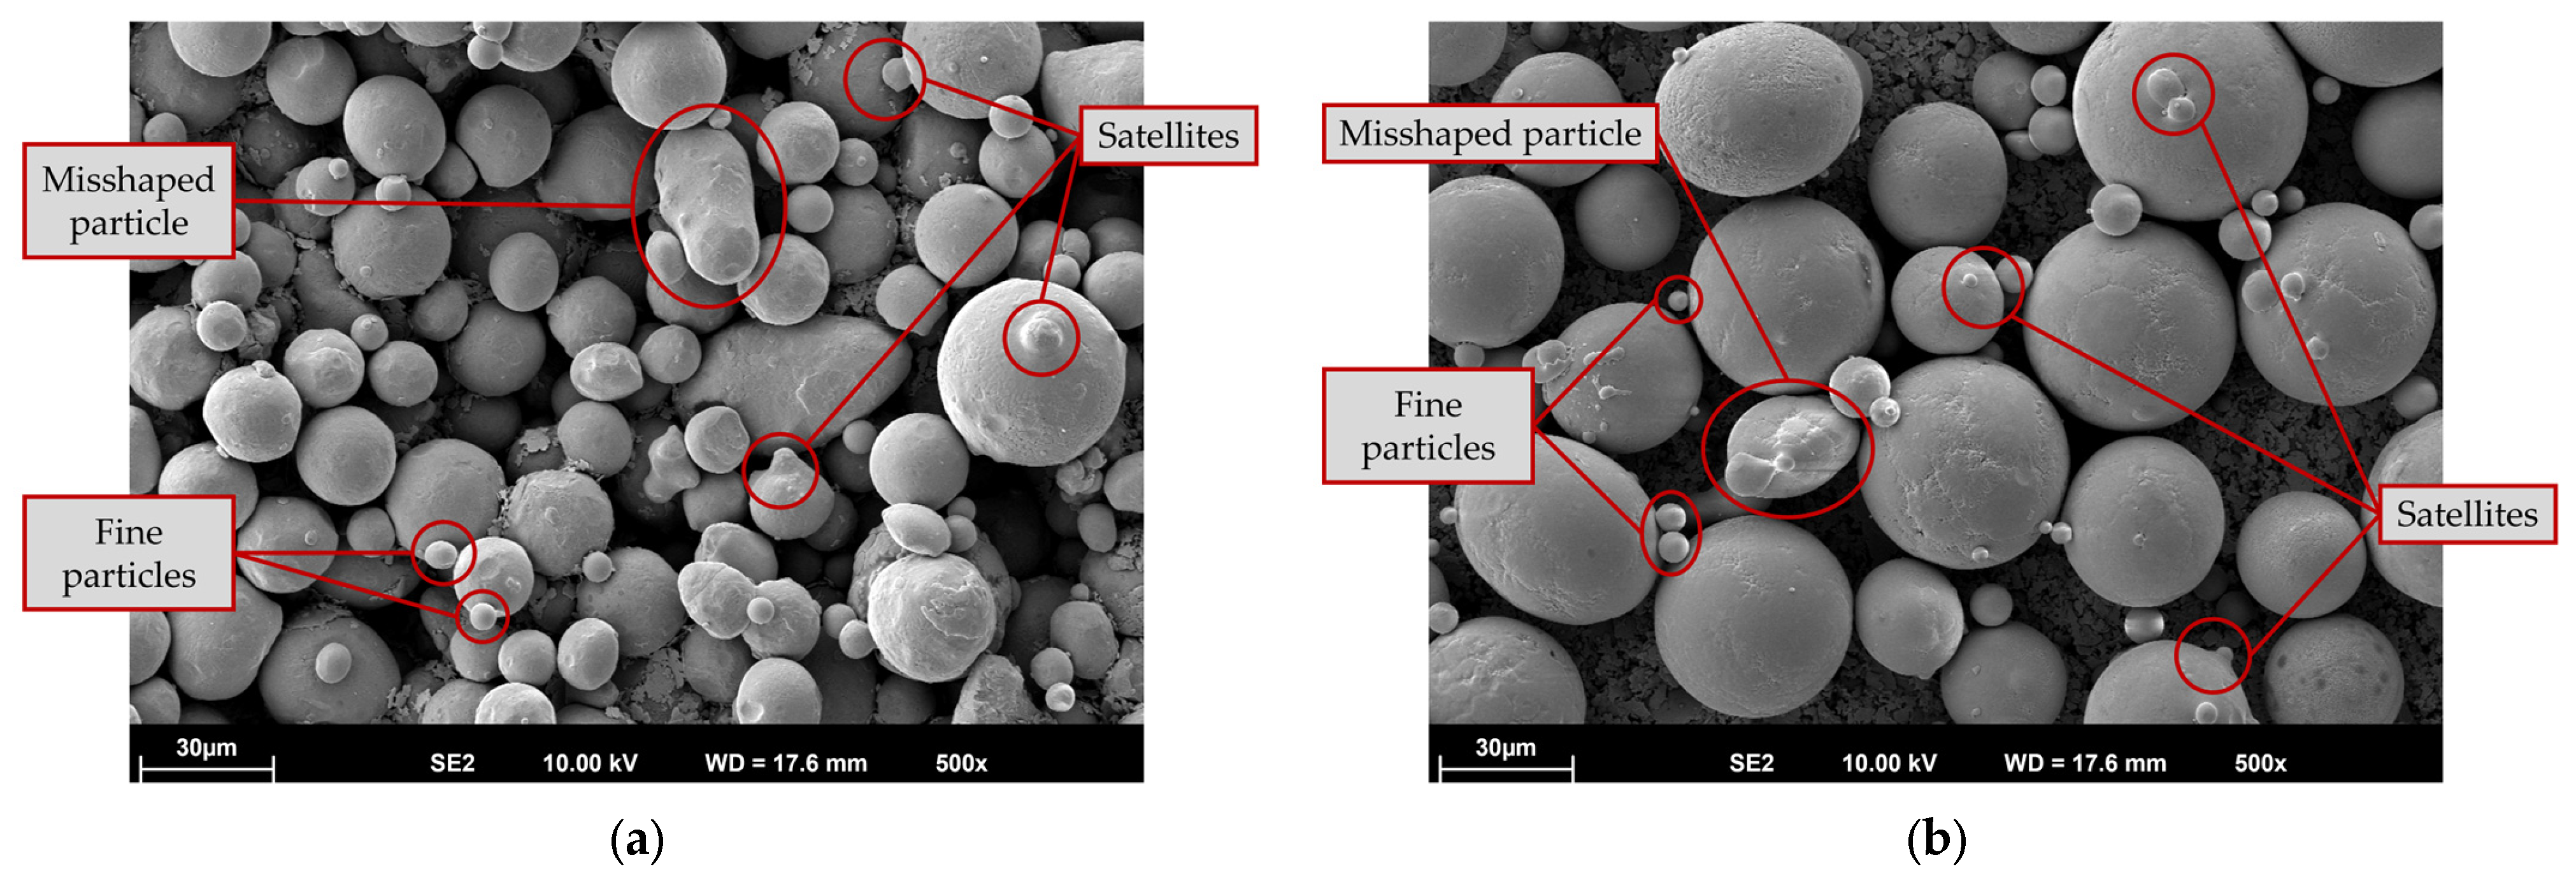
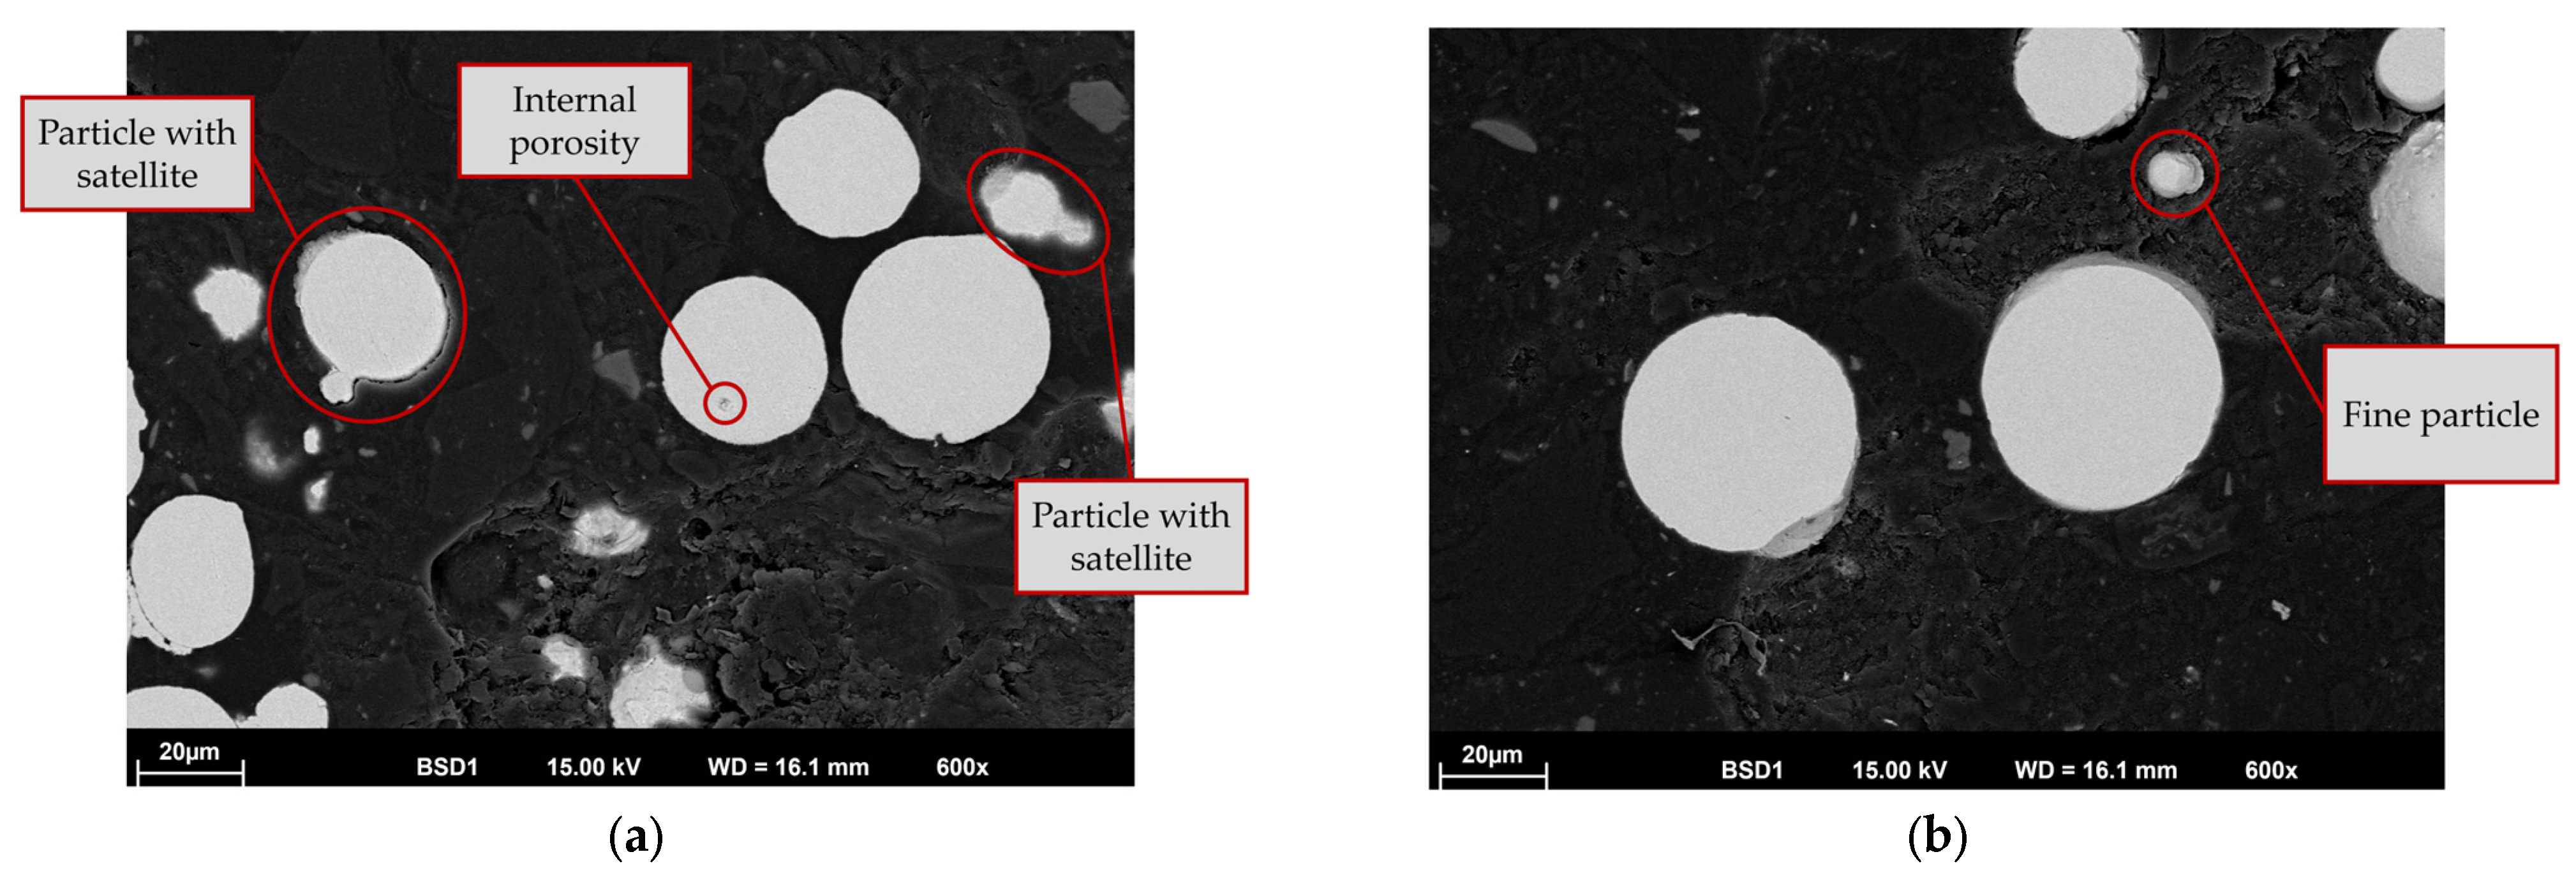
As displayed in the schematic procedure of brazing tape manufacturing (Figure 1), the initial step was to analyze the powder quality. SEM top-view analysis is used to determine the particle shape and the presence of misshapen or elongated particles and satellites. Representative SEM top-view analysis images of the powders used are displayed in Figure 3.
Both powders show a predominance of spherical particles, which boosts quality and enables uniform melting. Within the evaluated SEM images, a slightly higher proportion of irregular or misshapen particles was detected for the Fe-based 316L powder. Those particles might result in defects due to uneven melting. Furthermore, the powder exhibits a higher proportion of fine particles. The latter is most likely attributed to the finer particle size distribution of the 316L powder (15 to 45 µm 316L, compared to 20 to 53 µm NiCrBSi powder). The two powders show a comparable proportion of powder particles with satellites (large particles to which fine particles adhere metallurgically). Cross-sectional powder particle analysis offers a valuable insight into the particle’s compactness, enabling a qualitative identification of internal porosity. The powder particle cross-section is illustrated in Figure 4.
The metallurgical bonding between a powder particle and its satellite can be observed in Figure 4a. A negligible number of particles in each powder exhibit internal porosity or inclusions, but these occur very rarely and do not have a significant impact on powder quality. Accordingly, a high degree of compactness can be observed for both powders. Preliminary conclusions regarding the powder processing necessity can be derived from this SEM powder particle analysis. Fine powder particles can vaporize due to the energy supplied, leading to unwanted porosity.
The brazing tapes were fabricated according to the procedure described in Section 2 (see Figure 1) and subsequently brazed to the substrate using the temperature profile displayed in Figure 2. The resulting samples were laser-remelted on an area of 1 cm2 using the parameters shown in Table 4.
The samples with the smallest hatch distance (0.02 mm) and the lowest scanning speed (125 mm/s), namely S3-G, S3-H, and S3-I, were not further investigated since the remelting procedure appeared unstable and irregular. All the other samples were evaluated using CLSM top-view analysis.
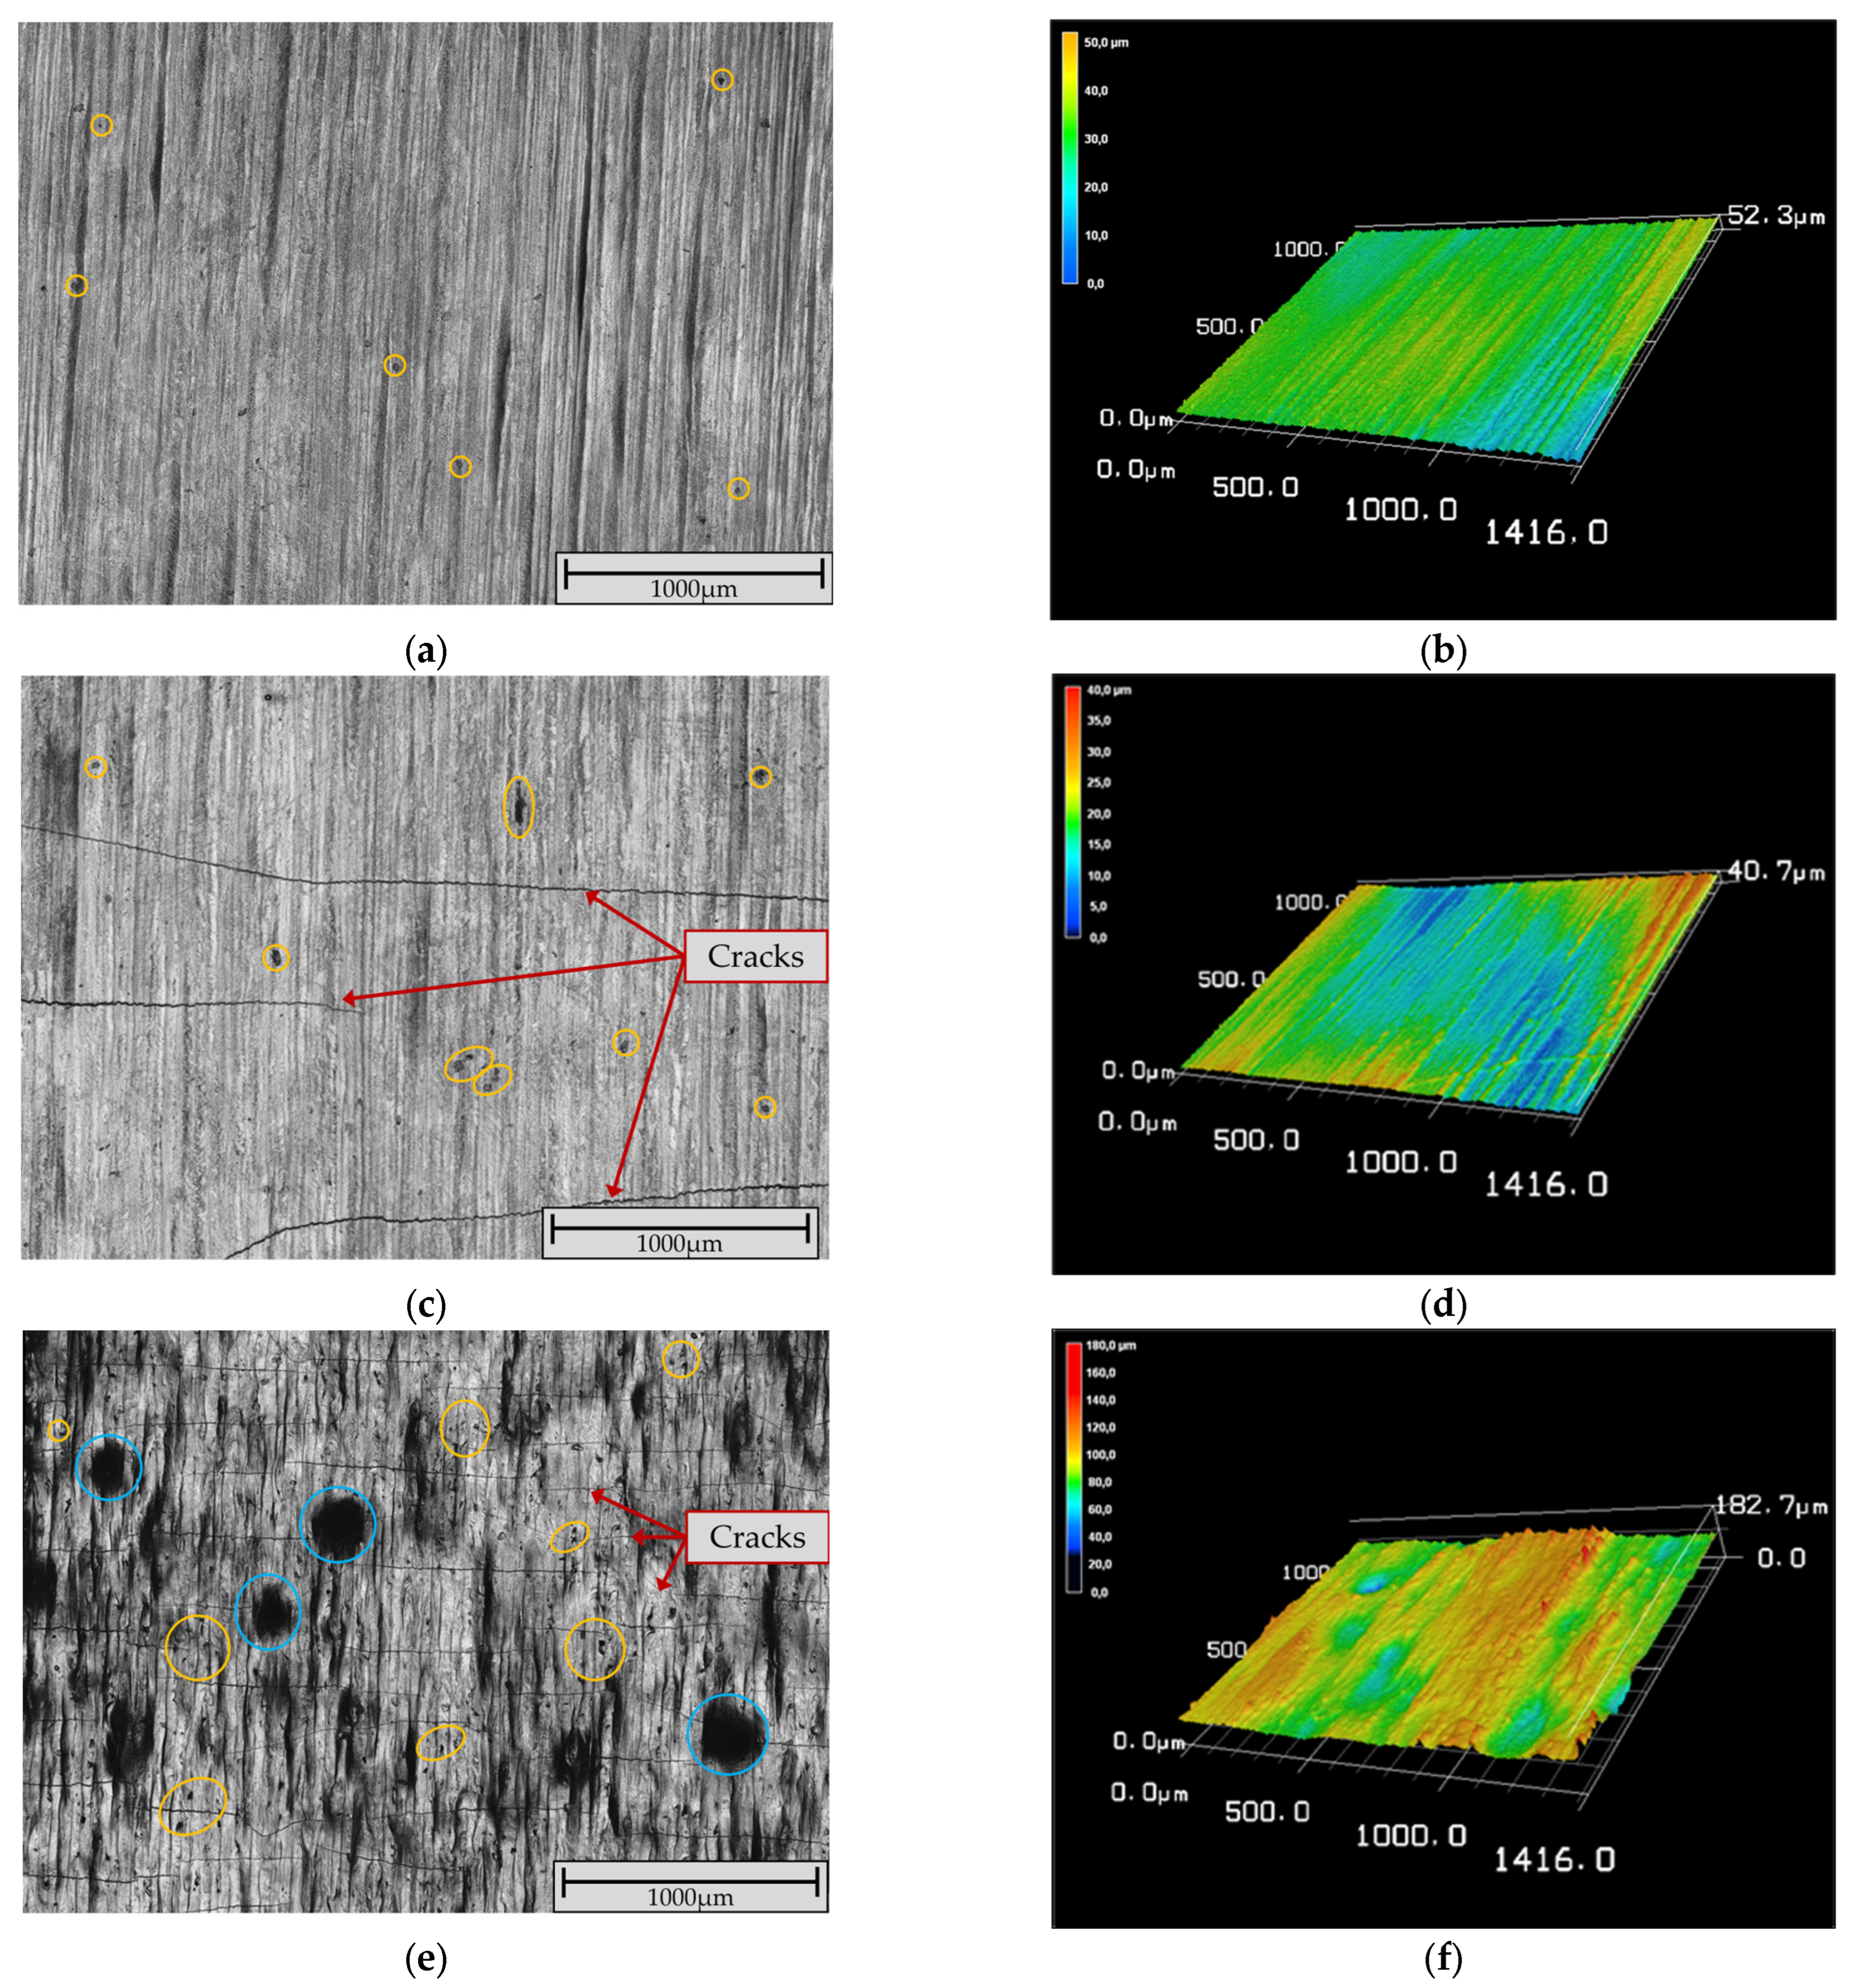
Figure 5 shows representative microscopic images illustrating the three-level scheme described in the Section 2.
Figure 5a,b show a sample exhibiting a good remelting quality. In the top view, no macropores or cracks are visible, and only a few micropores are present (indicated with orange circles). The corresponding surface is uniform and flat. Medium remelting quality is displayed in Figure 5c,d. These samples exhibit no macropores, few cracks (red arrows), and few micropores (circled in orange). Their surfaces are slightly uneven but generally uniform. Samples with a high number of cracks and pores, as well as very uneven, irregular surfaces, are classified as having poor remelting quality (see Figure 5e,f).
The samples were classified based on the evaluation criteria described in Section 2. Each sample received a total score by summing the scores from each category. Based on these scores, the top five samples with the highest overall quality were selected for further analysis. The results of the classification are displayed in Table 5.
The classification revealed that a considerable number of remelting parameters were found to be unsuitable. A prevailing tendency was observed, indicating that increasing laser power or decreasing hatch distance led to a reduction in porosity and cracks. Wu et al. [24] observed that too high laser power and too slow scanning speed lead to thermal cracks in both the remelting and substrate zones. However, given that the scanning speed and laser power varied in the same steps for all hatch distances, the origin of the cracks can be attributed either to the hatch distance or to the interaction of all parameters. A discernible trend pertaining to scanning speed could not be observed. For series S1 and series S2, among the parameters studied, no suitable combination was found. While evaluating area energy as a parameter is useful, our results indicate that relying solely on area energy can be misleading. For instance, samples S3-F and S2-I both exhibited an area energy of 70 J/mm2; however, sample S3-F demonstrated good coating quality and achieved the highest total score, whereas S2-I showed poor coating quality. This discrepancy highlights that area energy alone is insufficient to fully explain or predict the coating quality. Therefore, it is essential to consider the whole set of process parameters and their interaction to obtain a comprehensive understanding of the remelting outcomes.
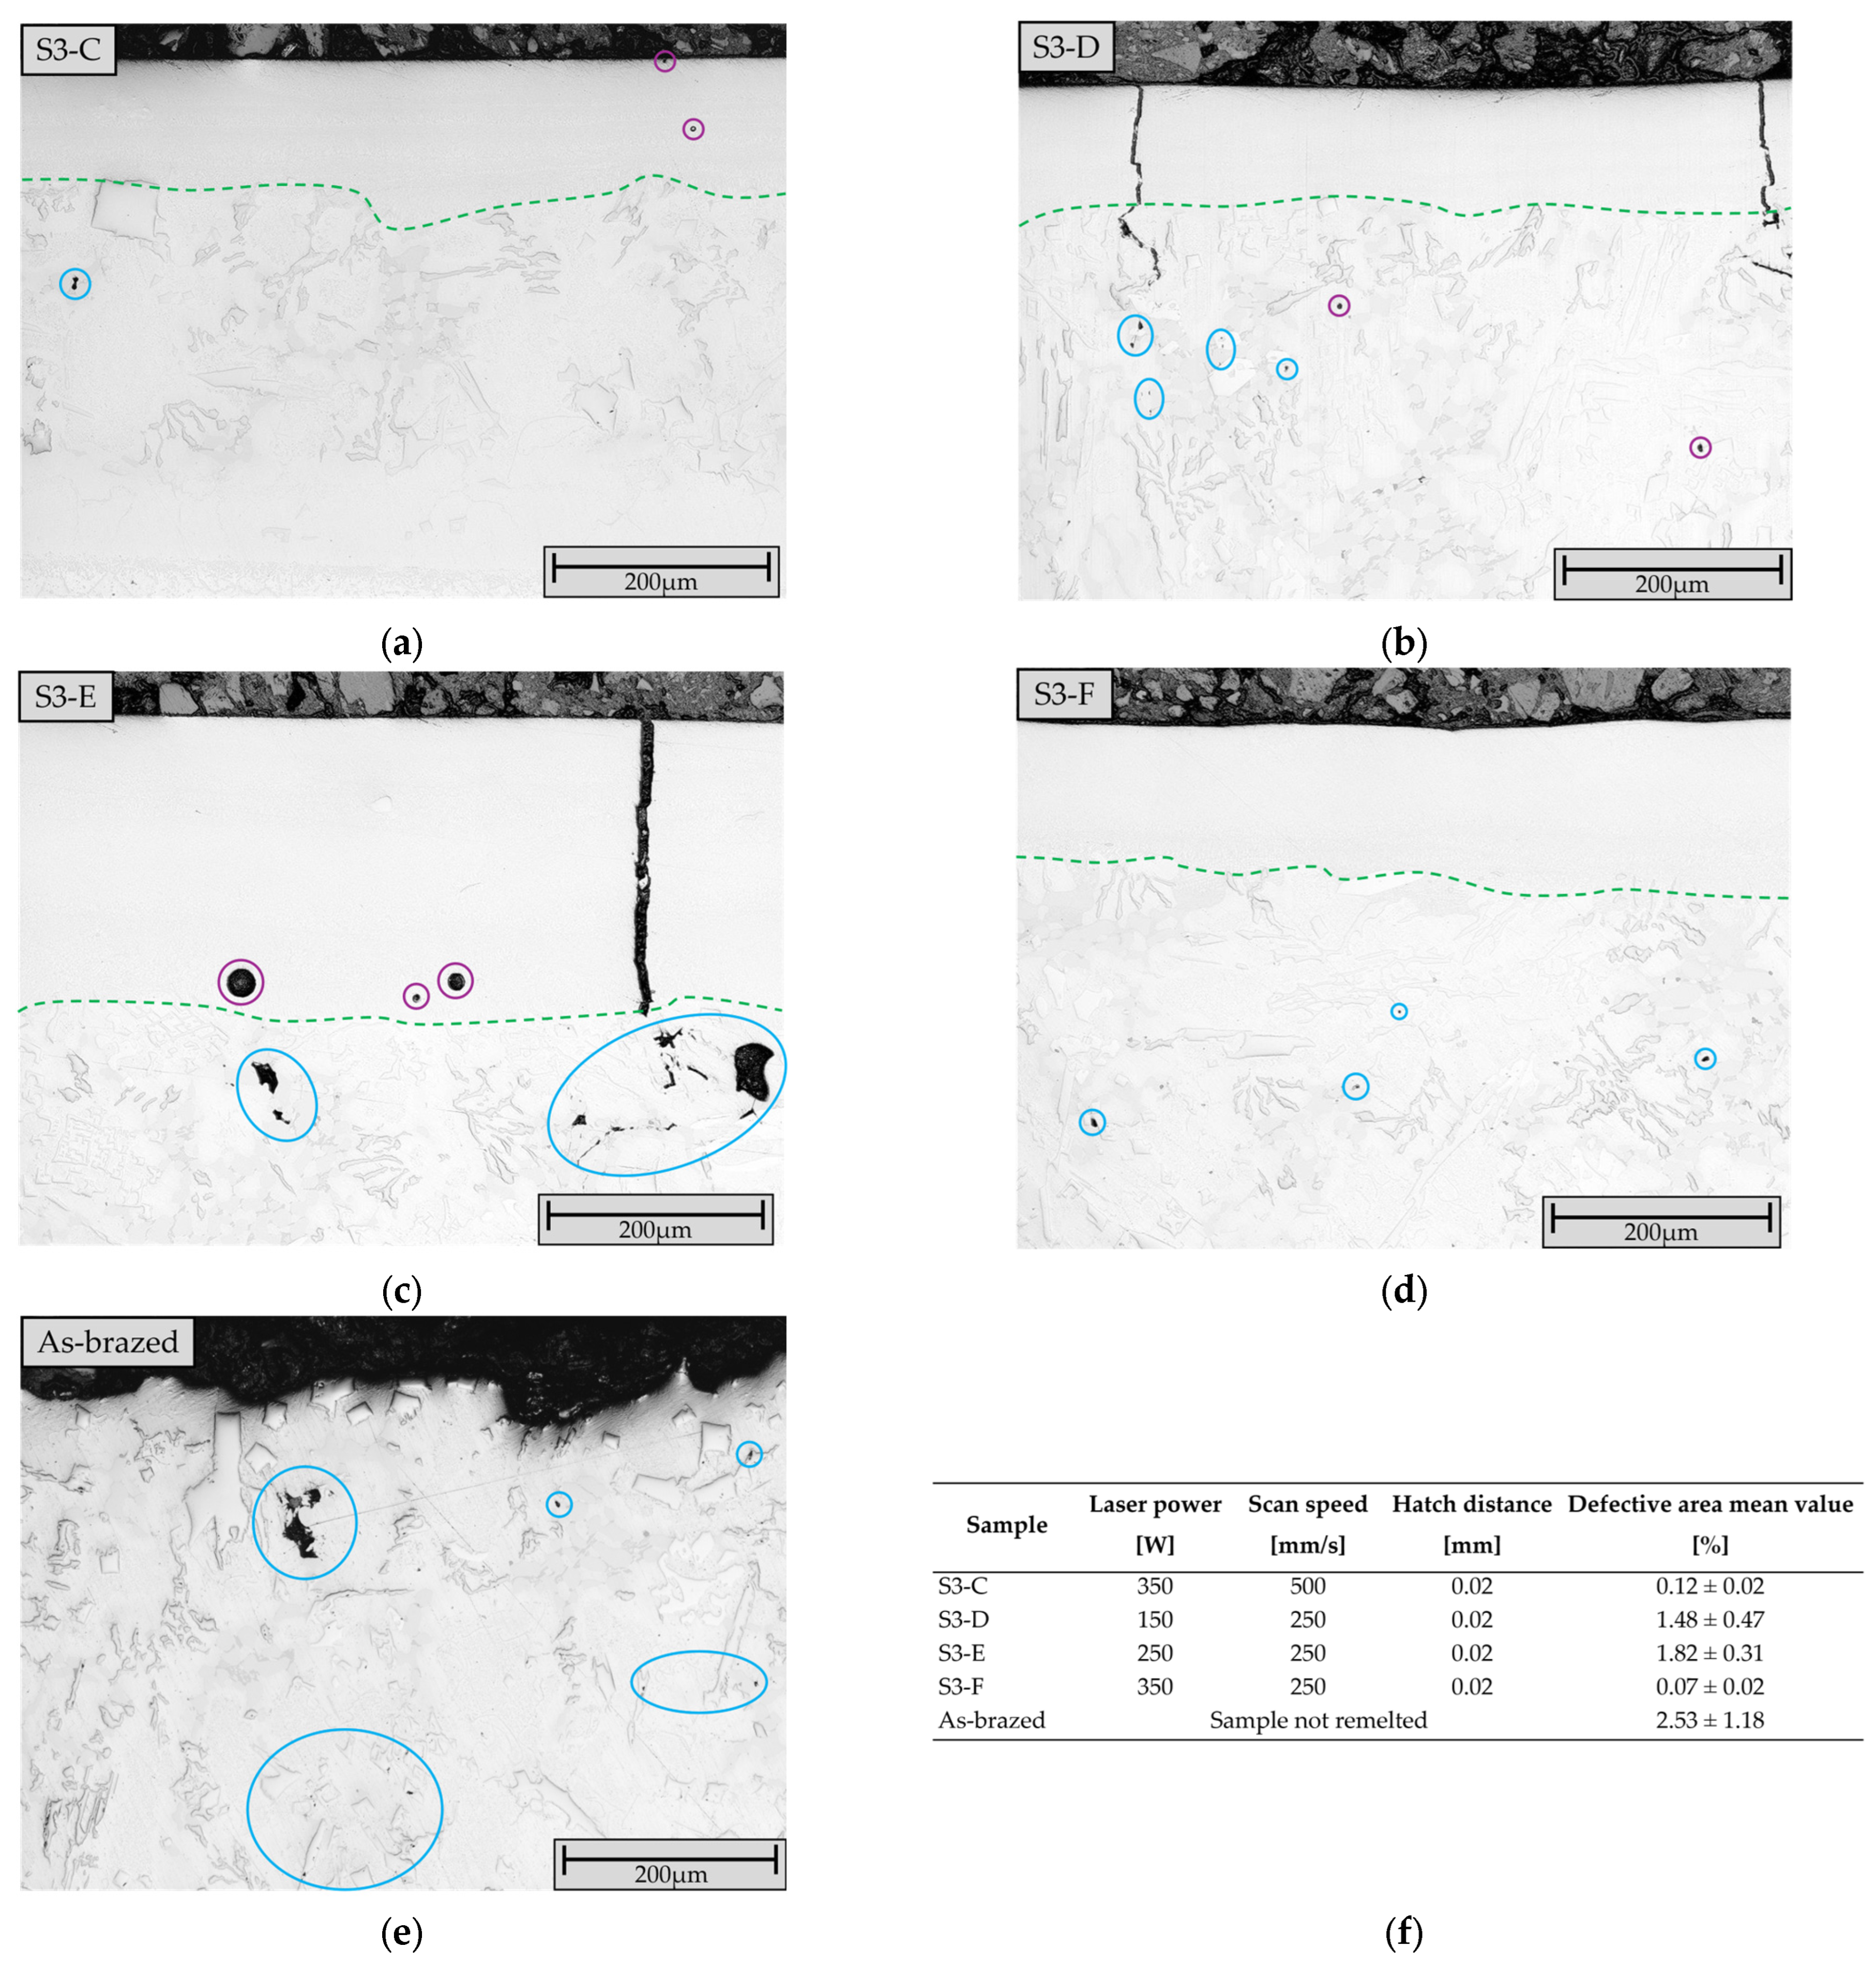
The samples with the highest total score (S3-C, S3-D, S3-E, and S3-F) were investigated in cross-section. The parameter combination with the fifth-highest score was excluded due to its highly irregular surface and the cracks’ network-like connections. It should be noted that samples S3-D and S3-E are only considered to a limited extent since they exhibited local cracks. Before further consideration, it must be clarified whether these cracks are superficial or propagate towards the substrate. The cross-sections are shown in Figure 6.
As Figure 6b,c show, the cracks in S3-D (depth of remelting: 129.8 ± 17.3 µm) and S3-E (depth of remelting: 263.5 ± 18.3 µm) propagate through the entire remelted structure. These cracks allow corrosive media to penetrate the layer deeply, significantly accelerating the corrosion reaction. Additionally, the cracks weaken the coating’s structural integrity, which can lead to spalling under stress. Although the cracks do not extend to the substrate material, their size is still a criterion for unsuitability. Despite the reduced proportion of defective area in samples S3-D and S3-E relative to the as-brazed sample (see Figure 6f), their defective area proportion is notably higher than that of S3-C and S3-F. Sample S3-C exhibits local pores in the uppermost areas that could be removed through surface finishing and residual voids from the brazing tape (see Figure 6a). Sample S3-F shows no defects, only small residual voids from the brazing tape outside the remelted zone (Figure 6d). The depth of remelting for S3-C is 110.2 ± 22.7 µm and for S3-F, 160.3 ± 17.2 µm. The as-brazed reference sample in Figure 6e exhibits an irregular surface structure and porosity close to the outermost area. The latter promotes corrosion reaction if the porosity is at the outermost layer after the surface finish. It should be noted that not all voids are fully opened. The actual voids are significantly larger but were not exposed during metallographic processing (accordingly, larger areas were marked).
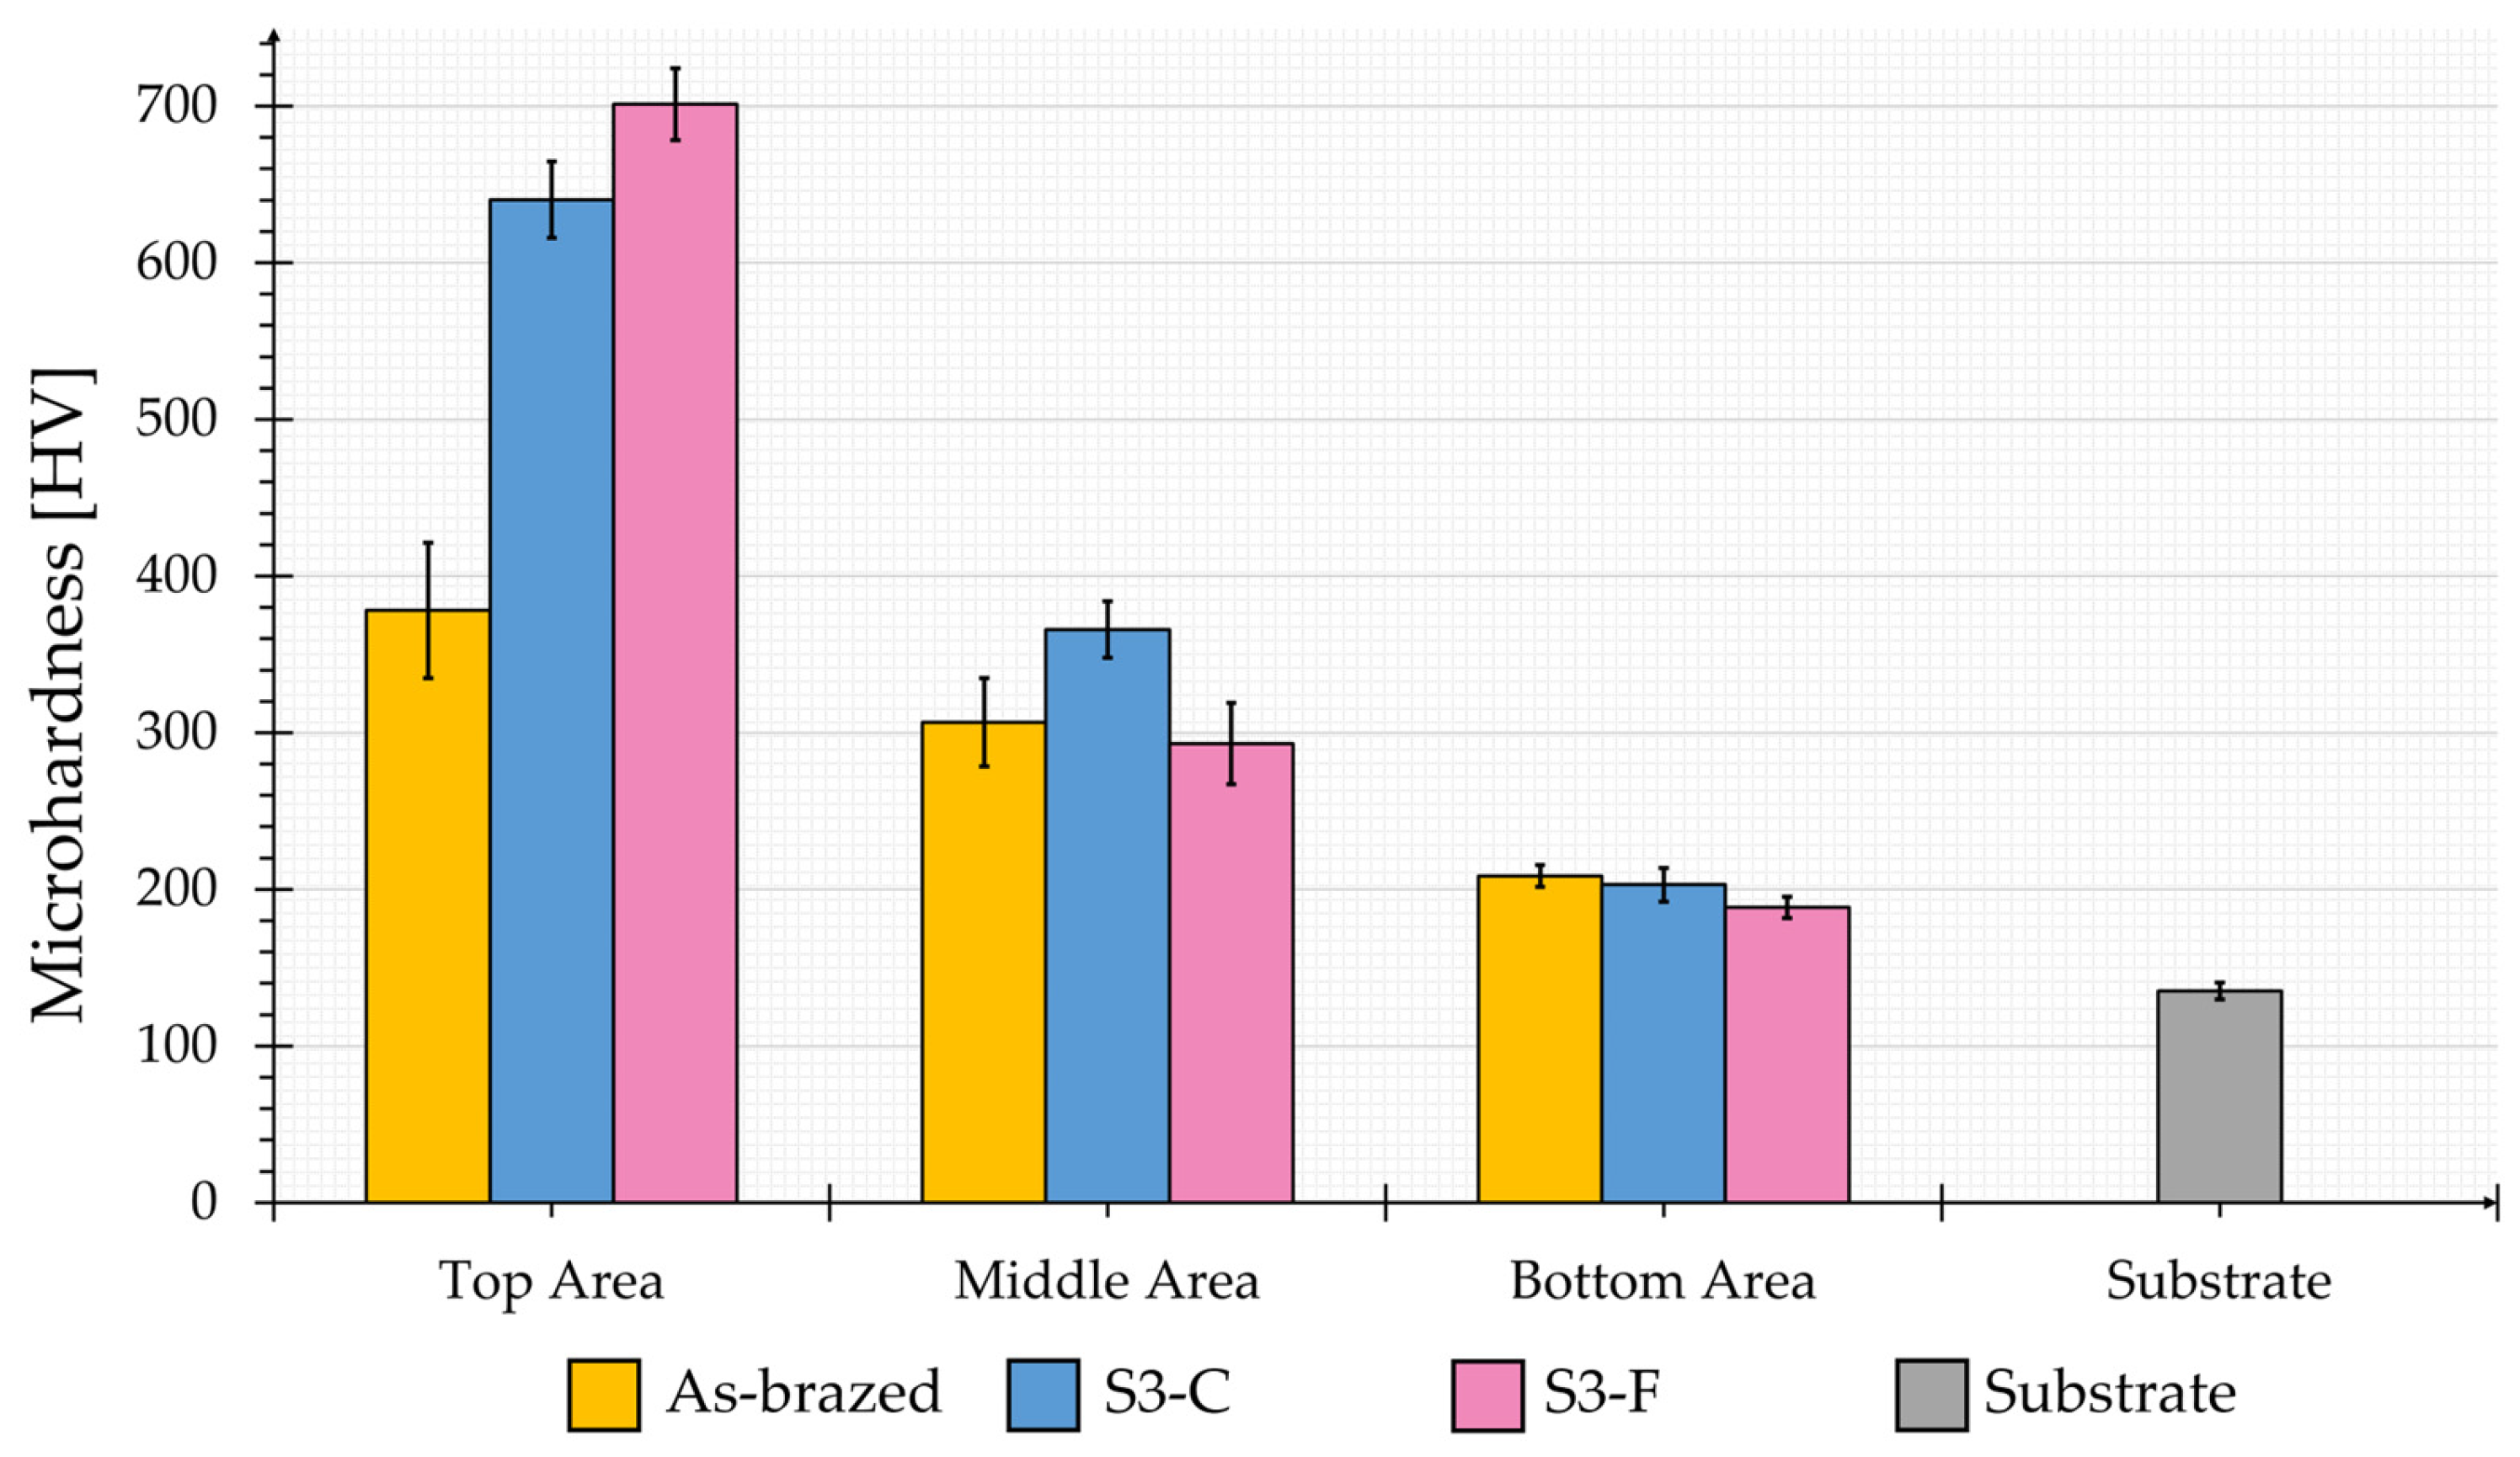
To further distinguish the two remaining parameters, the microhardness evolution from the top, middle, and bottom areas of the brazing tapes was determined (5 measurements per area). The resulting mean hardness values (HV1) for the individual areas are displayed in Figure 7.
The microhardness value in the top layer for both remelted samples is significantly higher than that of the as-brazed (378 ± 43 HV1) and the substrate (135 ± 5 HV1). The high standard deviation in the reference can be attributed to porosity, as illustrated in Figure 6e. The mean microhardness in the top area of S3-F is 701 ± 23 HV1, which is almost 10% higher than that of S3-C (640 ± 24 HV1) and almost twice as high as that of the unmelted reference. In the middle area, the samples demonstrate a considerably dropped level of microhardness, which nevertheless exerts a favorable influence on the ductility of the coating. S3-C exhibits a slightly higher microhardness than sample S3-F in the middle region. Since the middle area most likely shows as-brazed structure, the difference in hardness may be attributed to residual porosity present in sample S3-F. In the bottom range, the substrate level is almost reached.
The microhardness of the as-brazed sample is below the value stated in the literature [9,26,27], which is most likely due to the presence of underlying porosity depleting its microhardness. Both remelted samples exceed the literature values.
Considering that S3-F exhibits significantly higher microhardness and no defects within the remelted zone, this remelting parameter combination is regarded as the most suitable parameter combination, among the parameters studied, for the present brazing tape composition.

3.2. Comparison of the Wear and Corrosion Behavior

For comparison to the as-brazed condition, additional samples were remelted on an area of 9 cm2, using the remelting parameter combination of sample S3-F (350 W laser power; 250 mm/s scanning speed; and 0.02 mm hatch distance). The remelting process was characterized by the absence of sparks and smoke. In the final third of sample exposure, a discernible glow is observed. This finding suggests that the samples are exposed to elevated levels of thermal stress. Despite the evident discoloration of the layer, its exposure and remelting are consistent and uniform.
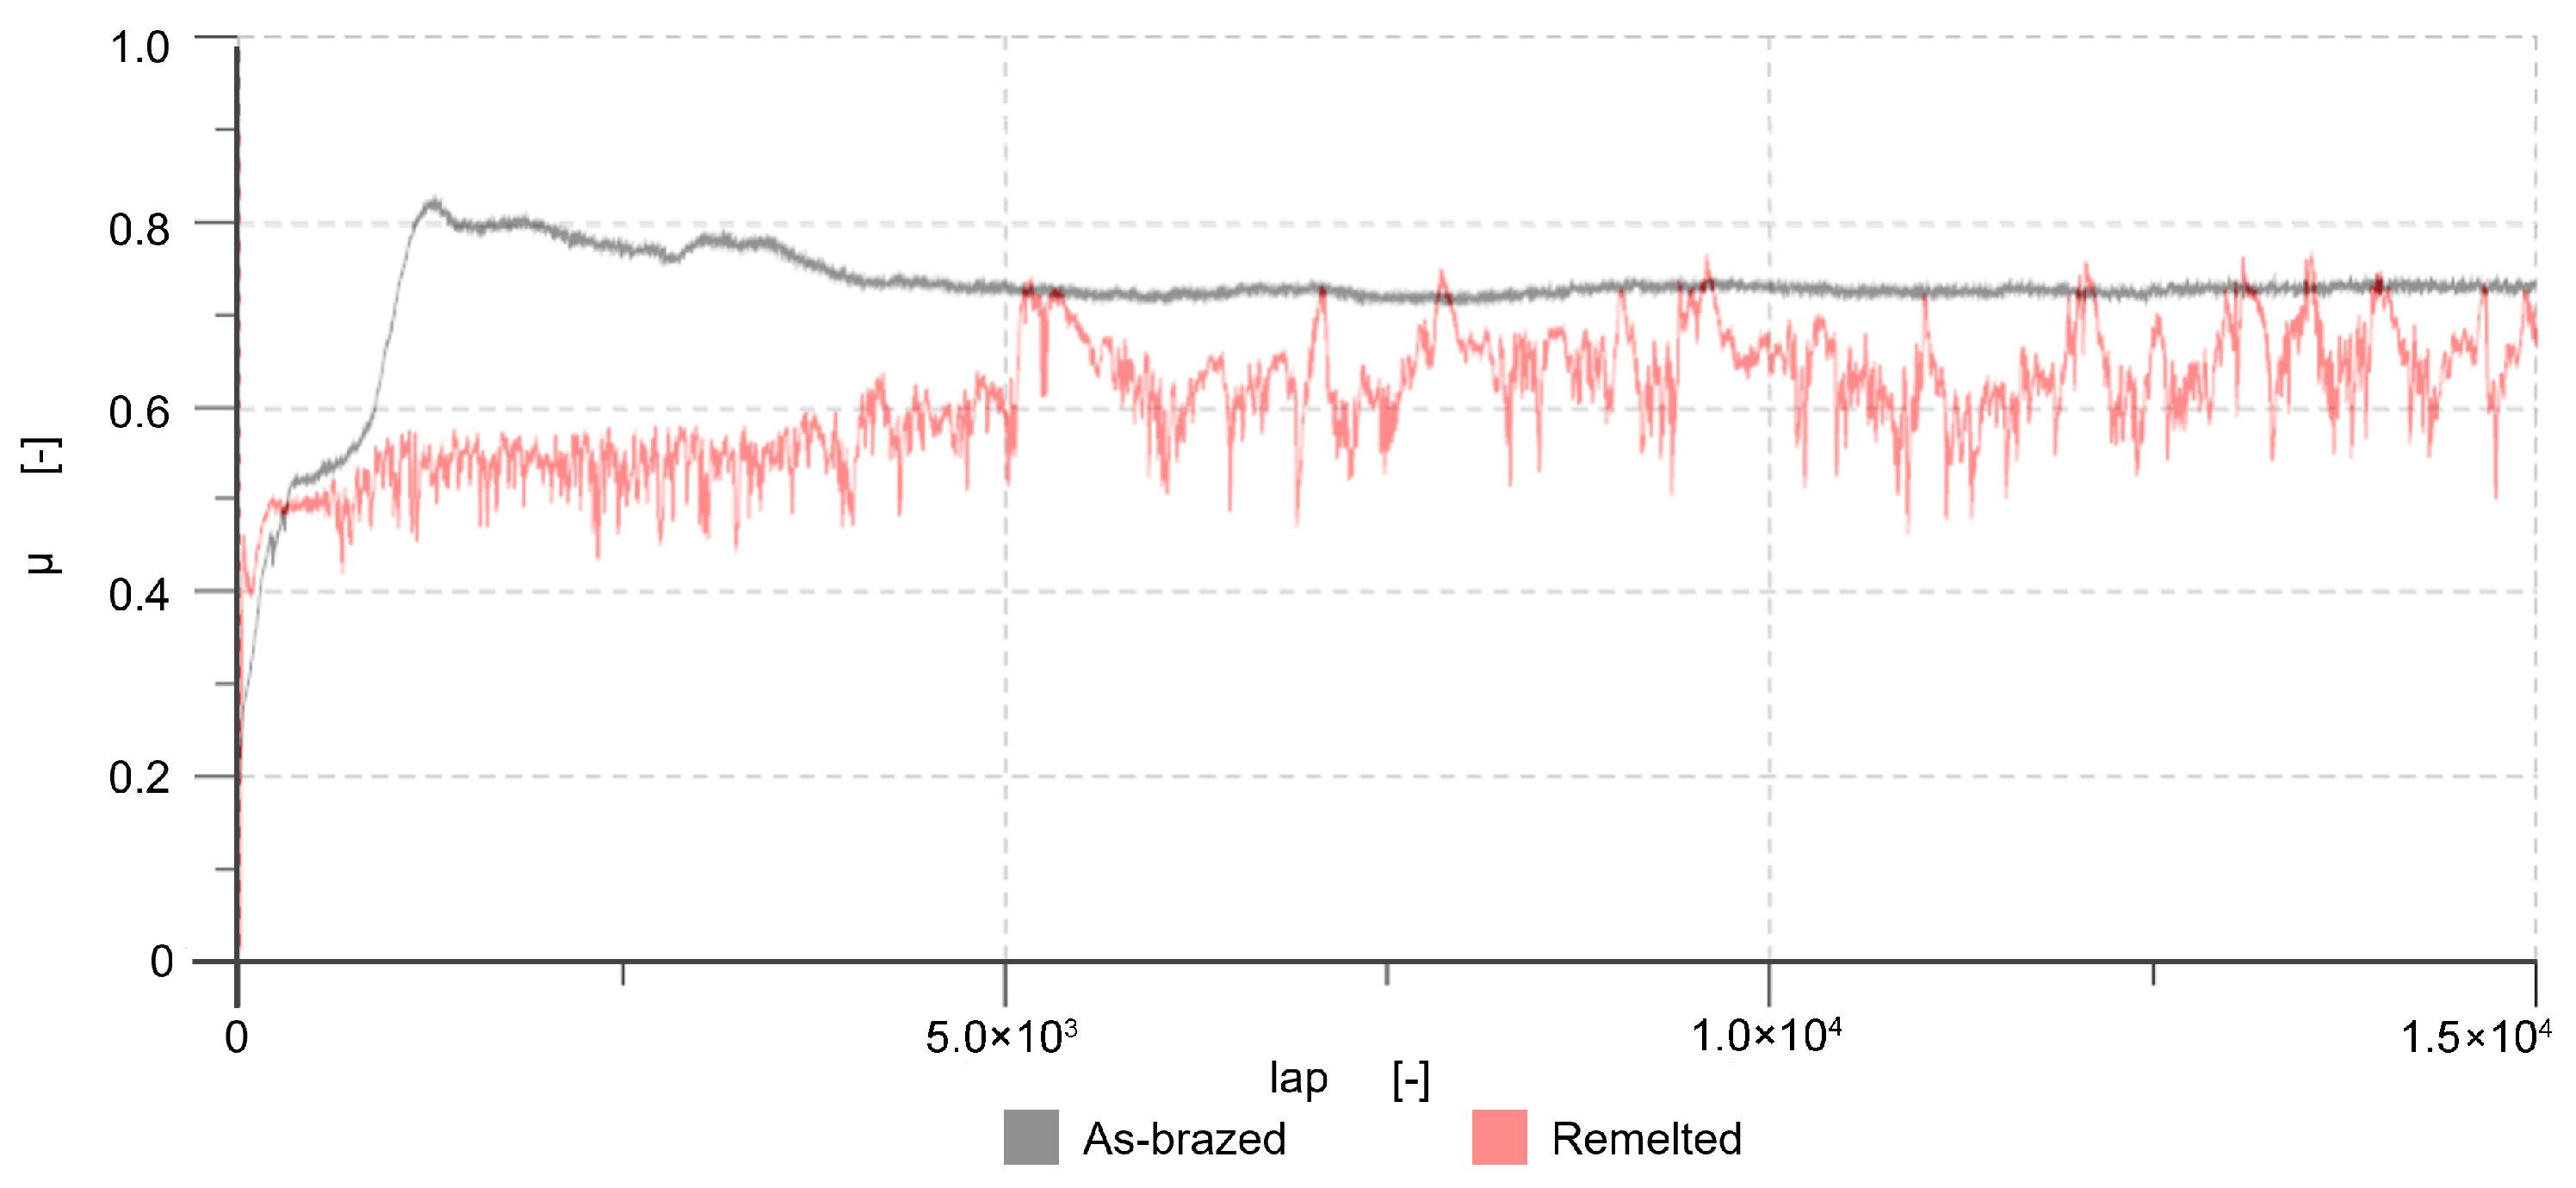
The evolution of coefficients of friction (COFs) for the as-brazed and remelted samples is displayed in Figure 8 (each measurement was repeated three times with similar curve progression). The as-brazed sample exhibits a typical curve progression, with a transient range and a steady state. In contrast, the remelted sample shows a brief transient range with no distinct steady state. As noted in the previous section, the remelted samples exhibit higher hardness. While enhanced hardness may initially provide improved resistance, it can result in increased brittleness and potential breakouts. NiCrBSi gains the hardness from hard phases; they boost the coating’s hardness, but when exposed to hard counter surfaces, they easily lead to local fragmentation [27]. The remelted sample begins to settle around a mean value, but breakouts interrupt this process. A similar progression of the COF was observed by Grain et al. [4] and Jaiswal et al. [27]. The mean COF is 0.721 ± 0.067 for the as-brazed sample and 0.610 ± 0.069 for the remelted sample.
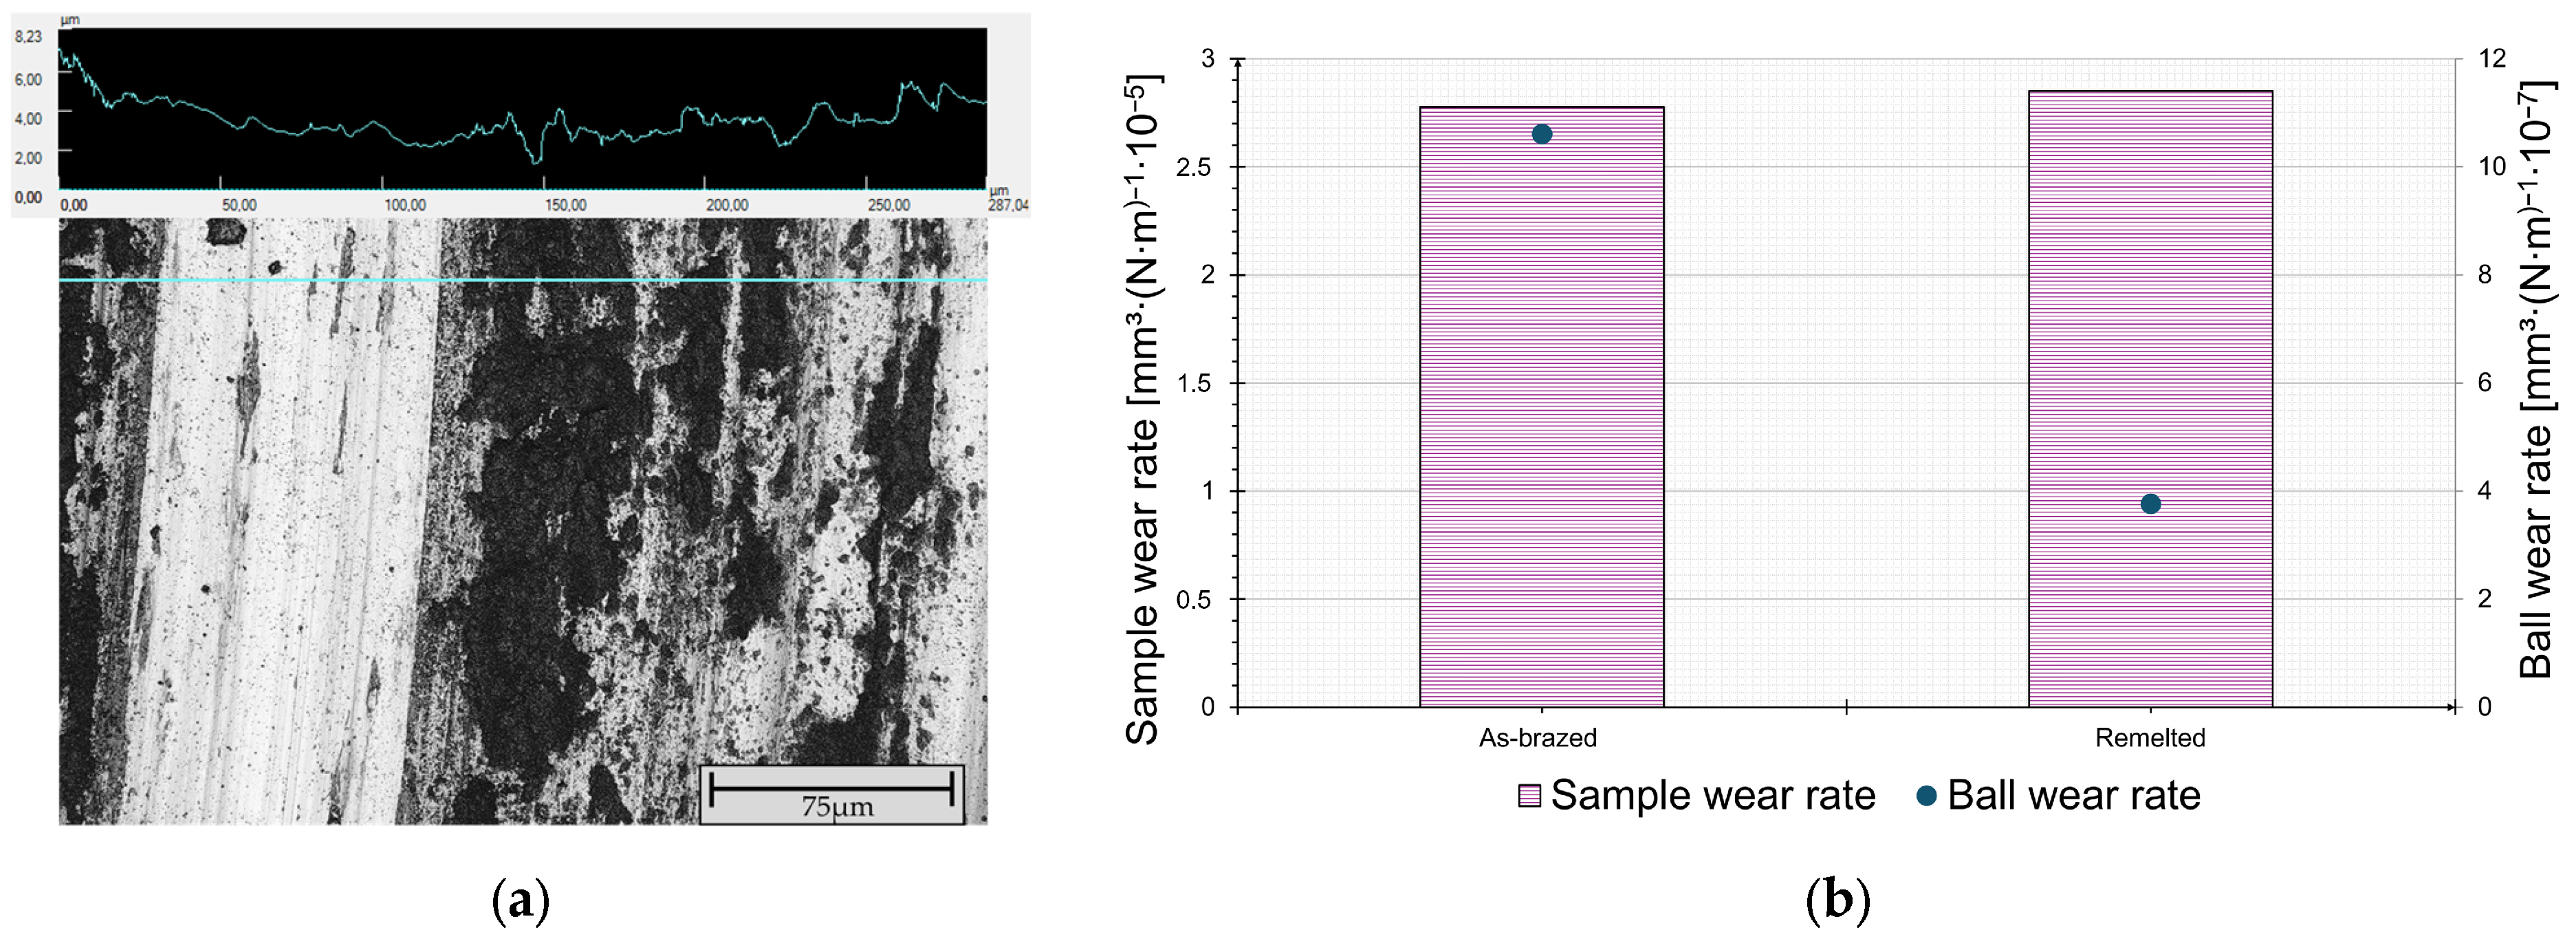
CLSM evaluation of the wear track confirmed the presence of spallation within the wear track (see Figure 9a). These detachments are not superficial; they extend into the material. For the as-brazed samples, no significant influence of the breakouts on the depth profile can be assumed. Despite the presence of localized material detachment, the remelted samples exhibit wear tracks more consistently than the as-brazed samples. Based on CLSM measurements of the sample and ball, the corresponding wear rates were determined according to the procedure stated in the literature [28,29,30].
The sample wear rate on both samples is almost identical (2.777 × 10⁻⁵ mm3/N∙m for the as-brazed sample, and 2.851 × 10⁻⁵ mm3/N∙m for the remelted sample; see Figure 9b). The as-brazed sample showed a higher ball wear rate (1.06 × 10⁻⁶ mm3/N∙m) than the remelted sample (3.759 × 10⁻⁵ mm3/N∙m). Accordingly, the remelted sample exhibited more wear than the corresponding ball, which is most likely due to the higher amount of spallation.
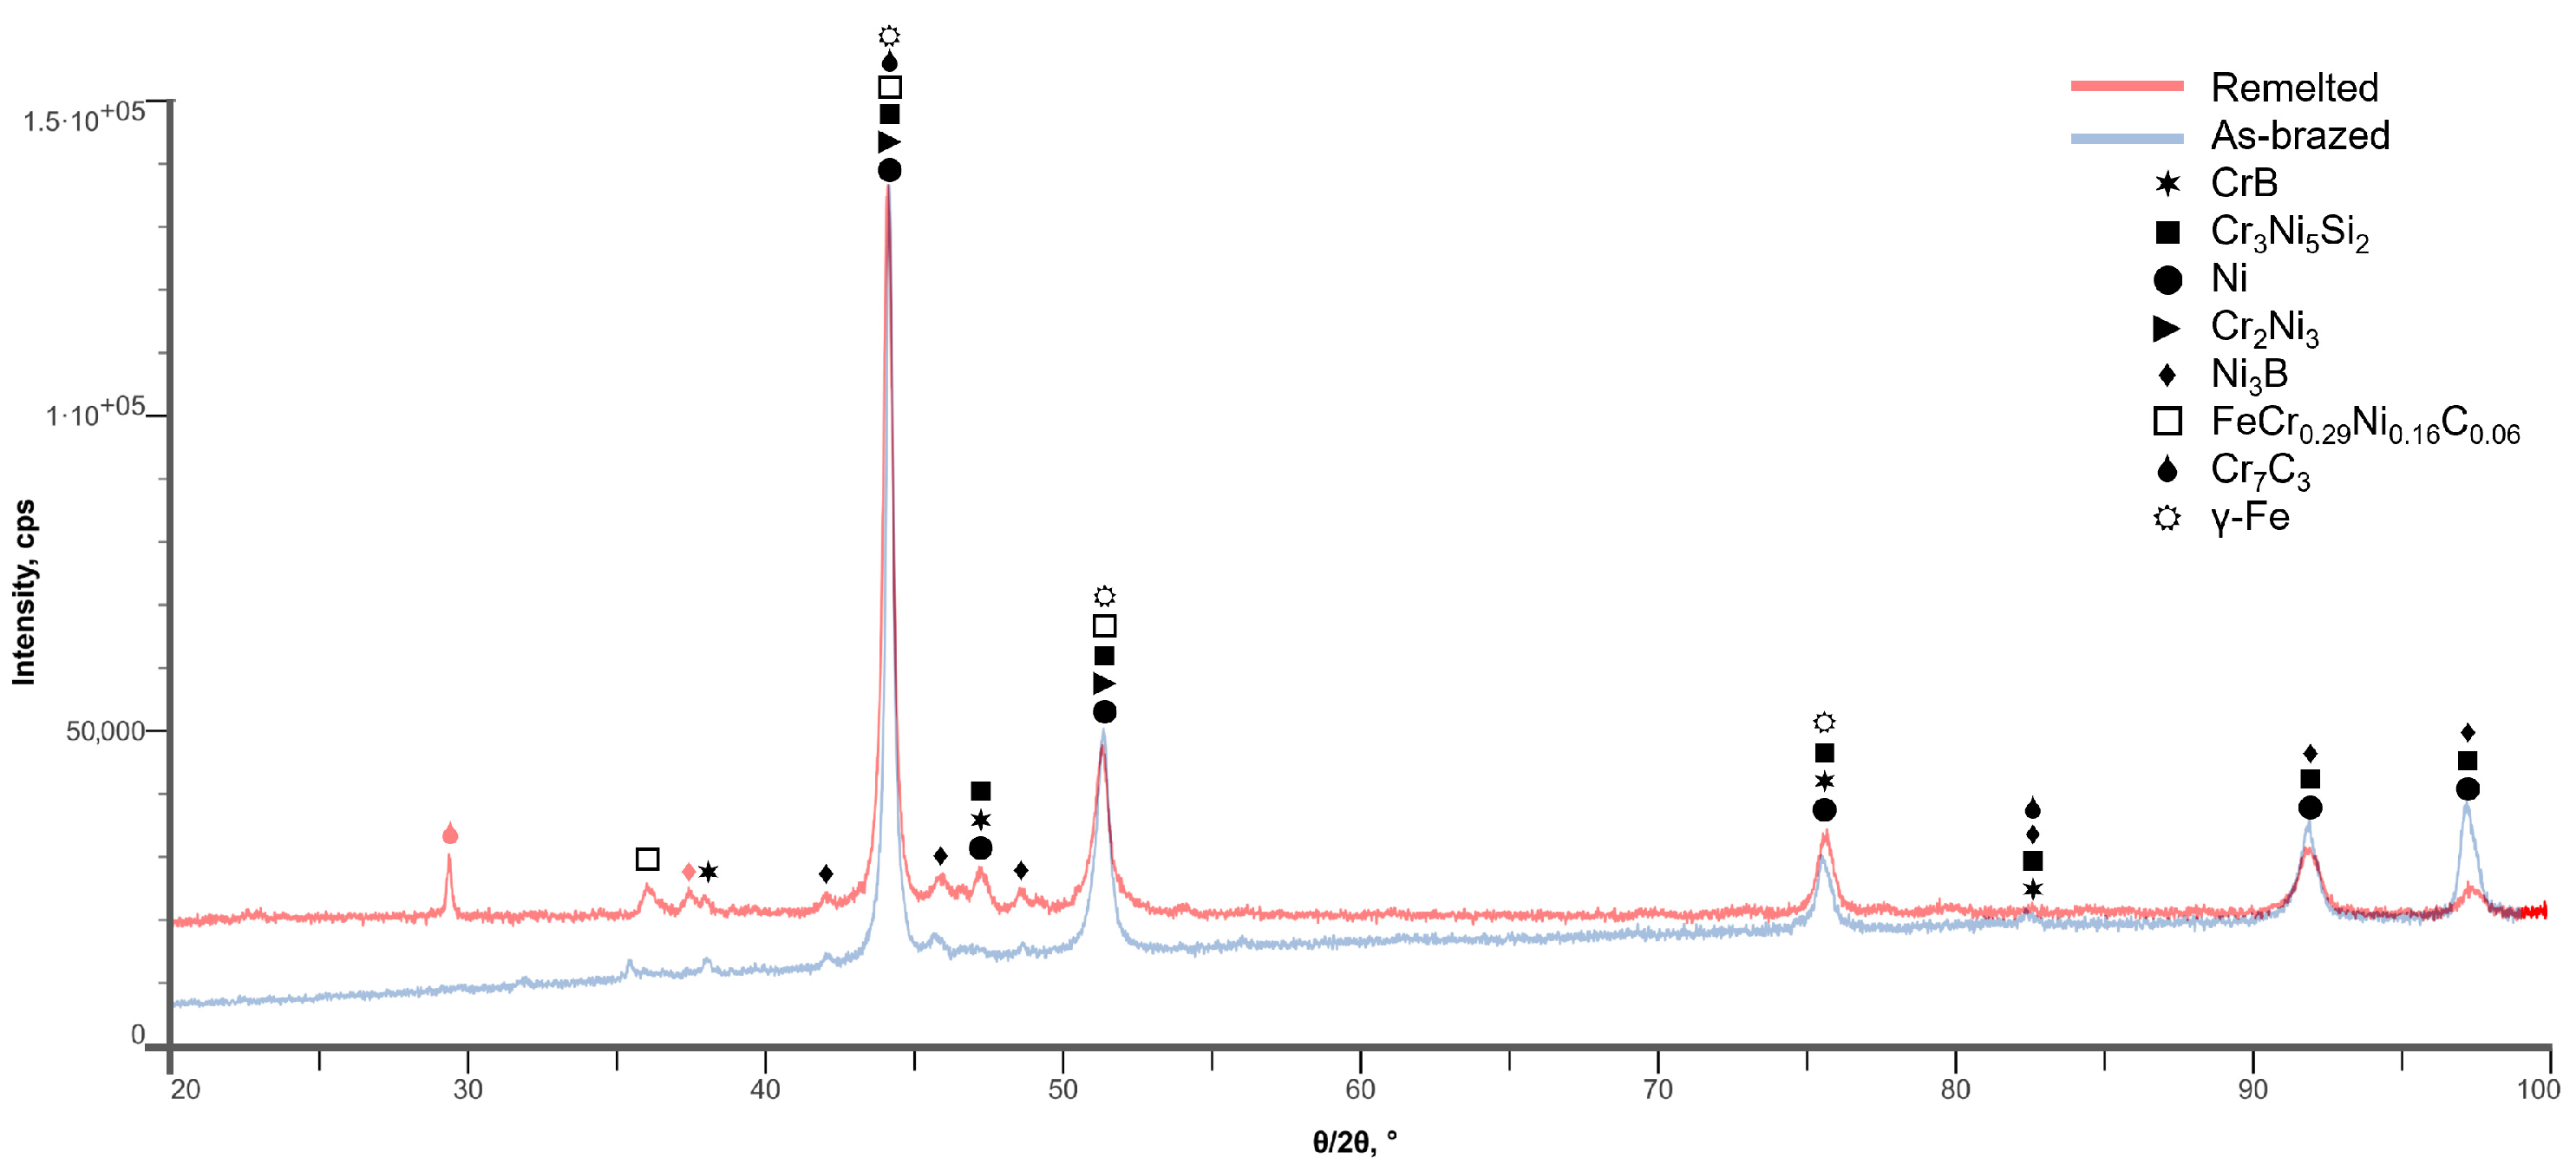
Figure 10 shows the XRD diffractograms of the remelted and as-brazed samples.
Both XRD diffractograms revealed a predominance of γ-Fe/Ni solid solution peaks at approx. 44.5°, 52°, 75°, and 92°, corresponding to different planes (see Figure 10). Peaks associated with carbides (Cr7C3; FeCr0.29Ni0.16C0.06), silicides (Cr3Ni5Si2), and borides (Ni3B; CrB) were detected in higher intensity in the remelted samples (see peaks at approx. 29°, 37.5°, and 47°). The presence of such hard phases promotes hardness (see Figure 7) but can promote spallation due to their brittle behavior. Similar XRD spectra have been reported in the literature [31,32,33].
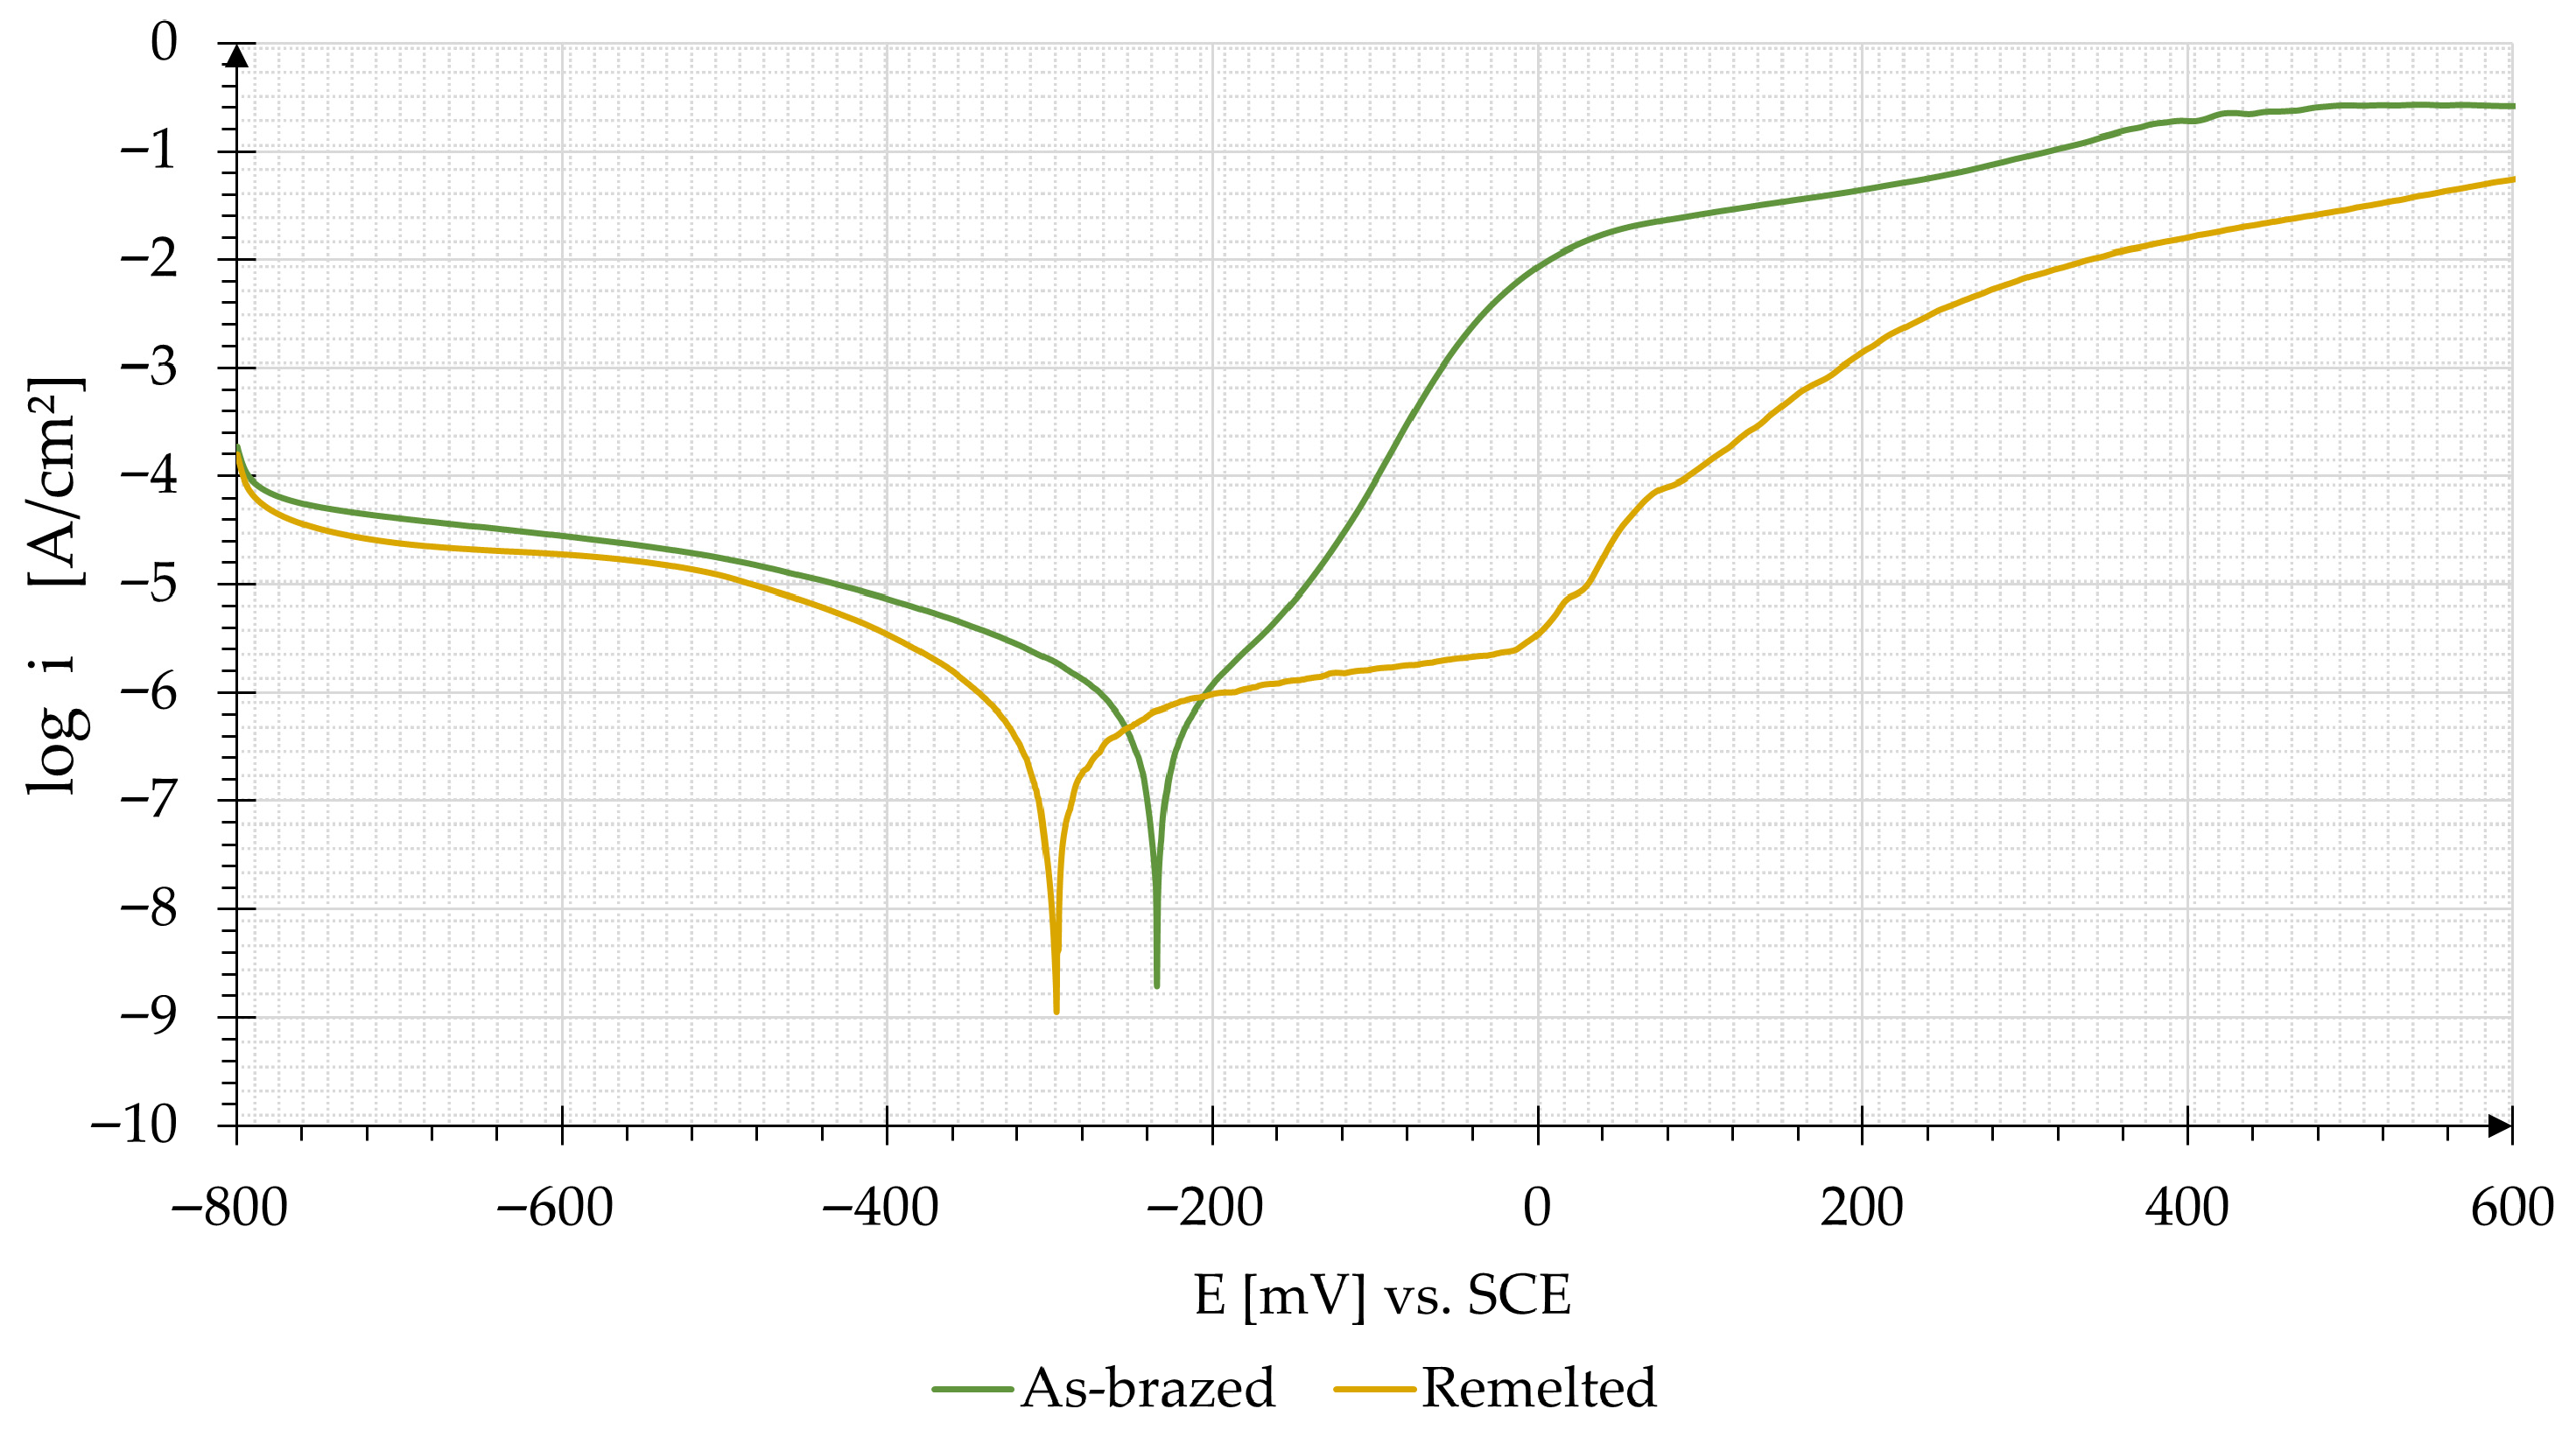
The semi-logarithmic curves of current density versus potential, recorded during the corrosion tests, are presented in Figure 11, along with their associated values in Table 6.
Since the corrosion potentials of both samples are within measurement tolerance, similar corrosion reaction thermodynamics can be assumed. In terms of corrosion kinetics, the remelted sample exhibited a lower corrosion current density, indicating a slower corrosion reaction. Accordingly, the corrosion rate is approximately 70% lower for the remelted sample than that for the as-brazed sample (see Table 6). A significant difference between the samples is evident in the anodic region: the as-brazed specimen demonstrates steadily increasing current density, while the remelted sample shows a moderate increase indicative of repassivation. Consequently, the remelted sample is expected to experience reduced corrosion damage due to its slower reaction kinetics and repassivation behavior. This enhancement is likely due to the remelted coating’s more uniform and refined microstructure (see Figure 6d,e), which promotes corrosion resistance. Compared to the values stated in the literature [34,35,36], both samples showed a more positive corrosion potential and lower current density, indicating their superior corrosion performance. It should be noted that other deposition technologies were used in the literature, which limits their comparability. In the context of corrosion behavior, remelting can therefore be regarded as a beneficial process.

4. Conclusions

This study demonstrated the potential of brazing tapes as a safer, novel alternative for repairing FGM coatings. Unlike conventional powder-based repair techniques, this approach significantly reduces powder pollution, enhancing worker safety during on-site repairs. Laser remelting of brazed tapes has not been investigated before, which affirms the novelty of this research. The primary focus of this research was to assess the viability of this method. Rather than directly comparing existing state-of-the-art technologies, the comparison of as-brazed and remelted conditions highlighted the feasibility of the intended approach.
The powder examination identified a predominance of spherical particles, with the occasional presence of misshapen, irregular particles and particles with satellites. Both powders exhibited good compactness.
The parameter study showed that increasing laser power or decreasing the hatch distance to achieve higher laser intensities resulted in a significant reduction in porosity and cracks. However, no clear trend was observed with scanning speed. Many parameter combinations exhibited cracks and pores on the surface, which emphasizes the need for preliminary tests when adapting this method for other alloys. The best remelting parameter set among the parameters studied (350 W laser power; 250 mm/s; scanning speed; 0.02 mm hatch distance) exhibited no cracks, no porosity, a remelting depth of 160.3 ± 17.2 µm, and a microhardness of 701 ± 23 HV1.
This parameter combination was used to validate the necessity for laser remelting by comparing it to the as-brazed condition. The remelted sample demonstrates an 85% increase in microhardness within the external region compared to the as-brazed condition, while the softer middle and lower areas ensure ductility. Although the remelted sample shows an irregular COF progression, attributed to spallation, it demonstrates a reduced COF. The remelted sample showed an unexpected increase in spallation compared to the as-brazed sample. XRD analysis revealed the presence of hard, brittle phases, including carbides, silicides, and borides, which contribute to increased hardness and reduced friction. However, these phases can also induce brittleness and reduce the coating’s ability to absorb mechanical stress. The implications of this phenomenon are contingent upon the specific context of application; therefore, it can be regarded as either a benefit or a drawback.
Corrosion measurements showed comparable corrosion potentials for both conditions; however, the corrosion current densities varied, leading to distinct corrosion rates. The remelted sample exhibited lower corrosion current densities, indicating slower corrosion kinetics. Notably, the remelted sample demonstrated passivation during anodic dissolution, effectively slowing corrosion, whereas the as-brazed sample exhibited unhindered corrosion reaction.
While this method is more resource-intensive than some conventional approaches, the significant improvement in worker safety through the elimination of powder pollution justifies further development and improvement, such as exploring defocused laser pre-treatment to replace vacuum treatment and thereby eliminate a preparation step. Following the demonstration of feasibility, further investigations are necessary to perform a comparative analysis with conventional repair methods. This will facilitate a comprehensive evaluation of the full potential of laser-remelted brazing tapes for repairing FGMs.

Author Contributions

Conceptualization, I.-D.U., G.M. and M.B.; methodology, I.-D.U., G.M. and M.B.; software, M.G. and M.B.; validation, I.-D.U., M.G., G.M. and M.B.; formal analysis, I.-D.U., M.G., G.M. and M.B.; investigation, M.G., G.M. and M.B.; resources, I.-D.U. and G.M.; data curation, M.B.; writing—original draft preparation, I.-D.U., M.G., G.M. and M.B.; writing—review and editing, I.-D.U., M.G., G.M. and M.B.; visualization, M.B.; supervision, I.-D.U. and G.M.; project administration, M.B. All authors have read and agreed to the published version of the manuscript.

Funding

This research received no external funding.

Data Availability Statement

The original contributions presented in this study are included in the article. Further inquiries can be directed to the corresponding authors.

Acknowledgments

The authors would like to express their gratitude to Habil. Bilal Göcke for providing access to the Laser Powder Bed Fusion system funded by the DFG Heisenberg Program, project GO 2566/10-1 (445127149). Furthermore, the authors thank Deniz Kurumlu for providing access to the facilities of the Laboratory for Materials Science and Testing.

Conflicts of Interest

The authors declare no conflicts of interest.

Abbreviations

The following abbreviations are used in this manuscript:
CLSMConfocal Laser Scanning Microscope
COFCoefficient of friction
FGMFunctionally Graded Material
PBF-LPowder Bed Fusion-Laser
PODPin-on-Disc
SEMScanning Electron Microscope
XRDX-Ray Diffraction

References

  1. Bender, R.; Féron, D.; Mills, D.; Ritter, S.; Bäßler, R.; Bettge, D.; De Graeve, I.; Dugstad, A.; Grassini, S.; Hack, T.; et al. Corrosion challenges towards a sustainable society. Mater. Corros. 2022, 73, 1730–1751. [Google Scholar] [CrossRef]
  2. Holmberg, K.; Andersson, P.; Erdemir, A. Global energy consumption due to friction in passenger cars. Tribol. Int. 2012, 47, 221–234. [Google Scholar] [CrossRef]
  3. Aliabadi, M.; Khodabakhshi, F.; Soltani, R.; Gerlich, A.P. Modification of flame-sprayed NiCrBSi alloy wear-resistant coating by friction stir processing and furnace re-melting treatments. Surf. Coat. Technol. 2023, 455, 129236. [Google Scholar] [CrossRef]
  4. Grain, A.K.; Singh, N.K.; Maurya, S.S.; Pandey, K.K.; Ghosh, S.K.; Keshri, A.K. Enhancing high-temperature wear resistance of plasma-sprayed NiCrBSi coatings with nanodiamond reinforcement. Diam. Relat. Mater. 2024, 150, 111748. [Google Scholar] [CrossRef]
  5. Brand, M.; Uțu, I.-D.; Sîrbu, N.-A.; Perianu, I.-A.; Predu, D.A.; Mărginean, G. Microstructural Characteristics of Graded Ni-Fe Coatings Fabricated Through DED-L. Materials 2026, 19, 271. [Google Scholar] [CrossRef] [PubMed]
  6. European Commission; Directorate-General for Internal Market, Industry, Entrepreneurship; SMEs. Study on the Critical Raw Materials for the EU 2023—Final Report; Publications Office of the European Union: Luxembourg City, Luxembourg, 2023.
  7. Alkunte, S.; Fidan, I.; Naikwadi, V.; Gudavasov, S.; Ali, M.A.; Mahmudov, M.; Hasanov, S.; Cheepu, M. Advancements and Challenges in Additively Manufactured Functionally Graded Materials: A Comprehensive Review. J. Manuf. Mater. Process. 2024, 8, 23. [Google Scholar] [CrossRef]
  8. Nazir, A.; Gokcekaya, O.; Md Masum Billah, K.; Ertugrul, O.; Jiang, J.; Sun, J.; Hussain, S. Multi-material additive manufacturing: A systematic review of design, properties, applications, challenges, and 3D printing of materials and cellular metamaterials. Mater. Des. 2023, 226, 111661. [Google Scholar] [CrossRef]
  9. Banait, S.M.; Paul, C.P.; Jinoop, A.N.; Kumar, H.; Pawade, R.S.; Bindra, K.S. Experimental investigation on laser directed energy deposition of functionally graded layers of Ni-Cr-B-Si and SS316L. Opt. Laser Technol. 2020, 121, 105787. [Google Scholar] [CrossRef]
  10. Yinghua, L.; Kaiming, W. Microstructure and properties of a laser cladded NiCrBSi alloy coating. Mater. Test. 2020, 62, 698–702. [Google Scholar] [CrossRef]
  11. Sheppard, P.; Koiprasert, H. Effect of W dissolution in NiCrBSi–WC and NiBSi–WC arc sprayed coatings on wear behaviors. Wear 2014, 317, 194–200. [Google Scholar] [CrossRef]
  12. Chen, R.; Yin, H.; Cole, I.S.; Shen, S.; Zhou, X.; Wang, Y.; Tang, S. Exposure, assessment and health hazards of particulate matter in metal additive manufacturing: A review. Chemosphere 2020, 259, 127452. [Google Scholar] [CrossRef]
  13. Kellens, K.; Baumers, M.; Gutowski, T.G.; Flanagan, W.; Lifset, R.; Duflou, J.R. Environmental Dimensions of Additive Manufacturing: Mapping Application Domains and Their Environmental Implications. J. Ind. Ecol. 2017, 21, S49–S68. [Google Scholar] [CrossRef]
  14. Roth, G.A.; Geraci, C.L.; Stefaniak, A.; Murashov, V.; Howard, J. Potential occupational hazards of additive manufacturing. J. Occup. Environ. Hyg. 2019, 16, 321–328. [Google Scholar] [CrossRef]
  15. Yu, G.; Zou, T.; Chen, S.; Huang, J.; Yang, J.; Zhao, Z. Effect mechanism of Ni coating layer on the characteristics of Al/steel dissimilar metal brazing. Mater. Charact. 2020, 167, 110518. [Google Scholar] [CrossRef]
  16. Deyun, L.; Yunyue, L.; Mingyuan, Z.; Lanbing, S.; Yuanxun, S. Research on typical defects of Cu/Fe dissimilar metals vacuum welding-brazing and improvement measures. J. Phys. Conf. Ser. 2025, 2959, 12010. [Google Scholar] [CrossRef]
  17. Ahn, B. Recent Advances in Brazing Fillers for Joining of Dissimilar Materials. Metals 2021, 11, 1037. [Google Scholar] [CrossRef]
  18. Lu, Y.; Wang, X.; Yuan, Z.; He, P.; Wang, P.; He, Y.; Zhang, G.; Peng, Y. Advancement of the behavior and regulation at heterogeneous brazing interfaces of TiAl alloys. J. Mater. Sci. 2025, 60, 24103–24128. [Google Scholar] [CrossRef]
  19. Zheng, X.; Sun, B.; Gao, G.; Wang, H.; Qi, Y.; Zhao, G.; Ren, J.; Zhang, Y. Tribological performance and failure mechanisms of soil-engaging components with brazed WC–Ni coatings. Tribol. Int. 2026, 214, 111139. [Google Scholar] [CrossRef]
  20. Habib, K.A.; Cano, D.L.; Alvaro, J.A.H.; Serrano-Mira, J.; Llopis, R.; Moreno, D.L.; Mohammed, S.S. Effects of thermal spraying technique on the remelting behavior of NiCrBSi coatings. Surf. Coat. Technol. 2022, 444, 128669. [Google Scholar] [CrossRef]
  21. Houdková, Š.; Smazalová, E.; Vostřák, M.; Schubert, J. Properties of NiCrBSi coating, as sprayed and remelted by different technologies. Surf. Coat. Technol. 2014, 253, 14–26. [Google Scholar] [CrossRef]
  22. Soffel, F.; Lin, Y.; Keller, D.; Egorov, S.; Wegener, K. Laser Remelting Process Simulation and Optimization for Additive Manufacturing of Nickel-Based Super Alloys. Materials 2021, 15, 177. [Google Scholar] [CrossRef]
  23. Zhao, Y.; Sun, J.; Guo, K.; Li, J. Investigation on the effect of laser remelting for laser cladding nickel based alloy. J. Laser Appl. 2019, 31, 22512. [Google Scholar] [CrossRef]
  24. Wu, J.; Yu, J.; Wang, W.; Gao, S.; Luo, J.; Li, C.; Ma, Z.; Liu, Y. Influences of laser remelting treatments on microstructure and tensile properties of multiphase Ni3Al-based intermetallic alloy. Mater. Sci. Eng. A 2022, 857, 144087. [Google Scholar] [CrossRef]
  25. Pascal, D.T. Development of High Temperature Vacuum Brazed WC-Co-NiP Functional Composite Coatings. Ph.D. Thesis, Politehnica University of Timișoara, Timisoara, Romania, 2017. [Google Scholar]
  26. Zouari, S.; Ghorbel, H.; Danlos, Y.; Liao, H.; Elleuch, R. Comparative Study of HVOF-Sprayed NiCrBSi Alloy and 316L Stainless Steel Coatings on a Brass Substrate. J. Therm. Spray Tech. 2019, 28, 1284–1294. [Google Scholar] [CrossRef]
  27. Jaiswal, A.K.; Govande, A.R.; Uday Venkat Kiran, K.; Ratna Sunil, B.; Dumpala, R. Effect of argon gas environment on high temperature sliding wear characteristics of NiCrBSi laser clad. Mater. Today Proc. 2023, 78, 682–687. [Google Scholar] [CrossRef]
  28. Holmberg, K.; Ronkainen, H.; Laukkanen, A.; Wallin, K. Friction and wear of coated surfaces—scales, modelling and simulation of tribomechanisms. Surf. Coat. Technol. 2007, 202, 1034–1049. [Google Scholar] [CrossRef]
  29. Archard, J.F. Contact and Rubbing of Flat Surfaces. J. Appl. Phys. 1953, 24, 981–988. [Google Scholar] [CrossRef]
  30. Kazamer, N.; Muntean, R.; Vălean, P.C.; Pascal, D.T.; Mărginean, G.; Șerban, V.-A. Comparison of Ni-Based Self-Fluxing Remelted Coatings for Wear and Corrosion Applications. Materials 2021, 14, 3293. [Google Scholar] [CrossRef]
  31. Wang, D.; Chu, J.; Qu, G.; Zhou, X. Preparation and Characterization of Laser Clad NiCrBSi Coating Reinforced with WC. J. Phys. Conf. Ser. 2021, 1965, 12110. [Google Scholar] [CrossRef]
  32. Bergant, Z.; Batič, B.Š.; Felde, I.; Šturm, R.; Sedlaček, M. Tribological Properties of Solid Solution Strengthened Laser Cladded NiCrBSi/WC-12Co Metal Matrix Composite Coatings. Materials 2022, 15, 342. [Google Scholar] [CrossRef]
  33. Muntean, R.; Vălean, P.-C.; Kazamer, N.; Uțu, I.-D.; Mărginean, G.; Șerban, V.A. Effect of Feedstock Powder Intrinsic Characteristics on the Tribological Behavior of Inductively Remelted NiCrBSi Flame-Sprayed Coatings. Lubricants 2023, 11, 363. [Google Scholar] [CrossRef]
  34. Zhao, W.-M.; Wang, Y.; Han, T.; Wu, K.-Y.; Xue, J. Electrochemical evaluation of corrosion resistance of NiCrBSi coatings deposited by HVOF. Surf. Coat. Technol. 2004, 183, 118–125. [Google Scholar] [CrossRef]
  35. Grain, A.K.; Rahman, O.S.A.; Kumari, S.; Maurya, S.S.; Kumar, K.V.; Islam, A.; Ghosh, S.K.; Keshri, A.K. Plasma-Sprayed Nanodiamond-Reinforced NiCrBSi Composite Coating for Improved Wear and Corrosion Resistance. J. Therm. Spray Tech. 2024, 33, 1055–1074. [Google Scholar] [CrossRef]
  36. Wang, Y.; Jiang, J.; Chi, Y.; Mao, X.; Zhu, L.; Dong, Y.; Yang, Y.; He, J. Effect of heat treatment temperature on the microstructure and wear corrosion properties of NiCrBSi–TiN composite coatings. Ceram. Int. 2022, 48, 6933–6941. [Google Scholar] [CrossRef]
Figure 1. Schematic overview of brazing tape manufacturing and subsequent laser remelting (based on [25]).
Lubricants 14 00142 g001
Figure 2. Temperature curve and segments for vacuum treatment of brazing tapes (based on [25]).
Lubricants 14 00142 g002
Figure 3. Scanning electron microscopy (SEM) top-view images of (a) Fe-based 316L and (b) Ni-based NiCrBSi powder particles.
Lubricants 14 00142 g003
Figure 4. SEM cross-section images of (a) Fe-based 316L and (b) Ni-based NiCrBSi powder particles.
Lubricants 14 00142 g004
Figure 5. Confocal laser scanning microscopy (CLSM) as a comparison of quality: hood remelting quality, exhibiting no significant defects, based on sample S3-C: (a) top view and (b) 3D-perspective image; medium remelting quality, exhibiting minor number of defects, based on sample S3-E: (c) top view and (d) 3D-perspective image; bad remelting quality, exhibiting significant number of defects, based on sample S2-C: (e) top view and (f) 3D-perspective image. Micropores are circled in orange and macropores in blue.
Lubricants 14 00142 g005
Figure 6. CLSM cross-section images of samples: (a) S3-C; (b) S3-D; (c) S3-E; (d) S3-F; and (e) as-brazed reference. Porosity is circled in purple, and residual voids from brazing tapes are in blue. (f) Percentage area of defects in the respective samples. The green dashed line shows the remelting depth.
Lubricants 14 00142 g006
Figure 7. Microhardness (HV1) evolution of as-brazed reference sample, remelted samples S3-C and S3-F, and substrate (5 measurements in each area).
Lubricants 14 00142 g007
Figure 8. Coefficient of friction (COF) measured for the as-brazed and remelted samples (each measurement was repeated three times with similar curve progression).
Lubricants 14 00142 g008
Figure 9. (a) CLSM image showing breakout within wear track of remelted sample and corresponding profile analysis to visualize its depth (blue line). (b) Sample and ball wear rate for as-brazed and remelted samples.
Lubricants 14 00142 g009
Figure 10. X-ray diffraction (XRD) diffractograms of the remelted and as-brazed samples.
Lubricants 14 00142 g010
Figure 11. Semi-logarithmic current density-potential curves of as-brazed and remelted samples in 3.5% NaCl solution. The remelted sample tends to repassivate in the anodic region, while the as-brazed sample exhibits an increased current density.
Lubricants 14 00142 g011
Table 1. Chemical composition (in wt.%) of the powders (n. a. = not available–the powder manufacturers did not provide any data on the associated elements; Bal. = balance).
PowderBCCoCrFeMnMoNiPSiOther
NiCrBSi powder2.420.460.1110.243.52n. a.3.33Bal.<0.013.320.12
Stainless-steel powdern. a.n. a.n. a.17.5Bal.1.52.212n. a.0.2n. a.
Table 2. Laser remelting parameters of brazed tapes.
ParameterUnitValue
Laser power[W]150
250
350
Scanning speed[mm/s]500
250
125
Hatch distance[mm]0.02
0.04
0.06
Scanning direction-Bidirectional
Scan area[cm2]1
9 1
Shielding gas-Argon 4.6
Purity of shielding gas[%]99.996
Laser wavelength[nm]1064
Laser focal spot diameter[µm]48
Coating thickness 2[µm]687.5 ± 44.9
1 The 9 cm2 remelting was used for the as-brazed vs. remelted comparison. 2 The high standard deviation results are due to the uneven as-brazed surface.
Table 3. Test parameters for pin-on-disc (POD) measurement.
ParameterUnitValue
Ball material[-]WC-Co
Ball diameter[mm]6
Load[N]10
Linear Speed[cm/s]15
Laps[-]15,000
Wear track diameter[mm]6
Total test length[m]282.75
Effective Stop condition 1[-]laps
Temperature[°C]22.8
Lubricant[-]None
1 The pin-on-disc experiment was stopped after reaching 15,000 laps.
Table 4. Remelting parameters and associated energies of brazing tapes sorted by hatch distances (S1-series hatch distance, 0.06 mm; S2-series hatch distance, 0.04 mm; S3-series hatch distance, 0.02 mm).
No.Laser Power
[W]
Scan Speed
[mm/s]
Hatch Distance
[mm]
Area Energy 1
[J/mm2]
S1-A1505000.065.0
S1-B2505000.068.33
S1-C3505000.0611.67
S1-D1502500.0610.0
S1-E2502500.0616.67
S1-F3502500.0623.33
S1-G1501250.0620.0
S1-H2501250.0633.3
S1-I3501250.0646.67
S2-A1505000.047.5
S2-B2505000.0412.5
S2-C3505000.0417.5
S2-D1502500.0415.0
S2-E2502500.0425.0
S2-F3502500.0435.0
S2-G1501250.0430.0
S2-H2501250.0450.0
S2-I3501250.0470.0
S3-A1505000.0215.0
S3-B2505000.0225.0
S3-C3505000.0235.0
S3-D1502500.0230.0
S3-E2502500.0250.0
S3-F3502500.0270.0
S3-G 11501250.0260.0
S3-H 12501250.02100.0
S3-I 13501250.02140.0
1 Not investigated remelting procedure unstable.
Table 5. Evaluation of CLSM top-view images based on score system presented in Section 2: None = no defects in the evaluated category present, Low/Good = small number of defects (maximum of 15 micropores; absence of macropores; absence of cracks; uniform surface with a maximum total height difference of 50 µm), Medium = moderate number of defects (15 to 30 micropores; maximum of 5 macropores; maximum of 5 cracks; slightly uneven but generally uniform surface with a total height variation of 50 to 80 µm), High/Bad = high number of defects (more than 30 micropores; more than 5 macropores; more than 5 cracks; uneven surface with a total height variation exceeding 80 µm).
No.Crack
Rating
ScoreMacropore
Rating
ScoreMicropore
Rating
ScoreSurface
Evaluation
ScoreTotal
Score
Total Three-Level Quality
S1-AHigh0Medium0.5High0Bad00.5Bad
S1-BHigh0Medium0.5High0Bad00.5Bad
S1-CHigh0High0High0Medium0.50.5Bad
S1-DHigh0Medium0.5High0Medium0.51Bad
S1-EHigh0Medium0.5High0Bad00.5Bad
S1-FHigh0Medium0.5High0Bad00.5Bad
S1-GHigh0High0High0Bad00Bad
S1-HHigh0High0High0Bad00Bad
S1-IHigh0High0High0Bad00Bad
S2-AHigh0Medium0.5High0Bad00.5Bad
S2-BHigh0High0High0Bad00Bad
S2-CHigh0High0High0Bad00Bad
S2-DHigh0High0High0Medium0.50.5Bad
S2-EHigh0Medium0.5High0Bad00.5Bad
S2-FHigh0High0High0Medium0.50.5Bad
S2-GHigh0High0High0Medium0.50.5Bad
S2-HHigh0High0High0Bad00Bad
S2-IHigh0High0High0Bad00Bad
S3-AHigh0High0Medium0.5Medium0.51Bad
S3-BMedium0.5Medium0.5Medium0.5Bad01.5Bad
S3-CNone2Medium0.5Low1Good14.5Good
S3-DMedium0.5Medium0.5Medium0.5Good12.5Medium
S3-EMedium0.5Medium0.5Low1Good13Medium
S3-FNone2None2Low1Good16Good
S3-G 1---------Bad
S3-H 1---------Bad
S3-I 1---------Bad
1 Not investigated remelting procedure unstable.
Table 6. Corrosion potential, corrosion current density, and corrosion rate of as-brazed and remelted sample (with corrosion potential, Ecorr; corrosion current density, icorr; and corrosion rate, CR; the latter was determined using the VoltaMaster 4 software).
SampleEcorr [mV]icorr [µA/cm2]CR [µm/y]
As-brazed−234−0.7448.63
Remelted−296−0.2012.33
Disclaimer/Publisher’s Note: The statements, opinions and data contained in all publications are solely those of the individual author(s) and contributor(s) and not of MDPI and/or the editor(s). MDPI and/or the editor(s) disclaim responsibility for any injury to people or property resulting from any ideas, methods, instructions or products referred to in the content.