Abstract
In aeronautic industry applications, multi-branch oil jet nozzles are commonly employed to supply lubricating oil, ensuring adequate thermal regulation and friction control for high-speed gears or bearings. The geometric and operational parameters of these nozzles significantly affect the internal flow dynamics and discharge coefficient characteristics. This study presents a numerical investigation into the flow behavior and discharge coefficient of multi-branch oil jet nozzles under typical pressure conditions (0–0.5 MPa) for various orifice sizes and angles. Then, compared to the original theoretical method, the pressure correction equation leveraging the fitting curve method is determined to improve the prediction accuracy of the theoretical method of oil mass flow rate and enhanced by over an order of magnitude. Furthermore, the flow behavior and mass flow properties of multi-branch nozzles, featuring various configurations and distinct orifice angles, are also investigated amply by comparing the numerical and theoretical findings.
1. Introduction
In aeronautic industry applications, oil jet nozzles are widely used to supply lubricating oil for the lubrication and cooling of high-speed gears or bearings by an extraordinary amount of multi-branch holes—usually the orifices, as shown in Figure 1. Some very minor changes in pressure differential Δp between the nozzle inlet pressure p1 and the orifice outlet pressure p2 and other geometrical parameters can cause a remarkable variation in the mass flow in the lubricating system. The insufficiently supplied oil for high-speed gear or bearing can not dissipate the generated heat in time extremely easy to cause the thermal scuffing and scoring failures. Conversely, excess oil means greater parasitic power losses caused by the fluid media and the revolution parts and a larger lubrication capacity. In light of this, to better estimate and understand the internal flow through the oil jet nozzles is of great importance.
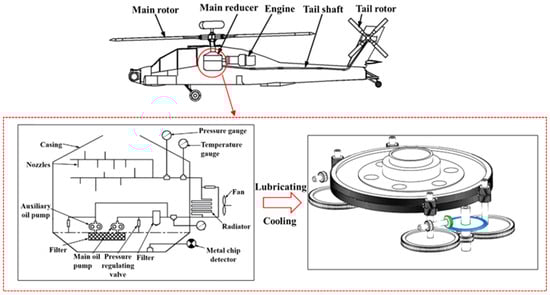
Figure 1.
Lubricant supply based on multi-branch oil jet nozzles.
The discharge coefficient Cd for incompressible non-cavitation fluids as defined in Equation (1) quantitatively weighs the flow capacity of a single-orifice nozzle. This discharge coefficient is the quotient between the measured mass flow and the theoretical mass flow predicted by Bernoulli’s Equation [1]:
As for the compressible fluids, the discharge coefficient Cd is changed to be expressed as in Equation (2), a similar equation is derived by Parker and Kercher [2].
According to the Buckingham π theorem [3], the main parameters that affect the discharge coefficient are the pressure difference Δp, the ratio of the orifice and the nozzle diameter d/D and the ratio of the chamfer length and the nozzle diameter l/D. Lichtarowicz et al. [1] conducted extensive experiments on the long orifice with a high predictable performance and the discharge coefficient Cd is experientially summarized with the Reynolds number Re in the range of 10–20,000 (10 ≤ Re ≤ 20,000) and l/D in the range of 2–10 under non-cavitation conditions.
And
For Re > 20,000, the discharge coefficient Cd is substantially constant. The same conclusion has been reached in terms of the steady compressible flow under a high Reynolds number [4,5]. American Standard [6] provides the theoretical equations to predict the discharge coefficient as the function of the diameter ratio d/D and the Reynolds number Re for the flange tap and corner tap.
And
There is a lot of research on the influence of the structure parameters of orifice exit and nozzle inlet on the discharge coefficient for incompressible flow under non-cavitation conditions, such as Kent et al. [7] on the entrance shape of the nozzle, Ohrn et al. [8] on the orifice radius, Chen et al. [9], Desantes et al. [10], Du et al. [11] on the spray characteristics. More than that, the effect of the operating conditions including the back pressure of the surroundings and the pressure ratio of the orifice exit to nozzle inlet have been investigated by Yu [12] and Tharakan [13]. As injection pressure gets higher, the cavitation phenomenon gradually emerges and seriously affects the discharge coefficient, a lot of comprehensive investigation and analysis have been performed by researchers [14,15,16,17,18,19,20] on fuel oil atomization combining the experimental and numerical techniques.
CFD (computational fluid dynamics) numerical simulation technique has been widely used to deeply reproduce and understand the detailed internal flow field of the nozzle [21,22,23,24,25]. Payri et al. [26,27] offered contrastive analyses of the flow parameters under different flow regimes (laminar, transition, or turbulent) for three convergent diesel injector nozzles. Liu et al. [28] numerically and experimentally investigated the atomization characteristics of the nozzle in the main reducer of a helicopter, they revealed that the atomization effect would benefit from the increasing air pressure. Zhong et al. [29] analyzed the quantitative relation between geometry parameters, operating conditions (inlet pressure, jet velocity), and the degree of deviation by leveraging the CFD technique with the volume of fluid (VOF) method. Jiang et al. [29,30] derived the orifice angle coefficient to refine existing empirical discharge coefficient formulas, thereby improving the accuracy significantly.
While the impact of geometric and operational parameters on a single-branch nozzle has been partially examined. Even so, there is still little research on the in-depth understanding of the pressure effect regarding the flow dynamics and discharge coefficient properties of the single-branch nozzle, as well as the multi-branch nozzles commonly found in the main reducer of the helicopters for lucubrating and cooling the high-speed gears and bearings. Therefore, the principal aim of this study is to investigate the pressure influence on the discharge coefficient of the nozzle by using the CFD method. Then, the theoretical equations are improved by integrating them with the pressure-corrected equation. Finally, the flow behavior and mass flow properties of multi-branch nozzles, featuring various configurations and distinct orifice angles, are further elucidated by combining the numerical and theoretical analysis.
2. Numerical Methods
2.1. Governing Equations
Discharging lubricating oil from a nozzle into the ambient atmosphere commonly results in a characteristic oil–gas two-phase flow phenomenon. As the injection jet gradually attains a stable flow state, this paper adopts the volume-of-fluid (VOF) multiphase flow method to obtain phase-specific outcomes and simulate the oil-gas interface. The continuity and momentum equations and the tracking of the volume fraction of the VOF model are as follows:
where is the density of the oil-gas mixture; is the pressure; and are Cartesian coordinate components; and are absolute velocities; and are the dynamic viscosity of the oil-gas mixture and turbulent viscosity; and are the volume fractions of oil and gas; and are the kinetic viscosity of oil and gas.
When the oil is discharged into the air through the nozzle, the high injection speed and the pressure difference cause the state of the oil to shift from laminar to turbulent. Laminar flow transitions to turbulence once the Reynolds number exceeds a certain threshold. Direct numerical simulation (DNS) is not feasible for such turbulent flows because it requires resolving eddies across a wide range of length and time scales at high Reynolds numbers. To address the turbulence issue, the unsteady Reynolds-averaged Navier–Stokes (RANS) method is adopted to solve the governing equations. In analyzing the oil jet nozzle flow, the shear stress transport (SST) model is utilized to achieve turbulence closure. The SST Turbulence model is detailed as follows:
where is the turbulent kinetic energy generation term; is the generation term of ; and are the dissipation terms of and ; and are the user-specified source terms; is the cross-dissipation term.
The above SST turbulence model combined with the VOF method can effectively simulate the oil jet nozzle flow and obtain the related flow field characteristics.
2.2. Numerical Setup
To ensure the accuracy and reliability of the numerical model, it is essential to define an appropriate fluid domain and apply suitable boundary conditions. The numerical model utilized in this study is illustrated in Figure 1. The inlet and outlet boundaries are specified as pressure inlet and pressure outlet, respectively, while all other boundaries are designated as wall surfaces. The inlet pressure of the nozzle inlet is specified within the range of 0.1–0.5 MPa, while the outlet pressure is set to 0 MPa. Throughout the computational analyses, oil and gas are treated as incompressible fluids, each maintaining a constant density and viscosity. The lubricating oil utilized in the simulation has a density of 990.8 kg/m3 and a viscosity of 37.98 mm2/s. The gas is air with a density and viscosity of 1.184 kg/m3, and 0.01855 mm2/s, respectively.
The oil jet nozzle model is classified into three general configurations, as illustrated in Figure 2: single jet nozzle, double jet nozzle, and multiple jet nozzle. For the single jet nozzle model, the orifice angle varies between 0° to 90°, with an inlet diameter D of 4 mm, an orifice diameter d of 1 mm, and an orifice length L of 4.7 mm. In the double jet nozzle model, the interval length Δl between nozzles is 10 mm, while D, d, and remain consistent with the single jet nozzle model. The detailed parameters for this configuration are presented in Table 1. In contrast, the multiple-nozzle design fixes the orifice angle at 90° and retains L at 4.7 mm. Under this configuration, the inlet diameter D ranges from 4 mm to 6 mm, the orifice diameter d varies between 0.67 mm and 1 mm, and the interval length Δl between nozzles spans from 5 mm to 30 mm. The specific parameters for the multiple jet nozzle model are provided in Table 2.
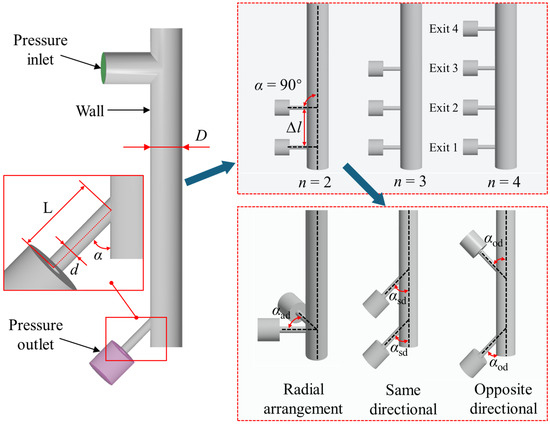
Figure 2.
Numerical model and boundary conditions.

Table 1.
Geometric parameters of double jets nozzle.
Table 2.
Geometric parameters of multiple jets nozzle.
2.3. Validation of Numerical Method
The meshing scheme employed for the numerical simulations is presented in Figure 3. To achieve more accurate numerical results, the use of an appropriate grid size and localized grid refinement is essential. As shown in Figure 3, mesh refinement is applied near the orifice in this study to precisely resolve the flow field attributes of the lubricating oil ejected from the pipeline. Additionally, a mesh independence study was performed to ensure the reliability of the simulation results. Three different mesh densities were utilized for this purpose: the coarse mesh comprised 3.64 × 10⁵ cells, the medium mesh contained 6.95 × 10⁵ cells, and the refined mesh consisted of 12.59 × 10⁵ cells.
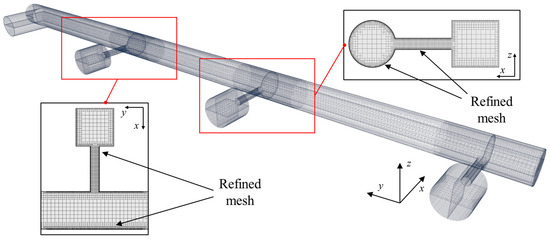
Figure 3.
Diagram of the mesh detail.
Figure 4 illustrates the flow velocity and mass flow rate of the oil discharged from the nozzle farthest from the inlet under different grid schemes, with an inlet pressure of 0.5 MPa applied during the numerical simulations. As the simulation progresses, the jet flow gradually stabilizes over time. When the mesh is coarse, the results deviate significantly from those obtained with finer grids. However, the mass flow rate results for the Middle and Refined mesh schemes are in close agreement, indicating that further grid refinement has a negligible effect on the accuracy of the results. Considering the trade-off between computational accuracy and resource efficiency, the Middle mesh scheme is selected for the subsequent simulations in this study.
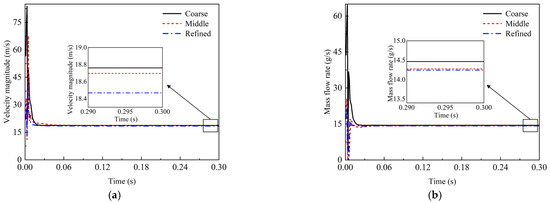
Figure 4.
Mesh independence verification: (a) Velocity of Jet nozzle; (b) Mass flow rate of Jet nozzle.
In numerical simulations, if the outlet boundary is positioned too close to the main flow region, the prescribed pressure boundary may not align with the actual flow conditions, potentially compromising numerical stability and the reliability of the results. Therefore, selecting an appropriate external flow domain is crucial. As shown in Figure 5, the external flow domain in this study is defined as a cylindrical region. By comparing different sizes of the external flow domain, it was observed that the absence of an external flow domain leads to significant errors in the mass flow rate results at the nozzle. In contrast, simulations with an external flow domain produced more consistent results. Considering the balance between computational performance and grid size, this study adopts a cylindrical external flow domain with a base radius of 2 mm and a height of 4 mm.
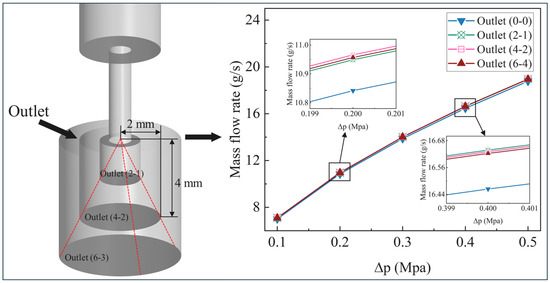
Figure 5.
Outlet independence verification.
3. Experiments and Analysis
Verification of Numerical Method
Experimental data measured by Jiang et al. [30] are adopted to confirm the precision and dependability of the numerical approach detailed in Section 2, specifically regarding the discharge coefficient and mass flow behavior for the orifices of the oil jet nozzle. The calculations based on the empirical equations derived by Lichtarowicz et al. [1] and the improved theoretical equations integrating the empirical equations derived by ASME Standards Technology [6] and the angle coefficient Cα by Jiang et al. [30] are also superimposed in Figure 6. The angle coefficient Cα is determined as:

Figure 6.
Comparison of numerical results and experimental or theoretical results for the single orifice of oil jet nozzle (α = 0°): (a) discharge coefficient; (b) mass flow rate [1,6,30].
The main geometry parameters of the oil nozzle in Table 1 are consistent with the physical model in the experiment, The orifice angle between the nozzle axis and the orifice axis is 0°. As shown in Figure 6, the numerical results agree well with experimental values, as well as the theoretical results calculated from the comer tap equations in ASME Standards Technology [6]. Adjusting the pressure difference Δp from 0.10 MPa to 0.50 MPa, the average and maximum deviations between the numerical values and experiments are 5.74% and 10.70%, respectively. As for the theoretical results of the improved comer tap equations, the average and maximum deviations are 8.79% and 27.00%, respectively. The curves predicted by the theoretical equations from Lichtarowicz et al. [1] or the empirical equations of ASME Standards Technology [6] integrating the angle coefficient are in near lines and not affected by the pressure difference, while the experimental and numerical results vary with the pressure difference. It is concluded that the thermotical and numerical methods are capable of predicting highly accurate results in oil jet nozzles, except for the theoretical model in the cases of low-pressure difference.
Figure 7 compares the discharge coefficient and the corresponding mass flow rate derived from simulations and determined using the improved equations in Equations (1), (6) and (14) under different pressure differences Δp (0.1~0.5 MPa) and orifice angle (0~90°). As presented in Figure 7, the general tendency of the calculated flow rate based on the improved theoretical equations matches well with that of the numerical values, with a very small average relative difference of approximately 5.3%. After the lower pressure difference results (Δp = 0.1 MPa)) are removed, the average relative difference is less than 3.6%, and the maximum difference is about 10%. It is suggested that the proposed numerical method can be used to estimate the oil jet nozzle’s mass flow rate, as well as the improved theoretical equations for single-orifice configurations under a range of orifice angles and pressure variations.
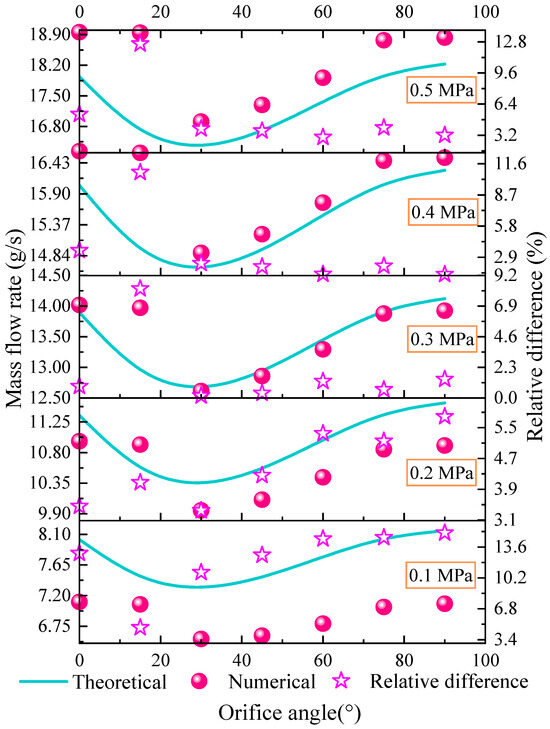
Figure 7.
Comparison of numerical results and theoretical mass flow rate for the single orifice of oil jet nozzle (α = 0~90°, Δp = 0.1~0.5 MPa).
Figure 8 illustrates the effect of different orifice angles on the pressure distribution in the outlet region under a pressure difference of 0.5 MPa. As the orifice angle varies, the distribution of high-pressure and low-pressure regions also changes. At 0°, a uniformly distributed low-pressure zone lies adjacent to a high-pressure region. However, at 30°, the high-pressure zone migrates toward the upper section of the orifice, while low pressure occupies the lower section, creating a pronounced gradient between these two regions. Different pressure variations directly influence the flow rate through the orifice, and the effective area significantly affects the flow rate as well. As depicted in Figure 9, the inlet area of the orifice at a 30° angle is noticeably larger than that at other angles. This leads to pronounced differences in the directional changes of the liquid velocity. At this angle, the liquid flow converges as the orifice narrows, resulting in a sudden reduction in the effective fluid area. Consequently, the flow velocity increases rapidly, and the convergence of liquid velocities from different directions forms regions of high and low velocity. Regions where the liquid velocity direction deviates substantially from the orifice diameter direction become low-velocity regions.
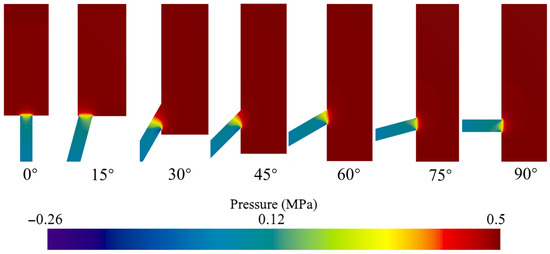
Figure 8.
Pressure distribution of oil jet nozzle under various orifice angles.

Figure 9.
Velocity streamlines of oil jet nozzle under various orifice angles.
The presence of high-velocity and low-velocity regions within the orifice results in a non-uniform fluid velocity at the outlet. Figure 10 illustrates how the velocity distribution across the outlet cross-section changes with varying orifice angles. The velocity distribution achieves the highest uniformity at an orifice angle of 0°. When the orifice angle of 30°, the velocity in the upper part of the orifice is significantly higher. As the orifice angle approaches 90°, the velocity distribution gradually becomes uniform again. The outlet fluid velocity of the orifice directly impacts the mass flow rate. As illustrated in Figure 7, the mass flow rate is highest at orifice angles of 0° and 90°, while it is lowest at an orifice angle of 30°.
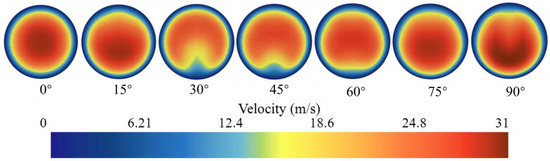
Figure 10.
Velocity distribution of orifice outlet under various orifice angles.
4. Results and Discussions
4.1. Internal Flow and Mass Flow Rate of Multi-Branch Oil Jet Nozzles
Figure 11, Figure 12 and Figure 13 show the total mass flow rate of the two, three, four orifices of the oil nozzle with the orifices angle of 90° (i.e., the nozzle axis is perpendicular to the orifice axis) versus orifice spacing distance (Δl = 5 mm, 10 mm, 30 mm) under various pressure differences (Δp = 0.1 MPa, 0.2 MPa, 0.3 MPa, 0.4 MPa, 0.5 MPa). Typical growth behavior of mass flow rate with the increasing pressure between the nozzle inlet and orifice outlet is observed, being agreeable with Equation (1). An important observation is that the orifice spacing distance has a significant impact, regardless of whether the oil nozzle has two, three, or four orifices. As shown in Figure 7, the mass flow rate is primarily influenced by the pressure difference, orifice angle, orifice and nozzle diameters, and the orifice spacing distance. The former factors, including the orifice angle and the diameters of the orifice and nozzle, can cause substantial local head loss, thereby reducing the flow rate. In contrast, the orifice spacing distance also plays a crucial role in determining the flow rate, with a larger spacing distance resulting in a higher mass flow rate. Compared to the numerical flow rate in Figure 7, Figure 11, Figure 12 and Figure 13 another important finding is observed that the mass flow rate of the multi-branch (the number of orifices Nm is equal to 2, 3, 4) oil jet nozzles is nearly Nm times of that of single branch nozzle.
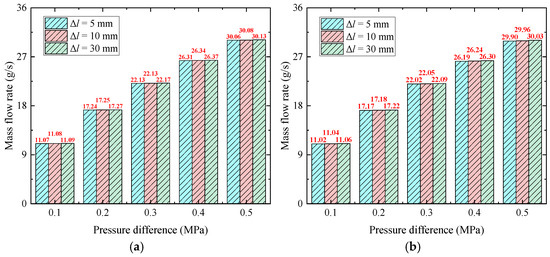
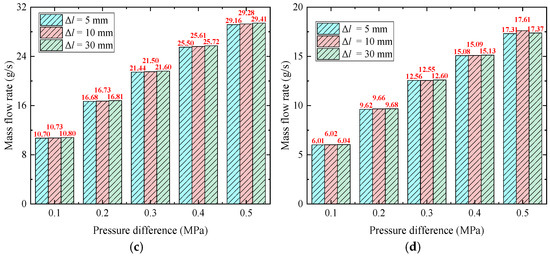
Figure 11.
Mass flow rate versus spacing distance under different pressure differences for dual-branch oil jet nozzles: (a) d/D = 1/6; (b) d/D = 1/5; (c) d/D = 1/4; (d) d/D = 0.8/4.
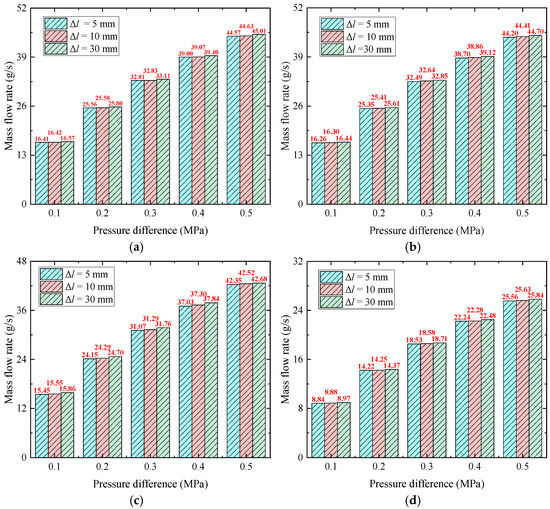
Figure 12.
Mass flow rate versus spacing distance under different pressure differences for tris-branch oil jet nozzles: (a) d/D = 1/6; (b) d/D = 1/5; (c) d/D = 1/4; (d) d/D = 0.8/4.
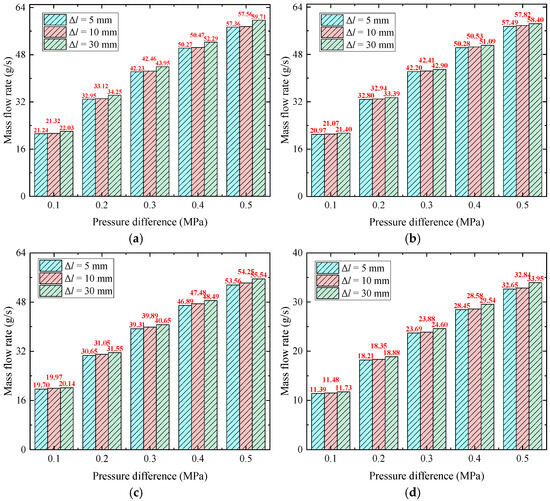
Figure 13.
Mass flow rate versus spacing distance under different pressure differences for tetrad-branch oil jet nozzles: (a) d/D = 1/6; (b) d/D = 1/5; (c) d/D = 1/4; (d) d/D = 0.8/4.
Moreover, Figure 14 presents the distributed mass flow of different branch exits of the orifice for the oil jet nozzle under various spacing distance Δl and pressure difference Δp. It is shown that while the spacing distance is increased, the mass flow of all branches increases gradually along the liquid flowing direction. This flow-changing trend is possibly a result of the combined action of the common chamber and the frictional head loss. As Figure 14a,b depict, the common chamber architecture may facilitate the pressure recovery, the greater the spacing distance Δl, the longer the recovery area, the less turbulent pressure loss caused by the inside flow, the higher the oil mass flow rate, the specific pressure change along the nozzle axis is shown in Figure 15. However, too long a spacing distance will lead to an evident negative consequence of the frictional head loss proportional to the spacing distance (see Figure 14c). Compared the spacing distance of 5 mm and 30 mm with the pressure distance of 0.5 MPa for exit 3, the flow difference reaches up to 8.467 kg/h, this visible difference will be even harder to ignore.


Figure 14.
Mass flow rate of different orifices versus spacing distance under different pressure differences: (a) dual-branch; (b) trios-branch; (c) tetra-branch.
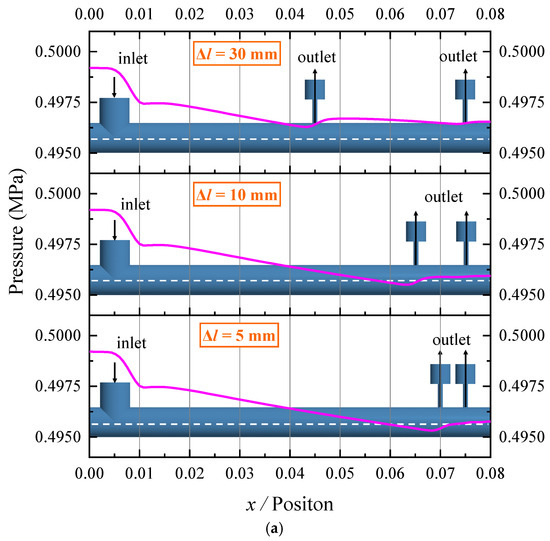
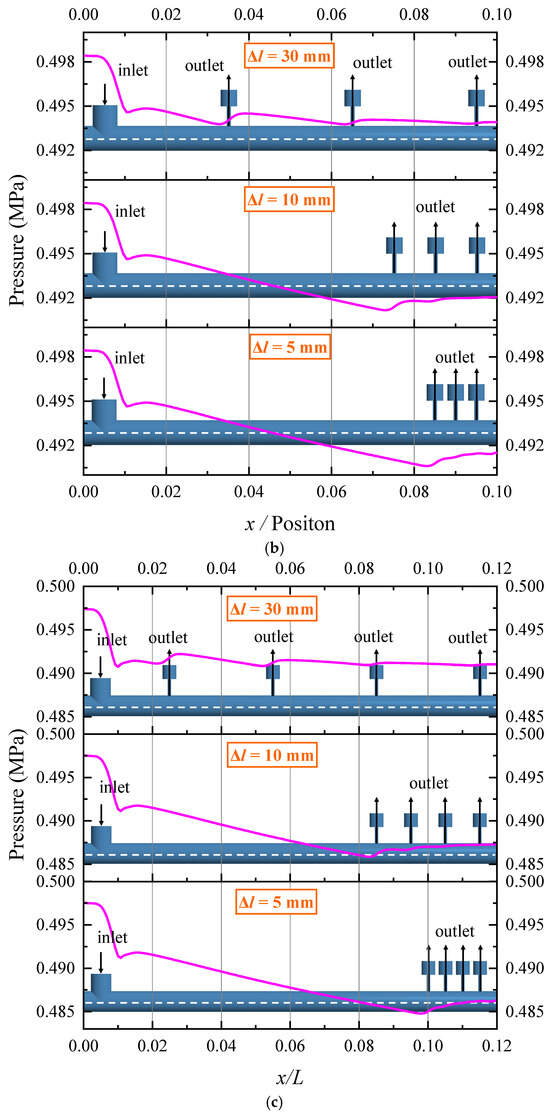
Figure 15.
Internal pressure distribution on the central axis of the common chamber: (a) dual-branch; (b) trios-branch; (c) tetra-branch. The purple line represents the “internal pressure”.
This phenomenon can be explained by the pressure variation behavior within the common chamber. As illustrated in Figure 15, the common chamber acts as a pressure recovery-type structure. With a larger spacing distance, the recovery zone becomes longer, leading to a more gradual pressure recovery and a reduction in turbulent pressure loss caused by internal fluid flow. Consequently, the pressure at the nozzle outlet increases with spacing distance, which enlarges the pressure difference relative to atmospheric pressure and thus enhances the nozzle flow rate. For example, as shown in Figure 15c, when the spacing distance Δl is 30 mm, the nozzle pressure is significantly higher than that at 5 mm, resulting in a larger mass flow rate, as also evidenced in Figure 14c.
4.2. Flow Coefficient Analysis
The following section presents the discharge coefficient obtained from the mass flow rate of the multi-branch nozzle. As discussed in Section 4.1, the spacing distance has very little influence on the total mass flow rate, thereby the average mass flow rate is instead to be further explored.
Figure 16 compares the discharge coefficient of a single branch nozzle under different pressure differences and orifice angles. The discharge coefficient increases slightly as the inlet pressure rises, not a straight line as theoretically calculated by Equation (6). The amplitude of variation in discharge coefficient far below that of variation in pressure difference suggested that the mass flow rate is primarily controlled by the pressure difference between the inlet and outlet pressure rather than the discharge coefficient. Another observation revealed that the both orifice angle and pressure difference will affect the discharge coefficient. At the same pressure level, the discharge coefficient first decreases with the increment of the orifice angle (0° < α < 30°), and then begins to rise as the orifice angle continues to increase (30° < α < 90°). Similar behavior has been discussed in Section 3 and the corresponding empirical equation in Equation (14) expressing a relationship between the discharge coefficient and orifice angle is derived by Jiang et al. [30]. Although the influence of orifice angle has been quantificationally predicted, there are considerable differences caused by the pressure difference, especially at low-pressure condition. In such a case, it is likely attributed to the nonuniform velocity distribution shown in Figure 16, along with the intensified friction or impact loss within the multi-branch nozzle.
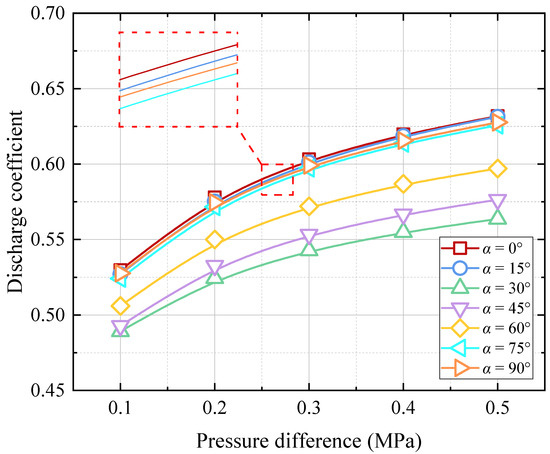
Figure 16.
Changing laws of discharge coefficient against orifice angle and pressure differences.
To cover the shortage created by the pressure effect, a modified equation is developed to predict the discharge coefficient under various conditions based on the existing theoretical equations in Equations (6) and (14) considering the orifice angle effect. The pressure correction coefficient is a function that depends on the pressure difference, then the pressure correction coefficient related to the pressure difference is normalized by dividing the original theoretical results. Figure 17 presents the correction coefficient values with an orifice angle of 0°, 45°, and 90° versus different pressure differences. The curve fitting method leveraging the MATLAB platform (version R2021b) is used to deal with the normalized data, thereby a correction equation for estimating the pressure coefficient Cp as a power function of pressure difference Δp, expressed as:
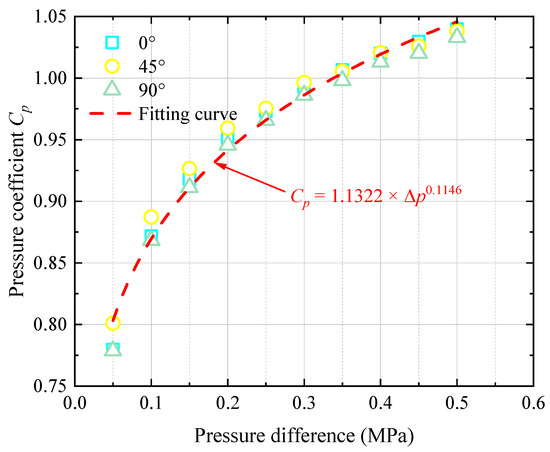
Figure 17.
Pressure coefficient against pressure difference.
Integrating the pressure coefficient Cp, angle coefficient Cα derived by Jiang et al. [30], and the original discharge coefficient Cd proposed in [6], the discharge coefficient is improved as:
4.3. Verification of Corrected Discharge Coefficient
4.3.1. Verification of the Improved Method for Single Branch Nozzle
To further explore the rationality and effectivity of this fitting equation in Equation (15) characterizing the pressure effect on the discharge coefficient, the improved theoretical predictions of mass flow rate according to Equations (1), (6), (14) and (15) is compared with the numerical results when the orifice angle is 60° and 75°, as shown in Figure 18. The curve of improved theoretical predictions of mass flow rate is almost identical with that the point of numerical flow rate. More specifically, the maximum and average errors with the orifice angle of 60° are less than 1.5% and 0.7%, and the maximum and average errors with the orifice angle of 75° are approximately 1.0% and 0.5%. Compared with Figure 7, both the maximum and average errors are at least one order of magnitude lower than the relative errors between the original theoretical and numerical values. The very small error suggests that the introduction of the pressure coefficient can further improve the prediction performance of the theoretical method for mass flow rate, it also validates again the reliability and rationality of the pressure coefficient obtained by fitting curves and can be capable of estimating the mass flow rate of the nozzle under different pressure and angle conditions.

Figure 18.
Comparison of improved theoretical and numerical mass flow rate: (a) α = 60°; (b) α = 75°.
Meanwhile, a comparison of numerical and improved theoretical mass flow rate versus different orifice angles and pressure differences are presented in Figure 19. As observed, the improved theoretical predictions are more conformed with the numerical than the original theoretical method not considering the pressure effect. The average relative error is about 2% in Figure 19. It is indicated that the proposed improved theoretical equations can be used to high-precisely estimate the mass flow for single branch nozzles with various pressure differences and orifice angles.
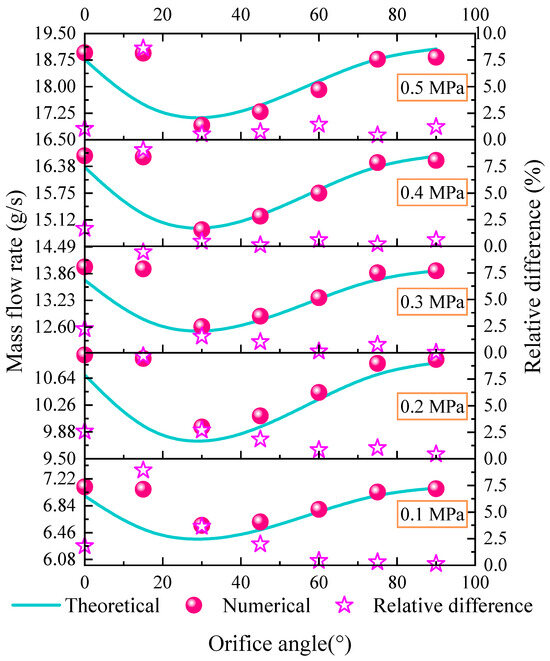
Figure 19.
Comparison of numerical results and improved theoretical mass flow rate for the single orifice of oil jet nozzle (α = 0~90°, Δp = 0.1~0.5 MPa).
4.3.2. Verification of the Improved Method for Multi-Branch Nozzle
In actual aeronautic industry applications, the exit diameter of the multi-branch nozzles is designed and manufactured based on the specific oil mass flow rate requirements. The developed improved equation of pressure coefficient is used to predict the oil mass flow rate of the multi-branch nozzle for exploring its applicability after changing the number of branch and structure parameters. As discussed in Section 4.1, the total oil mass flow rate of the multi-branch nozzle is proportional to the number of branch (orifice) Nm, the discharge coefficient is instead by:
Figure 20, Figure 21 and Figure 22 exhibit the changes in oil mass flow rate of the multi-branch nozzle under different pressures after changing the diameter ratio with the orifice angle of 90° for each branch. Each figure directly compares the numerical oil mass flow rate and theoretical results calculated by Equations (1), (6), (14) and (15). The first observation is that the overall trend of the mass flow rate under different pressure conditions can be estimated well by the improved theoretical equations with different structural parameters, with a maximum relative error of about 15%. Compared with the predictions by the original equations only considering the angle coefficient, the average error of the proposed method is significantly reduced from 8.2% to 4.7% for the dual-branch nozzle with the diameter ration of 1/5, from 7.7% to 4.1% for the dual-branch nozzle with the diameter ration of 1/6. It is revealed that the pressure effect on the discharge coefficient is still important. The error of the dual-branch nozzle is obviously greater than that of the single-branch nozzle, as well as the trio-branch and tetra-branch nozzles. That means that the local pressure loss is increasing as the number of branches (orifice) for the nozzle and resulting in the reduction of the actual oil mass flow rate together with a larger prediction error. As the nozzle diameter is set to 6, 5 and 4, the average errors are 4.1%, 4.7% and 7.8% for the dual-branch nozzle in Figure 20, respectively. A similar diurnal trend of oil mass flow rate can be observed in Figure 21 and Figure 22. This could be explained by the increase in the turbulence intensity of the two-phase flow inside the nozzle and the local pressure loss while the orifice diameter is reduced. Even so, the empirical correlation proposed in this paper could still be used to estimate the oil mass flow rate for multi-branch nozzles with different pressure and structure parameters.
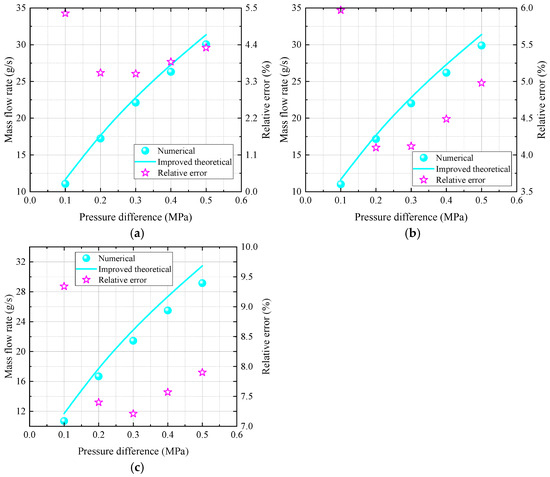
Figure 20.
Oil mass flow rate versus pressure is different under different nozzle parameters for dual-branch nozzle: (a) d/D = 1/6; (b) d/D = 1/5; (c) d/D = 1/4.
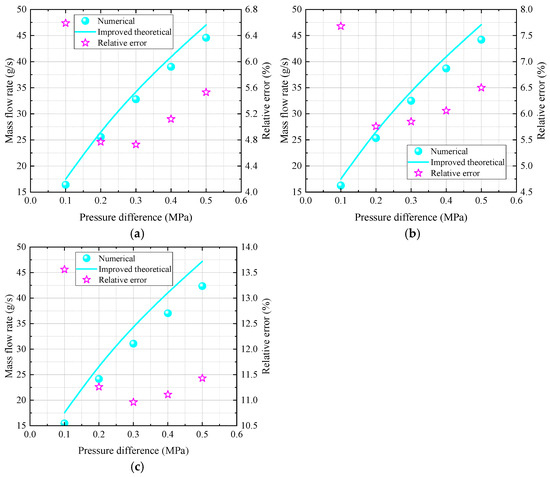
Figure 21.
Oil mass flow rate versus pressure is different under different nozzle parameters for trio-branch nozzle: (a) d/D = 1/6; (b) d/D = 1/5; (c) d/D = 1/4.
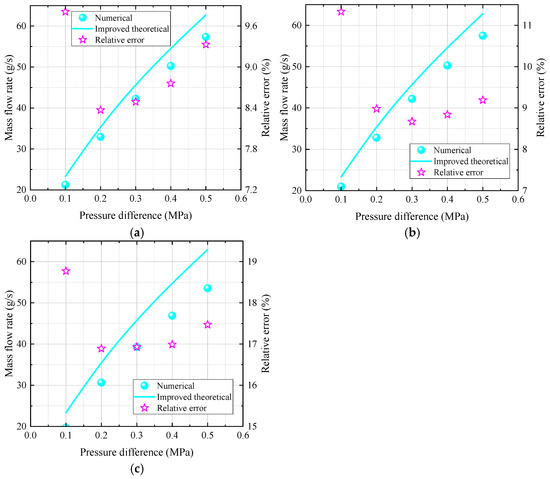
Figure 22.
Oil mass flow rate versus pressure is different under different nozzle parameters for tetra-branch nozzle: (a) d/D = 1/6; (b) d/D = 1/5; (c) d/D = 1/4.
4.3.3. Verification for Dual-Branch Nozzle with Various Orifice Angle
In industry applications, the branch of the orifice may be in the same direction (sd), opposite direction (od), and radial arrangement (rd), as shown in Figure 23. Figure 24 presents the pressure distribution of the common chamber of dual-branch nozzle changing the arrangement mode for each branch. Each figure directly compares the numerical oil mass flow rate and theoretical results calculated by Equations (1), (6), (14) and (15). The general tendency of the mass flow rate under different pressure conditions can be predicted well by the improved theoretical equations with different orifice angles, with a maximum relative error of about 6.3%. To be more specific, the average error of the proposed method is 1.5% (sd), 3.4% (od) and 5.4% (rd) for the dual-branch nozzle with the angle of 30°, the average error of the proposed method is 1.5% (sd), 3.5% (od) and 3.7% (rd) for the dual-branch nozzle with the angle of 45°, the average error of the proposed method is 0.9% (sd), 2.1% (od) and 1.9% (rd) for the dual-branch nozzle with the angle of 75°. It is also indicated that the empirical equations can be used to estimate the oil mass flow rate for dual-branch nozzles with different arrangements of the branch. The total mass flow rate is the largest for the nozzle adopting a radial arrangement, the next is the same direction arrangement. It is related to the turbulence intensity, when the branch is with a radial arrangement, its intensity is at its minimum, then is the same direction arrangement.
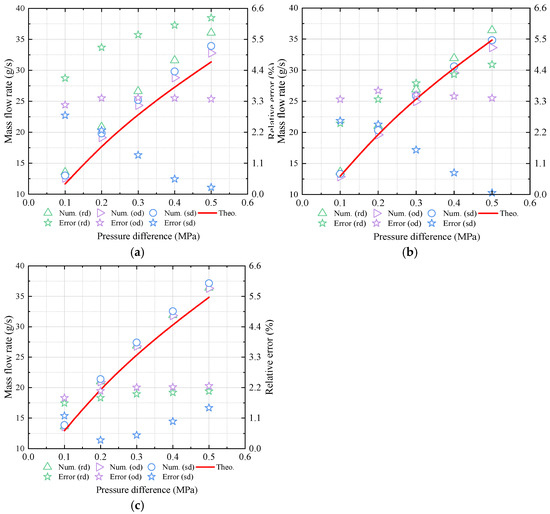
Figure 23.
Oil mass flow rate versus pressure different under different orifice angles for dual-branch nozzle: (a) α = 30°; (b) α = 45°; (c) α = 75°.

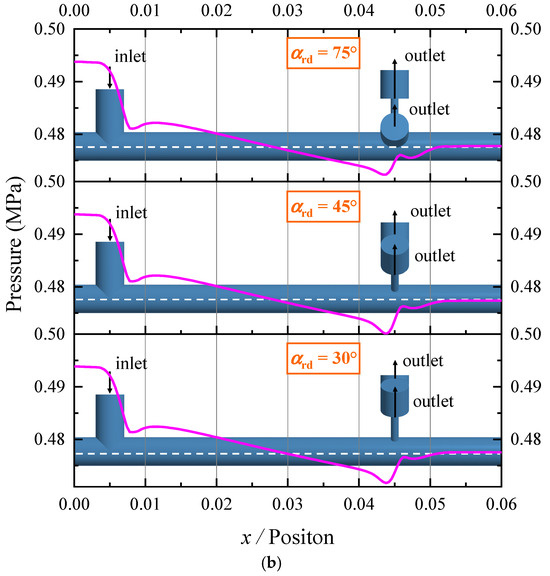

Figure 24.
Internal pressure distribution on the central axis of the dual-branch common chamber:(a) same directional; (b) radial arrangement; (c) opposite directional. The purple line represents the “internal pressure”.
Figure 24 illustrates the dual-branch nozzle after altering the arrangement mode for each branch. As shown in the figure, for the case where the dual-branch nozzle adopts a same-directional arrangement, different angles have minimal impact on the pressure distribution in the common chamber. However, when the dual-branch nozzle is arranged in an opposite direction, the angle significantly affects the pressure distribution within the common chamber. This is because varying opposite-direction angles lead to changes in the spacing distance of the orifices at the nozzle wall. A smaller opposite-direction angle results in a larger spacing distance, which extends the pressure recovery zone and increases the mass flow rate. On the other hand, a larger opposite-direction angle causes one orifice to be largely opposed to the forward direction of the fluid, leading to a considerable difference in the flow velocity direction. This uneven fluid flow at the outlet decreases the total mass flow rate of the nozzle. Therefore, as shown in Figure 23, the mass flow rate at αod = 75° is larger than that at αod = 30°. In contrast, when the dual-branch nozzle adopts a radial arrangement, the radial arrangement angle has minimal influence on the mass flow rate of the nozzle, as the spacing distance remains unchanged.
5. Conclusions
This study investigates the flow characteristics within multi-branch nozzles and examines the impact of pressure on the discharge coefficient. An improved theoretical method integrating the pressure and orifice angle empirical equations is proposed to predict the oil mass flow rate for the multi-branch nozzle. The main conclusions can be drawn as follows:
- The theoretical equations considering the orifice angle and pressure coefficient obtained by the curve fit method exhibit a high accuracy. Compared to the original theoretical method not considering the pressure effect, the precision of the theoretical method improved in this paper is enhanced by over an order of magnitude. The average relative derivation between the calculated oil mass flow rate and numerical simulations is about 2%. These results indicate that the improved method can effectively predict the discharge coefficient under varying pressure and orifice angle conditions.
- As for the multi-branch nozzle, the spacing distance has an obvious impact on the total oil mass flow rate of the nozzle with two or more orifice exits, the total oil mass flow rate of the multi-branch nozzle is proportional to the number of branches (orifice) Nm. The overall trend of the calculated total mass flow rate also agrees well with the numerical results. Notably, the mass flow rate of the branch closer to the nozzle inlet is slightly lower than that of the branch farther from the inlet, likely due to the combined effects of the common chamber and frictional head losses.
- In terms of the dual-branch nozzle with different arrangement forms, the total mass flow rate is the largest for the nozzle adopting a radial arrangement, the next is the same and opposite direction arrangement. The improved theoretical method considering the pressure and orifice angle coefficient can predict the total mass flow rate pretty well with a maximum relative error not exceeding 6.3%. Additionally, the orifices are suggested to be radially arranged and appropriately away from the nozzle exit to slightly increase the mass flow rate during the preliminary design of the lubricating oil circuit.
- The assumption of incompressible flow and constant viscosity simplifies the model and is appropriate for the pressure conditions considered (0–0.5 MPa). However, these assumptions may not fully capture the complexities of flow behavior in real-world applications, particularly under higher pressure or temperature-varying conditions, where cavitation and viscosity changes could significantly impact performance. As such, while the results provide valuable insights, their applicability to more complex, high-pressure, or thermally dynamic systems is limited. Future work will aim to address these limitations by incorporating models that account for cavitation effects, temperature-dependent viscosity, and transient flow conditions.
Author Contributions
Conceptualization, Y.D. and X.Z.; methodology, Y.Z., X.Y. and H.W.; software, X.H. and Y.Z.; validation, Y.Z. and X.Y.; formal analysis, H.W. and X.H.; investigation, Y.Z., X.H., X.Y. and X.Z.; resources, Y.D.; data curation, Y.Z., X.Y. and H.W.; writing—original draft preparation, Y.Z. and X.Y.; writing—review and editing, H.W., X.H. and X.Z.; visualization, Y.Z.; supervision, X.Z. and Y.D.; project administration, X.Y. and Y.D.; funding acquisition, Y.D. All authors have read and agreed to the published version of the manuscript.
Funding
This work was supported by the Science and Technology Innovation Program of Hunan Province (Grant number 2024RC1001).
Institutional Review Board Statement
Not applicable.
Informed Consent Statement
Not applicable.
Data Availability Statement
The original contributions presented in the study are included in the article, further inquiries can be directed to the corresponding author.
Conflicts of Interest
The authors declare no conflicts of interest.
References
- Lichtarowicz, A.; Duggins, R.K.; Markland, E. Discharge coefficients for incompressible non-cavitating flow through long orifices. J. Mech. Eng. Sci. 1965, 7, 210–219. [Google Scholar] [CrossRef]
- Parker, D.M.; Kercher, D.M. An Enhanced Method to Compute the Compressible Discharge Coefficient of Thin and Long Orifices with Inlet Corner Radiusing. NASA STI/Recon Tech. Rep. A 1991, 93, 53–63. Available online: https://api.semanticscholar.org/CorpusID:118228991 (accessed on 18 August 2025).
- Buckingham, E. On physically similar systems; illustrations of the use of dimensional equations. Phys. Rev. 1914, 4, 345. [Google Scholar] [CrossRef]
- Deckker, B.E.L.; Chang, Y.F. Paper 7: An investigation of steady compressible flow through thick orifices. Proc. Inst. Mech. Eng. Conf. Proc. 1965, 180, 312–323. [Google Scholar] [CrossRef]
- Brain, T.J.S.; Reid, J. Performance of Small Diameter Cylindrical Critical-Flow Nozzles; National Engineering Laboratory: Glasgow, UK, 1973. [Google Scholar]
- STP-TS-084; Orifice Flow Coefficient Equation Comparison. ASME: New York, NY, USA, 2018.
- Kent, J.C.; Brown, G.M. Nozzle exit flow characteristics for square-edged and rounded inlet geometries. Combust. Sci. Technol. 1983, 30, 121–132. [Google Scholar] [CrossRef]
- Ohrn, T.R.; Senser, D.W.; Lefebvre, A.H. Geometrical effects on discharge coefficients for plain-orifice atomizers. At. Sprays 1991, 1, 137–153. [Google Scholar] [CrossRef]
- Chen, C.; Yang, Y.; Yang, S.; Gao, H. The spray characteristics of an open-end swirl injector at ambient pressure. Aerosp. Sci. Technol. 2017, 67, 78–87. [Google Scholar] [CrossRef]
- Desantes, J.M.; López, J.J.; Carreres, M.; López-Pintor, D. Characterization and prediction of the discharge coefficient of non-cavitating diesel injection nozzles. Fuel 2016, 184, 371–381. [Google Scholar] [CrossRef]
- Du, Z.; Huang, W.; Yan, L.; Dong, M. Impacts of jet angle and jet-to-crossflow pressure ratio on the mixing augmentation mechanism in a shcramjet engine. Aerosp. Sci. Technol. 2019, 94, 105385. [Google Scholar] [CrossRef]
- Yu, B.; Fu, P.F.; Zhang, T.; Zhou, H. The influence of back pressure on the flow discharge coefficients of plain orifice nozzle. Int. J. Heat Fluid Flow 2013, 44, 509–514. [Google Scholar] [CrossRef]
- Tharakan, T.J.; Rafeeque, T.A. The role of backpressure on discharge coefficient of sharp edged injection orifices. Aerosp. Sci. Technol. 2016, 49, 269–275. [Google Scholar] [CrossRef]
- Kontoulis, P.; Kaiktsis, L.; von Rotz, B.; Boulouchos, K. CFD modeling and experimental spray studies for different heavy fuel oil qualities with respect to large two-stroke marine engines. J. Energy Eng. 2019, 145, 04019014. [Google Scholar] [CrossRef]
- Tan, E.S.; Anwar, M.; Kumaran, P.; Indra, K.; Yoshikawa, K. Air assist atomization characterization of palm biodiesel through experimental investigation and CFD simulation. Biofuels 2017, 8, 571–577. [Google Scholar] [CrossRef]
- Ghadimi, P.; Nowruzi, H.; Yousefifard, M.; Feizi Chekab, M. A CFD study on spray characteristics of heavy fuel oil-based microalgae biodiesel blends under ultra-high injection pressures. Meccanica 2017, 52, 153–170. [Google Scholar] [CrossRef]
- Nowruzi, H.; Ghadimi, P. Effect of water-in-heavy fuel oil emulsion on the non-reacting spray characteristics under di erent ambient conditions and injection pressures: A CFD study. Sci. Iran. 2016, 23, 2626–2640. [Google Scholar] [CrossRef]
- Jakobs, T.; Djordjevic, N.; Fleck, S.; Mancini, M.; Weber, R.; Kolb, T. Gasification of high viscous slurry R&D on atomization and numerical simulation. Appl. Energy 2012, 93, 449–456. [Google Scholar] [CrossRef]
- Jiao, W.; Luo, S.; He, Z.; Liu, Y. Emulsified behaviors for the formation of Methanol-Diesel oil under high gravity environment. Energy 2017, 141, 2387–2396. [Google Scholar] [CrossRef]
- Nasim, M.N.; Qavi, I.; Jiang, L. Effect of varying internal geometry on the near-field spray characteristics of a swirl burst injector. Flow Turbul. Combust. 2023, 111, 641–674. [Google Scholar] [CrossRef]
- Brunhart, M.; Soteriou, C.; Gavaises, M.; Karathanassis, I.; Koukouvinis, P.; Jahangir, S.; Poelma, C. Investigation of cavitation and vapor shedding mechanisms in a Venturi nozzle. Phys. Fluids 2020, 32, 083306. [Google Scholar] [CrossRef]
- Nagy, P.T.; Paál, G. Modeling the perturbation growth in an acoustically excited plane jet. Phys. Fluids 2017, 29, 114102. [Google Scholar] [CrossRef]
- Rachakonda, S.K.; Goette, D.; Schmidt, D.P. Near-nozzle flash-boiling flow of iso-octane, methanol, and ammonia in the engine combustion network spray G injector. Phys. Fluids 2024, 36, 113371. [Google Scholar] [CrossRef]
- Bhatia, D.; Loukas, J.; Cabrera, A.; Lyras, K. A deep learning computational fluid dynamics solver for simulating liquid hydrogen jets. Phys. Fluids 2024, 36, 057120. [Google Scholar] [CrossRef]
- Wu, R.; Nie, S.; Ji, H.; Wang, Y.; Lin, L.; Yin, F. Effect of multi-parameter optimization of water-laser coupling device and nozzle geometry on the stability of water-guided laser beam. Phys. Fluids 2024, 36, 013620. [Google Scholar] [CrossRef]
- Payri, R.; Salvador, F.J.; Gimeno, J.; Garcia, A. Flow regime effects over non-cavitating diesel injection nozzles. Proc. Inst. Mech. Eng. Part D J. Automob. Eng. 2012, 226, 133–144. [Google Scholar] [CrossRef]
- Payri, R.; Viera, J.P.; Gopalakrishnan, V.; Szymkowicz, P. The effect of nozzle geometry over internal flow and spray formation for three different fuels. Fuel 2016, 183, 20–33. [Google Scholar] [CrossRef]
- Liu, H.; Cheng, H.; Dai, Y.; Zhu, X. Atomization characteristics of special-design pneumatic two-fluid nozzles for helicopter main reducers: A numerical and experimental investigation. Aerospace 2022, 9, 834. [Google Scholar] [CrossRef]
- Zhong, J.; Dai, Y.; Liang, C.; Zhu, X.; Xu, L. CFD investigation of air-oil two-phase flow in oil jet nozzle. Proc. Inst. Mech. Eng. Part C J. Mech. Eng. Sci. 2022, 236, 10079–10089. [Google Scholar] [CrossRef]
- Jiang, L.; Liu, Z.; Lyu, Y. Internal flow and discharge coefficient characteristics of oil jet nozzles with different orifice angles under non-cavitating conditions. Aerosp. Sci. Technol. 2021, 110, 106473. [Google Scholar] [CrossRef]


Disclaimer/Publisher’s Note: The statements, opinions and data contained in all publications are solely those of the individual author(s) and contributor(s) and not of MDPI and/or the editor(s). MDPI and/or the editor(s) disclaim responsibility for any injury to people or property resulting from any ideas, methods, instructions or products referred to in the content. |
© 2025 by the authors. Licensee MDPI, Basel, Switzerland. This article is an open access article distributed under the terms and conditions of the Creative Commons Attribution (CC BY) license (https://creativecommons.org/licenses/by/4.0/).