Abstract
A significant amount of heat is generated during the braking process of a kilometer-deep well hoist, which causes a large temperature rise and then thermal deformation and cracks in the brake disc. Thus, improving the surface performance of the brake disc is necessary to ensure reliable braking under high-speed and heavy-load conditions. In this paper, thermal barrier coating technology is applied to a brake disc, and the friction and wear characteristics of a yttria-stabilized zirconia (YSZ) thermal barrier-coated brake disc is studied. A coupled thermomechanical model of the hoist disc brake is established, and a temperature field simulation analysis of uncoated and coated brake discs under emergency braking conditions is carried out. Then, a surrogate model of the maximum temperature of the brake disc surface with respect to the random parameters of the brake disc is constructed based on a Latin hypercube experimental design and the Kriging method. The reliability of the brake disc under emergency braking conditions is estimated based on saddlepoint approximation (SPA), and the feasibility of applying a YSZ thermal barrier coating to a hoist disc brake is verified.
1. Introduction
Braking reliability is critical for the safe operation of mine hoists. Multiple pairs of disc brakes are used to achieve braking by creating friction between the brake shoe and the brake disc. However, the faster hoist speeds and larger loads required for kilometer-deep well hoists can increase the initial braking speed and load, posing a significant challenge for existing disc brakes. Additionally, emergency braking of the hoist generates a lot of heat on the contact surface, causing the temperature of the friction contact surface to rise rapidly, which can lead to the deformation and oxidation of the brake disc surface. These issues can significantly diminish the lifespan and reliability of disc brakes.
A disc brake works by creating friction between the brake shoe and the rotating brake disc. Thus, the temperature rise of the brake disc under thermal coupling effects has been extensively studied in recent decades. Popescu et al. [1] conducted a temperature simulation of mine hoist brake discs during emergency braking. Kepekci et al. [2] found that brake discs made of different materials with different heat transfer coefficients had significant differences in surface temperature and heat dissipation during braking. Wang et al. [3] examined the temperature evolution of train brake discs during high-speed braking and discovered that the temperature distribution on the friction surface initially formed a hot ring, which then expanded and persisted.
Belhocine and Wan [4] analyzed the thermomechanical behavior of the dry contact between the brake disc and pads during the braking process. They found that the temperature, Von Mises stress, and total deformations of the disc, as well as the contact pressures of the pads, increased with thermal stresses. Coupled thermomechanical finite element analyses of the brake disc and brake shoe were conducted in [5] to investigate their temperature and stress fields during emergency braking. Kalamegam et al. [6] carried out a systematic parametric comparison using a finite element analysis, which revealed the quantitative impact of material selection, groove orientation, and ventilation design on brake rotor disc performance. Zuo et al. [7] simulated the dynamic convective heat transfer and transient temperature field of a high-speed train brake disc by integrating fluid–structure interactions and thermomechanical coupling methods. Hong et al. [8] identified the cause of thermal cracking through a thermomechanical friction analysis of the disc and pad, and they verified their model using a dynamometer. Abdullah et al. [9] calculated the surface temperatures of the friction clutch disc and studied the thermal behavior of friction clutches during multiple engagements. Orlowicz et al. [10] analyzed the influence of different friction coefficients on braking torque and found that changes in friction coefficients during braking can alter the braking torque along the tangential and normal directions, leading to the early occurrence of “hot spots”. Yevtushenko et al. [11] developed a mathematical model to analyze the influence of changes in friction power over time on temperature, and they carried out a numerical analysis of spatiotemporal temperature distributions and heat flux intensities. Gigan [12] proposed a simulation approach for evaluating brake disc designs with respect to thermomechanical performance. Jin et al. [13] investigated the thermal behavior of friction discs in dry clutches during long-term slipping, using a two-dimensional transient thermal model based on the finite element method. Zhang et al. [14] created a flow model similar to the actual working conditions of a brake disc and examined the local and average convective heat transfer characteristics on the brake disc surface through experiments. They found that the convective heat transfer characteristics on the brake disc surface were determined by the diameter ratio of the brake disc to the train wheel. KIM et al. [15] conducted fatigue testing, a contact pressure analysis, and a thermal stress analysis on a brake disc made of GC25; established a linear relationship between temperature and stress changes; and evaluated the remaining life of the brake disc. Belhocine and Abdullah [16] used the thermal structure coupling method to simulate a transient thermal analysis and static thermal analysis of disc brakes with three different brake disc materials. Benhassine et al. [17] analyzed the isotropic and anisotropic thermoelastic behavior in multiple friction cycles of three kinds of disc materials using the finite element method. They found that the distribution of and change in temperature are very important for the contact pressure, stress field, and braking torque.
In addition to the challenges mentioned earlier, the randomness of the physical properties and material parameters of the brake disc can also affect the braking reliability of a mine hoist. In practical situations, most of these parameters are random variables. For example, the brake force and contact area of the friction pair between the brake disc and brake shoe can lead to uncertainty in the brake force. The coefficient of friction between the friction pairs, elastic modulus, and thickness of the brake disc are all random variables that have a significant impact on the braking reliability of the mine hoist. Therefore, the reliability of the brake system should be analyzed while taking into account the influence of parameter randomness on the heat transfer characteristics and temperature field of the brake disc. Lu and Yu [18] proposed a hybrid probabilistic and interval model to address the uncertainties present in a disc brake system. Li et al. [19] presented a fault diagnosis method for the hoist disc brake system based on machine learning, where the state of the brake system is determined by classifying data. Ren et al. [20] conducted probabilistic modeling and a reliability analysis of brake shoes by considering stress and temperature failure. Xu et al. [21] developed a disc brake that monitors the positive brake force in real time and has a certain brake fault diagnosis function. Yang et al. [22] carried out a reliability sensitivity analysis of automotive disc brakes, identifying multiple failure mode correlations.
One potential issue that may arise when conducting a brake disc reliability analysis is the nonlinear implicit limit state function problem caused by the complexity of the structure. However, due to the limitations of computing resources, a single finite element method is not suitable for reliability calculations that require large-scale sampling. To reduce the computational costs involved in a reliability analysis, the use of surrogate models, also known as metamodels, has become an effective approach [23]. In general, a metamodel is constructed by approximating a limited number of samples obtained from simulations using the design of experiments (DOE) method [24,25]. With an explicit, continuous, and smooth metamodel, the saddlepoint approximation method can be promptly used for reliability estimation [26,27]. There are currently many types of surrogate modeling techniques in the literature, as summarized in [28]. These surrogates fall into three major groups: geometric, heuristic, and stochastic models [29]. Among them, the Kriging metamodel stands out from the other surrogate models [30,31].
The main focus of this study is to analyze the braking reliability of a mine hoist with a coated brake disc using a thermal structural coupling analysis and an uncertainty analysis. The surface performance of a YSZ thermal barrier coating and the braking reliability of a coated brake disc for a kilometer-deep well hoist are examined. The rest of this paper is organized as follows: In Section 2, the thermal conductivity of three types of YSZ thermal barrier coatings is studied. The friction coefficient, wear resistance, and thermal deformation resistance of a YSZ thermal barrier-coated disc are examined under different pressure forces, speeds, and times. In Section 3, the parameters for a simulation analysis, such as the structural and material parameters and emergency braking parameters, are determined. The brake disc temperature field under emergency braking conditions is analyzed in Section 4. Then, a reliability evaluation of the brake disc under emergency braking conditions is performed in Section 5. Finally, the main conclusions of this study are summarized in Section 6.
2. Surface Performance Analysis of a YSZ Thermal Barrier Coating
2.1. Sample Preparation
As a type of low-alloy, high-strength steel, 16Mn is commonly used in mine hoist brakes and is chosen as the substrate material for brake discs. The material characteristics of 16Mn are presented in Table 1. The dimensions of the sample substrate material are Φ30 mm × 7 mm and 20 mm × 20 mm × 5 mm.

Table 1.
Material characteristics of 16Mn steel.
To improve the surface performance of the brake disc, YSZ is chosen as the coating material. YSZ is a ceramic material with a high melting point and low thermal conductivity, making it a popular choice for coating aero-engine blades. In theory, YSZ coatings have good heat insulation properties, good wear resistance, and good oxidation resistance. By adjusting the Y2O3 content in YSZ powder, the crystal form of YSZ can be controlled to produce materials that meet specific requirements. In this study, samples with 10 wt.%, 8 wt.%, and 5 wt.% Y2O3 concentrations doped into YSZ powders are prepared using plasma spraying. These samples are referred to as Sample 1, Sample 2, and Sample 3, respectively. The prepared samples are displayed in Figure 1.
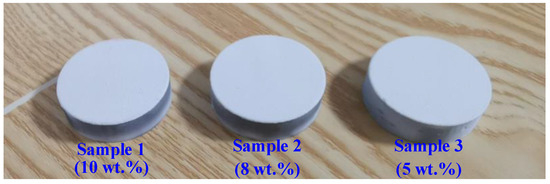
Figure 1.
Prepared coating samples.
The WSM-3 non-asbestos brake shoe material commonly used in hoist brakes is chosen to form a friction pair with the above samples. An uncoated sample of the same size made of 16Mn steel is also selected for comparison and is referred to as Sample 4.
In this study, an MVF-1A multi-functional friction and wear testing machine is employed for friction experiments. The primary technical parameters are presented as follows:
- (1)
- Main shaft power: 1 kW.
- (2)
- Maximum measurable friction torque: 2.5 N·m. The maximum distance of the friction force arm is 50 mm, and the relative error of the friction torque indication value is ±2%.
- (3)
- Axial test force working range: 10–1000 N. The relative error of the test force indication value is ±0.5%.
- (4)
- Main shaft rotational speed range: 5–2000 r/min. The error of the main shaft rotational speed is ±1%.
The testing principle of the MVF-1A multi-functional friction and wear testing machine is that the friction pair is directly connected to the main shaft. The sample is fixed on the workbench. During the experiment, the main shaft exerts a normal pressing force. The brake shoe material comes into contact with the specimen and rotates. The main shaft is equipped with a pressure sensor, a friction force sensor, and a rotational speed sensor. All experimental data are collected and recorded by a computer. The experiment procedures are as follows:
- (1)
- Install the prepared friction pair and sample in their respective positions. Power on the device and the computer, check all components, and then enter the testing system.
- (2)
- To ensure better engagement of the friction pair and to approximate the actual working conditions more closely, perform preliminary grinding on the friction pair prior to commencing the friction experiment, and then conduct the friction experiment.
- (3)
- Set parameters such as the rotational speed, pressing force, and experimental duration in the testing system, and initiate the experiment.
- (4)
- After the experiment is completed, export the experimental data recorded by the computer.
Under the actual braking conditions of the hoist, both the pressure force and the initial braking speed will affect the braking effect. To closely simulate the real working conditions, the following test plans are proposed:
- (1)
- The influence of pressure force on the friction and wear characteristics of the friction pair
The wear rate, friction coefficient, and variance of the friction coefficient of the four samples in the friction test are investigated under the conditions of a constant initial braking speed and different pressure forces.
- (2)
- The influence of rotational speed on the friction and wear characteristics of the friction pair
The wear rate, friction coefficient, and variance of the friction coefficient of the four samples in the friction test are investigated under the conditions of a constant pressure force and different initial rotational speeds.
- (3)
- The influence of braking duration on the friction and wear characteristics of the friction pair
The wear rate, friction coefficient, and variance of the friction coefficient of the four samples in the friction test are investigated under the condition of an extended braking time, that is, multiple consecutive braking events.
To implement the above test plans while referring to the technical parameters of the friction testing machine, the pressure force is set to three values, namely, 100 N, 200 N, and 300 N, and the rotational speed is set to three values: 100 r/min, 200 r/min, and 300 r/min. Cross-experiments are conducted on four samples (three coated samples and one uncoated sample), totaling 36 groups, with each group’s test time being 5 min. Under the conditions of a pressure force of 300 N and a rotational speed of 300 r/min, multiple consecutive braking tests are conducted on the four samples, with each group’s test duration being 30 min.
2.2. Friction and Wear Performance Analysis of YSZ Coating
During the braking process of a mine hoist, a stable braking torque is necessary for safety. Therefore, to analyze the friction and wear performance of the YSZ coating on the brake disc, the friction coefficient, wear amount, and variance of the friction coefficient are selected as indexes to evaluate the friction and wear properties of the YSZ thermal barrier coating. Additionally, under the working conditions of a mine hoist, both the pressure force and initial rotational speed can affect the braking effect. Therefore, this study focuses on the friction and wear characteristics under various combinations of pressure force, initial rotational speed, and number of braking cycles.
2.2.1. Influence of Pressure Force on Friction and Wear Properties
The wear amount, friction coefficient, and variance of the friction coefficient are examined at different pressure forces with a constant initial rotational speed of 300 r/min (revolutions per minute).
- Wear amount analysis
The wear amount of each sample under these conditions is shown in Table 2. As shown in the table, the wear amount and pressing force exhibit a positive correlation: as the pressing force increases, the wear amount also increases. The duration of the wear test is set to 5 min.
Table 2.
Wear amount of each sample at 300 r/min.
According to Table 2, when the pressing force is 100 N, the wear amount of Sample 1 and Sample 2 is the same at 5 × 10⁻⁴ g. Sample 3 and Sample 4 have wear amounts of 24 × 10−4 g and 7 × 10⁻⁴ g, respectively. In comparison, the wear amount of Sample 4 under a pressing force of 100 N is higher than that of Samples 1 and 2 but much lower than that of Sample 3.
At a pressing force of 200 N, the wear amount of Sample 2 is the lowest at 8 × 10⁻⁴ g. The wear amount of Sample 1 is 11 × 10−4 g, which falls between the wear amounts of Sample 2 (8 × 10⁻⁴ g) and Sample 4 (15 × 10−4 g). However, Sample 3 has the highest wear amount at 41 × 10−4 g.
When the pressing force is 300 N, the wear amounts of the four samples follow the same trend. Sample 3 has poor wear resistance, with a wear amount much higher than that of Sample 4. Samples 1 and 2 demonstrate superior wear resistance compared to Sample 4, and the wear resistance of Sample 2 is the best among the four samples.
- 2.
- Friction coefficient analysis
It is worth noting that changes in the friction coefficient can affect the braking torque during the braking process of a hoist, which will affect the effectiveness and safety of braking. As can be seen in Figure 2, the friction coefficient of each sample under different pressing forces at a rotational speed of 300 r/min is presented. The coefficient of friction is calculated by μ = F/P, in which F represents the measured friction force, and P represents the measured pressure force.

Figure 2.
Friction coefficient of each sample under different pressing forces at 300 r/min.
The friction coefficients of the four samples all show significant fluctuations under a pressing force of 100 N. The fluctuation degrees of the friction coefficients of Samples 1, 2, and 3 are similar, while the friction coefficient of Sample 4 fluctuates dramatically. When the pressing forces are set to 200 N and 300 N, the change in the friction coefficient of Samples 1, 2, and 3 is relatively stable, while that of Sample 4 fluctuates greatly.
In terms of the average friction coefficient, the four samples have values of 0.28, 0.27, 0.27, and 0.44 under a pressing force of 100 N, respectively. When the pressing force is 200 N, the average friction coefficient of the four samples is 0.28, 0.30, 0.32, and 0.37, respectively. When the pressing force is 300 N, the average friction coefficients are 0.31, 0.31, 0.30, and 0.37, respectively.
In conclusion, the friction coefficient of the three coated samples (Samples 1, 2, and 3) is lower than that of the uncoated sample (Sample 4), but the degree of fluctuation in the friction coefficient of the coated samples is lower than that of the uncoated sample. When the pressing force is 300 N, the friction coefficient of both Samples 1 and 3 increases at first and then decreases slightly, while Sample 2 exhibits relatively consistent friction coefficients.
- 3.
- Friction coefficient variance analysis
Based on the results of the friction coefficient, the friction coefficient variance is also calculated to quantify the fluctuation degree of the friction coefficient.
The variance of the friction coefficient refers to the variance of the friction coefficient in the braking friction test, which is used to describe the stability of the friction coefficient during the braking process. Its expression is as follows:
where f1, f2,…, fn represent the friction coefficients of each sampling point, n is the number of sampling points, and µf is the average value of all sampling points with friction coefficients.
The friction coefficient variance of each sample under different pressing forces is shown in Table 3. The larger the variance, the more unstable the friction coefficient.
Table 3.
The friction coefficient variance of each sample at 300 r/min.
When the pressing force is 100 N, the friction coefficient variance of Sample 1 is the smallest, while that of Sample 2 is slightly higher than that of Sample 1. The friction coefficient variance of Sample 3 is twice that of Sample 2. The friction coefficient variance of Sample 4 is very large and 8.3 times that of Sample 3.
When the pressing force is 200 N, the friction coefficient variance of Samples 1, 2, and 3 is relatively small, while the friction coefficient variance of Sample 4 is relatively large. When the pressing force is 300 N, the friction coefficient variance of Samples 1 and 2 is small, while that of Sample 3 is large. Sample 4 displays twice the variance of the friction coefficients compared to Sample 3.
Additionally, under different pressing forces, the friction coefficient variance of Sample 1 and Sample 2 is relatively small, that of Sample 3 is slightly higher, and that of Sample 4 is much higher. In other words, the friction coefficient stability of coated Sample 1, Sample 2, and Sample 3 is better than that of uncoated Sample 4. Among the coated samples, the friction coefficient stability of Sample 1 and Sample 2 is the best, and the friction coefficient stability of Sample 3 is worse than that of Sample 1 and Sample 2.
2.2.2. Influence of Rotational Speed on Friction and Wear Properties
The impact of different rotational speeds on the friction and wear properties is analyzed at a constant pressing force of 300 N. As before, the wear amount, friction coefficient, and friction coefficient variance are studied.
- Wear amount analysis
The wear performance of each sample at different rotational speeds under a pressing force of 300 N is presented in Table 4.
Table 4.
The wear amount of each sample under a pressing force of 300 N.
The wear amount of each sample at the same rotational speed and a pressing force of 300 N is compared, as shown in Table 4. Obviously, the wear amount increases with the increase in the rotational speed, and the amount of wear is positively correlated with the rotational speed. The wear resistance of Sample 1 is equivalent to that of Sample 4 at relatively lower speeds, while the wear resistance of Sample 1 is slightly better than that of Sample 4 at high speeds. The wear resistance of Sample 2 is the best in the friction test, with the smallest wear amount at both low and high rotational speeds. The wear resistance of Sample 3 is the worst, while that of Sample 4 is the same at 100 r/min, but that of Sample 3 is the highest at 200 r/min and 300 r/min and is much higher than that of Sample 4.
In summary, compared to Sample 4, Sample 2 has the best wear resistance performance, followed by Sample 1, while Sample 3 has the worst performance.
- 2.
- Friction coefficient performance
Figure 3 shows the friction coefficient of each sample at different rotational speeds under a pressing force of 300 N. The friction coefficient of Sample 1 and Sample 2 is relatively stable at different rotational speeds. For Sample 3, the friction coefficient increases slightly with time when the rotational speed is 100 r/min. When the rotational speed is 200 r/min, the friction coefficient is relatively stable. When the rotational speed is 300 r/min, the friction coefficient increases slightly at first but then decreases continuously. For Sample 4, the friction coefficient fluctuates greatly at different rotational speeds, and it is significantly higher than that of the other samples.

Figure 3.
Friction coefficient of each sample at different rotational speeds at 300 N.
According to the above analysis, although the coating can slightly reduce the friction coefficient, it can also increase the stability of the friction coefficient. Sample 1 and Sample 2 show the best stability of the friction coefficient, while that of Sample 3 is poorer. Sample 4 has a relatively high friction coefficient, but it fluctuates greatly.
- 3.
- Friction coefficient variance analysis
Table 5 shows the friction coefficient variance of each sample at different rotational speeds under a pressing force of 300 N.
Table 5.
The friction coefficient variance of each sample under a pressing force of 300 N.
Compared to the coated samples, the friction coefficient variance of Sample 4 is the highest at all speeds, while the stability of the friction coefficient of the three coated samples is better than that of the uncoated sample.
When the rotational speed is 100 r/min and 300 r/min, the friction coefficient variance of Sample 2 is the smallest, indicating the best stability of the friction coefficient. The friction coefficient variance of Sample 1 is slightly higher than that of Sample 2. The stability of the friction coefficient of Sample 3 and Sample 4 is poor. When the rotational speed is 200 r/min, the friction coefficient variance of all coated samples is small, indicating a good stability of the friction coefficient.
In terms of friction coefficient stability, that of Sample 1 is the best, followed by that of Sample 2, and that of Sample 3 is poor. The stability of the friction coefficient of the three coated samples is superior to that of the uncoated sample.
2.2.3. Influence of Braking Times on Friction and Wear Performance
When the pressing force is 300 N and the rotational speed is 300 r/min, the effect of braking times on the friction and wear performance is studied.
- Wear amount analysis
Table 6 shows a comparison of the wear amount of each sample under single braking tests and continuous braking tests. It is evident that the wear amount of Sample 2 is the smallest among the four samples in both single and continuous braking, indicating the best wear resistance. The wear resistance performance of Sample 1 is slightly inferior to that of Sample 2 but better than that of uncoated Sample 4. The wear amount of Sample 3 is higher than that of Sample 4, indicating that the wear resistance of Sample 3 is even worse than that of the uncoated sample.
Table 6.
Wear amount of single friction test and continuous friction test of each sample.
- 2.
- Friction coefficient performance
Figure 4 illustrates the variation in the friction coefficient of each sample in the continuous braking tests. It is evident that the friction coefficient of Sample 4 is higher than that of the other three samples throughout the test, and the fluctuation of the friction coefficient is also the largest. The friction coefficient curves of Sample 2 and Sample 3 are close to each other, showing a small upward trend throughout the test process. The friction coefficient curve of Sample 1 is nearly horizontal, but with small fluctuations. When compared with the single friction test, it is apparent that, in the continuous friction test, the value of the friction coefficient does not increase or decrease significantly, but the fluctuation degree of the friction coefficient increases to a certain extent.

Figure 4.
Friction coefficient of each sample in continuous friction test.
- 3.
- Friction coefficient variance analysis
Table 7 shows a comparison of the friction coefficient variance between the single braking tests and continuous braking tests for each sample. The friction coefficient variance in the continuous braking tests for all four samples is higher than that in the single braking tests. The stability of the friction coefficient becomes worse with increasing braking times, resulting in greater fluctuations in the friction coefficient.
Table 7.
Variance in friction coefficient in single braking test and continuous braking test.
In the single braking tests, the friction coefficient variance of Sample 2 is the smallest, and its friction coefficient stability is the highest. However, in the continuous braking tests, the stability of the friction coefficient of Sample 2 is comparable to that of Sample 4, indicating that the fluctuation degree of the friction coefficient of Sample 2 increases significantly with increasing braking times.
Furthermore, the friction coefficient variance of Sample 1 in the single braking tests is higher than that of Sample 2 but smaller than that of Sample 3, while the friction coefficient variance of Sample 1 is the smallest in the continuous braking tests. The variation in the friction coefficient of Sample 3 in the single braking tests and continuous braking tests is at a medium level. The variation in the friction coefficient of Sample 4 is the largest in both the single friction tests and continuous braking tests.
2.2.4. Summary
The wear performance of Sample 2 was found to be the best among all samples, as indicated by it exhibiting the smallest mass loss in both the single and continuous braking tests. Additionally, the friction coefficients of Samples 1, 2, and 3 were found to be equivalent in the single braking tests. However, the friction coefficients of Sample 1 and Sample 4 exhibited periodic fluctuations in the continuous braking tests, while those of Sample 2 and Sample 3 remained stable. Furthermore, the friction coefficient variance of Sample 1 and Sample 2 was the smallest in the single braking tests, although it was slightly inferior in the continuous braking tests. Based on these findings, the coating material of Sample 2, i.e., 8 wt.% YSZ, was chosen as the coating material for the brake disc due to its superior wear performance, friction coefficient performance, and friction coefficient variance performance in the single braking tests.
3. Parameter Determination for Simulation Analysis
3.1. Structural and Material Parameters
A JKMD-5 × 4 (III) floor-type multi-rope friction hoist was selected as the research object. The main shaft of the hoist has a diameter of 5 m, and there are six disc brakes on each side of the brake disc. On each side of the main shaft device, there are six pairs of brake shoes on the brake disc, with an angle of 14° between each pair, as shown in Figure 5. The geometric parameters and installation dimensions of the brake disc and brake shoe can be found in Table 8.
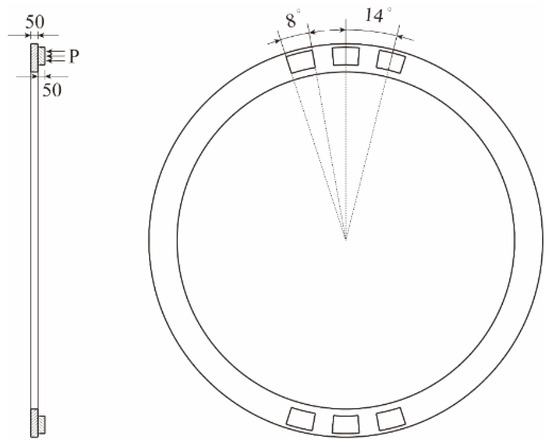
Figure 5.
Schematic diagram of hoist disc brake.
Table 8.
Geometric parameters of brake disc and brake shoe.
The materials of the brake disc and brake shoe were 16Mn steel and WSM-3, respectively, and the coating material was 8%Y2O3-ZrO2 (8YSZ). The density, specific heat capacity, and Poisson’s ratio of 8YSZ did not change with temperature, and the values were 5650 kg/m3, 450 J/(kg·K), and 0.23, respectively. The other performance parameters of 8YSZ under different temperatures are presented in Table 9.
Table 9.
Performance parameters of 8% Y2O3-ZrO2 coating material under different temperatures.
The brake disc material, made of 16Mn, has a density of 7850 kg/m3 and a Poisson’s ratio of 0.3. These properties are barely affected by temperature. As shown in Table 10, the thermophysical parameters of the brake disc, such as the elastic modulus, thermal conductivity, thermal expansion coefficient, and specific heat capacity, change with the change in temperature. The material of the brake shoe is WSM-3, and its basic properties and thermophysical parameters are presented in Table 11 and Table 12, respectively.
Table 10.
Thermophysical parameters of brake disc.
Table 11.
Basic properties of WSM-3 brake shoe.
Table 12.
Thermophysical parameters of WSM-3 brake shoe.
3.2. Parameters of Emergency Braking Condition
A deep well hoist is a type of hoisting equipment that is commonly used in mines with depths of 1000 m or more. These hoists are designed to improve the lifting speed and load capacity. In this case, it is assumed that the lifting height is 1000 m, the lifting speed is 20 m/s, and the load is 32 t.
The dynamic equation of the hoisting system during emergency braking can be expressed as follows:
where is the lifting maneuver torque, is the braking torque, and Mj is the static load torque.
The dynamic torque of the lifting system in the lifting process can be expressed as
where is the braking deceleration, and is the radius of the hoist drum.
The braking torque of the lifting system during emergency braking can be expressed as
where is the friction coefficient, N is the number of brake shoes, P is the pressure force, S is the contact area between a single brake shoe and the brake disc, and Rm is the friction radius.
The static load torque of the lifting system can be expressed as
where is the resistance coefficient, Q is the effective load, C is the stiffness coefficient of the hoisting wire rope, is the height at which the lifting system needs to be lowered, is the height at which the lifting system has been lowered, and g is the gravitational acceleration.
From Equations (3)–(5), the braking acceleration can be deduced as
Then, the braking time of the emergency braking of the hoisting system can be obtained as
Regarding the rotating parts in the hoisting system, the displacement quality of each component is shown in Table 13.
Table 13.
Equivalent mass of lifting system.
According to the requirements of “Coal Mine Safety Regulations” and the hoisting system parameters obtained above, the emergency braking working condition parameters can be determined, which are shown in Table 14.
Table 14.
Parameters of emergency braking.
3.3. Convective Heat Transfer Coefficient
The contact surface between the brake disc and the brake shoe will produce a large quantity of heat during emergency braking. Heat will be transmitted from the brake disc surface to the air as the temperature of the brake disc surface rises. Therefore, the convective heat transfer coefficient is not a constant value at different speeds. The convective heat transfer coefficient of disc brakes is commonly calculated using Equation (8):
where is the Reynolds number, and . is the speed of the brake disc, is the air density, is the outside diameter of the brake disc, and is the air viscosity.
According to the emergency braking conditions and Equation (8), the convective heat transfer coefficient of the brake disc can be transformed into the following relationship:
By fitting the above piecewise function formula, the approximate relationship between the convective heat transfer coefficient and time can be obtained, as shown in Equation (10):
3.4. Heat Partition Coefficient
Assuming that the brake disc and brake shoe materials are isotropic and have a uniform average temperature at their friction contact surface, it can be assumed that heat flow is continuous between them. The heat distribution on the friction surface during braking depends on the thermal resistance of both friction contact surfaces. Under steady-state conditions, the coefficient of heat partition can be expressed using Equation (11):
where is the heat flux to the brake disc, is the heat flux to the brake shoe, is the heat transfer resistance of the brake disc, and is the heat transfer resistance of the brake shoe.
Additionally, the following relationship exists in the contact area:
where and are the average temperatures of the contact surface of the micro-convex body in the contact area, and is the total heat flux generated by the friction surface.
Then, the coefficient of heat partition between the brake disc and brake shoe is
where is the density, is the specific heat capacity, and is the thermal conductivity.
By utilizing Equation (13) and considering the material properties of both the brake disc and brake shoe, we can calculate the heat distribution between these two components. The resulting values are summarized in Table 15. The brake disc has high thermal conductivity and low thermal resistance, which means that 87.59% of the heat generated through friction is transferred to the brake disc, while only 12.41% is transferred to the brake shoe.
Table 15.
Heat flow distribution of brake disc and brake shoe.
4. Thermal–Structural Coupling Analysis of Disc Brake Under Emergency Braking Conditions
4.1. Temperature Field Analysis of Uncoated Brake Disc
Based on the parameters determined in the previous section, a finite element model is established for the brake disc and brake shoe. Figure 6 shows the maximum temperature curve attained by the uncoated brake disc during emergency braking, with temperatures peaking at 163.4 °C after 2.3 s. Figure 7 illustrates the temperature contour of the uncoated brake disc under emergency braking conditions for a duration of 4.88 s.

Figure 6.
Curve of maximum temperature of uncoated brake disc at different times.

Figure 7.
Temperature nephogram of uncoated brake disc at different times.
As can be seen in Figure 6 and Figure 7, a significant amount of heat is generated due to surface friction on the brake disc immediately following the act of braking. Because the heat cannot spread into the air in a short time, heat accumulates rapidly, and the brake disc surface temperature rises rapidly. During the early stages of braking, the fast rotational speed of the brake disc causes the speed of heat diffusion to be slower than that of heat generation by friction, which causes the temperature of the brake disc to continue to rise. As the rotational speed of the brake disk gradually slows down, at 2.3 s, the rate of heat generated by friction is the same as that of heat diffusion, and the temperature does not rise any more. After 2.3 s, the speed of friction heat production is less than that of heat diffusion, leading to a gradual decrease in the brake disc temperature.
As shown in Figure 7, the temperature change nephogram reveals that the uncoated brake disc exhibits consistently high temperatures near the friction pair position, which gradually reduce over time. This phenomenon is primarily caused by the fact that the brake disc continues to rotate after the temperature of the contact surface of the friction pair rises. Simultaneously, due to the convective heat transfer of air, the maximum temperature gradually decreases with the rotation process.
To further investigate the surface temperature distribution of the brake disc under emergency braking conditions, six nodes are marked on the brake disc’s friction surface. As shown in Figure 8, these nodes are labeled N1, N2, N3, N4, N5, and N6 in the radial direction. The corresponding temperature variations of each node at different times are depicted in Figure 9.

Figure 8.
Schematic diagram of node locations.

Figure 9.
Temperature variation of each node of uncoated brake disc at different times.
As shown in Figure 9, the temperatures of the six nodes from N1 to N6 fluctuate greatly during braking, showing a “sawtooth” shape. This is because each braking point repeatedly passes through both the contact and non-contact areas, thus showing a repeated increase and decrease in temperature.
At the same time, the temperature of N1 and N6 is much lower than that of the other four nodes. The reason for this is that convective heat transfer and heat conduction exist at the same time during rotation at the edge of the frictional area, where N1 and N6 are located. The rapid diffusion of heat makes the temperature drop rapidly.
However, in the inner position of the frictional area, there is only heat conduction in the contact area. The heat diffusion speed and temperature drop are slow, and the temperatures at N2, N3, N4, and N5 are relatively higher. Additionally, as the heat generation conditions and heat dissipation conditions at the N2, N3, N4, and N5 nodes are similar, their temperature performance is also similar.
4.2. Temperature Field Analysis of Coated Brake Disc
Figure 10 displays the temperature curve of the YSZ thermal barrier-coated brake disc substrate at different times during emergency braking, reaching the highest temperature of 45.33 °C at 4.88 s. During the braking process, the temperature of the brake disc substrate with the coating rises gradually over time, but the maximum temperature is much less than that of the uncoated brake disc, which is 163.4 °C.

Figure 10.
Temperature curve of coated brake disc substrate at different times.
The temperature field of the brake disc substrate with a YSZ thermal barrier coating at each time during emergency braking is also analyzed, and a temperature nephogram is shown in Figure 11. The maximum temperature of the matrix is 22.3 °C at 0.8 s. As the braking continues, the temperature continues to rise, and, when it reaches 2.4 s, the area with a temperature difference of 1 °C from the maximum temperature connects as a complete ring, which indicates that the temperature difference of the substrate is relatively small during the braking process.
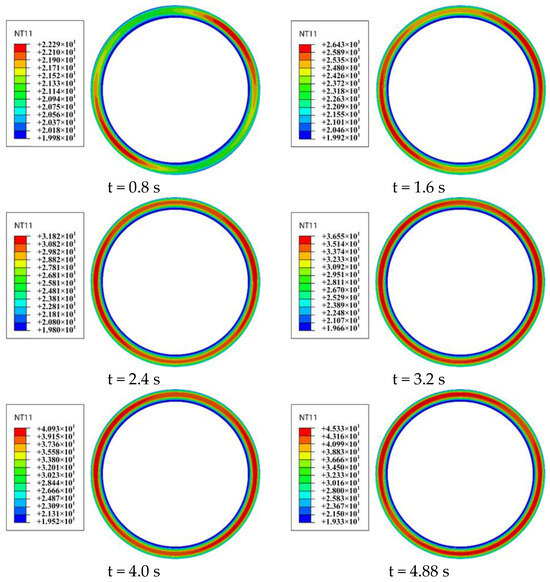
Figure 11.
Temperature nephogram of coated brake disc at different times.
Similar to Figure 6, six nodes, designated N1, N2, N3, N4, N5, and N6, are arranged in the radial direction of the substrate. Figure 12 shows the temperature curve of each node on the coated brake disc substrate. The temperature of the six nodes rises gently, indicating that the heat dissipation efficiency of the substrate is stable. The temperature of N1 and N6 is lower than that of the other nodes because the heat input is less at the corresponding positions on the friction surface.

Figure 12.
Temperature variation diagram of radial nodes of coated brake disc base.
By analyzing the temperature field of the coated and uncoated brake discs, three main differences can be found through comparison. (1) The maximum temperature varies greatly, and the times taken to reach the maximum temperature are different. (2) The temperature fluctuation of the brake disc substrate with a YSZ thermal barrier coating is much lower. (3) The temperature distribution of the coated brake disc substrate is more uniform.
5. Reliability Evaluation of Brake Disc Under Emergency Braking Conditions
It is important to conduct an accurate assessment of the braking reliability of kilometer-deep wells. The reliability of the brake disc under emergency braking is examined by comparing the reliability of the coated and uncoated brake discs.
5.1. Stochastic Response Modeling
According to the real braking conditions of disc brakes, the brake specific pressure, friction pair area, friction coefficient, elastic modulus, and brake disc thickness are treated as random variables, and their statistical properties are presented in Table 16.
Table 16.
Statistical properties of random variables.
According to the properties of the selected random variables, Latin hypercube sampling (LHS) is utilized to select the values of the random variables, and a Kriging model is employed to establish the functional relationship between the random variables and the temperature response. The temperature response functions with respect to the random variables of the uncoated and coated brake discs can be expressed as Equations (14) and (15), respectively:
5.2. Reliability Estimation Based on Saddlepoint Approximation
The SPA method can be used to estimate the output distribution of a multivariate function for a joint probability distribution of input random variables. For a joint PDF of input vector X, the moment-generating function (MGF) is defined as Equation (16):
and the cumulant generating function (CGF) is
Once is available, SPA is readily applicable for estimating the probability of failure by the following equation:
where is the PDF of a standard normal variable, and w and v can be calculated using and , respectively. sign () is the sign function.
Here, is the saddlepoint and can be solved by the following equation:
where and are the first and second derivatives of the CGF , respectively.
The key problem to be solved in this paper is the thermal deformation and thermal crack caused by the high surface temperature of the brake disc. Thus, for a breaking reliability estimation of the brake disc, the performance functions of the uncoated and coated brake disc are respectively defined as
where is the random variable vector. T0 is the limit temperature at which failure occurs, and T0 = 192 °C.
Based on the saddlepoint approximation, the failure probabilities of the uncoated brake disc Pf1 and coated brake disc Pf2 are calculated as
The results show that the failure probability of the coated disc brake under emergency braking conditions is greatly reduced. From another perspective, the probability that the internal thermal stress of the brake disc exceeds its material yield limit during emergency braking is also greatly reduced after the application of thermal barrier coating technology; that is, the possibility of thermal deformation or thermal crack failure of the brake disc is greatly reduced.
6. Conclusions
To enhance the reliability of the brake disc of a 1000 m deep well hoist, the thermal–structural coupling characteristics of the hoist brake under emergency braking conditions are studied. The surface performance and the reliability of coated and uncoated brake discs are compared. Several conclusions are summarized as follows:
- (1)
- Through friction and wear tests of YSZ coatings with different Y2O3 doping concentrations, taking the wear amount, friction coefficient, and friction coefficient variance as reference indexes, it is found that a YSZ coating with an 8 wt.% Y2O3 doping concentration has the best friction and wear performance among all the samples.
- (2)
- After conducting a thermal–structural coupling analysis on uncoated and coated brake discs during emergency braking conditions, this research compares the temperature characteristics of the two types of brake discs. It is discovered that the temperature fluctuation of the coated brake disc is much lower, and its temperature distribution is more uniform during the emergency braking process.
- (3)
- By comparing the failure probabilities of uncoated and coated brake discs under emergency braking conditions, it is found that the failure probability of the coated brake disc is greatly reduced, which means that the application of thermal barrier coating technology significantly enhances the reliability of the brake disc because the use of the coating significantly reduces the rise in frictional temperature.
Author Contributions
Conceptualization, W.Y. and H.L.; Investigation, Y.T.; Methodology, H.L.; Resources, F.R.; Supervision, Z.Z.; Writing—original draft, W.Y.; Writing—review and editing, H.L. All authors have read and agreed to the published version of the manuscript.
Funding
This project was supported by the National Natural Science Foundation of China (number: 52375277, 51875567, 52274155) and a project funded by the Priority Academic Program Development of Jiangsu Higher Education Institutions (PAPD).
Data Availability Statement
The original contributions presented in this study are included in the article. Further inquiries can be directed to the corresponding author.
Conflicts of Interest
The authors declare no conflicts of interest.
Correction Statement
This article has been republished with a minor correction to the Data Availability Statement. This change does not affect the scientific content of the article.
References
- Popescu, F.D.; Radu, S.M.; Andraș, A.; Brînaș, I. Numerical modeling of mine hoist disc brake temperature for safer operation. Sustainability 2021, 13, 2874. [Google Scholar] [CrossRef]
- Kepekci, H.; Kosa, E.; Ezgi, C.; Cihan, A. Three-dimensional CFD modeling of thermal behavior of a disc brake and pad for an automobile. Int. J. Low-Carbon Technol. 2020, 15, 543–549. [Google Scholar] [CrossRef]
- Wang, Z.; Han, J.; Liu, X.; Li, Z.; Yang, Z.; Chen, E. Temperature evolution of the train brake disc during high-speed braking. Adv. Mech. Eng. 2019, 11, 1687814018819563. [Google Scholar] [CrossRef]
- Belhocine, A.; Omar, W.Z.W. Computational fluid dynamics (CFD) analysis and numerical aerodynamic investigations of automotive disc brake rotor. Aust. J. Mech. Eng. 2018, 16, 1–18. [Google Scholar] [CrossRef]
- Wang, D.; Wang, R.; Heng, T.; Xie, G.; Zhang, D. Tribo-brake characteristics between brake disc and brake shoe during emergency braking of deep coal mine hoist with the high speed and heavy load. Energies 2020, 13, 5094. [Google Scholar] [CrossRef]
- Kalamegam, P.; Chong, P.L.; Faraji, F.; Moey, L.K.; Manan, M.S.A.; Roy, S. A comparative study of thermo-mechanical performance of brake rotor discs using finite element analysis. Int. J. Interact. Des. Manuf. 2025, 19, 5383–5395. [Google Scholar] [CrossRef]
- Zuo, J.; Zheng, S.; Wang, X. The thermo-mechanical coupling method of brake disc based on dynamic convective heat transfer. Numer. Heat Transfer. Part A Appl. 2024, 1–15. [Google Scholar] [CrossRef]
- Hong, H.; Kim, M.; Lee, H.; Jo, I.; Jeong, N.; Moon, H.; Suh, M.; Lee, J. A study on an analysis model for the thermo-mechanical behavior of a solid disc brake for rapid transit railway vehicles. J. Mech. Sci. Technol. 2018, 32, 3223–3231. [Google Scholar] [CrossRef]
- Abdullah, O.I.; Schlattmann, J.; Majeed, M.H.; Sabri, L.A. The temperatures distributions of a single-disc clutches using heat partitioning and total heat generated approaches. Case Stud. Therm. Eng. 2018, 11, 43–54. [Google Scholar] [CrossRef]
- Orłowicz, A.; Mróz, M.; Wnuk, G.; Markowska, O.; Homik, W.; Kolbusz, B. Coefficient of Friction of a Brake Disc-Brake Pad Friction Couple. Arch. Foundry Eng. 2016, 16, 196–200. [Google Scholar] [CrossRef]
- Yevtushenko, A.; Kuciej, M.; Topczewska, K. Effect of the temporal profile of the friction power on temperature of a pad-disc brake system. J. Theor. Appl. Mech. 2019, 57, 461–473. [Google Scholar] [CrossRef] [PubMed]
- Le Gigan, G. Improvement in the brake disc design for heavy vehicles by parametric evaluation. Proc. Inst. Mech. Eng. Part D J. Automob. Eng. 2017, 231, 1989–2004. [Google Scholar] [CrossRef]
- Jin, Y.; Chen, L.; Cheng, C. Thermal behavior of friction discs in dry clutches based on a non-uniform pressure model. Case Stud. Therm. Eng. 2022, 32, 101895. [Google Scholar] [CrossRef]
- Zhang, Y.; Jin, X.; He, M.; Wang, L.; Wang, Q.; Wang, L.; Wu, Y. The convective heat transfer characteristics on outside surface of vehicle brake disc. Int. J. Therm. Sci. 2017, 120, 366–376. [Google Scholar] [CrossRef]
- Kim, D.; Seok, C.; Koo, J.; We, W.; Goo, B.; Won, J. Fatigue life assessment for brake disc of railway vehicle. Fatigue Fract. Eng. Mater. Struct. 2009, 33, 37–42. [Google Scholar] [CrossRef]
- Belhocine, A.; Abdullah, O.I. Thermomechanical model for the analysis of disc brake using the finite element method in frictional contact. Multiscale Sci. Eng. 2019, 43, 305–320. [Google Scholar] [CrossRef]
- Benhassine, N.; Haiahem, A.; Bou-Said, B. A comparative study of the transient thermomechanical behavior of friction of the ceramic brake discs: Temperature field effect. J. Mech. Sci. Technol. 2019, 33, 233–240. [Google Scholar] [CrossRef]
- Lü, H.; Yu, D. Optimization design of a disc brake system with hybrid uncertainties. Adv. Eng. Softw. 2016, 98, 112–122. [Google Scholar] [CrossRef]
- Li, J.; Jiang, S.; Li, M.; Xie, J. A fault diagnosis method of mine hoist disc brake system based on machine learning. Appl. Sci. 2020, 10, 1768. [Google Scholar] [CrossRef]
- Ren, F.; Chen, G.; Lu, H.; Cao, S. The probabilistic modeling and reliability analysis of brake shoes for hoist disc brake with correlated failure modes. Adv. Mech. Eng. 2020, 12, 1687814020934596. [Google Scholar] [CrossRef]
- Xu, G.; Song, D.; Zhang, D.; Zhang, X.; Sha, S. A novel mechanical design of disc brakes for fault diagnosis and monitoring positive braking pressure in mine hoist. Adv. Mech. Eng. 2019, 11, 1687814019842494. [Google Scholar] [CrossRef]
- Yang, Z.; Li, Z.; Kou, M.; Zhang, Y. Reliability sensitivity analysis of automotive disc brake with multiple failure modes correlation. Proc. Inst. Mech. Eng. Part C J. Mech. Eng. Sci. 2025, 239, 2715–2730. [Google Scholar] [CrossRef]
- Barbosa, M.P.F.; Rade, D.A. Kriging/FORM reliability analysis of rotor-bearing systems. J. Vib. Eng. Technol. 2022, 10, 2179–2201. [Google Scholar] [CrossRef]
- Lee, S.H.; Choi, H.S.; Kwak, B.M. Multilevel design of experiments for statistical moment and probability calculation. Struct. Multidiscip. Optim. 2008, 37, 57–70. [Google Scholar] [CrossRef]
- Wang, Z.; Feng, Y.; Yang, Y.; Wang, J.; Xu, S.; Qin, J. Multi-objective optimization of rectangular cooling channel design using Design of Experiments (DOE). Appl. Therm. Eng. 2024, 242, 122507. [Google Scholar] [CrossRef]
- Du, X. Saddlepoint Approximation for Sequential Optimization and Reliability Analysis. J. Mech. Des. 2008, 130, 011011. [Google Scholar] [CrossRef]
- Du, X. System reliability analysis with saddlepoint approximation. Struct. Multidiscip. Optim. 2010, 42, 193–208. [Google Scholar] [CrossRef]
- Viana, F.A.C.; Simpson, T.W.; Balabanov, V.; Toropov, V. Special section on multidisciplinary design optimization: Metamodeling in multidisciplinary design optimization: How far have we really come? AIAA J. 2014, 52, 670–690. [Google Scholar] [CrossRef]
- Turner, C.J. Hypermodels: Hyperdimensional Performance Models for Engineering Design. Ph.D. Thesis, The University of Texas at Austin, Austin, TX, USA, 2005. [Google Scholar]
- Jia, D.-W.; Wu, Z.-Y. An improved adaptive Kriging model-based metamodel importance sampling reliability analysis method. Eng. Comput. 2024, 40, 2925–2946. [Google Scholar] [CrossRef]
- Huang, S.-Y.; Zhang, S.-H.; Liu, L.-L. A new active learning Kriging metamodel for structural system reliability analysis with multiple failure modes. Reliab. Eng. Syst. Saf. 2022, 228, 108761. [Google Scholar] [CrossRef]


Disclaimer/Publisher’s Note: The statements, opinions and data contained in all publications are solely those of the individual author(s) and contributor(s) and not of MDPI and/or the editor(s). MDPI and/or the editor(s) disclaim responsibility for any injury to people or property resulting from any ideas, methods, instructions or products referred to in the content. |
© 2025 by the authors. Licensee MDPI, Basel, Switzerland. This article is an open access article distributed under the terms and conditions of the Creative Commons Attribution (CC BY) license (https://creativecommons.org/licenses/by/4.0/).