Abstract
Lubrication failure has become a predominant failure mode in aviation roller bearings. Timely identification of lubrication degradation is critical for preventing premature bearing failure. This paper presents a fuzzy identification method of lubrication degradation stages by fusing multiple indicators. Firstly, four monitoring indicators, including the oil film thickness (OFT), wear surface roughness (WSR), contact resonance frequency (CRF), and amplitude of CRF (CRFA), are extracted through numerical simulations to characterize the lubrication degradation process. Then, a fuzzy evaluation method is proposed to identify the lubrication degradation stages by integrating these indicators. The results indicate that these four indicators can identify three typical stages of the lubrication degradation process—good lubrication, normal wear, and severe wear, with an accuracy rate exceeding 92%. Finally, lubrication degradation experiments are carried out on a sliding-rolling test rig to verify the method’s effectiveness. This work provides superior interpretability of the multifactorial coupled lubrication degradation process analysis.
1. Introduction
In aircraft engines, cylindrical roller bearings inevitably operate under high temperatures, high speeds, heavy loads, and other extreme conditions, and lubrication failure often emerges as the predominant failure mode [,,]. This phenomenon arises from the tribological coupling behaviors at the line contact interfaces, including hydrodynamic effects, frictional contact, and wear evolution, which significantly accelerate the degradation of lubrication performance [,]. Timely identification of lubrication degradation and implementation of maintenance strategies are critical for preventing premature bearing failures.
The Stribeck curve, as a classical framework in elastohydrodynamic lubrication theory, provides macroscopic judgment criteria for identifying the lubrication degradation—from full-film to mixed and boundary lubrication—by delineating nonlinear evolution patterns of the friction coefficient concerning operational parameters such as velocity, load, and viscosity []. In fundamental experimental studies, the identification of lubrication degradation has traditionally relied on the Stribeck curve [,]. However, in engineering applications, this approach faces challenges in the online measurement of the friction coefficient and operational parameters due to sensor integration. Furthermore, while the Stribeck curve reveals macroscopic trends in lubrication regime transitions, it fails to establish quantitative criteria for identifying the lubrication degradation. To address these limitations, the film thickness ratio λ (defined as the ratio of the nominal minimum lubricant film thickness and the composite root mean square surface roughness height) has been proposed as a quantitative indicator, with empirical thresholds conventionally set as λ < 1 for boundary lubrication, 1 < λ < 3 for mixed lubrication, and λ > 3 for full-film lubrication []. Nevertheless, this empirical relationship was derived from early stochastic analyses. Due to inadequate consideration of surface topography evolution and heterogeneous asperity contact distribution, it exhibits insufficient identification accuracy.
With advancements in sensing and information science technology, researchers have investigated the correlation between the lubrication degradation process and various condition monitoring signals to identify different lubrication states. For instance, given the analogous trends displayed for acoustic emission (AE) signals and oil film thickness concerning lubricant viscosity, Hou et al. [] proposed a methodology for estimating bearing lubrication states based on AE features. Xing et al. [] extracted the friction-induced vibration signals with two different amplitude–frequency characteristics and explored their relationships with various friction states. Results show that the friction-induced vibration can be used to identify boundary, mixed, and fluid friction states. Duan et al. [] conducted experimental studies on the identification of lubrication states of line contact friction pairs, and results showed that the oil film thickness measured via the ultrasonic method can distinguish elastohydrodynamic lubrication from mixed lubrication. Subsequently, the application of machine learning algorithms has significantly advanced the lubrication identification research field. By integrating clustering algorithms, artificial neural networks, and other machine learning methods, the mapping models between the above monitoring features and the lubrication degradation states were constructed [,,]. These methods effectively improve the accuracy and efficiency of lubrication degradation identification efforts.
The above investigations characterized the lubrication degradation process of friction pair interfaces through multi-dimensional analyses, encompassing oil film thickness, surface friction, and wear. However, from the perspective of the lubrication degradation mechanism, a single physical monitoring method is usually effective for a specific lubrication state. For instance, the oil film thickness monitoring is only applicable to a full-film lubrication state, while the vibration and acoustic emission methods become meaningful during the lubrication states involving surface contacts. Therefore, using a single physical monitoring indicator, it is difficult to characterize the entire lubrication degradation process. Moreover, current investigations predominantly depend on qualitative trend comparisons with the Stribeck curve, exhibiting a critical deficiency in mechanistic interpretability.
Physics-informed, data-driven (PIDD) methodologies have revolutionized conventional lubrication modelling and identification paradigms by embedding fluid dynamics-governing equations (e.g., Navier–Stokes and Reynolds equations) as constraints within neural network architectures []. This approach enables accurate prediction of key tribological parameters, including oil film thickness, pressure distribution, elastic deformation, and friction coefficients, while simultaneously identifying lubrication states. For instance, Zhao et al. [,,] applied the physics-informed neural network (PINN) to the analysis of 2D hydrodynamic lubrication, demonstrating that the PINN could achieve satisfactory accuracy in calculating the film thickness, pressure distributions, and elastic responses. Xia et al. [] developed a PINN model to address both forward and inverse problems related to frictional contact temperature. The results show that the PINN exhibits exceptional predictive accuracy across various operational scenarios. Tang et al. [] used a multiscale lubrication neural network model (MLNN) to solve the Reynolds equation for rough surfaces exhibiting complex multiscale features. The proposed model reduces errors in terms of predicting the pressure distribution and load-carrying capacity, which are crucial for optimizing tribological systems requiring accurate surface interaction modelling. Although PIDD methods offer novel analytical perspectives, current research studies remain limited to parameter prediction and methodological validation, lacking robust solutions for tracking lubrication degradation processes under coupled tribological behaviors at contact interfaces. Further development is needed to address complex engineering scenarios requiring domain-specific knowledge integration.
In summary, while the classical Stribeck curve lays the theoretical foundation for lubrication state identification, its engineering applications face limitations due to the challenges in real-time monitoring of intrinsic parameters and the absence of precise identification criteria. Various physical monitoring methods, including vibration, acoustic emission, and oil film thickness monitoring, can effectively identify the lubrication states with the collaboration of machine learning algorithms. However, existing studies predominantly rely on a single physical monitoring indicator, limiting comprehensive analysis efforts. Additionally, their black box nature compromises the interpretability. Although PIDD approaches have advanced the lubrication identification research through the prediction of key tribological parameters, it is still in a preliminary research stage and is not sufficient to explain the complex degradation process involving coupled frictional behaviors. The above analysis reveals two key shortcomings in current lubrication state identification research: (1) a single physical monitoring indicator is insufficient to characterize the complete lubrication degradation process; (2) the mechanism interpretation of the degradation process remains inadequate.
To address these two issues, this study proposes a fuzzy evaluation method for lubrication degradation state identification. Based on the coupled degradation mechanisms (oil film rupture, solid contact, and surface wear) in rolling–sliding contacts, multiple monitoring indicators extracted from the mixed elastohydrodynamic lubrication and contact dynamic models are integrated to characterize the complete lubrication degradation process. Distinct from existing machine learning and PIDD methods, this study assesses the diagnostic value of multiple monitoring indicators through mechanism evolution law and probability distribution to distinguish three typical lubrication degradation stages, which provides the superior interpretability of the multifactorial coupled lubrication degradation process analysis.
This paper is organized as follows. Section 2 introduces the methodology for characterizing lubrication degradation. Section 3 proposes a multi-index fusion approach for lubrication degradation identification. Experimental validation methods and results are detailed in Section 4, followed by conclusions in Section 5.
2. Lubrication Degradation Characterization
The lubrication degradation process of a line contact friction pair under ideal conditions is simulated using a coupled mixed-EHL model and contact dynamic model. Four key monitoring indicators are extracted to characterize this process—the oil film thickness (OFT), wear surface roughness (WSR), contact resonance frequency (CRF), and amplitude of CRF (CRFA). The evolutionary trend analysis reveals three distinct degradation stages—good lubrication, normal wear, and severe wear, as illustrated in Figure 1.
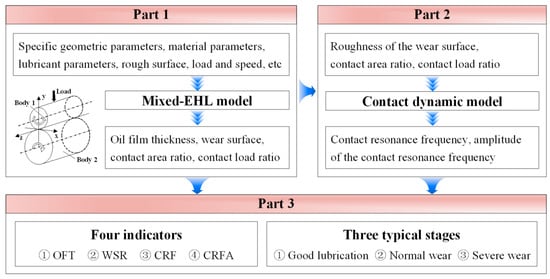
Figure 1.
The lubrication degradation characterization workflow.
2.1. Mixed-EHL Model
The mixed-EHL model is established with a mixed elastohydrodynamic lubrication analysis software that is capable of analyzing lubrication and contact characteristics in a wide range of operating conditions and simulating surface interactions in a full spectrum of lubrication regimes, from full-film and mixed lubrication down to boundary lubrication and dry contact. This commercial software, provided by Tri-Tech Solutions Inc., was developed by Professor Dong Zhu, a leading scholar in tribology, based on many years of research documented in technical papers. Numerous model validation cases have been conducted to ensure the accuracy of numerical simulation results in his early studies [,,,,]. The governing equations are detailed below.
Under mixed lubrication conditions, the pressure within the entire domain is governed by the Reynolds equation below []:
where the -coordinate coincides with the motion direction, is the pressure distributed over the solution domain, and is the sliding velocity; is the lubricant density, which can be expressed as []:
where is the density of the lubricant at . The effective viscosity is calculated as follows to describe the non-Newtonian effects []:
where is a reference shear stress and denotes the shear stress acting on the lower surface. The viscosity follows the Barus rule, which can be expressed as []:
where is the lubricant viscosity at and is the pressure–viscosity exponent.
The local oil film thickness (or gap between two rough surfaces) is formulated as []:
Here, is the normal approach between the contacting bodies, refers to the effective radii of curvature across the contact width, and and denote the real roughness heights of surfaces 1 and 2, respectively. The surface elastic deformation is obtained through the Boussinesq integral []:
where is the equivalent elastic modulus and indicates the entire solution domain.
The load balance equation is []:
Friction in mixed lubrication is usually considered as the comprehensive effect of hydrodynamic friction and asperity contact friction. The shear stress in the hydrodynamic area can be estimated by the Bair–Winer model, expressed as []:
in which the limiting shear stress and the limiting shear elastic modulus are functions of pressure and temperature that can be estimated empirically. The flash temperature is calculated as follows []:
where is the heat generated either by the lubricant shear stress in the hydrodynamic areas or the boundary friction in the asperity contact areas.
In the asperity contact area, the friction coefficient is assumed as a constant (typically between 0.08 and 0.12) [], and the shear stress can be expressed as:
The total friction can then be obtained through the integration of shear stress over the entire domain, which can be expressed as:
where is the hydrodynamic area and is the asperity contact area.
Based on the above basic governing equations, the specific rough surfaces, constant geometric parameters, material parameters, lubricant properties, and operating conditions are input into the mixed-EHL solver. The mixed-EHL solver numerically solves the Reynolds equation using a finite difference scheme on a 256 × 256 structured grid. The computational domain spans [−1.9a, 1.9a] × [−1.6b, 1.6b] in the x-y plane, where a and b represent the Hertzian contact ellipse semi-axes. The rough surfaces are dynamically updated at each time step, and after convergence, yielding spatial distributions of film thickness, pressure, contact ratio, and friction coefficient. These results reflect the friction contact behavior under different lubrication states. The major input geometric, material, and lubricant parameters are summarized in Table 1.

Table 1.
The lubrication degradation simulation method.
To validate the model accuracy, a specific case was conducted using the parameters in Table 1, with a load of 500 N, speeds ranging from 4 to 0.2 m/s, and a composite surface roughness of 0.5 μm. Figure 2 illustrates the evolution of surface contact states during lubrication degradation. In the solution domain, the color gradient from blue to red indicates regions filled with lubricant where the oil film progressively thins, while yellow areas represent asperity contact due to film rupture, as shown in Figure 2e. Oil film distributions along the Hertzian contact centerline at different speeds are depicted in Figure 3. Both axes display the dimensionless values. The Y-axis indicates positions along the contact length. The dimensionless OFT is obtained by dividing the average OFT in the Hertz contact area by the Hertz contact width.
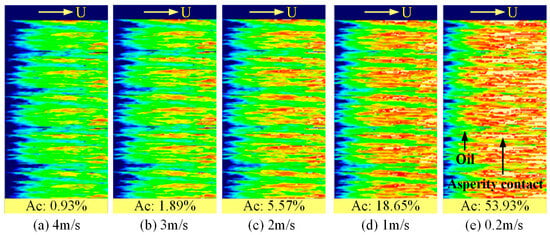
Figure 2.
The evolution of surface contact states during lubrication degradation.
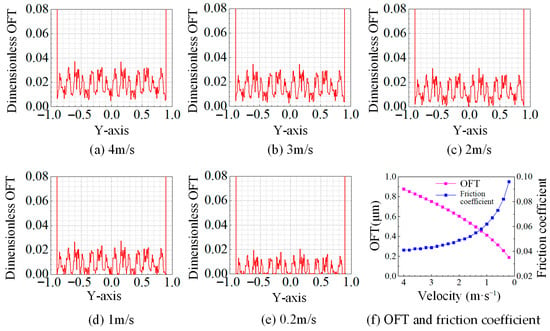
Figure 3.
The oil film distribution during lubrication degradation.
At 4 m/s, the friction pair approaches a full-film lubrication state, with an asperity contact ratio of only 0.93%, as shown in Figure 2a and Figure 3a. As speed decreases, the reduced hydrodynamic pressure leads to the gradual film thinning and an increased asperity contact ratio (Figure 2b–d and Figure 3b–d). At 0.2 m/s, extensive film rupture occurs, resulting in zero film thickness and an asperity contact ratio of 53.93% (Figure 2e and Figure 3e). The average OFT and friction coefficient under varying speeds are depicted in Figure 3f. During lubrication degradation, the OFT progressively decreases, varying within a range of 0.18–0.88 μm. These values align broadly with predictions from the classical Dowson–Higginson formula (1.1507–0.1413 μm), with the discrepancy attributable to the incorporation of surface roughness effects in the present model. The friction coefficient initially exhibits a stable state followed by a rapid increase. This trend indicates that frictional forces in the initial phase of lubrication degradation originate primarily from shear within the lubricating fluid, then asperity contact friction becomes dominant due to the increased contact area. These observations are consistent with the fundamental principles of EHL theory.
2.2. Contact Dynamic Model
The contact dynamic behavior of the line contact friction pair is described by a two-dimensional mass spring damping system, as shown in Figure 4a []. The mass block slides at a constant velocity over a rough surface. Taking into account the damping force, spring force, and external load acting on the mass, the equation of motion for the system can be expressed as:
where and denote the system input and output, respectively, and corresponds to the rough surface profile. The damping coefficient is represented by , while denotes the Hertzian contact stiffness; refers to the static spring compression, and indicates the instantaneous spring compression. The spring restoring force is directly proportional to the difference in spring compression . represents the external load.
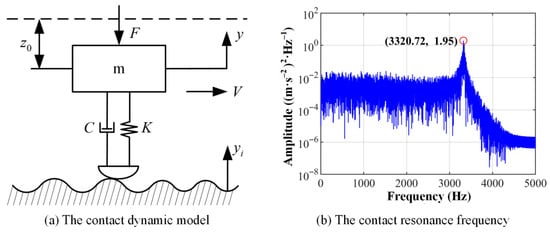
Figure 4.
The contact dynamic model and the contact vibration response.
The Hertz contact stiffness can be linearized to facilitate solving the system’s vibration response. Under constant load and small-amplitude vibration conditions, the nonlinear spring force may be approximated by an equivalent linear spring force, whose stiffness corresponds to the incremental stiffness. The motion of the mass block sliding over the rough surface can be approximated as the contact between a sphere and a smooth plane. Based on Hertz contact theory, when the contact spring reaches equilibrium under the applied external load, the static compression is given by []:
where denotes the equivalent elastic modulus and represents the equivalent contact radius.
The incremental stiffness is derived by differentiating Equation (14), yielding:
Then, the theoretical CRF can be expressed as []:
In contact dynamics, the damping coefficient is commonly derived from experimentally measured damping ratios, typically ranging from 0.01 to 0.1. The damping coefficient can be obtained as:
where represents the damping ratio, which is assigned a value of 0.02 in this model. Thus, Equation (13) can be simplified as:
The rough surface is simulated using Gaussian white noise subjected to low-pass filtering. This processing converts the two-dimensional spatial surface profile into a temporal displacement input. Notably, the amplitude variation corresponds to the surface height modification, while the cut-off frequency adjustment represents the sliding velocity changes. Equation (15) is solved numerically using a fifth-order Runge–Kutta algorithm. Without additional signal processing, the characteristic frequency can be directly extracted from the power spectral density (PSD) of the acceleration response.
To validate the accuracy of the contact dynamic model, a specific case was examined with the following parameters: , , , , . Using Equations (14)–(17), the following parameters were calculated: , , , Subsequently, the Gaussian white noise was low-pass-filtered at a cut-off frequency of 30 Hz to generate a rough surface with an amplitude of 2 μm. Both the derived parameters and the rough surface were incorporated into the contact dynamic model for solution. As illustrated in Figure 4b, a characteristic frequency at (3320.72, 1.95) can be identified as the CRF, which is consistent with the theoretical CRF calculated by Equation (16), thereby confirming the validity of the dynamic model.
During the lubricant degradation of the line contact friction pair, the reduction in OFT leads to surface asperity contacts, transitioning into the mixed lubrication condition. As the asperity contact area increases, surface wear initiates and progresses, eventually inducing system vibration when the wear becomes severe. Consequently, the lubrication degradation process cannot be adequately characterized by any single parameter of the oil film, wear surface, or vibration alone. In this study, the OFT, WSR, asperity contact area ratio, and contact load ratio can be obtained through the mixed-EHL model. The solved WSR, asperity contact area ratio, and contact load ratio are then incorporated into the contact dynamic model to determine the CRF and CRFA. Figure 5 shows a mathematical flowchart of the parameter transfer relationship between two models. The specific method is detailed below:
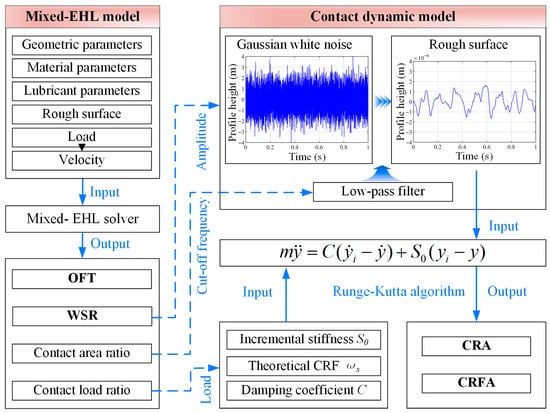
Figure 5.
The mathematical flowchart of the mixed-EHL model and contact dynamic model.
- (1)
- The WSR represents the surface profile height within the contact dynamic model. The Gaussian white noise was low-pass-filtered to generate a rough surface profile with the same value as the WSR.
- (2)
- Given a constant external load, the asperity contact load ratio during lubrication degradation can be utilized to determine the contact load, incremental stiffness, damping coefficients, and theoretical CRF.
- (3)
- The cut-off frequency corresponds to the sliding velocity, representing the number of asperities traversed by the mass block per unit time. Consequently, the contact area ratio during lubrication degradation corresponds to the cut-off frequency. Here, the contact area ratio can be regarded as a coefficient for adjusting the cut-off frequency, thereby investigating the CRF evolution.
2.3. Characterisation Indicators Extraction
The lubrication degradation process of a line contact friction pair is simulated through the mixed-EHL model and contact dynamic model. The simulation method is detailed in Table 2, and comprises two distinct phases:

Table 2.
The operating parameters for lubrication degradation simulation.
- (1)
- Maintaining a constant surface topography (μm) and a normal load, an oil film-dominated lubrication degradation state is simulated by progressively reducing the sliding velocity from 4 m/s to 2 m/s in 21 discrete steps (with an interval of 0.1 m/s).
- (2)
- Then, with the fixed velocity (2 m/s) and normal load, a surface wear-dominated lubrication degradation state is simulated by incrementally increasing the surface roughness from 0.6 μm to 4 μm in 35 steps (with an interval of 0.1 μm).
Throughout both phases, the OFT, WSR, asperity contact area ratio, and contact load ratio are recorded for each simulation step. Then, the WSR, asperity contact area ratio, and contact load ratio are input into the contact dynamic model to compute the CRF and CRFA. This set of data is used to establish the fuzzy identification model for the next section. Following a complete simulation cycle, the surface topography is regenerated to establish a new set of data for subsequent model validation.
Figure 6 presents the evolution of four indicators (OFT, WSR, CRF, CRFA) during the lubrication degradation. The horizontal axis represents the sampling number of 56 sets of data. It can be seen from Figure 6a that in the oil film-dominated stage, the OFT exhibits gradual reduction until WSR-induced surface gap formation triggers linear growth in the OFT. Figure 6b shows the constant and linearly increasing WSR simulated in the mixed-EHL model. It can be seen from Figure 6c,d that in the oil film-dominated stage, minimal asperity contact maintains low CRF and CRFA values, while progressive surface wear drives their subsequent increase.
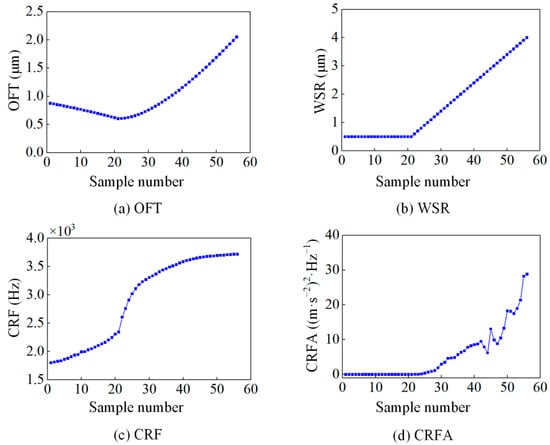
Figure 6.
Four monitoring indicators of the lubrication degradation process.
Based on the evolutionary trend of four indicators, the lubrication degradation process exhibits three distinct stages:
- (1)
- Good lubrication stage (samples 1–21): Characterized by the decreasing OFT and increasing CRF, this stage maintains constant WSR and near-zero CRFA despite minimal asperity contact, indicating a good lubrication state.
- (2)
- Normal wear stage (samples 22–41): Emerging surface wear drives linear WSR growth and corresponding OFT increases, accompanied by elevated CRF and CRFA values due to enhanced asperity contact. Therefore, this stage is characterized by the increasing OFT, WSR, CRF, and CRFA, indicating a normal wear state.
- (3)
- Severe wear stage (samples 42–56): Marked by linearly increasing OFT and WSR, this stage shows CRF stabilization and significant CRFA fluctuations resulting from coupled contact area, load, and roughness effects. This stage is distinguished by the differences in OFT, WSR, and CRFA, indicating a severe wear state.
2.4. Discussion
- (1)
- The physical interpretability of four indicators
The proposed modelling framework and indicator extraction methodology demonstrate that all four parameters possess distinct physical significance and collectively provide essential characterization of the lubrication degradation process. Specifically, the OFT can effectively quantify the lubricating oil film during full-film lubrication, but it becomes less important for lubrication degradation characterization once the oil film ruptures and the asperity contact occurs. The WSR serves as a direct measure of surface wear. Due to its inherent statistical nature and negligible elastic deformation effects, it exhibits limited sensitivity for slight asperity contact, and significant WSR variations only emerge during severe wear stages. The CRF demonstrates high sensitivity to asperity contacts, enabling real-time monitoring of contact state transitions through characteristic frequency shifts correlated with contact load variations. The CRFA serves as a robust indicator of the late-stage degradation, where nonlinear coupling between the surface morphology, contact area, and contact load induces characteristic fluctuation patterns indicative of a severe wear state (see [] for complete analysis).
This study focuses on extracting lubrication degradation indicators from mechanism models. Nevertheless, it is necessary to discuss the feasibility of other monitoring parameters such as the temperature, acoustic emission features, and friction coefficient. Although temperature critically influences lubrication degradation, its effect predominantly manifests as oil film thinning and eventual rupture. Acoustic emission monitoring relies on detecting elastic stress waves generated by dynamic interfacial events, including film collapse, asperity contact, and wear particle generation. It remains difficult to establish a mapping relationship between acoustic emission features and lubrication states through physical models. While the friction coefficient serves as a direct indicator of lubrication conditions under Stribeck theory, its accurate measurement in practical engineering applications is often unfeasible. Therefore, the four indicators used in this study may be more reasonable.
In addition, this study adopts an idealized lubrication degradation simulation method, disregarding operational variations such as fluctuating loads, temperatures, and contamination. These factors, which are intrinsically linked to the four indicators, merit further consideration. Load directly influences the CRF. The absence of CRF excitation under fluctuating load suggests adequate lubrication, whereas its presence indicates oil film rupture—characteristic of normal or severe wear stages. Temperature variations are captured directly through changes in OFT, and do not affect the generalizability of the proposed method. Contaminants exhibit a negligible impact on the OFT under good lubrication conditions. However, under normal or severe wear stages, micron-scale contaminants at the interface can behave similarly to the surface roughness, leading to unstable CRFA values. In summary, the lubrication state in this study is characterized collectively by four indicators and ultimately determined through probabilistic distribution. Although real-world operational variations introduce uncertainty, their impact is not deterministic.
- (2)
- Three typical lubrication degradation stages
The current classification of lubrication degradation stages follows the Stribeck curve, which distinguishes between full-film, mixed, and boundary lubrication regimes. However, this approach presents two limitations: (1) the absence of precise differentiation criteria; (2) for the prolonged mixed lubrication conditions commonly encountered in point and line contacts, it is difficult to further determine the state at the contact interface. This study, therefore, proposes a contact-based classification method consisting of three distinct stages: (i) non-contact (good lubrication); (ii) initial contact (normal wear); (iii) large area contact (severe wear), which provides more precise characterization of the lubrication degradation process for point and line contact scenes.
- (3)
- The lubrication degradation modelling framework
It is well established that replicating the lubrication degradation through numerical simulations or experimental methods presents significant complexity and time requirements, as the process involves lubricant thermal degradation, asperity contact and deformation, and surface wear. Consequently, fundamental studies typically employ idealized degradation protocols, with velocity variation being the most common control parameter [,]. Given the protracted nature of wear development, this study implements an alternative approach by simulating wear progression through controlled surface roughness variation.
The adopted simulation methodology represents an idealized scenario that may not fully conform to real-world lubrication degradation, particularly under noisy and unstable operational conditions. However, the four indicators possess fundamental physical significance and enable robust lubrication degradation characterization. Crucially, regardless of the operational variability or degradation sequences, an integrated analysis of these indicators’ evolutionary patterns permits unambiguous identification of current degradation stages.
In summary, this section establishes a coupled modelling framework for lubrication degradation analyses, integrating the mixed-EHL model with the contact dynamic model. Although the mixed-EHL model can effectively simulate the degradation process, experimental measurements of real-time contact state evolution remain challenging. To bridge this gap, a contact dynamic model is adopted by taking the contact ratio variations as inputs to solve for contact vibration. The synergistic integration of these models generates four physically meaningful degradation indicators for line contact friction pairs.
3. Lubrication Degradation Identification Based on Multi-Index Fusion
While all four indicators collectively characterize the complete lubrication degradation process, each contributes uniquely to different degradation stages. This study employs a fuzzy evaluation method that dynamically adjusts indicator weights based on their stage-specific relevance. The methodology involves (1) calculating dynamic weights using the importance of criteria through the inter-criteria correlation (CRITIC) method [], (2) determining membership degrees for each degradation stage, and (3) constructing a fuzzy evaluation probability function for identification. Figure 7 illustrates the methodological workflow.
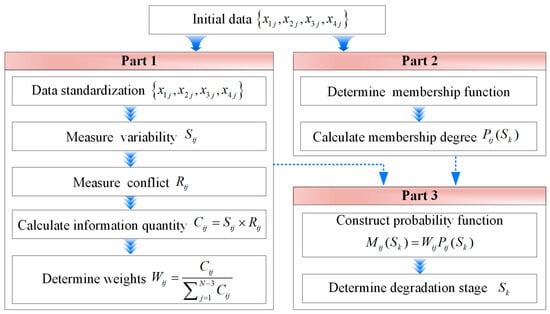
Figure 7.
The fuzzy identification workflow of lubrication degradation stages.
3.1. Weight Assigning
The CRITIC method is an objective weighting technique that quantifies the relative importance of indicators through two dimensions: (1) contrast intensity, measured by data variability, where higher variability indicates greater information content and larger weights; (2) conflict, assessed via inter-indicator correlations, where stronger correlations imply higher redundancy and consequently smaller weights. This approach prioritizes indicators with substantial independent information while minimizing redundancy, ensuring robust weight allocation.
As illustrated in Figure 6, the four indicators evolve continuously throughout the lubrication degradation process, implying that the weight of each indicator also varies dynamically. Therefore, the CRITIC method was applied iteratively to compute time-varying weights. In this study, with four indicators and only 56 samples per indicator, a window size equal to the number of indicators (i.e., four samples per group) was used to ensure computational reliability in estimating variability and conflict. This may be the minimum requirement for reliability calculation. For cases with larger sample sizes, it is recommended to use a window exceeding 5–10 times the number of indicators to enhance the robustness of the results. The implementation procedure consists of the following steps.
- (i)
- Data standardization using the min-max normalization method:
- (ii)
- Measure the variability of four indicators using standard deviation:
- (iii)
- Measure the conflict of four indicators using correlation coefficients:
- (iv)
- Calculate the information content based on the variability and conflict:
Here, a larger indicates greater importance of this indicator.
- (v)
- Normalize the information content to obtain the final weights :
3.2. Membership Degree Calculation
According to Section 2.3, the lubrication degradation process can be divided into three stages—good lubrication, normal wear, and severe wear, represented by , , and , respectively. Using the Gaussian membership function as the fuzzy membership function, the membership degree of each sample for different stages can be expressed as []:
where refers to the membership degree of belonging to the stage of ; is the mean of all samples corresponding to for the -th indicator; is the proportion of samples in the stage of to the total sample number of the -th indicator. This study utilized only a single dataset to determine the mean and variance of the Gaussian membership functions. Should sufficient datasets be available, cross-validation is recommended to determine these parameters, thereby enhancing the model’s generalization capability.
3.3. Fuzzy Evaluation Probability Function
According to the dynamic weights of each indicator and the Gaussian membership degrees, a fuzzy evaluation probability function can be constructed:
where is the fuzzy probability that is in the stage of , and the result is determined based on the maximum probability.
3.4. Result Analysis
Figure 8b–d demonstrates that the WSR, CRF, and CRFA exhibit monotonically increasing trends throughout the degradation process. However, the OFT displays a non-monotonic trend characterized by an initial decrease followed by an increase (Figure 8a). To facilitate state identification, the OFT slope is adopted as a derived monitoring indicator, converting this parameter into a monotonically increasing trend.
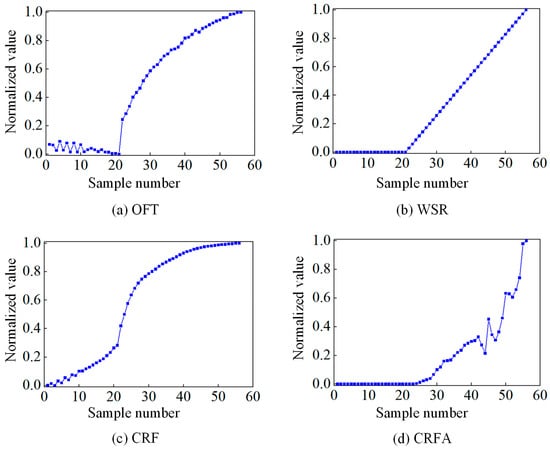
Figure 8.
The normalized results of the OFT, WSR, CRF, and CRFA.
Furthermore, since all monitoring samples were obtained under idealized conditions, the WSR remains constant in the initial phase followed by a perfectly linear progression, and the CRFA consistently registers zero values in the initial phase. To ensure numerical stability during normalization, random noise with an amplitude of 1 × 10⁻³ is introduced to each raw data point. The noise magnitude is negligible compared to the original data (order-of-magnitude difference), and it is empirically verified to alter the dataset’s mean and variance by less than 0.1%. Figure 8a presents the preprocessed data of all four indicators, including the OFT, WSR, CRF, and CRFA.
The dynamic weights of each indicator are shown in Figure 9. In the good lubrication stage (samples 1–21), the weight of the OFT gradually decreases while the weight of the CRF gradually increases (Figure 9a,c), and the weights of the WSR and CRFA are zero (Figure 9b,d). During the normal wear stage (samples 21–40), the weights of the OFT and CRF decrease (Figure 9a,c), while the weights of the WSR and CRFA gradually increase (Figure 9b,d). In the severe wear stage (samples 41–56), the CRFA accounts for the main weight (Figure 9d), the OFT and WSR account for smaller weights (Figure 9a,b), and the weight of CRF gradually approaches zero (Figure 9c).
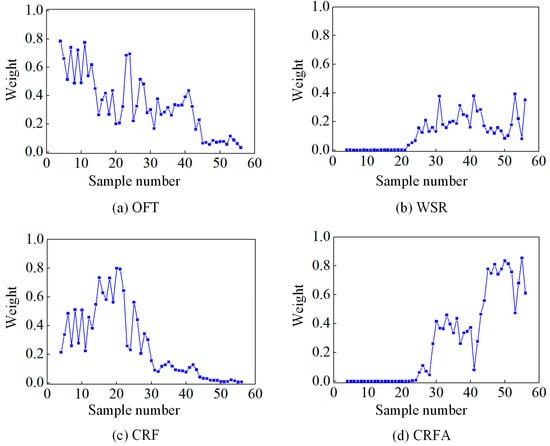
Figure 9.
The weights of OFT, WSR, CRF, and CRFA.
The membership degrees of the OFT, WSR, CRF, and CRFA, corresponding to three stages, were computed according to the method in Section 3.2, as shown in Figure 10. To avoid potential over-fitting in the fuzzy evaluation model, it is necessary to ensure that the sum of probabilities for each sample belonging to the three stages is 1. Hence, the proportional scaling method is applied to normalize the membership degree.
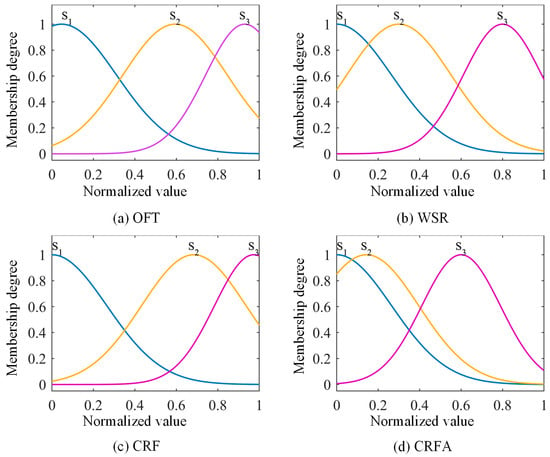
Figure 10.
The memberships of OFT, WSR, CRF, and CRFA.
Figure 11 presents the fuzzy identification results. The known lubrication degradation stages for 53 samples are shown in Figure 11a, while Figure 11b displays the fuzzy evaluation outcomes, achieving 96% accuracy (51/53 correct identifications). Then, another set of new data is used to test the model’s effectiveness. The test results yield 92% accuracy (49/53), as demonstrated in Figure 11c. The errors mainly occur at the junction of two stages (Figure 11d), which are caused by the extremely close probability of belonging to these two stages. For instance, at the first error point, the probability of being in the good lubrication stage is 0.6, while the probability of being in the normal wear stage is 0.4. At the subsequent error point, these probabilities shift to 0.55 and 0.45 for good lubrication and normal wear stages, respectively. For maintenance of personnel monitoring lubrication states, such close probabilities already indicate the transition to the next degradation phase, necessitating corresponding maintenance interventions. These marginal deviations are, therefore, both inherent to the monitoring process and operationally acceptable.
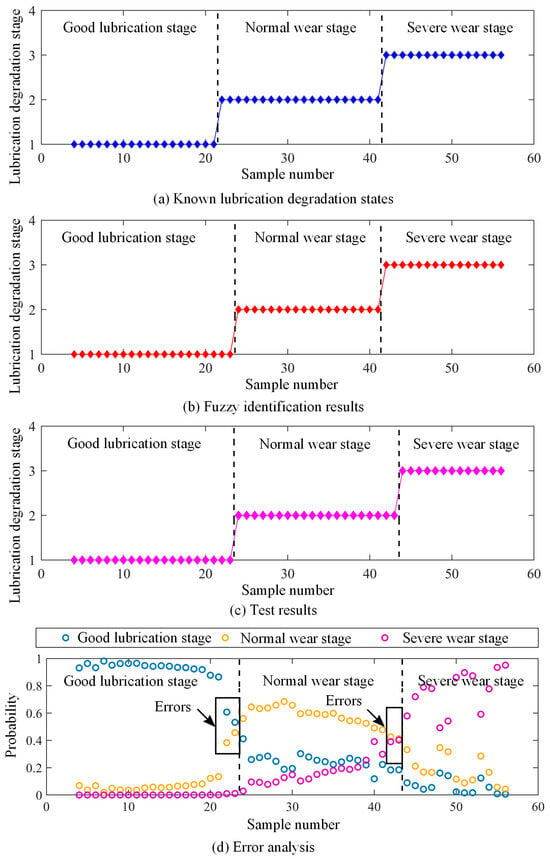
Figure 11.
The fuzzy identification results based on the simulation data.
4. Experimental Verification
A sliding–rolling test rig was employed for the lubrication degradation experiments. Four indicators, including the OFT, WSR, CRF, and CRFA, were collected to verify the effectiveness of the fuzzy identification method.
4.1. Experimental Method
The test rig comprises a line contact friction pair (a 12-mm-diameter roller and a 108-mm-diameter ring), as shown in Figure 12a. The roller is driven by a high-speed electric spindle, and the ring is fixed on a low-speed electric spindle. Rolling–sliding motions are obtained by setting different drive speeds. A vertical load can be applied to the roller via the loading system. Vibration signals are acquired through an accelerometer (with a measurement range of ±50 g, sensitivity of 100 mV/g, and frequency response range of 0.5 Hz to 10 kHz). The WSR of the ring is obtained via a three-dimensional surface reconstruction system [] (Figure 12b). The lubricating oil is driven by a peristaltic pump and injected into the contact region. The OFT is measured using an ultrasonic film thickness detection method [] (Figure 12c). A 6 × 0.6 mm2 piezoelectric element is bonded to the inner surface of the ring. The ultrasonic system transmits ultrasonic waves to the contact region of the ring and roller through the piezoelectric element and receives the reflected waves for OFT determination. More details of the test rig structure and monitoring methods can be found in [,,]. The experimental method is detailed in Table 3.
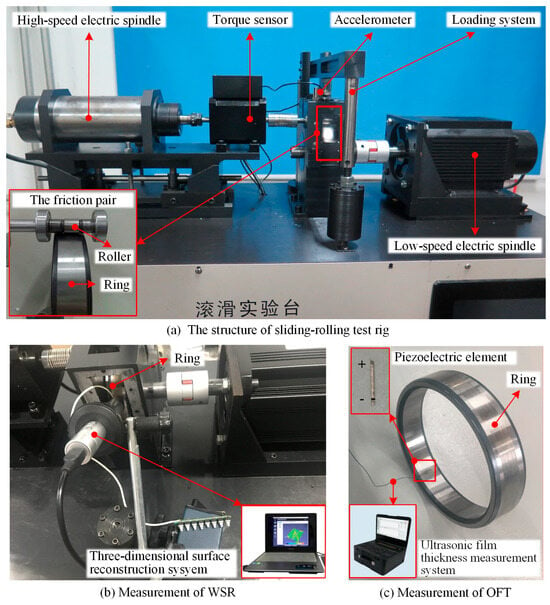
Figure 12.
The sliding–rolling test rig and the monitoring methods.

Table 3.
The lubrication degradation experimental method.
Firstly, a new friction pair sample was applied (with a surface roughness of 0.57 μm for the ring and 0.3 μm for the roller), and the load was increased from 50 N to 500 N at intervals of 50 N to simulate the oil film-dominated lubrication degradation stage. Then, under a constant load of 500 N, eleven ring samples with different surface roughness were sequentially replaced to simulate the surface wear-dominated lubrication degradation (according to [], the first five samples would lead to a normal wear state, and the last six would lead to a severe wear state). During the experiments, the slip rate remained at 0.2, and the rotational speed of the ring remained at 300 r/min. The feed of the lubricating oil volume remained constant at 20 mL/min. Each test lasted 300 s. To ensure the repeatability and reproducibility of the experimental results, each test was repeated five times. These data were divided into two parts. The average OFT, WSR, CRF, and CRFA of the first four sets of data are used to establish the fuzzy evaluation model, and another indicator is used for subsequent method validation.
4.2. Result Analysis
The ultrasonic measurement technique for determining the oil film thickness in roller–ring contacts has been comprehensively described in our prior work []; thus, is not reiterated herein. The acquired vibration signals require comprehensive time–domain and PSD analyses. To mitigate interference effects, all PSD signals were preprocessed using a quintic spline smoothing algorithm. The highest point was selected as the CRF. For the statistical analysis, the mean CRF and CRFA values were extracted from three groups of vibration signals.
Figure 13 presents all 21 experimental samples. The horizontal axis represents the sampling number of 21 sets of data. Due to the technical limitations of ultrasonic film thickness measurements, it is difficult to obtain OFT information during severe asperity contact and wear conditions. This study, therefore, adopted a constant-value assumption for monitoring the OFT after wear initiation, as depicted in Figure 13a. The premise of this assumption is that a severe asperity contact state between the friction pair can be determined based on the abnormal OFT values, and the OFT has lost its significance for lubrication degradation characterization. Therefore, alternative measurement or treatment methods should be explored in future research. The remaining three indicators exhibit evolutionary trends consistent with theoretical simulations, as seen in Figure 13b–d.
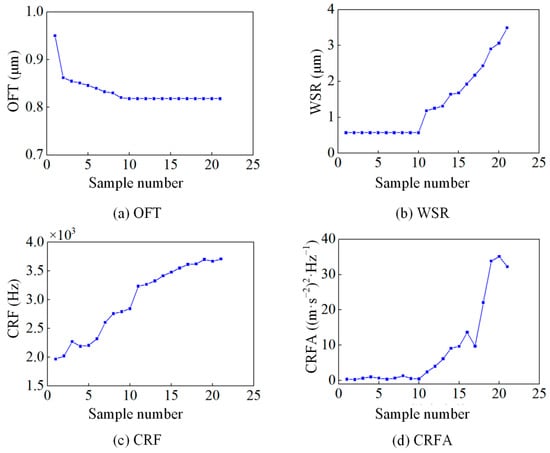
Figure 13.
Four monitoring indicators collected during lubrication degradation experiments.
The proposed multi-index fusion-based fuzzy identification method was validated using the aforementioned monitoring samples. The known lubrication degradation stages for 18 samples are shown in Figure 14a. Figure 14b,c indicate that the method achieved 100% identification accuracy (18/18) for training samples and 89% accuracy (16/18) for test samples. The observed misclassifications primarily occurred during stage transitions, where classification probabilities exhibited minimal separation (Figure 14d), thereby confirming the method’s effectiveness for lubrication degradation identification.
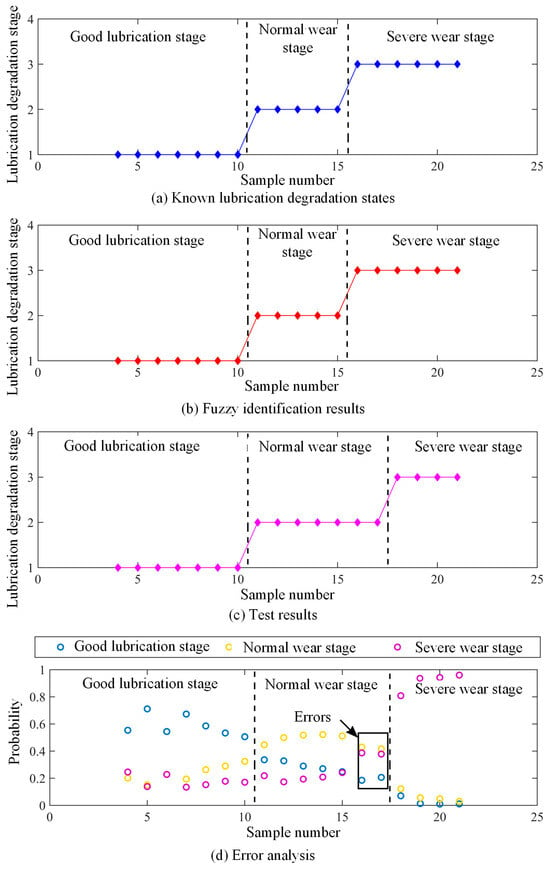
Figure 14.
The fuzzy identification results based on the experimental data.
This study presents a lubrication degradation identification method developed specifically for rolling–sliding line contacts, which may potentially be extended to the lubrication condition monitoring of critical components (e.g., gears and bearings) in large mechanical equipment. It should be noted that the multi-indicator fusion approach for lubrication degradation identification remains at an early exploratory stage, with current validation limited to fundamental laboratory experiments. The generalizability of this methodology to other tribological systems would require more extensive investigation in future studies.
5. Conclusions
This study develops a multi-index fusion-based fuzzy evaluation method for identifying the lubrication degradation. The methodology involves: (1) simulating degradation processes using coupled mixed-EHL and contact dynamic models to extract four key indicators (OFT, WSR, CRF, CRFA); (2) establishing a fuzzy evaluation framework for stage identification; (3) experimental validation.
The key findings include:
- (1)
- The integrated four-indicator system effectively discriminates three characteristic degradation stages (good lubrication, normal wear, severe wear), with each indicator providing unique and essential contributions.
- (2)
- The fuzzy evaluation method achieves 89% identification accuracy, with misclassifications primarily occurring at stage transitions due to overlapping probability distributions.
Author Contributions
Methodology, C.X.; software, C.X.; validation, C.X. and Y.T.; investigation, C.X.; writing—original draft preparation, C.X., Q.F. and Q.Z.; writing—review and editing, C.X. and Q.F.; visualization, C.X. and Y.T.; supervision, C.X. and Q.Z.; project administration, C.X.; funding acquisition, C.X., Q.F. and Y.T. All authors have read and agreed to the published version of the manuscript.
Funding
The authors appreciate the financial support from the Fundamental Research Program of Shanxi Province (Grant No. 202303021222036 and 202303021222165), the Shanxi Province Science and Technology Cooperation Exchange: Key National Science and Technology Cooperation Project (Grant No. 202304041101007), the National Key Research and Development Program of China—Sub-project on Integration Technology of Laser Interferometry System and Inertial Sensors (Grant No. 2024YFC2207100) and the Precision and Vibration Control Innovation Team of Shanxi University (Sanjin Talents Program Innovation Team in Natural Science and Engineering Technology).
Data Availability Statement
The original contributions presented in this study are included in the article; further inquiries can be directed to the corresponding authors.
Conflicts of Interest
The authors declare no conflicts of interest.
Abbreviations
The following abbreviations are used in this manuscript:
| OFT | Oil film thickness |
| WSR | Wear surface roughness |
| CRF | Contact resonance frequency |
| CRFA | Amplitude of contact resonance frequency |
| PSD | Power spectral density |
References
- Gao, S.; Chatterton, S.; Naldi, L.; Pennacchi, P. Ball bearing skidding and over-skidding in large-scale angular contact ball bearings: Nonlinear dynamic model with thermal effects and experimental results. Mech. Syst. Signal Process. 2021, 147, 107120. [Google Scholar] [CrossRef]
- Xu, C.; Li, B.; Wu, T. Wear characterization under sliding–rolling contact using friction-induced vibration features. Proc. Inst. Mech. Eng. Part J J. Eng. Tribol. 2022, 236, 634–647. [Google Scholar] [CrossRef]
- Shi, X.; He, S.; Xie, X.; Sun, Y. Review on Feature Extraction of Lubrication and Wear Fault Diagnosis in Tribology System. Mocaxue Xuebao/Tribol. 2023, 43, 241–255. [Google Scholar] [CrossRef]
- Xu, C.; Tong, Y.; Wu, T. Experimental study on characterization of lubrication deterioration under rolling-sliding contact. Ind. Lubr. Tribol. 2025, 77, 497–506. [Google Scholar] [CrossRef]
- Shi, X.; Wu, J.; Zhao, B.; Ma, X.; Lu, X. Mixed thermal elastohydrodynamic lubrication analysis with dynamic performance of aero ball bearing during start-up and shut-down. Proc. Inst. Mech. Eng. Part J J. Eng. Tribol. 2020, 234, 873–886. [Google Scholar] [CrossRef]
- Gelinck, E.R.M.; Schipper, D.J. Calculation of Stribeck curves for line contacts. Tribol. Int. 2000, 33, 175–181. [Google Scholar] [CrossRef]
- He, T.; Zhu, D.; Wang, J.; Jane Wang, Q. Experimental and Numerical Investigations of the Stribeck Curves for Lubricated Counterformal Contacts. J. Tribol. 2017, 139, 021505. [Google Scholar] [CrossRef]
- Nutakor, C.; Talbot, D.; Kahraman, A. An experimental characterization of the friction coefficient of a wind turbine gearbox lubricant. Wind Energy 2019, 22, 509–522. [Google Scholar] [CrossRef]
- Hansen, J.; Björling, M.; Larsson, R. A New Film Parameter for Rough Surface EHL Contacts with Anisotropic and Isotropic Structures. Tribol. Lett. 2021, 69, 37. [Google Scholar] [CrossRef]
- Hou, G.; Zhang, L. In-situ detection of lubrication status of bearings with acoustic emission monitoring. Wear 2025, 571, 205839. [Google Scholar] [CrossRef]
- Xing, P.; Li, G.; Gao, H.; Wang, G. Experimental investigation on identifying friction state in lubricated tribosystem based on friction-induced vibration signals. Mech. Syst. Signal Process. 2020, 138, 106590. [Google Scholar] [CrossRef]
- Duan, Z.; Wu, T. Lubrication state identification of the line contact tribo-pair under a pure rolling condition with ultrasonic method. Proc. Inst. Mech. Eng. Part J J. Eng. Tribol. 2022, 236, 982–994. [Google Scholar] [CrossRef]
- Tervo, J.; Junttila, J.; Lämsä, V.; Savolainen, M.; Ronkainen, H. Hybrid methodology development for lubrication regimes identification based on measurements, simulation, and data clustering. Tribol. Int. 2024, 195, 109631. [Google Scholar] [CrossRef]
- Wang, Q.; Liu, J.; Wei, B.; Zhang, C. Research on Data-driven Clustering Analysis Fault Identification Method. Jixie Gongcheng Xuebao/J. Mech. Eng. 2020, 56, 7–14. [Google Scholar] [CrossRef]
- Marian, M.; Mursak, J.; Bartz, M.; Profito, F.J.; Rosenkranz, A.; Wartzack, S. Predicting EHL film thickness parameters by machine learning approaches. Friction 2023, 11, 992–1013. [Google Scholar] [CrossRef]
- Marian, M.; Tremmel, S. Physics-Informed Machine Learning—An Emerging Trend in Tribology. Lubricants 2023, 11, 463. [Google Scholar] [CrossRef]
- Zhao, Y.; Wong, P.P.L. A hybrid data-driven approach for the analysis of hydrodynamic lubrication. Proc. Inst. Mech. Eng. Part J J. Eng. Tribol. 2024, 238, 320–331. [Google Scholar] [CrossRef]
- Zhao, Y.; Fu, Z.; Zhao, J. Weighted physics-informed neural network (Weighted PINN) for obtaining elastic responses under Hertzian-like contact. Friction 2025. [CrossRef]
- Zhao, Y.; Guo, L.; Wong, P.P.L. Application of physics-informed neural network in the analysis of hydrodynamic lubrication. Friction 2023, 11, 1253–1264. [Google Scholar] [CrossRef]
- Xia, Y.; Meng, Y. Physics-Informed Neural Network (PINN) for Solving Frictional Contact Temperature and Inversely Evaluating Relevant Input Parameters. Lubricants 2024, 12, 62. [Google Scholar] [CrossRef]
- Tang, Y.; Huang, L.; Wu, L.; Meng, X. Simulation of lubrication on rough surfaces with multiscale lubrication neural networks. Sci. China Technol. Sci. 2025, 68, 1320303. [Google Scholar] [CrossRef]
- Zhu, D.; Hu, Y.Z. A computer program package for the prediction of ehl and mixed lubrication characteristics, friction, subsurface stresses and flash temperatures based on measured 3-d surface roughness. Tribol. Trans. 2001, 44, 383–390. [Google Scholar] [CrossRef]
- Ren, N.; Zhu, D.; Chen, W.W.; Liu, Y.; Wang, Q.J. A three-dimensional deterministic model for rough surface line-contact EHL problems. J. Tribol. 2009, 131, 011501. [Google Scholar] [CrossRef]
- Zhu, D.; Wang, J.; Wang, Q.J. On the Stribeck Curves for Lubricated Counterformal Contacts of Rough Surfaces. J. Tribol. 2015, 137, 021501. [Google Scholar] [CrossRef]
- Zhu, D.; Wang, Q.J. On the λ ratio range of mixed lubrication. Proc. Inst. Mech. Eng. Part J J. Eng. Tribol. 2012, 226, 1010–1022. [Google Scholar] [CrossRef]
- Zhu, D.; Wang, Q.J. Effect of roughness orientation on the elastohydrodynamic lubrication film thickness. J. Tribol. 2013, 135, 031501. [Google Scholar] [CrossRef]
- Dowson, D.; Higginson, G.R.; Whitaker, A.V. Elasto-hydrodynamic lubrication: A survey of isothermal solutions. Arch. J. Mech. Eng. Sci. 1962, 4, 121–126. [Google Scholar] [CrossRef]
- Peiran, Y.; Shizhu, W. A Generalized Reynolds Equation for Non-Newtonian Thermal Elastohydrodynamic Lubrication. J. Tribol. 1990, 112, 631–636. [Google Scholar] [CrossRef]
- Barus, C. Isothermals, isopiestics and isometrics relative to viscosity. Am. J. Sci. 1893, 3, 87–96. [Google Scholar] [CrossRef]
- Principles of Tribology. Mechanical Engineering-CIME VO—134. 2012, 12, 56. Available online: http://stat.lib.xjtu.edu.cn/go?url=http://search.ebscohost.com/login.aspx?direct=true&db=edsgbe&AN=edsgcl.310867796&lang=zh-cn&site=eds-live (accessed on 1 January 2020).
- Bair, S.; Winer, W.O. A rheological model for elastohydrodynamic contacts based on primary laboratory data. J. Tribol. 1979, 101, 258–264. [Google Scholar] [CrossRef]
- Xu, C.; Fan, Q.; Zhang, Q.; Tong, Y.; Wang, S.; Wu, T. Vibration-Based Wear Evolution Characterisation of Lubricated Rolling-Sliding Contact. Lubricants 2025, 13, 78. [Google Scholar] [CrossRef]
- Soom, A.; Chen, J.W. Simulation of random surface roughness-induced contact vibrations at hertzian contacts during steady sliding. J. Tribol. 1986, 108, 123–127. [Google Scholar] [CrossRef]
- Fan, W.; Xu, Z.; Wu, B.; He, Y.; Zhang, Z. Structural multi-objective topology optimization and application based on the criteria importance through intercriteria correlation method. Eng. Optim. 2022, 54, 830–846. [Google Scholar] [CrossRef]
- Guillaume, S. Designing Fuzzy Inference Systems from Data: An Interpretability-Oriented Review. IEEE Trans. Fuzzy Syst. 2001, 9, 426–443. [Google Scholar] [CrossRef]
- Xu, C.; Wu, T.; Huo, Y.; Yang, H. In-situ characterization of three dimensional worn surface under sliding-rolling contact. Wear 2019, 426–427, 1781–1787. [Google Scholar] [CrossRef]
Disclaimer/Publisher’s Note: The statements, opinions and data contained in all publications are solely those of the individual author(s) and contributor(s) and not of MDPI and/or the editor(s). MDPI and/or the editor(s) disclaim responsibility for any injury to people or property resulting from any ideas, methods, instructions or products referred to in the content. |
© 2025 by the authors. Licensee MDPI, Basel, Switzerland. This article is an open access article distributed under the terms and conditions of the Creative Commons Attribution (CC BY) license (https://creativecommons.org/licenses/by/4.0/).