Article

An Optimal Preprocessing Method for Predicting the Acid Number of Lubricating Oil Based on PLSR and Infrared Spectroscopy

1
Marine Design and Research Institute of China, Shanghai 200011, China
2
School of Transportation and Logistics Engineering, Wuhan University of Technology, Wuhan 430063, China
3
School of Engineering, nCATS, University of Southampton, Southampton SO17 1BJ, UK
*
Author to whom correspondence should be addressed.
Lubricants 2025, 13(8), 355; https://doi.org/10.3390/lubricants13080355
Submission received: 30 June 2025 / Revised: 5 August 2025 / Accepted: 5 August 2025 / Published: 10 August 2025

Abstract

The acid number evaluates the degree of deterioration of lubricating oil. Existing methods for evaluating the performance degradation of lubricating oils are mostly based on the detection of traditional physical and chemical indicators, which often only reflect a single dimension of the degradation process, thus affecting the accuracy and repeatability of the results. Integrating multi-dimensional information can more comprehensively reflect the essence of degradation, which can improve the accuracy and reliability of the evaluation results. Mid-infrared spectroscopy is an effective means of monitoring the acid number. In this study, a combination of infrared spectroscopy quantitative analysis and chemometrics was used. The oil sample data was divided into training set and validation set by the Kennard–Stone method. In the experiment, a Fourier transform infrared spectrometer equipped with an attenuated total reflection accessory (ATR-FTIR) was used to collect spectral data of the samples in the wavenumber range of 1750–1700 cm−1 (this range corresponds to the characteristic absorption of carboxyl groups and is directly related to the acid number). Meanwhile, a G20S automatic potentiometric titrator was used to determine the acid number as a reference value in accordance with GB/T 7304. The study compared various preprocessing methods. A regression prediction model between the spectra and acid number was established using partial least squares regression (PLSR) within the selected wavenumber range, with the root mean square error of cross-validation (RMSECV), root mean square error of prediction (RMSEP), and coefficient of determination (R) as evaluation indicators. The experimental results showed that the PLSR model established after preprocessing with second derivative combined with seven-point smoothing exhibited the optimal performance, with an RMSECV of 0.00505, an RMSEP of 0.14%, and an R of 0.9820. Compared with the traditional titration method, this prediction method is more suitable for real-time monitoring of production lines or rapid on-site screening of equipment. It can in a timely manner warn of the deterioration trend of lubricating oil, reduce the risk of equipment wear caused by oil failure, and provide efficient technical support for lubricating oil life management.

1. Introduction

For mechanical equipment, lubricating oil plays the role of lubrication, heat dissipation, sealing, vibration reduction, anti-wear, etc. [1,2,3]. The service life of lubricating oil indirectly affects the service life of mechanical equipment [4,5]. The information contained in the lubricating oil can not only provide a theoretical basis for the staff to determine the oil change interval, but also provide data support for the online monitoring and fault diagnosis of mechanical equipment. The quality of lubricating oil determines the service life and reliability of mechanical equipment, and ensures the stability and economy of the industrial production process.
Acid number is one of the important physical and chemical indicators of lubricating oil, and infrared spectroscopy is an important method of monitoring the acid number of lubricating oil. This method is easy to operate, the detection speed is faster than other methods, and there is no direct contact with the oil. R. Chakravarthy et al. utilized mid-infrared spectroscopy to determine the naphthenic acid number in petroleum crude oil and its fractions [6]. Guan Li performed qualitative and quantitative analysis on the oxidative degradation process of engine lubricating oil using dielectric spectroscopy (DS) and Fourier transform infrared spectroscopy (FTIR) [7]. However, due to issues with sample status or instrument stability, the spectral baseline may tilt or shift, making it difficult to accurately identify the position and intensity of characteristic peaks and interfering with the quantitative calculation of target functional groups. Yanjun Zhang et al. established a rapid quantitative detection model for acid content based on artificial bee colony-support vector regression and Raman spectroscopy, which showed higher prediction accuracy [8]. In addition to the target analytes, lubricating oil contains various matrix components. The spectral signals of these components may overlap with the target peaks, leading to deviations in the analysis results. Van de Voort et al. used infrared spectroscopy to determine the acid number and base number in lubricating oil, eliminating the matrix effect through a signal transduction method combining chemometrics and differential spectroscopy [9]. Yongliang Jin investigated the on-line infrared spectroscopy detection of lubricating oil during the high-temperature friction process [10]. Adams proposed an FTIR analysis and monitoring method for synthetic aviation engine oil [11]. Juxiang Wang et al. established an acid number analysis model based on the correlation vector machine algorithm using feature-selected spectral variables and verified its accuracy [12]. Lingfei Shi constructed a lubricating oil acid number model by combining least squares and a support vector machine, and compared its prediction accuracy with that based on the radial basis function model [13]. Caneca developed an evaluation method for monitoring the service condition of diesel engine lubricating oil based on infrared spectroscopy and multivariate technology [14]. Jun Dong applied Fourier transform infrared spectroscopy to quantitatively monitor lubricating oil [15]. MH Rahman et al. conducted a study on machine learning algorithms in the engine oil and lubricant industry. Their research findings indicate that machine learning can predict faults and enable data-driven decisions to enhance profitability [16]. Qifan Zhou et al. studied the combination of temporal and non-temporal data of characteristic parameters affecting the lubricating oil consumption rate of aero-engines through the fusion of multi-feature regression prediction algorithms [17]. Jianfang Liu et al. employed the genetic function approximation algorithm to predict changes in the lubricating performance of oil [18].
Among them, the analysis and prediction of infrared spectrum based on an algorithm is a new method for monitoring lubricating oil. Prediction of lubricant deterioration is also an important way of guiding oil changes. Infrared spectroscopy can quickly obtain the molecular structure information of samples (such as the characteristic absorption of carboxyl groups in lubricating oil). However, raw spectra are often affected by noise, baseline drift, matrix interference, and other factors, which makes direct analysis difficult. Through algorithms (such as preprocessing algorithms and chemometric models), spectral data can be denoised, features can be extracted, and quantitative models can be established, thereby eliminating interference and improving analysis accuracy. At present, the research focus of most forecasting methods lies in the realization of the algorithm. This study focuses on the combination of spectral preprocessing and the PLSR model to make the prediction results more accurate.

2. Methods

2.1. Acid Number

Acid Number is defined as the milligrams of potassium hydroxide (KOH) required to neutralize the acidic constituents in one gram of oil [19]. During the aging process of lubricating oil, acidic substances are generated and the acid number increases. Therefore, the acid number is used to evaluate the quality and stability of oil products. The formula for measurement by neutralization with KOH solution is
R C O O H + K O H R C O O K + H 2 O

2.2. Mid-Infrared Spectroscopy

When infrared light irradiates a sample, molecules selectively absorb light at specific frequencies, corresponding to the vibrational and rotational energy level transitions of chemical bonds in the molecule [20]. In Mid-Infrared Spectroscopy, the intensity of peaks is related to the intensity of absorbed light, providing information about the concentration of compounds and optical density.

2.3. PLSR

PLSR is a multivariate calibration technique that builds a predictive model by extracting latent variables that maximize the covariance between X (spectral measurements) and Y (reference concentrations) [21]. In contrast to ordinary multiple linear regression, PLSR elegantly handles high-dimensional, highly collinear spectral data through the projection of original variables onto T and P. The model equations are
X = T P T + E
Y = T Q T + F
where T contains the latent scores, P and Q are the loading matrices for X and Y, respectively, and E and F are the residual matrices.
The regression coefficients B are determined by optimizing the relationship Y ^ = X B enabling quantitative prediction (e.g., of acid values) directly from spectral data. Model performance is assessed via cross-validated root-mean-square error (RMSECV) and prediction root-mean-square error (RMSEP). These performance metrics are defined as follows:
Root Mean Square Error of Cross-Validation (RMSECV):
R M S E C V = 1 n i = 1 n ( y i y i ^ ) 2
Root Mean Square Error of Prediction (RMSEP):
R M S E P = 1 m j = 1 m ( y j y j ^ ) 2
y i and y i ^ are the reference and predicted values, respectively, n is the number of calibration samples, and m is the number of prediction samples.

2.4. Kennard–Stone Algorithm

Robust model validation requires representative training and test sets that span the multivariate spectral space. The Kennard–Stone algorithm systematically selects samples by maximizing Euclidean distances in the spectral domain [22]. The procedure begins by choosing the two most distant spectra as initial seeds, then iteratively adds the sample farthest from the existing set until the desired training set size is reached. The remaining samples constitute the validation set. This approach ensures uniform coverage of spectral variability and mitigates biased estimates of model performance that may arise from the clustering of similar samples.
Mathematically, the Euclidean distance between two spectra xi and xj is given by
D ( x i , x j ) = k = 1 p ( x i k x j k ) 2
where p is the number of spectral variables, and xik and xjk are the values of the k-th variable for the i-th and j-th samples, respectively. This algorithm maximizes these distances during sample selection to ensure diversity. The pseudocode for the Kennard–Stone Algorithm is as follows (Algorithm 1):
Algorithm 1 Knenard-Stone Sample Selection Algorithm
Input :   X R n × m : Data matrix with n samples and m features
K :   Number   of   samples   to   select   ( 2 k n )
Output :   J train : Indices of selected training samples
1 :   Compute   distance   matrix   D R n × n where:
D i j = t = 1 m ( X i t X j t ) 2 , i , j { 1 , 2 , , n }
2: Initialize:
3: Find pair ( i , j ) = a r g m a x i , j D i j
4: J train { i , j }
5: { 1 , 2 , , n } J train
6: while | J train | < k do
7 : Initialize   distance   vector   d min R | R |
8 : for   each   sample   i R do
9 : d min [ i ] min j T train D i j
10: end for
11: Select
12: Update sets:
13 : J train J train { i }
14 : { i }
15: end while
16: return J train

2.5. Principle of Oil Aging Monitoring

The aging process of lubricating oil can be described by a chemical kinetics model. It is assumed that the main aging reaction is a first-order reaction, meaning that the formation rate of acidic substances is proportional to the concentration of reactants (such as grease, antioxidants, etc.) in the lubricating oil. The rate equation of this reaction is given by Formula (7).
d [ HA ] d t = k [ H A ]
Among them, k is the reaction rate constant, and [HA] is the concentration of acidic substances.
By combining the relationship between H+ concentration and acid number, a mathematical relationship between the aging state of lubricating oil and acid number can be established. If the acid number has a linear relationship with H+ concentration, the change of acid number over time during the aging process of lubricating oil can be expressed as Formula (8).
A N ( t ) = A N 0 e k t
By monitoring the acid number of lubricating oil, the aging rate k of the lubricating oil and its remaining service life can be inferred based on the changing trend of the acid number.

3. Experiment Techniques

In this study, infrared spectroscopy combined with chemometrics was used to determine the optimal spectral preprocessing method by analyzing the influence of various spectral preprocessing methods on the establishment of spectral models. A PLSR model was established in the band range to predict the acid number of turbine oil.

3.1. Infrared Spectrum Collection

In the experiment, the oil samples were prepared by artificial oxidation of base oils, and thus contained no additives. The physicochemical properties of the base lubricating oil are presented in Table 1 to ensure the reproducibility of the study. The temperature was strictly controlled at 140 °C using heating equipment, and air was continuously introduced into the oil samples at a rate of 330 mL/min. These oxidation conditions were set with reference to the actual operating environments of mechanical equipment such as turbines, which can effectively simulate the oxidative degradation scenarios of lubricating oils during service. All 37 groups of oil samples were derived from the same batch of base oil and prepared through a single continuous oxidation experiment: during the oxidation process, samples were collected every two hours without replacing the base oil or interrupting the reaction throughout the process. No repeated experiments were performed, and the temporal continuity of the samples can reflect the dynamic changes in the oxidation process. Although the 37 samples in this study were limited in quantity, they cover the complete process of artificial oxidation from 0 to 120 h. Moreover, there were evenly distributed sample points in the three key stages of the oxidation process: the initial stage, the middle stage, and the late stage, with each stage containing at least 10 samples. These samples could reflect the gradient change characteristics of acid number with oxidation degree. The five samples in the validation set were selected from the typical time points of the three stages, aiming to test the prediction stability of the model for samples in different oxidation stages.
The spectra of oil samples were collected by a Fourier transform infrared spectrometer as Figure 1 and analyzed by OMNIC infrared spectroscopy software (OMNIC 8.2) developed by Nicolet. The detector adopts a high-performance DTGS detector. The linear accuracy is better than 0.1% T. The resolution is better than 0.25 cm−1. It is equipped with Thermo Scientific OMNIC Paradigm software (Thermo Scientific™ OMNIC™ Paradigm, Waltham, MA, USA), which features functions such as automatic spectral quality inspection, automatic peak searching and quantitative analysis, intelligent model editing, ATR multi-mode calibration, and automatic search, separation, and identification.
Background spectra were collected prior to acquisition in order to exclude the effects of atmospheric moisture and carbon dioxide. Then, the acquisition resolution was set to 4 cm−1, scan times were set to 32 times, and the spectrum of each oil sample was averaged three times. When changing the oil sample each time, it was necessary to wipe the oil sample on the crystal with 95% petroleum ether analytical grade and then drop it into a new sample, and use the OMNIC software to display each spectrum on the same scale in the range of 4000–400 cm−1. The obtained original infrared spectrum of the sample to be tested is shown in Figure 2.

3.2. Acid Number Data Determination

The method of measuring the acid number of the sample used was potentiometric titration in accordance with GB/T 7304 [23]. After preparing the boiling potassium hydroxide solution, titrate the oil sample to be tested through the instrument. In the titration process, the titration end point was determined by measuring the potential change, and the consumption of the consumed potassium hydroxide ethanol titrant was calculated, thereby indirectly calculating the acid number in the oil sample. The acid number of the tested oil samples is shown in Table 2. The overall variation trend of AN is consistent with the trend of oil oxidative degradation. Individual data points fluctuate within a reasonable range, which may be attributed to the response lag of the indicator electrode, resulting in slight deviations in the results. Potentiometric titration could monitor unemulsified oil samples.

3.3. Data Processing

In this study, the Savitzky–Golay convolution smoothing method, the derivative, the smoothing method, and the combination of derivatives were used to preprocess the spectral data, and the software used was OMNIC8.2. Among them, 5-point smoothing (Five Point Smooth), 7-point smoothing (Seven Point Smooth), and 9-point smoothing (Nine Point Smooth) methods were selected in the Savitzky–Golay convolution smoothing method (referred to as “smoothing method”). The first derivative (First Derivative) and the second derivative (Second Derivative) were selected in the derivative method. Table 3 shows the abbreviated form of each spectral preprocessing method.
The S-G convolution smoothing method performs a weighted average of the data in the window, which reduces the influence of the moving window parameters on the spectral data. The spectral preprocessing method of the first derivative and the second derivative can eliminate the problem of spectral line overlap and baseline drift in the original spectrum, and improve the spectral line resolution and sensitivity.

4. Results and Discussion

In this study, the collected acid number data and the corresponding spectral data processed by the preprocessing method were used as the objects, and a quantitative regression model was established by using the partial least squares method.

4.1. Data Division

In this study, the Kennard–Stone algorithm was used to divide the training set and the validation set. Typically, the ratios of the training set to the validation set are 9:1 and 8:2. Therefore, among the 37 samples, 5 samples were selected as the validation set, and the rest were used as the training set. According to the Kennard–Stone method, the 7th, 11th, 15th, 16th, and 35th oil samples were determined as the validation set, and the corresponding acid number data were 0.033 mgKOH/g, 0.035 mgKOH/g, 0.048 mgKOH/g, 0.034 mgKOH/g, and 0.049 mgKOH/g, and the remaining 32 oil samples were used as the training set.

4.2. Data Processing

In this study, the 1750–1700 cm−1 band was selected to preprocess the spectrum. Carbonyl (C=O)-containing acids typically exhibit absorption around 1710 cm−1, while this waveband also encompasses the absorption peaks (1700–1750 cm−1) of other carbonyl-bearing substances (e.g., esters, aldehydes, ketones, etc.) generated during the oxidation process. A slightly broader range enables more comprehensive capture of oxidation-related spectral information.
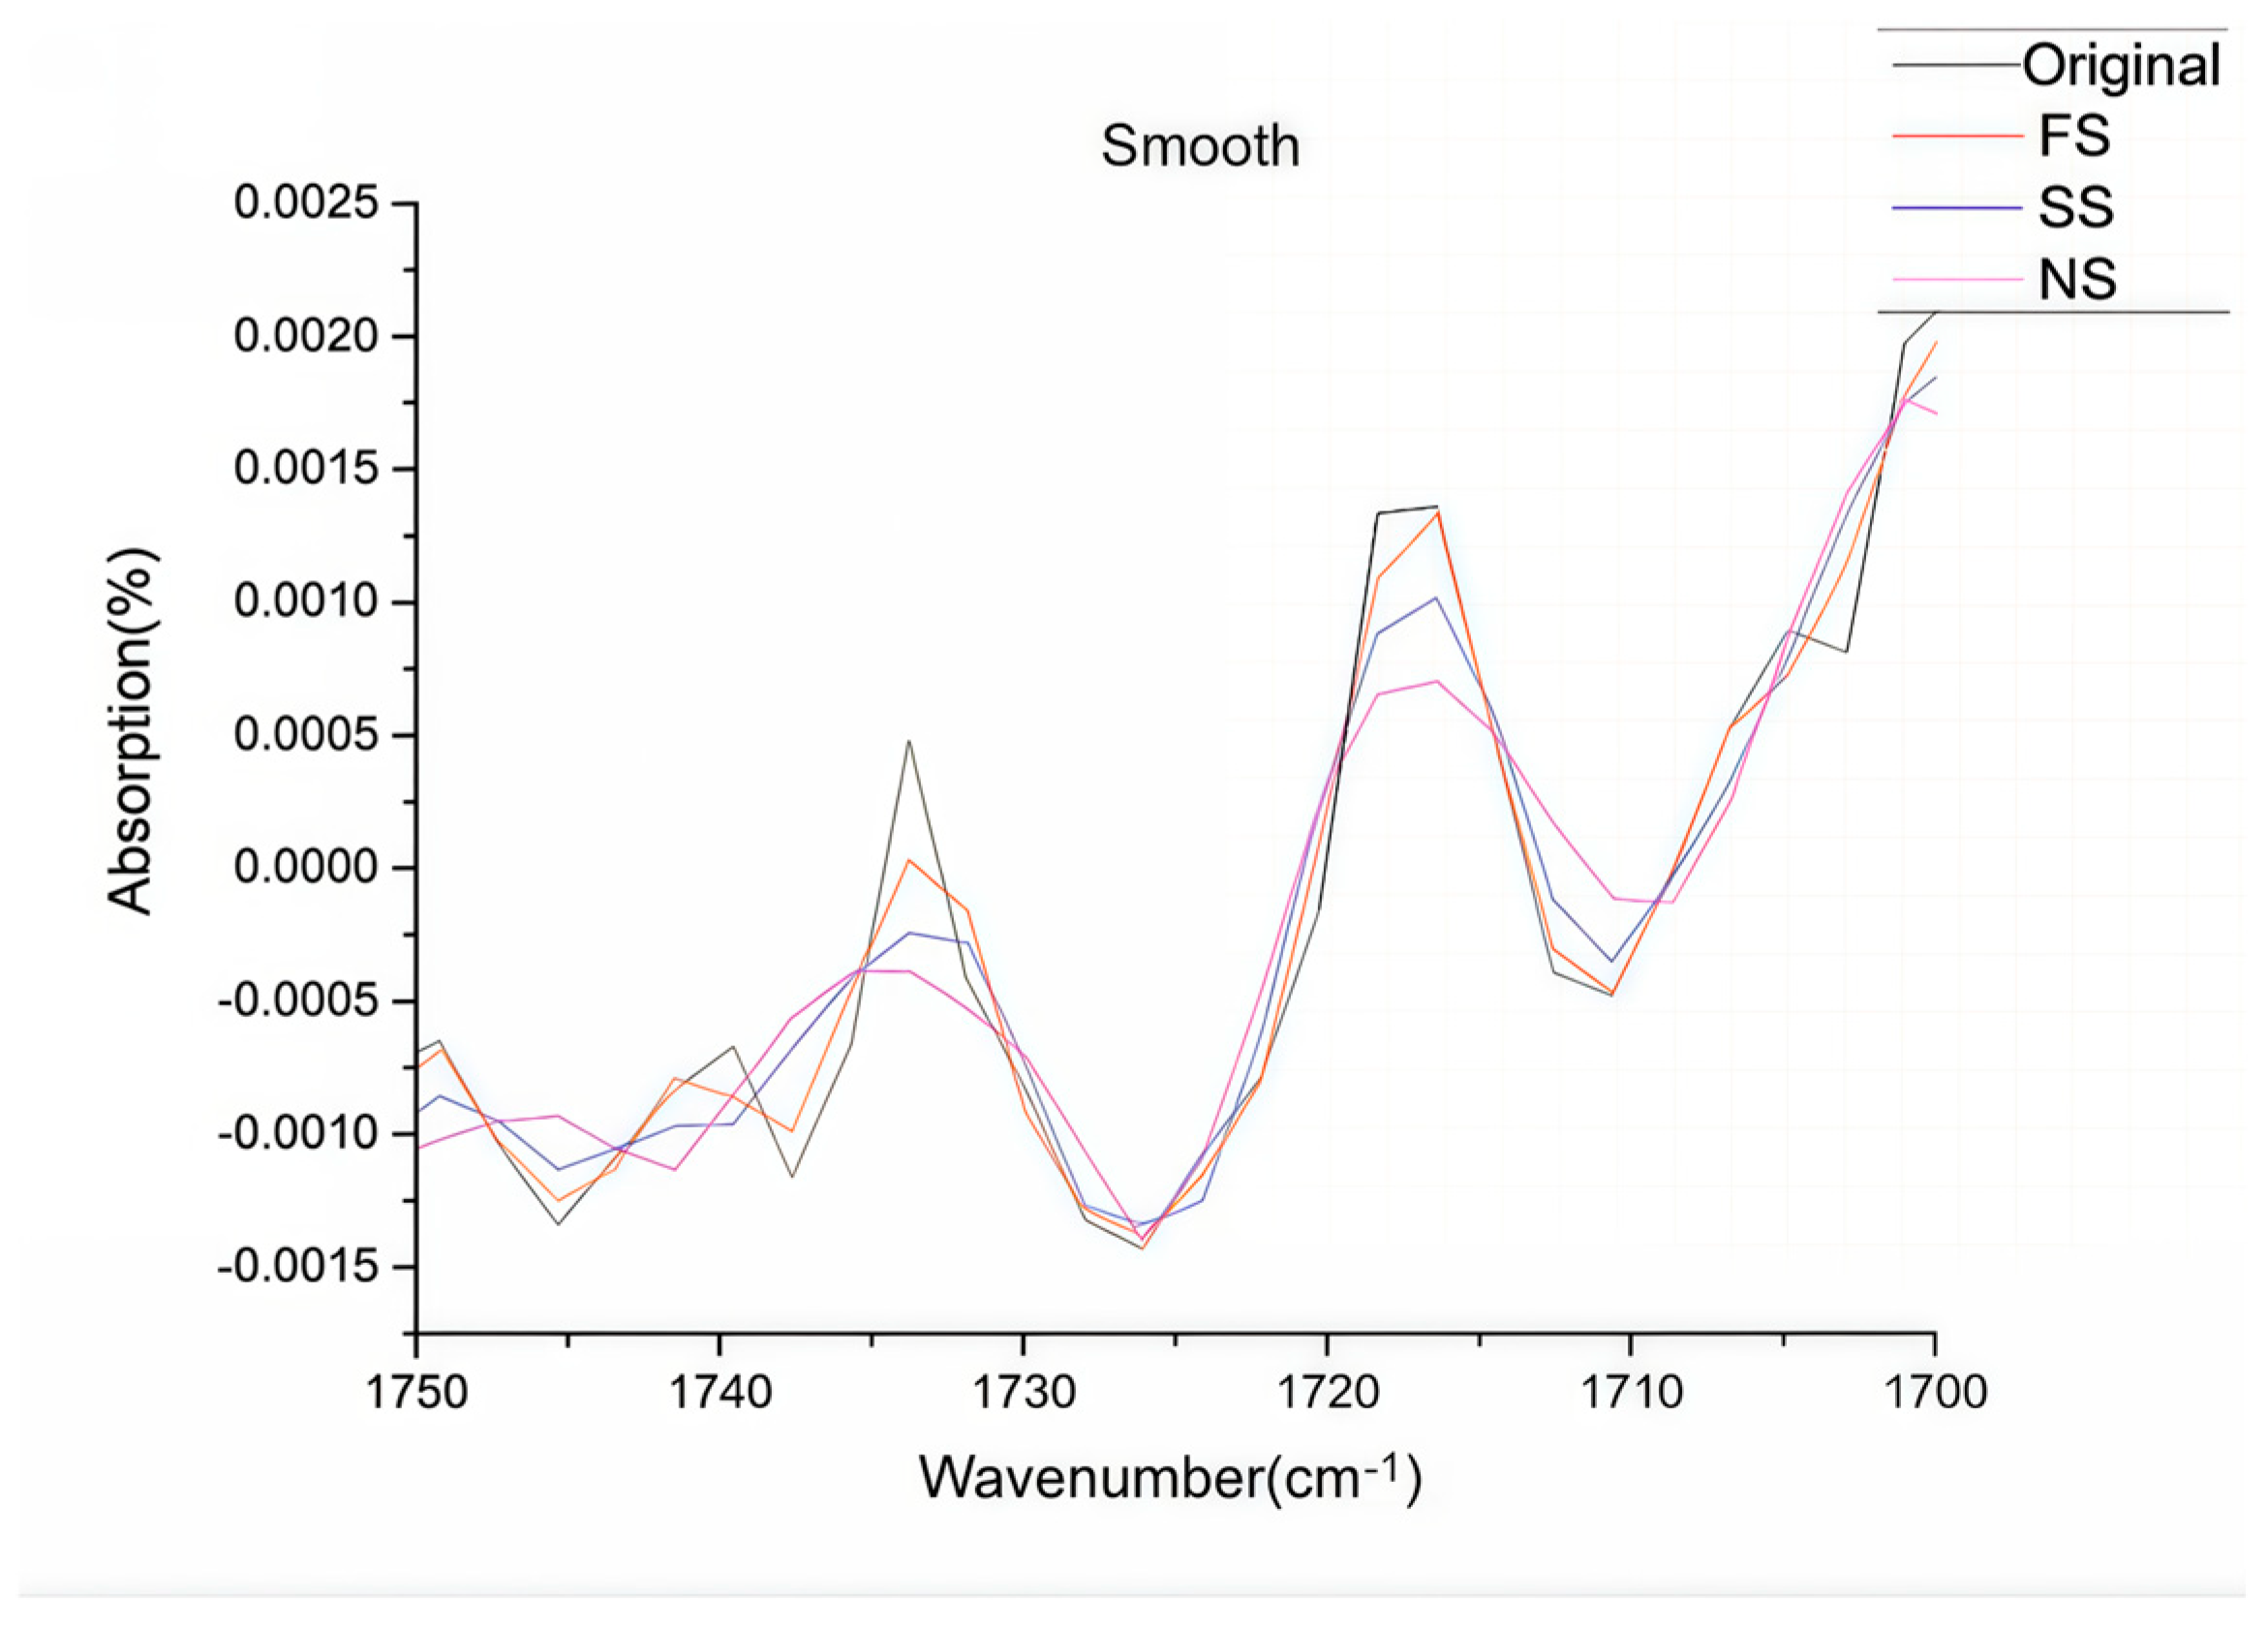
As can be seen from Figure 3, the effect of five-point smoothing is obviously better than that of seven-point smoothing and nine-point smoothing. Compared with the original spectrum, the smoothed spectrum is visually distinct, specifically at the absorption peaks at 1740 cm−1–1730 cm−1 and 1720 cm−1–1710 cm−1. Over-smoothing may lead to loss of useful information on useful spectral data.
Figure 4 takes the derivative of the original spectrum. It can be seen that the derivative processing can complete the baseline calibration of the spectrum compared to the original spectrum, even if the baseline of the absorbance spectrum is pulled back to the 0 baseline. This facilitates quantitative analysis of infrared spectra.
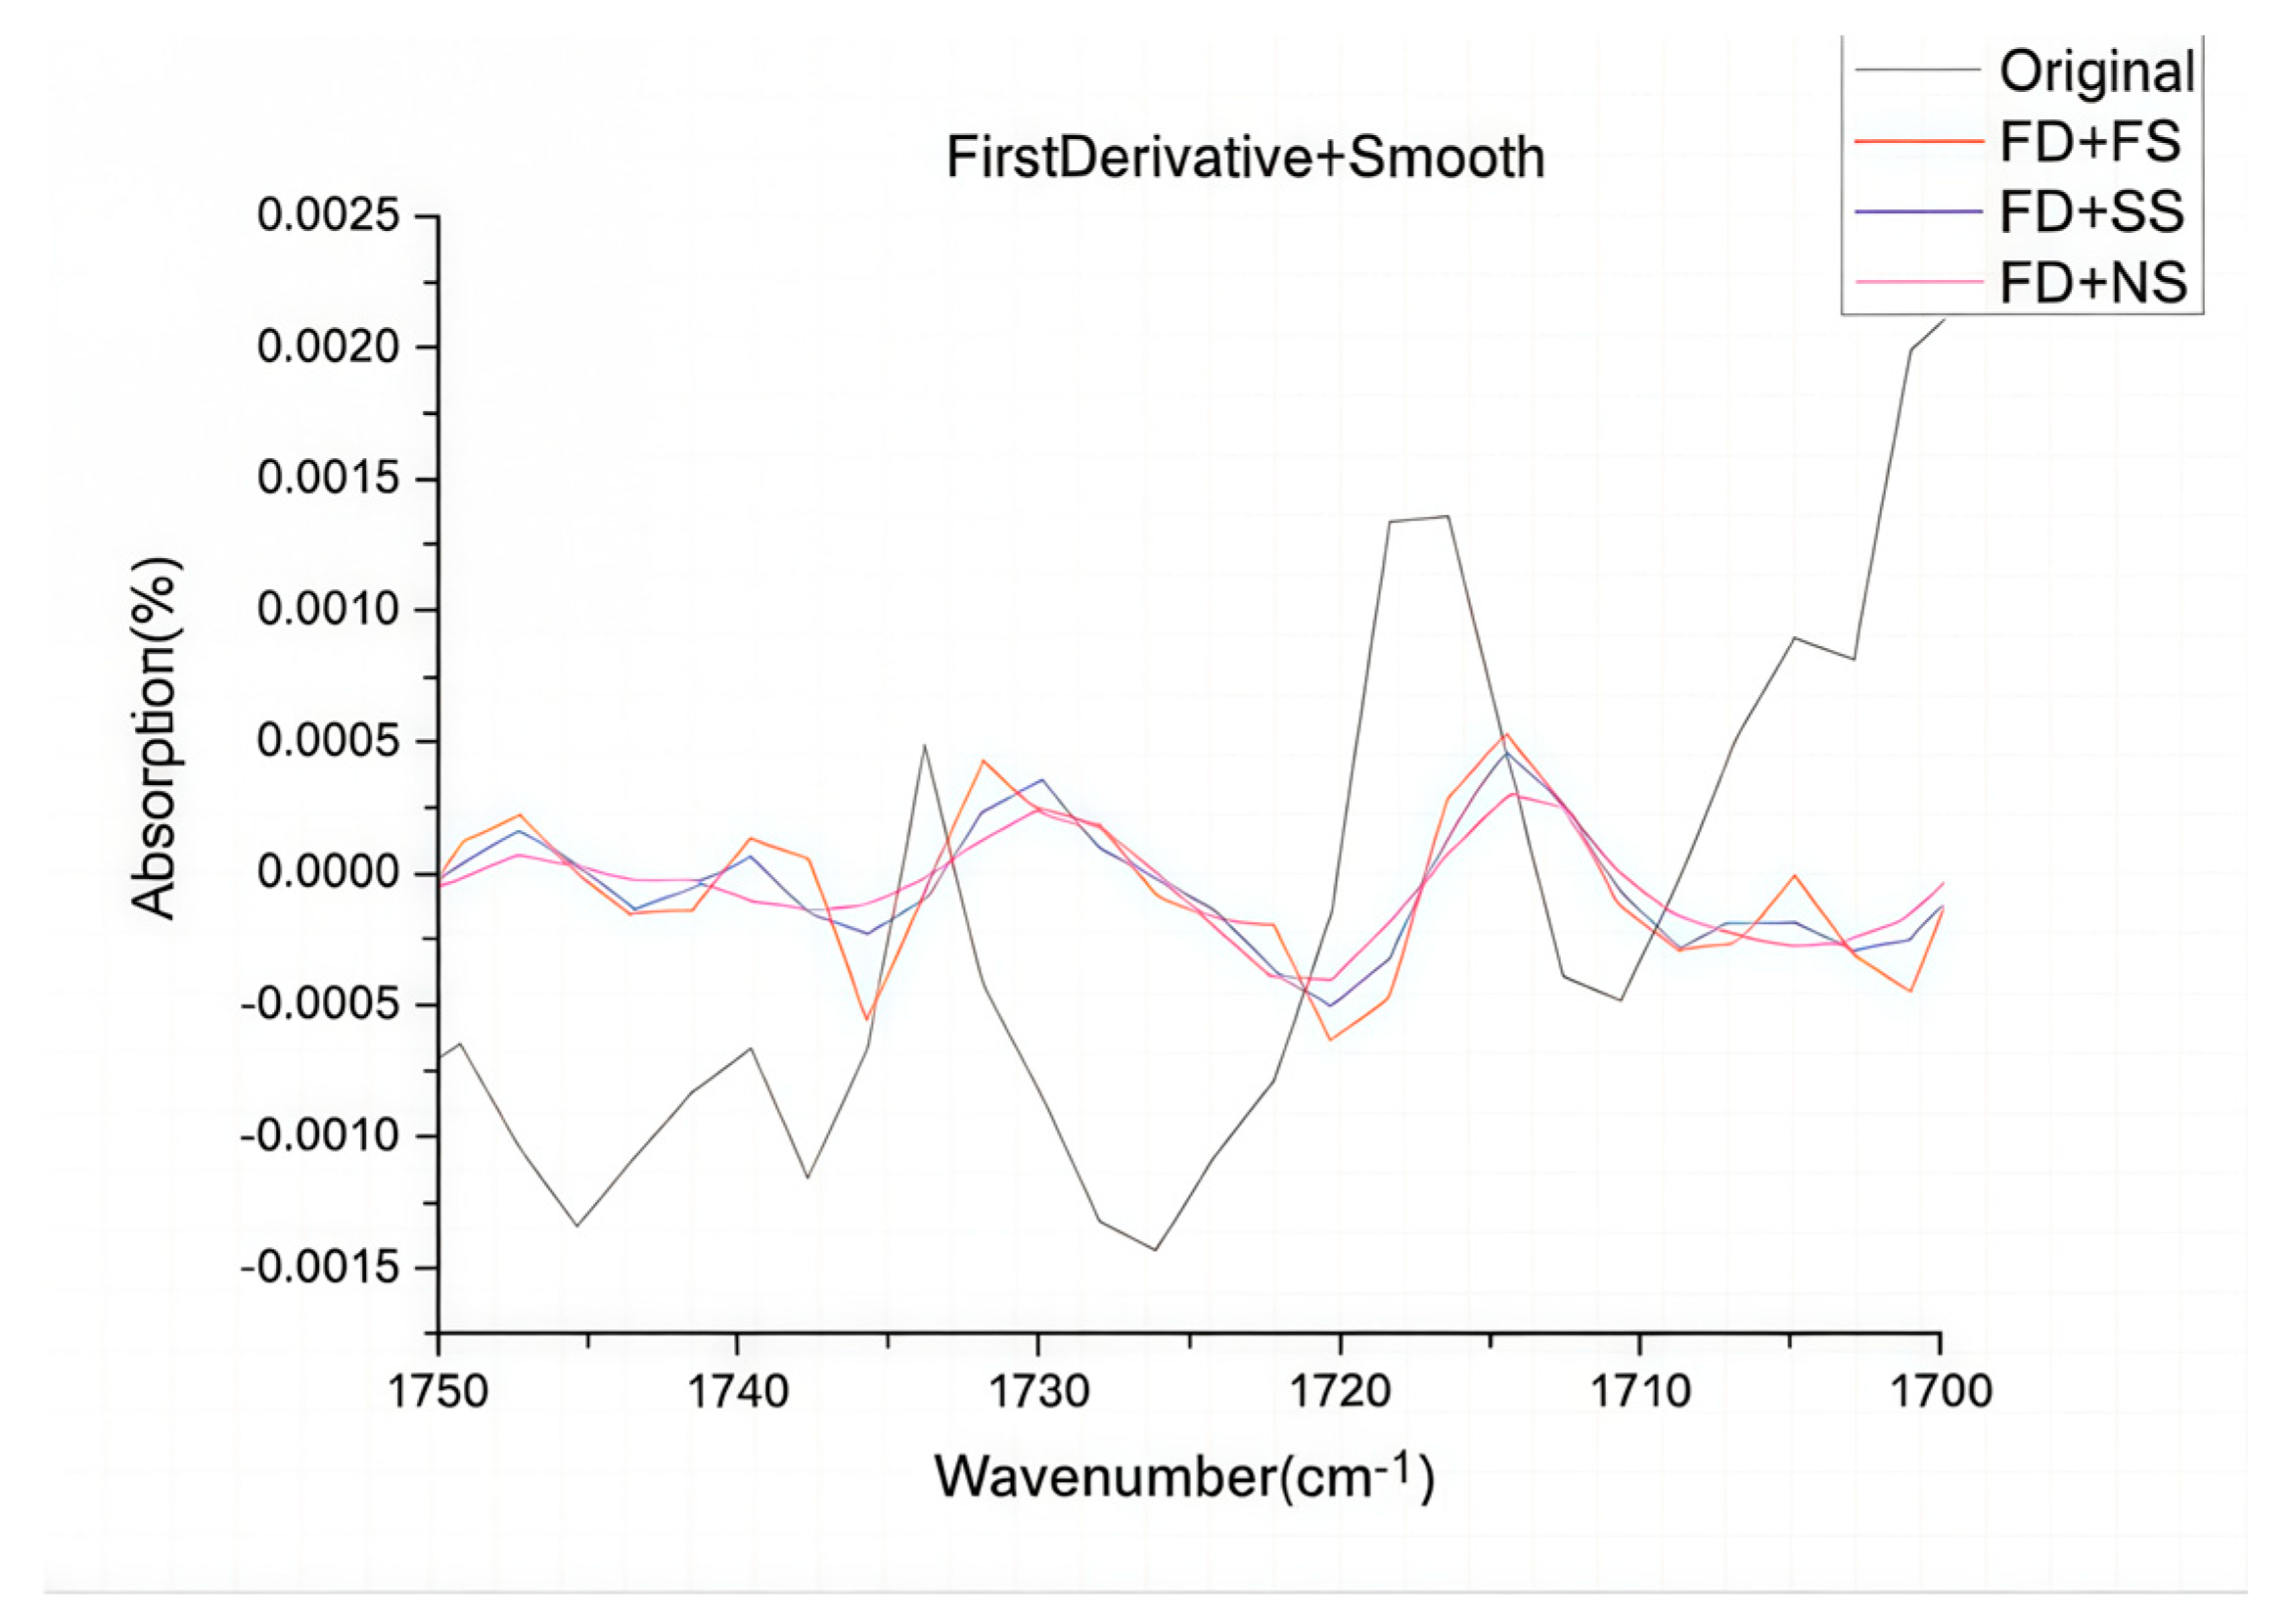
Figure 5 and Figure 6 employ a combination of derivative processing and S-G smoothing. Compared with the smoothed spectrum shown in Figure 3, this combined method effectively eliminates baseline drift. Additionally, it mitigates part of the noise introduced by derivative processing while preserving valuable information. Specifically, the derivative-S-G smoothing combination belongs to the Savitzky–Golay convolution derivation approach, which calculates derivative coefficients analogous to smoothing coefficients via least squares. The resulting spectra can thus efficiently suppress interference from baseline drift and other background noises.

4.3. Model Establishment and Analysis

Five-point, seven-point, and nine-point smoothing processing, first-order and second-order derivative processing, and combined derivative and smoothing processing are performed on the spectrum, respectively. Therefore, the aforementioned methods are arranged and combined to set up comparative experiments. And use these processed spectra and concentration arrays to establish a quantitative analysis prediction model. Table 3 shows the PLS quantitative regression prediction analysis results of the acid number of the lubricating oil treated with different spectral pretreatment methods.
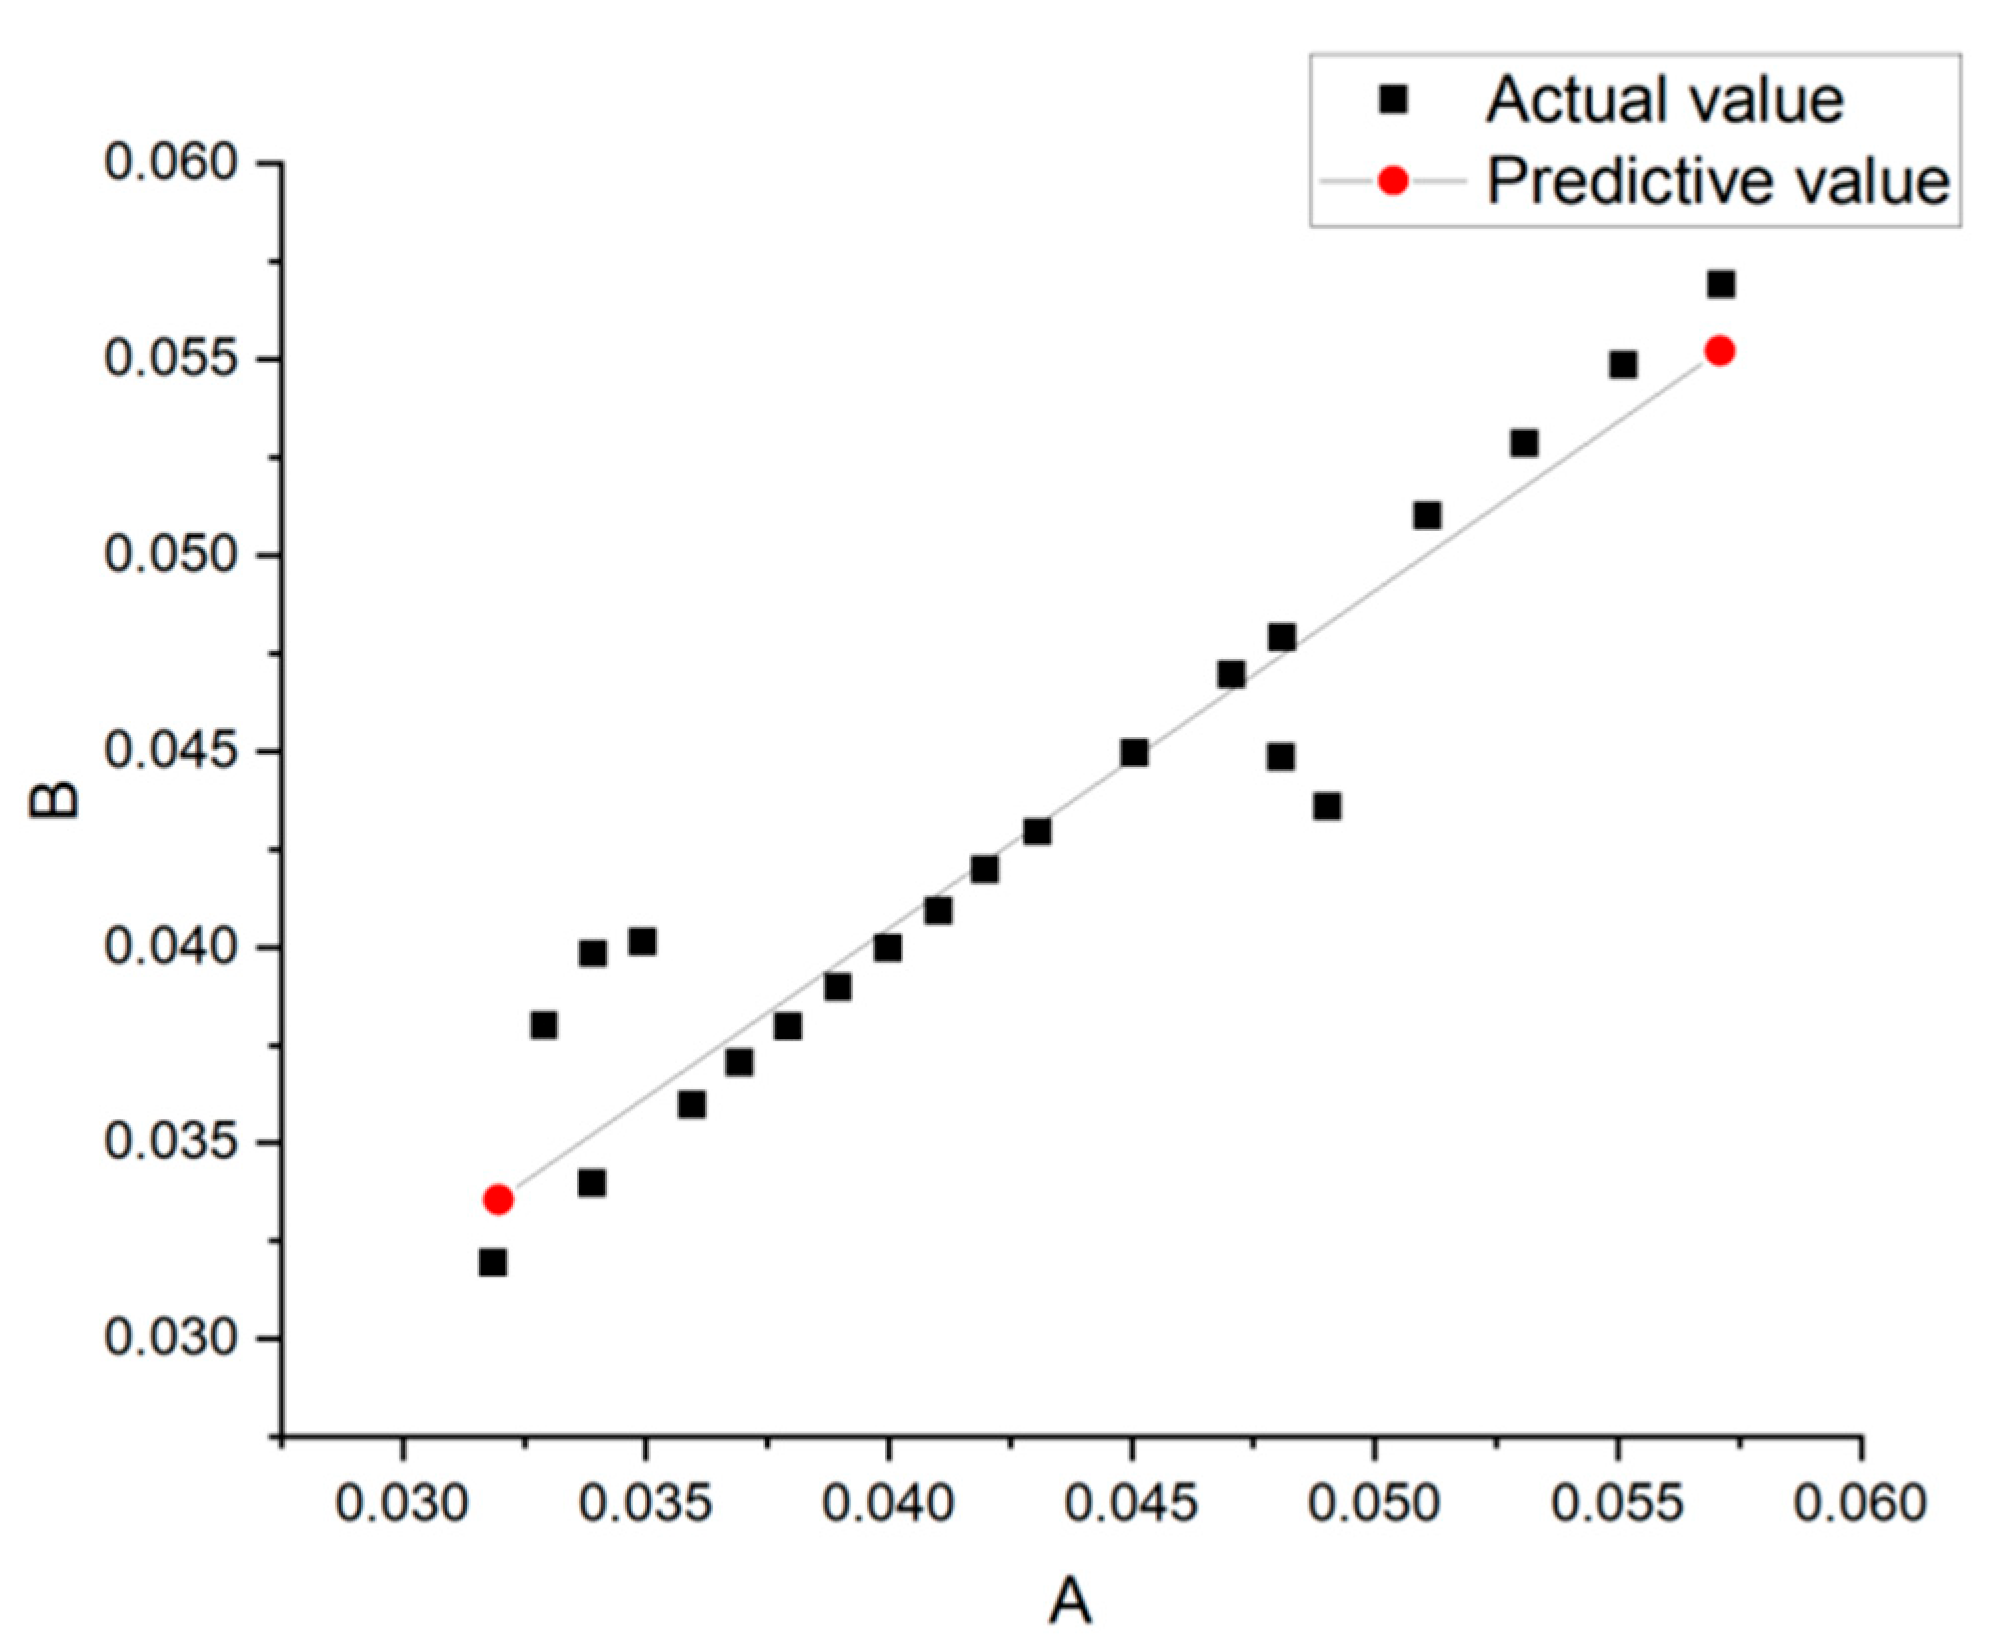
It can be seen from Table 4 that the PLS quantitative regression model established by the SD+SS method has the best effect. At this time, the optimal number of principal components is 2, and the RMSEP value is 0.0060. The SD+FS method yielded the poorest performance, with a Best Principal Component of 11. This could be attributed to algorithmic incompatibility or overfitting, where “Best Principal Component” corresponds to latent variables. Notably, with the same number of points in the window, the SD method outperformed the FD method, indicating that the second derivative has a superior capability in characterizing data variations. Smoothing the original spectrum is not as good as taking the derivative of the spectrum. Although the derivative processing of the spectrum will introduce noise, the combination with the smoothing processing will make the spectrum retain more effective information, so the combination processing method can be selected according to the needs when necessary. Once the spectral preprocessing method was determined, it was employed to construct a partial least squares regression (PLSR) model. This model was then used to re-predict the acid number of the training set. Subsequently, a correlation coefficient plot was generated with the original data and predicted data as coordinate points, as illustrated in Figure 7.
As presented in Table 3, the model demonstrates an RMSECV of 0.00505 and a correlation coefficient (R) of 0.9800, indicating distinct linearity and favorable predictive performance. A PLSR model was subsequently constructed using the identified SD+SS pretreatment method. For the validation set of oil samples, the root mean square error of prediction (RMSEP) between predicted and actual acid numbers was calculated as 0.14%, with a corresponding correlation coefficient (R) of 0.9820. These findings confirm a strong consistency between the predicted values and actual measurements. Thus, the PLSR model established based on spectra processed by the SD+SS method enables high-precision determination of the acid number in lubricating oil.

5. Conclusions

In this study, different spectral preprocessing methods were used to establish the PLS quantitative regression model of infrared spectrum and acid number of lubricating oil. The most suitable spectral preprocessing method for modeling is determined through the model evaluation parameters, and the acid number of the unknown sample can be predicted more accurately, which provides a theoretical basis for predicting the acid number of lubricating oil. The article innovatively combines multiple spectral preprocessing methods with the partial least squares regression (PLSR) model, and for the first time clarifies that the combined preprocessing method of second-order derivative and seven-point smoothing can optimally extract the characteristic information of mid-infrared spectra of lubricating oil, significantly improving the accuracy of the acid number prediction model. Aiming at the limitations of traditional multiple linear regression in spectral data modeling, this study breaks through the technical bottleneck that the sample size needs to be larger than the variable dimension through the PLSR method, and realizes the high-precision prediction of a lubricating oil acid number under the condition of small samples. The prediction method based on PLSR requires a sample size smaller than the variable dimension, overcoming the multiple correlations of independent variables.

Author Contributions

Conceptualization, K.Y.; Methodology, F.Z.; Software, X.L.; Validation, J.S. and K.Y.; Formal analysis, F.Z.; Data curation, K.Y.; Writing—original draft, F.Z.; Writing—review and editing, J.S.; Supervision, L.W. All authors have read and agreed to the published version of the manuscript.

Funding

This research received no external funding.

Data Availability Statement

The raw data supporting the conclusions of this article will be made available by the authors on request.

Conflicts of Interest

The authors declare no conflict of interest.

References

  1. Murthy, A.A.; Norris, S.; Subiantoro, A. Effects of Lubricating oil on the performance of a Four-Intersecting-Vane Rotary Expander. IOP Conf. Ser. Mater. Sci. Eng. 2021, 1180, 32–41. [Google Scholar] [CrossRef]
  2. Zheng, N.; Tong, B.; Zhang, G.; Hu, X.; Liang, H.; Wang, W.; Liu, K. Heat transfer characteristics of successive oil droplet impingement under minimum quantity lubrication. Phys. Fluids 2021, 33, 033318. [Google Scholar] [CrossRef]
  3. Jia, C.; Pang, X.; Song, Y. The mechanism of unconventional hydrocarbon formation: Hydrocarbon self-sealing and intermolecular forces. Pet. Explor. Dev. Engl. Ed. 2021, 48, 20. [Google Scholar] [CrossRef]
  4. Stpień, Z. Premature Degradation of Lubricating Oil during the Service Life of the Positive-Ignition Engine. Tribol. Online 2021, 16, 31–37. [Google Scholar] [CrossRef]
  5. Tanwar, M.; Raghavan, N. Lubricating Oil Remaining Useful Life Prediction using Multi-Output Gaussian Process Regression. IEEE Access 2020, 8, 128897. [Google Scholar] [CrossRef]
  6. Chakravarthy, R.; Naik, G.N.; Savalia, A.; Sridharan, U.; Saravanan, C.; Das, A.K.; Gudasi, K.B. Determination of Naphthenic Acid Number in Petroleum Crude Oils and Their Fractions by Mid-FTIR Spectroscopy. Energy Fuels 2016, 30, 8579–8586. [Google Scholar] [CrossRef]
  7. Guan, L.; Feng, X.; Xiong, G.; Xie, J. Application of dielectric spectroscopy for engine lubricating oil degradation monitoring. Sens. Actuators A Phys. 2011, 168, 22–29. [Google Scholar] [CrossRef]
  8. Zhang, Y.; Zhang, F.; Fu, X.; Jin, P.; Hou, J. Determination of fatty acid content in mixed oil by Raman spectroscopy based on ABC-SV R algorithm. Spectrosc. Spectr. Anal. 2019, 39, 2147–2152. [Google Scholar]
  9. van de Voort, F.R.; Sedman, J.; Yaylayan, V.; Saint Laurent, C. Determination of acid number and base number in lubricants by Fourier transform infrared spectroscopy. Appl. Spectrosc. 2003, 57, 1425–1431. [Google Scholar] [CrossRef] [PubMed]
  10. Jin, Y.; Duan, H.; Wei, L.; Chen, S.; Qian, X.; Jia, D.; Li, J. Online infrared spectra detection of lubricating oil during friction process at high temperature. Ind. Lubr. Tribol. 2018, 70, 1294–1302. [Google Scholar] [CrossRef]
  11. Adams, M.J.; Romeo, M.J.; Rawson, P. FTIR analysis and monitoring of synthetic aviation engine oils. Talanta 2007, 73, 629–634. [Google Scholar] [CrossRef] [PubMed]
  12. Wang, J.; Wang, K.; Han, X. Rapid Determination of Oleic Acid in Diesel Engine using Random forest-correlation Vector Machine algorithm combined with Mid-infrared Spectroscopy. Phys. Chem. Test. Chem. Vol. 2019, 55, 26–30. [Google Scholar]
  13. Shi, L.; Qu, J.; Xing, Z. Determination of oleic acid number by least square support vector machine combined with infrared spectroscopy. Phys. Chem. Test. Chem. Vol. 2018, 54, 200–203. [Google Scholar]
  14. Caneca, A.R.; Pimentel, M.F.; Galvão, R.K.H.; da Matta, C.E.; de Carvalho, F.R.; Raimundo, I.M., Jr.; Pasquini, C.; Rohwedder, J.J.R. Assessment of infrared spectroscopy and multivariate techniques for monitoring the service condition of diesel-engine lubricating oils. Talanta 2006, 70, 344–352. [Google Scholar] [CrossRef] [PubMed]
  15. Dong, J. Quantitative Condition Monitoring of Lubricating Oils by Fourier Transform Infrared (FTIR) Spectroscopy. Ph.D. Thesis, McGill University, Montreal, QC, Canada, 2000. [Google Scholar]
  16. Rahman, H.; Shahriar, S.; Menezes, P.L. Recent progress of machine learning algorithms for the oil and lubricant industry. Lubricants 2023, 11, 289. [Google Scholar] [CrossRef]
  17. Zhou, Q.; Guo, Y.; Xu, K.; Chai, B.; Li, G.; Wang, K.; Dong, Y. Research on the prediction algorithm of aero engine lubricating oil consumption based on multi-feature information fusion. Appl. Intell. 2024, 54, 11845–11875. [Google Scholar] [CrossRef]
  18. Liu, J.; Zhang, Y.; Yang, S.; Yi, C.; Liu, T.; Zhang, R.; Jia, D.; Peng, S.; Yang, Q. Prediction of lubrication performances of vegetable oils by genetic functional approximation algorithm. Lubricants 2024, 12, 226. [Google Scholar] [CrossRef]
  19. Park, L.K.-E.; Liu, J.; Yiacoumi, S.; Borole, A.P.; Tsouris, C. Contribution of acidic components to the total acid number (TAN) of bio-oil. Fuel 2017, 200, 171–181. [Google Scholar] [CrossRef]
  20. Haas, J.; Mizaikoff, B. Advances in mid-infrared spectroscopy for chemical analysis. Annu. Rev. Anal. Chem. 2016, 9, 45–68. [Google Scholar] [CrossRef] [PubMed]
  21. Abdi, H.; Williams, L.J. Partial least squares methods: Partial least squares correlation and partial least square regression. In Computational Toxicology: Volume II; Humana Press: Totowa, NJ, USA, 2012; pp. 549–579. [Google Scholar]
  22. Morais, C.L.M.; Santos, M.C.D.; Lima, K.M.G.; Martin, F.L. Improving data splitting for classification applications in spectrochemical analyses employing a random-mutation Kennard-Stone algorithm approach. Bioinformatics 2019, 35, 5257–5263. [Google Scholar] [CrossRef] [PubMed]
  23. GB/T 7304; Petroleum Products—Determination of Acid Number—Potentiometric Titration Method. National Standard of the People’s Republic of China: Beijing, China, 2014.
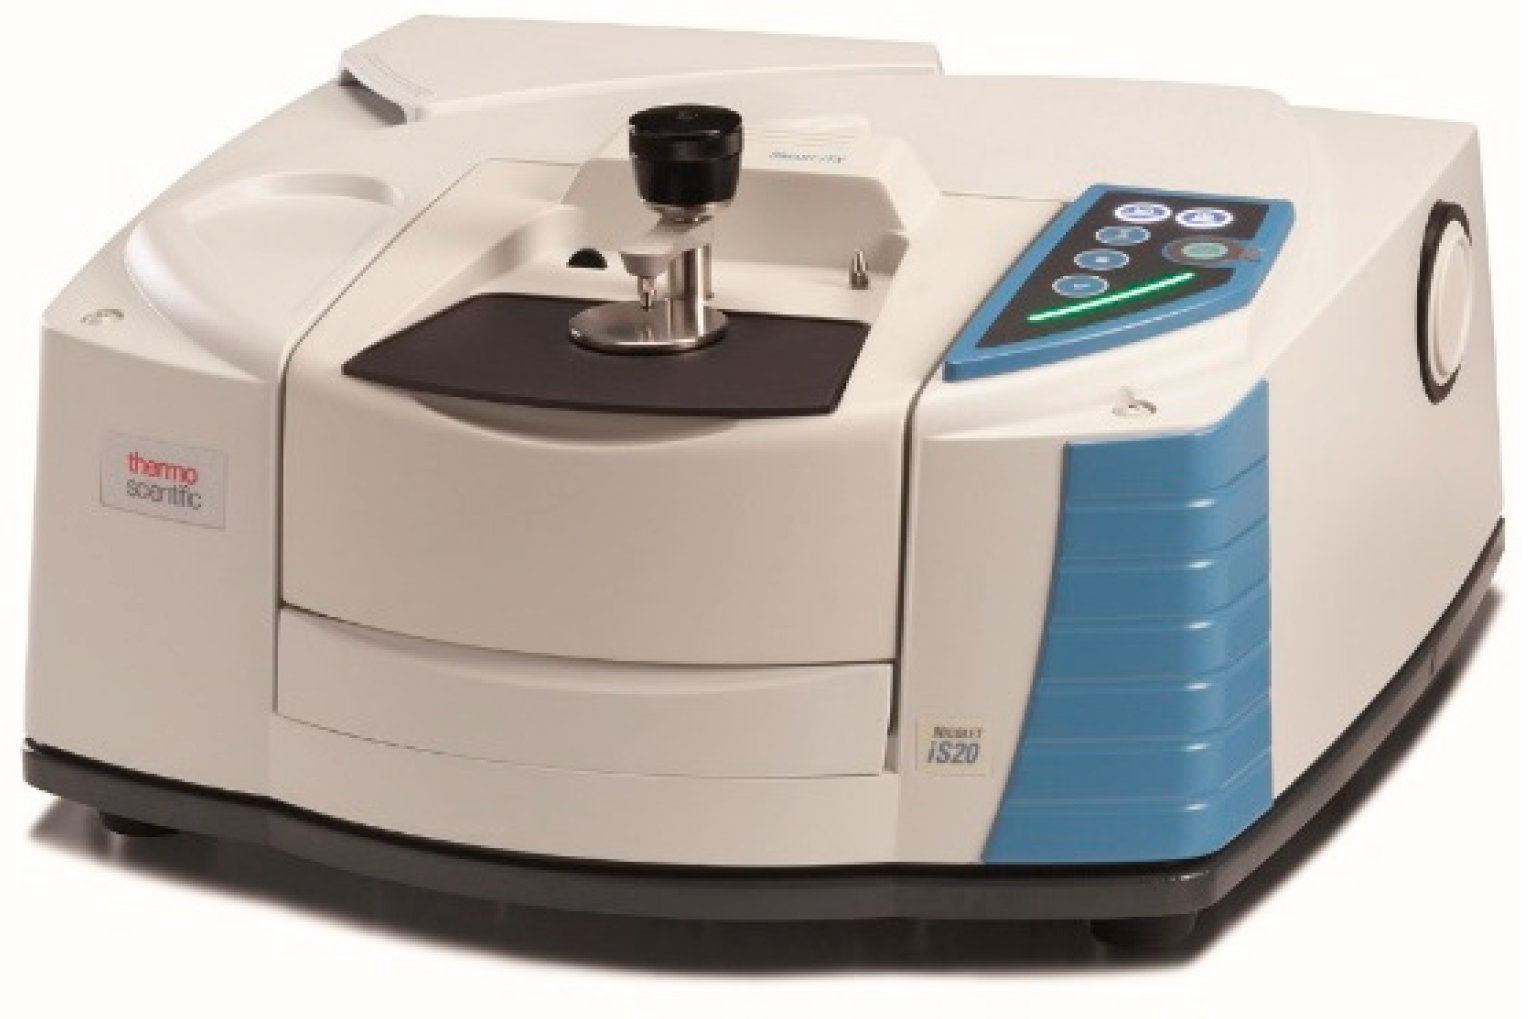
Figure 1. Nicolet Apex Fourier transform infrared spectrometer.
Lubricants 13 00355 g001
Figure 2. Raw spectrogram.
Lubricants 13 00355 g002
Figure 3. Raw spectrum after FS, SS, and NS processing (section).
Lubricants 13 00355 g003
Figure 4. Raw spectrum after FD and SD processing (section).
Lubricants 13 00355 g004
Figure 5. Raw spectrogram after first derivative + smoothing (section).
Lubricants 13 00355 g005
Figure 6. Raw spectrogram after second derivative + smoothing (section).
Lubricants 13 00355 g006
Figure 7. Correlation between training set acid number measurements and predicted values.
Lubricants 13 00355 g007
Table 1. Lubricating oil sample indicators.
PropertyValuePropertyValue
Saturated Hydrocarbons %>90Pour Point (°C)−20~12
Viscosity Index80~120Aniline Point (°C)80~112
Sulfur Content %<0.03Acid Number (mgKOH/g)0.015~0.03
Density (20 °C, g/cm3)0.84Aromatics (CA) Content %<10
Flash Point (°C)140Naphthenes (CN) Content %35±
Table 2. Acid number of lubricating oil sample.
NumberHeating TimeAcid Number
mgKOH/g
NumberHeating TimeAcid Number
mgKOH/g
NumberHeating TimeAcid Number
mgKOH/g
120.03214280.04327540.043
240.03515300.04628560.046
360.03616320.03629580.048
480.03417340.03830600.047
5100.03618360.0431620.049
6120.03819380.03832640.046
7140.03320400.03833660.048
8160.03721420.04134680.049
9180.04222440.04535700.05
10200.03923460.04236720.051
11220.03524480.04737740.053
12240.04525500.04
13260.04226520.042
Table 3. Abbreviation.
NumberSpectral Preprocessing MethodsAbbreviation
1Five-point smoothingFS
2Seven-point smoothingSS
3Nine-point smoothingNS
4First derivativeFD
5Second derivativeSD
6Five-point smoothing + first derivativeFD+FS
7Seven-point smoothing + first derivativeFD+SS
8Nine-point smoothing + first derivativeFD+NS
9Nine-point smoothing + second derivativeSD+FS
10Nine-point smoothing + second derivativeSD+SS
11Nine-point smoothing + second derivativeSD+NS
Table 4. Modeling results of acid number of lubricating oil after different spectral pretreatment.
Spectral Preprocessing MethodsBest Principal ComponentTraining SetPrediction Set
RMSECVRMSEP
FS20.007930.00954
SS20.007940.00955
NS20.007930.00957
FD20.006400.00779
SD60.006150.00738
FD+FS20.006370.00763
FD+SS20.005780.00684
FD+NS20.005650.00674
SD+FS110.005860.00703
SD+SS20.005050.00602
SD+NS20.005410.00651
Disclaimer/Publisher’s Note: The statements, opinions and data contained in all publications are solely those of the individual author(s) and contributor(s) and not of MDPI and/or the editor(s). MDPI and/or the editor(s) disclaim responsibility for any injury to people or property resulting from any ideas, methods, instructions or products referred to in the content.