Article

Smart Oil Management with Green Sensors for Industry 4.0

Department of Electrical and Electronics Engineering, Simav Faculty of Technology, Kutahya Dumlupinar University, Simav 43500, Kutahya, Turkey
Lubricants 2025, 13(9), 389; https://doi.org/10.3390/lubricants13090389
Submission received: 22 July 2025 / Revised: 21 August 2025 / Accepted: 28 August 2025 / Published: 1 September 2025

Abstract

Lubricating oils are utilised in equipment and machinery to reduce friction and enhance material utilisation. The utilisation of oil leads to an increase in its thickness and density over time. Current methods for assessing oil life are slow, expensive, and complex, and often only applicable in laboratory settings and unsuitable for real-time or field use. This leads to unexpected equipment failures, unnecessary oil changes, and economic and environmental losses. A comprehensive review of the extant literature revealed no studies and no national or international patents on neural network algorithm-based oil life modelling and classification using green sensors. In order to address this research gap, this study, for the first time in the literature, provides a green conductivity sensor with high-accuracy prediction of oil life by integrating real-time field measurements and artificial neural networks. This design is based on analysing resistance change using a relatively low-cost, three-dimensional, eco-friendly sensor. The sensor is characterised by its simplicity, speed, precision, instantaneous measurement capability, and user-friendliness. The MLP and LVQ algorithms took as input the resistance values measured in two different oil types (diesel, bench oil) after 5–30 h of use. Depending on their degradation levels, they classified the oils as ‘diesel’ or ‘bench oil’ with 99.77% and 100% accuracy. This study encompasses a sensing system with a sensitivity of 50 µS/cm, demonstrating the proposed methodologies’ efficacy. A next-generation decision support system that will perform oil life determination in real time and with excellent efficiency has been introduced into the literature. The components of the sensor structure under scrutiny in this study are conducive to the creation of zero waste, in addition to being environmentally friendly and biocompatible. The developed three-dimensional green sensor simultaneously detects physical (resistance change) and chemical (oxidation-induced polar group formation) degradation by measuring oil conductivity and resistance changes. Measurements were conducted on simulated contaminated samples in a laboratory environment and on real diesel, gasoline, and industrial oil samples. Thanks to its simplicity, rapid applicability, and low cost, the proposed method enables real-time data collection and decision-making in industrial maintenance processes, contributing to the development of predictive maintenance strategies. It also supports environmental sustainability by preventing unnecessary oil changes and reducing waste.

1. Introduction

1.1. The Importance of Lubricating Oils and Their Degradation Mechanisms

Vehicle engines and other moving parts can be damaged by friction and wear. Lubricating oils are essential engineering materials that reduce friction between machinery and engine components, prevent wear, save fuel and energy, increase equipment or machinery efficiency, dissipate heat, and protect against corrosion [1]. These oils, available in mineral, synthetic, and semi-synthetic forms, also improve engine cleanliness. However, they degrade throughout their service life due to high temperatures, oxidation, contamination, moisture, chemical reactions, and viscosity changes [2]. This degradation leads to thickening, structural changes, reduced protective capacity, and the formation of deposits. Oils discharged from systems such as engines, transmissions, and hydraulic systems after use contain chlorinated hydrocarbons, heavy metals, and polychlorinated biphenyls, and their unintentional release into soil and water contributes to soil and water pollution [1]. Contaminants such as acidic compounds from exhaust gases and fuel residues reduce lubrication capacity and negatively impact engine performance. Therefore, determining the optimum service life of lubricating oils is critical to engine health and efficiency.

1.2. Current Oil Monitoring Methods and Limitations

Knowing the condition of the oil throughout its lifespan prevents unnecessary maintenance and oil changes, while also preventing equipment damage, resulting in long machine life and efficiency. Vehicle oil change intervals are affected by many factors, including oil type, oxidation, temperature, driving conditions, location, mechanical load, and climate. Current practice largely relies on estimates. Internal combustion engine manufacturers recommend an oil change every 10,000–15,000 km. Reports suggest that lubricating oils may no longer perform as expected after approximately 10,000 km (250 h) of travel or three months of engine use [3]. Various methods and signs indicate oil deterioration or the need for oil to be changed. These include oil colour and consistency, odour, reduced engine performance, low engine oil level, oil pressure warning light, oil analysis, manufacturer recommendations, and mileage tracking.
New oil is typically clear and golden yellow. It begins to darken over time. If it is black and very dark, there is a high dirt and combustion residue concentration. If the oil is too thick, it will not flow properly through the engine. The optimum service life of lubricating oils is determined by how long their physical and chemical properties remain effective before they begin to deteriorate during use. This period is critical for engine, machine, or system health. Laboratory-based methods such as viscosity measurement, total acid number (TAN), total base number (TBN), metal and particle analysis, and FTIR spectroscopy produce predictive results by monitoring changes in physical parameters. Determining physical parameters of oils, such as viscosity, TBN, TAN, water content, and conductivity, allows for monitoring macroscopic changes in the oil over time or operating hours, but generally provides only predictive results; that is, it does not provide direct information about the cause of the change in physical parameters. Furthermore, these techniques have limitations such as high cost, complex instrumentation requirements, and limited applicability under field conditions.
A study examining how the oxidation stability, thermal stability, and anti-wear performance of engine oils change with oil degradation observed a decrease in oil performance due to depletion of oxidation inhibitors in high-temperature and high-speed tests [4,5]. In another study, road tests showed that the oil’s oxidation level and viscosity values varied depending on driving conditions. These findings suggest that urban driving can increase the rate of oil degradation [6]. The kinematic viscosity of 10W-30 Delta NL engine oil (API SL) decreased by 22.92% at cold start, 23.61% at 40 °C, and 26.13% at 100 °C after different travel lengths; the flash and fire points decreased by 15.6% and 14.22%, respectively. The study indicates that it is advisable to change the engine oil after approximately 10,000 km of use [7]. The study, which examined the field tests of different engine oils (0W30, 5W30, 5W40) at 15,000 km oil change intervals in post-warranty vehicles, showed that iron, silicon, and nickel particles increased after 12,000 km in all vehicles. At the same time, molybdenum and calcium additives decreased by 32% [8].

1.3. Literature Review of Advanced Techniques

Recent studies have increasingly used AI-based data analytics, sensor technologies, and electrochemical methods to monitor oil condition. Capacitive sensors have measured capacitance and viscosity changes over mileage or usage time. DC motor current measurements were used to assess viscosity changes, while multivariable resonance sensors independently monitored oil ageing and water contamination. When combined with machine learning algorithms, portable spectrophotometers classified oil types with high accuracy, and triboelectrification-based methods detected oxidation levels. Electrochemical impedance spectroscopy (EIS) effectively analyses corrosion trends in various oil and fuel types. A study using capacitive sensors reported that capacitance and viscosity decreased with mileage [9]. In a study to predict automotive engine oil change, the device consisted of four main components, and its primary purpose was to measure DC motor current at controlled temperatures. Rapid vehicle viscosity changes were measured and presented graphically [10]. Another study investigated multivariate electrical resonance sensors for monitoring oil ageing and contamination. Laboratory experiments compared the sensor’s ability to distinguish between water contamination and oil ageing with capacitance and tuning fork sensors; transducer integration was proposed to increase sensor stability, and machine learning algorithms were only theoretically discussed [11]. In a study involving machine learning techniques for chemical and species analysis of ocean oil samples using a handheld spectrophotometer, oil types were classified with sensitivity and specificity of 92–100% and F1 scores of 85.7–100% [12]. In another study, a simple triboelectrification-based monitoring method based on the contact charging principle was proposed for online and real-time monitoring of lubricant degradation. Oil oxidation levels are determined by changes in charge signals generated by the contact and separation of cellulose and another polymer in the oil medium. However, the complexity of the sensor manufacturing process and the lack of artificial neural network analysis are significant limitations [13]. A patent developed in Türkiye presents a method for monitoring the instantaneous condition of oils and determining their remaining life using triboelectrostatic sensors. These sensors provide information about the condition of the oil by measuring its electrical properties [14]. In one study, EIS measurements were performed by immersing 16Mn steel in different oil types (heavy oil, diesel, and gasoline). Nyquist diagrams revealed that the steel exhibited the least corrosion tendency in heavy oil, moderate corrosion in diesel, and the greatest corrosion tendency in gasoline [15]. In another study, oils contaminated with diesel, water, and activated carbon were analysed with EIS. A negative linear relationship was observed between diesel contamination and impedance [16]. These studies demonstrate that EIS is an effective method for such analyses by examining the impedance properties of different fuels and oils. This technique allows for detailed analysis of the impedance behaviour of fuels such as diesel and gasoline and industrial oils. The findings demonstrate that combining real-time sensor data, machine learning, and laboratory analysis provides the most reliable results. Furthermore, developing environmentally friendly and intelligent oil monitoring systems may be possible. Comparative evaluation of the current study with the literature is provided in Table 1.

1.4. Identifying the Research Gap

Current literature relies on spectroscopic and chromatographic analyses, which focus on detecting contaminants in oil rather than directly determining oil life, and studies directly determining the actual service life of lubricating oils are limited. The relationship between physical changes and molecular degradation has been insufficiently investigated, and comparative analyses of different oil types are rare. However, to achieve the highest levels of machine health and optimal oil performance, oil life must be determined instantly and with scientific accuracy. A significant gap exists in developing conductivity-based, AI-enabled, low-cost, portable, and biodegradable sensor systems.

1.5. Objectives of the Current Study

This study aims to present the ageing profiles of diesel and reference oils at both the physical and molecular levels, verify molecular changes using FTIR spectroscopy, perform conductivity-based measurements with a sensitivity of 50 µS/cm, and classify the results using MLP and LVQ architectures. A three-dimensional biodegradable sensor structure that enables environmentally friendly, cost-effective, and field-applicable oil monitoring without toxic reagents has been developed. This approach minimises unnecessary oil changes, reduces maintenance costs, increases energy efficiency, and contributes to environmental sustainability goals.
This study introduces a method for on-site, real-time, fast, sensitive (50 µS/cm) classification using MLP and LVQ architectures with a biodegradable sensor-based AI-integrated green sensing platform without the use of toxic/hazardous reagents. Unlike current technology, the lifespan of lubricating oil is determined through electrochemical sensing. Compared to current technologies, this system offers cost-effectiveness, precision, and simplicity without compromising performance. All sensor components contribute to a sustainable environment and green transformation in the machinery and automotive sectors due to their zero-waste, environmental friendliness, and biocompatibility. Furthermore, the system contributes to digital transformation through artificial intelligence. This project stands out with its high economic impact, as it delivers a product applicable to the automotive sector, reduces oil consumption, extends the lifespan of components in contact with each other, and contributes to predictive maintenance. It will indirectly ensure energy security by reducing energy consumption in machine parts and oil production. Determining the oil lifespan will prevent unnecessary oil changes and reduce financial losses for vehicle/business owners through healthier engine/machinery equipment use. Scientifically predicting oil change times, reducing unnecessary oil changes, mobile monitoring, automatic alerts, and an environmentally friendly and competent maintenance infrastructure are among the advantages of this project.

2. Materials and Methods

2.1. Materials

Commercial colourless gelatin (Bovine gelatin, (100%)-2408155), glycerol (Glycerin-(80%)—GL139), deionised water (DIW), multimeter (Fluke-15B+), commercial diesel oil (5W30), bench oil, and commercial gasoline (5W30) were used.
Gelatin, a partially hydrolysed collagen protein, is a water-soluble, biodegradable, and biocompatible natural polymer with film- and gel-forming abilities. Its hydrophilic nature enables it to act as a water-based ionic carrier, offering flexibility and mechanical strength in gel electrolytes when combined with plasticisers like glycerol. While higher gelatin content improves durability, it may reduce conductivity. Excess plasticiser increases flexibility at the cost of mechanical strength.
Glycerol, a fully water-soluble substance with three hydroxyl groups, acts as a plasticiser in gelatin films to enhance flexibility, water retention, and ion conductivity. It weakens bonds within the gelatin matrix and, through condensation with gelatin’s -OH groups, forms a structure that can bind fat molecules [22,23].
Thanks to their ion-permeable properties, biopolymer materials can react with oil in solid electrolyte structures to produce signals and conductivity measurement responses. Electrolyte materials using natural or naturally derived polymers (biopolymers) are preferred for ion conduction. They are generally environmentally friendly, biodegradable, and derived from renewable resources. These electrolytes are frequently used in energy storage devices, fuel cells, sensors, and biosensors, offering flexible and environmentally friendly solutions. These solid electrolytes have been preferred due to their advantages over traditional aqueous electrolytes, such as biodegradability, renewability, low toxicity, flexibility, and good mechanical properties. Compared to traditional aqueous electrolytes, they allow the sensing unit and the electrolyte measurement medium to be in the same environment, minimising environmental and human health damage, being disposable, and reducing costs.

2.2. Sensor Fabrication and Experimental Setup

In the study involving electrochemical sensors, gelatin, glycerol, and purified water were used in sensor production. In determining the sensor component amounts, our previous study on the effect of component ratios on conductivity was utilised [24]. After dissolving 2 g of gelatin in 15 mL of distilled water at room temperature, 1.75 g of glycerol was added to the solution. The mixture was poured into 90 mm-diameter disposable plastic Petri dishes to form translucent films, and the sensors were dried at room temperature for 6 h before being formed. The three-dimensional elliptical sensors (1.5 × 0.5 × 0.1–0.4 cm) were ready for oil measurement in 6 h and 5 min (5 min preparation and 6 h drying time). After the sensors were produced, they were dried at room temperature (22 ± 1 °C) and humidity (50 ± 5%), and then resistance measurements were taken.
In order to prevent changes in resistance due to the penetration of other materials on the sensor surface, the area where the sensor structure is located was blocked from the external environment, leaving only sufficient space for electrode insertion during measurement. The electrodes were then connected to both ends of the sensors and then to the multimeter. The experimental setup and experimental process protocol for electrochemical measurements using a two-electrode measurement system consisting of working and counter electrodes (platinum wires, Thermo Scientific, 0.25 mm diameter, 99.90%, 1 cm each) are shown in Figure 1. The sensors were reused across triplicate trials.

2.3. Oil Sampling and Characterisation

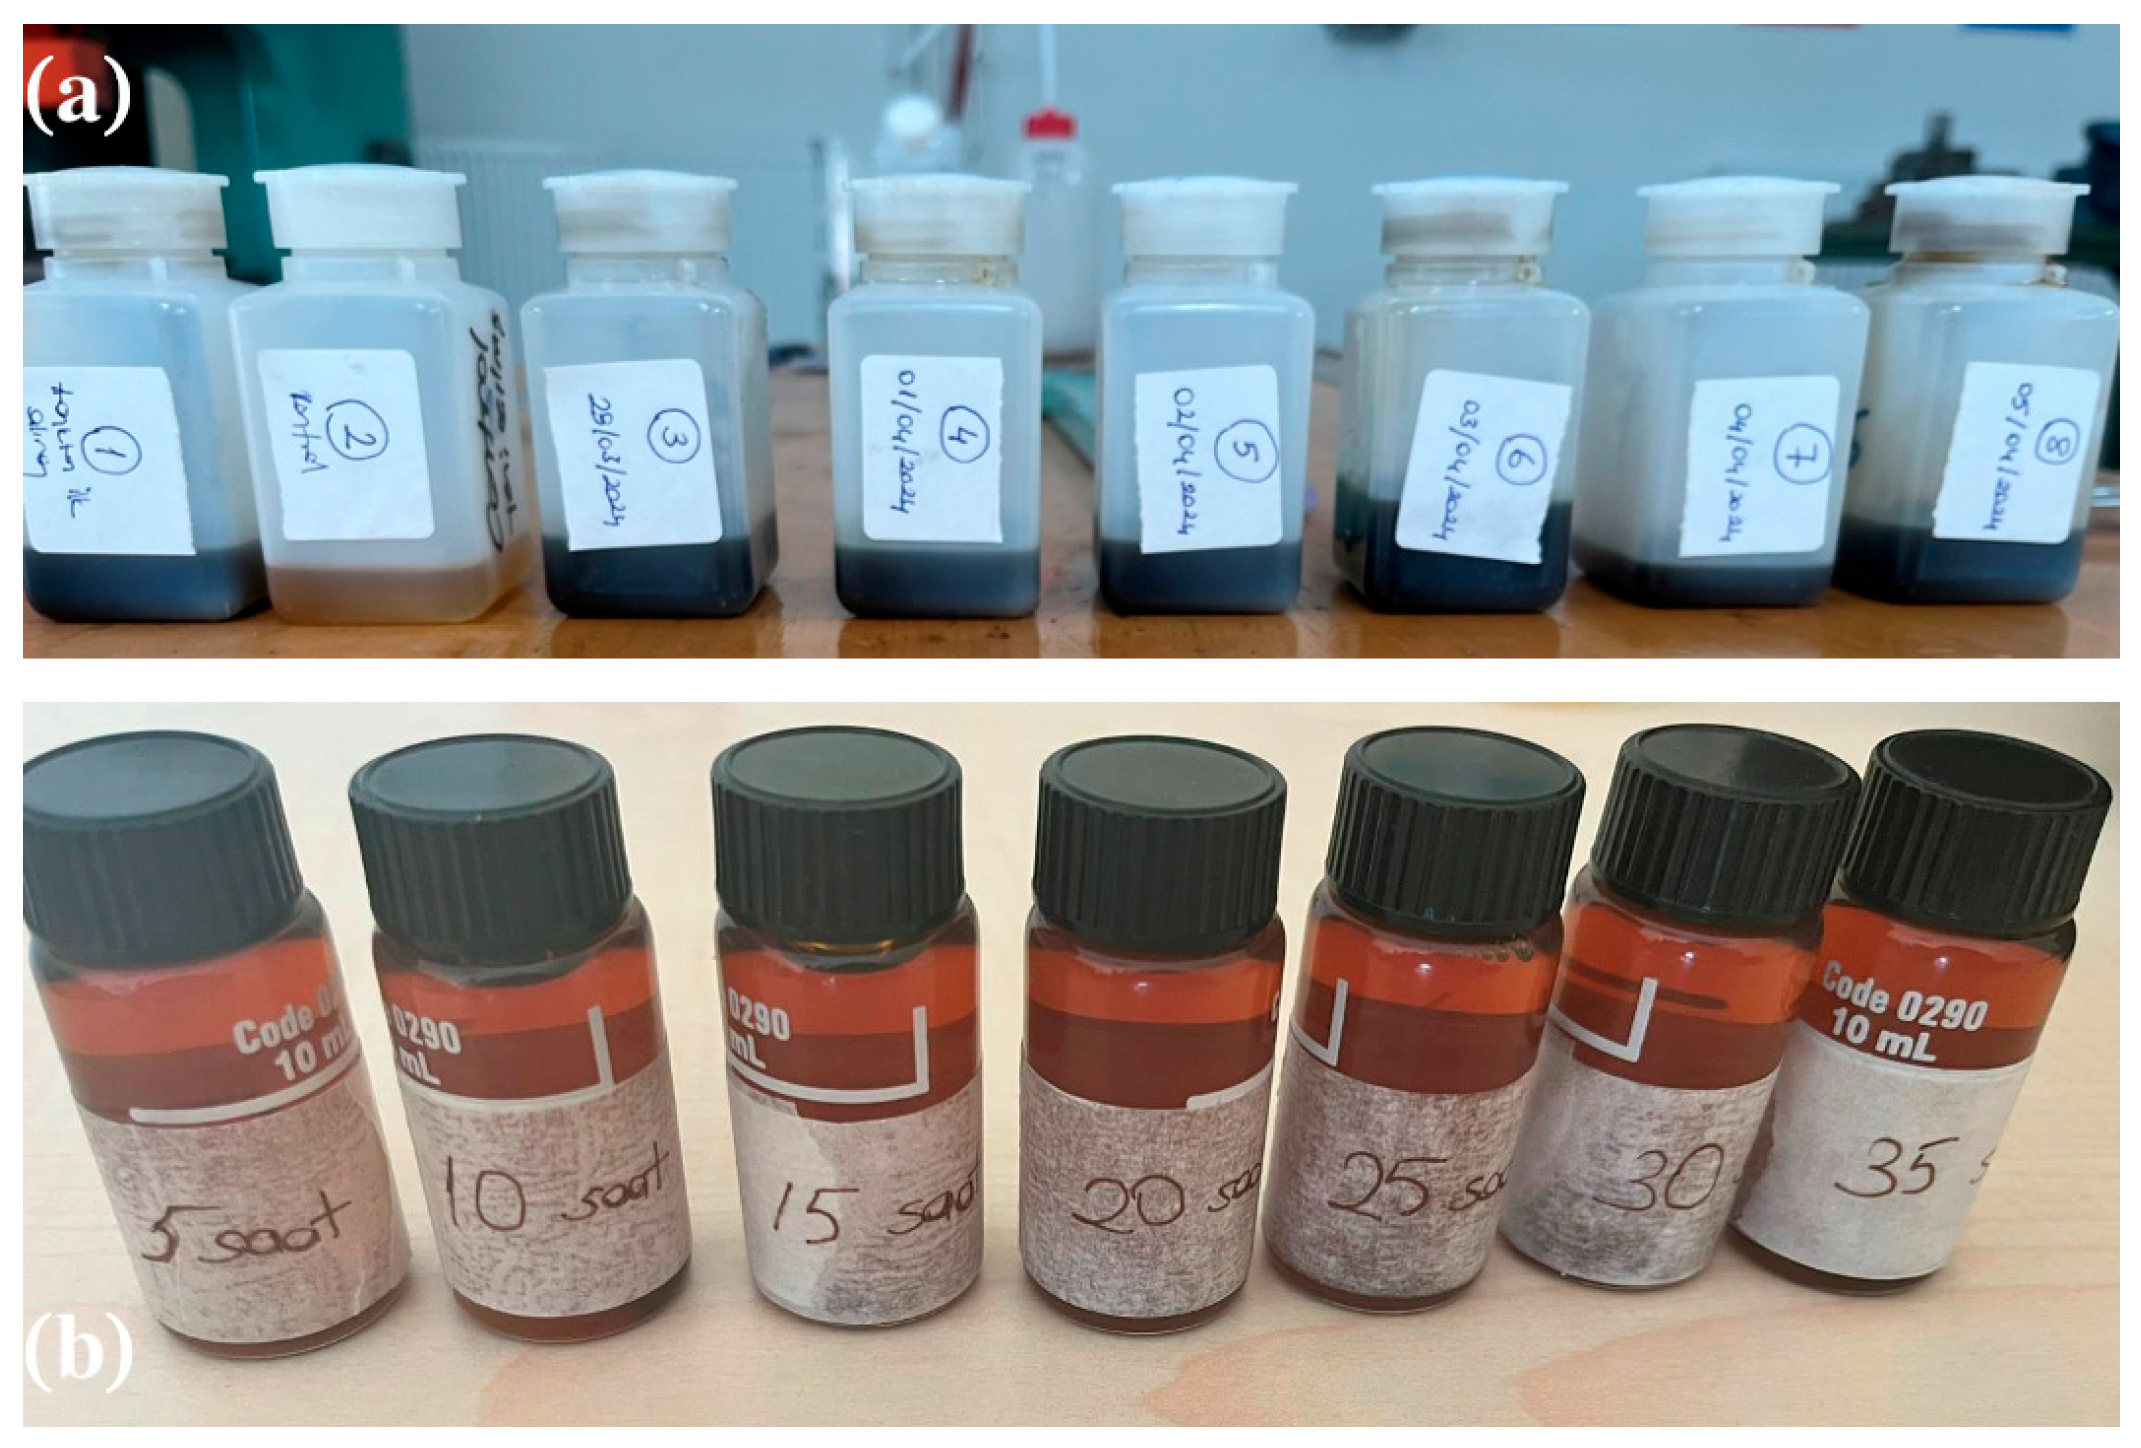
In the experimental measurement phase, oil samples contaminated in the laboratory environment and oil samples from the real environment (internal combustion engines and industrial machines) were used. In the stage of oil sampling in internal combustion engines, commercially available clean lubricating oil was added to the engine and left to run at 1500 rpm [25,26]. The rationale for choosing a high speed of 1500 rpm was to simulate engine operation at nominal load, allowing for accelerated observation of both thermal and mechanical degradation processes—in other words, accelerated ageing. This approach allows for rapid prediction of the system’s long-term behaviour [27,28,29,30,31]. The engine was run for 5–35 h to determine the general contamination trend, and 5 mL oil samples were taken from the engine after every 5 h of operation (Figure 2). For example, after adding a new oil sample to the diesel engine, the engine was left to run at 1500 rpm for 20 h. At the end of this time, a sample was taken from the engine, 0.5 mL was added to the sensors, the resistance was measured in triplicate, and the mean and standard deviation were calculated. The same protocol was followed for different oil samples.
Scanning electron microscopy (SEM—Zeiss-Gemini 500) images were examined to investigate the chemical and morphological properties of the surface of the prepared sensors as well as the changes in the porous microstructure [24]. In addition to SEM imaging, Fourier transform infrared spectroscopy (FTIR—Bruker/Alpha) analysis was performed to visualise the functional groups in clean (unused) and used commercial and bench oils. While SEM provides clear information on the sensor surface, FTIR allows us to identify which functional groups are involved in the sensor and oil structure interaction, with peaks seen in specific bands.

2.4. Resistance and Impedance Measurement

In order to observe the resistance change depending on oil usage, resistance measurements of the oils taken at intervals of 5, 10, 15, 20, 25, and 30 h were carried out with sensors in triplicate. Means and standard deviations of the data obtained were calculated, and datasets were created. Simultaneously, impedance changes in the samples were analysed using electrochemical impedance spectroscopy. In impedance measurements, the frequency range was set to 10–50,000 Hz, the measurement time was 30 s, and the voltage amplitude was set to 30 mV. Measurements were taken for 25 min at 5 min intervals.
In the next stage of the study, measurements were carried out in 3 different oil types operated at 5, 10, 15, 20, 25, and 30 h intervals in order to observe the effect of oil type on resistance change and to reveal that the sensors can respond differently to different oil types.

2.5. The Effect of Sensor Thickness on Resistance

Sensors of different thicknesses (0.1, 0.2, 0.3, and 0.4 cm) were produced to observe the resistance change (measurement accuracy) as the sensor thickness varied and whether this change would be linear. An amount of 0.5 mL of oil taken from the engine running for 30 h (since the most contamination occurred during this time interval in the experimental process) was added to the sensor surface. Then, resistance measurements were performed in triplicate with sensors of each thickness value.

2.6. Effect of Temperature Change on Resistance

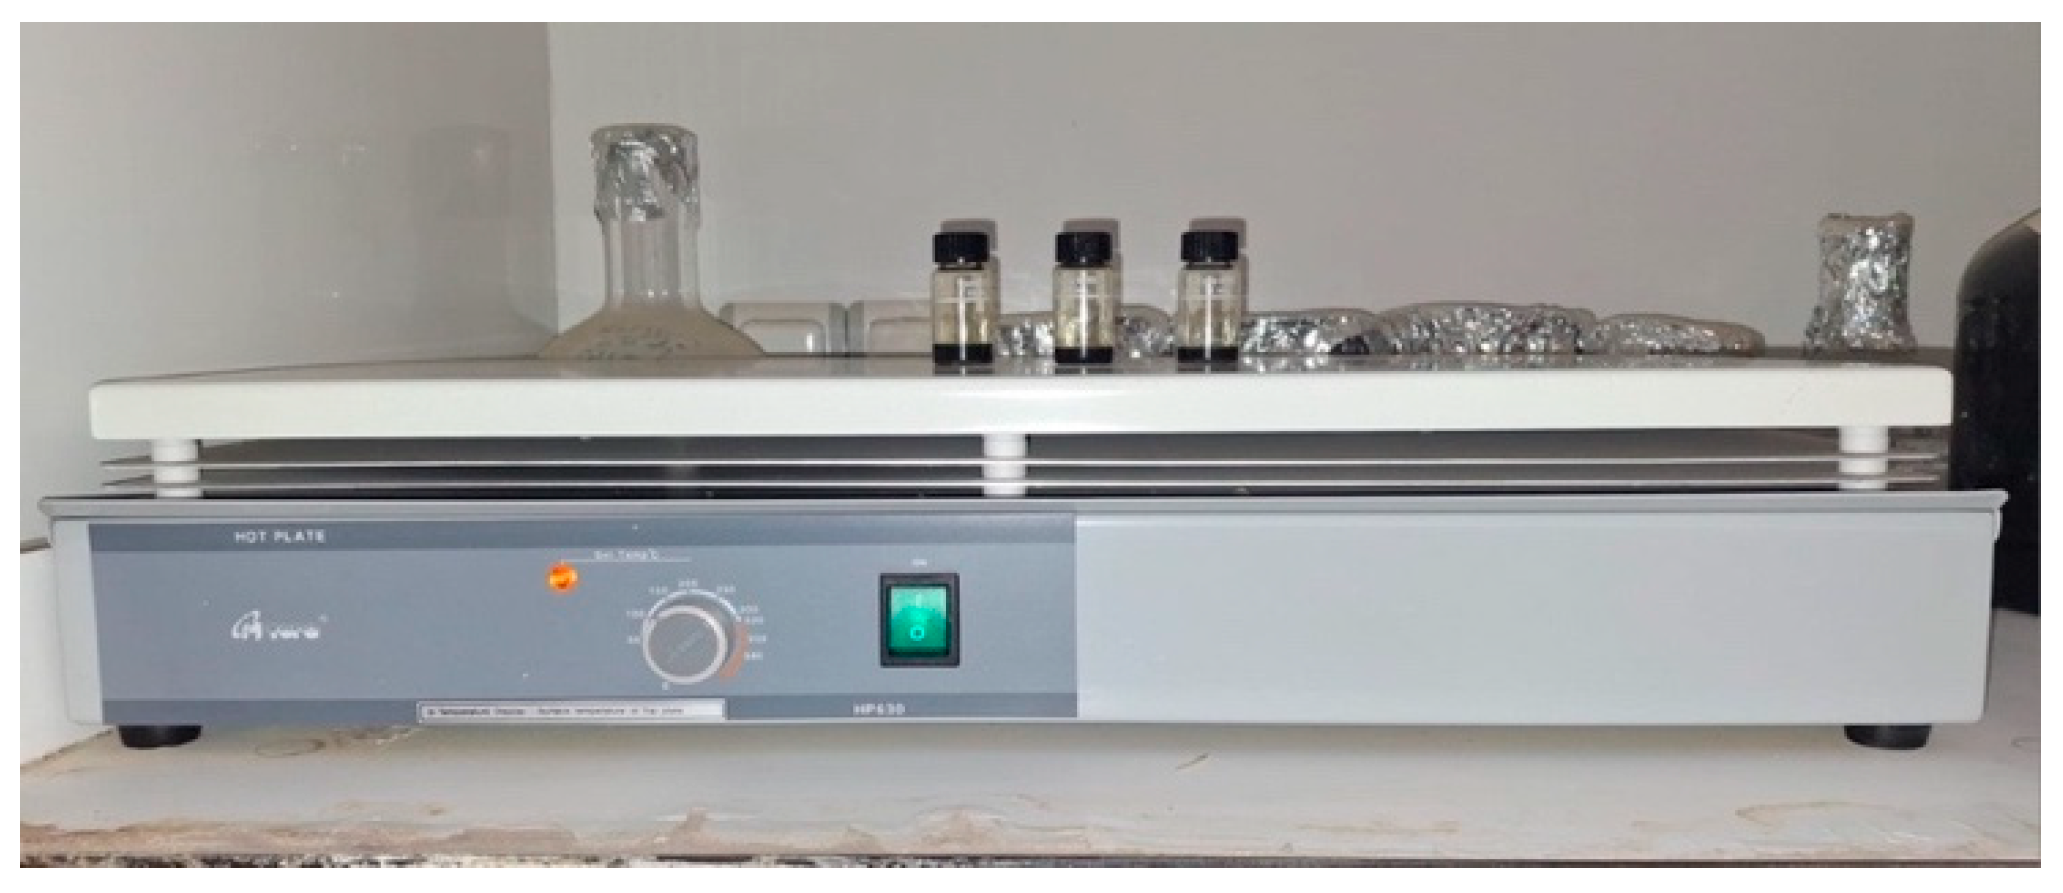
Engine temperature often increases during operation, which can affect sensor performance. This is a factor that needs to be taken into account when manufacturing sensors that can sensitively detect the resistance change. The sensor must respond even at very high temperatures that the motor can reach. In order to observe the effect of temperature on the resistance change, unused oil samples of the same species and oil samples used for 30 h were heated to 3 different temperature values (70, 80, and 90 °C) (Figure 3) controlled by a thermometer. Then, 0.5 mL aliquots of these heated oil samples were added to the sensor surface and resistance values were measured.

2.7. Classification and Modelling with Artificial Intelligence

In the experimental phase, data obtained from 3 different oil types and oils with different contamination rates (due to different usage hours) were input into the MLP and LVQ artificial intelligence architectures and network training was performed. During network training, 75% of the data obtained in the measurement were allocated to training and 25% to testing. With artificial intelligence, pollution was detected more clearly by rapid interpretation and classification of instantaneous data, and the lubricating oils will be changed at clearer times.

2.8. Multilayer Perceptron (MLP) Structure

MLP is one of the most basic and common forms of an artificial neural network. It is a feedforward neural network used in supervised learning. It consists of an input layer, one or more hidden layers, and an output layer. Each layer processes the information from the previous layer and passes it on to the next layer. Usually, softmax or sigmoid is used for classification, and linear activation is used for regression. This network structure works because in forward propagation, the inputs are multiplied and summed with weights and biases, passed through activation functions, and reach the output layer. The difference between the model’s output and the actual value is calculated with the loss function. The error calculated by backpropagation is propagated back by chained derivative rules, and the weights are updated. The equation for the MLP is shown in Equation (1) [32].
a(l) = f(l)(W(l)a(l−1) + b(l))
Here, x is the input vector; W(l) is the weight matrix of the l-th layer; b(l) is the bias vector; f(l) is the activation function. The MLP structure (Figure 4), an artificial neural network architecture, was created using the Matlab–nntool interface. The MLP and LVQ algorithms took as input the resistance values measured in two different oil types (diesel, bench oil) and between 5 and 30 h of use. Depending on their degradation levels, they classified the oils as ‘diesel’ or ‘bench oil’ with 99.77% and 100% accuracy. In this neural network, 75% of the dataset was used for training and 25% for testing (data were randomly selected). The Levenberg–Marquardt method was used to classify and model the MLP structure. The (Train LM) adaptation learning function was used. Tansig was defined as the transfer function, and the mean squared error was defined as the performance function. The number of epochs was set to 1000, and an early stopping method was applied to prevent overfitting.

2.9. Linear Vector Quantisation (LVQ) Structure

LVQ is a prototype-based supervised learning algorithm explicitly used in classification problems. The basic idea is to determine one or more prototype vectors representing each class. When new data arrive, they are assigned to the class to which the closest prototype belongs. Prototype-based classification is included in this study because it provides fast and high accuracy in limited datasets. When the learning function is LEARNLV1, the learning rate is 0.01. The LVQ structure (Figure 5), which is an artificial neural network architecture, was created using the Matlab–nntool interface.

2.10. Statistical Analysis

In order to determine whether the mean and standard deviation results obtained in the experiments were statistically significant, a t-test and one-way analysis of variance (ANOVA) were applied at a 95% confidence level. A t-test was used to compare the means between two groups, and the statistical significance of the mean differences between the groups was evaluated. In comparisons involving three or more groups, one-way analysis of variance (one-way ANOVA) was performed to examine whether there was a statistically significant difference between group means. The relevant differences were considered statistically significant when the p-values obtained from these analyses were less than 0.05. In addition, Cohen’s d values (effect sizes) and η2 values for differences between group means were calculated.

2.11. Interface Design

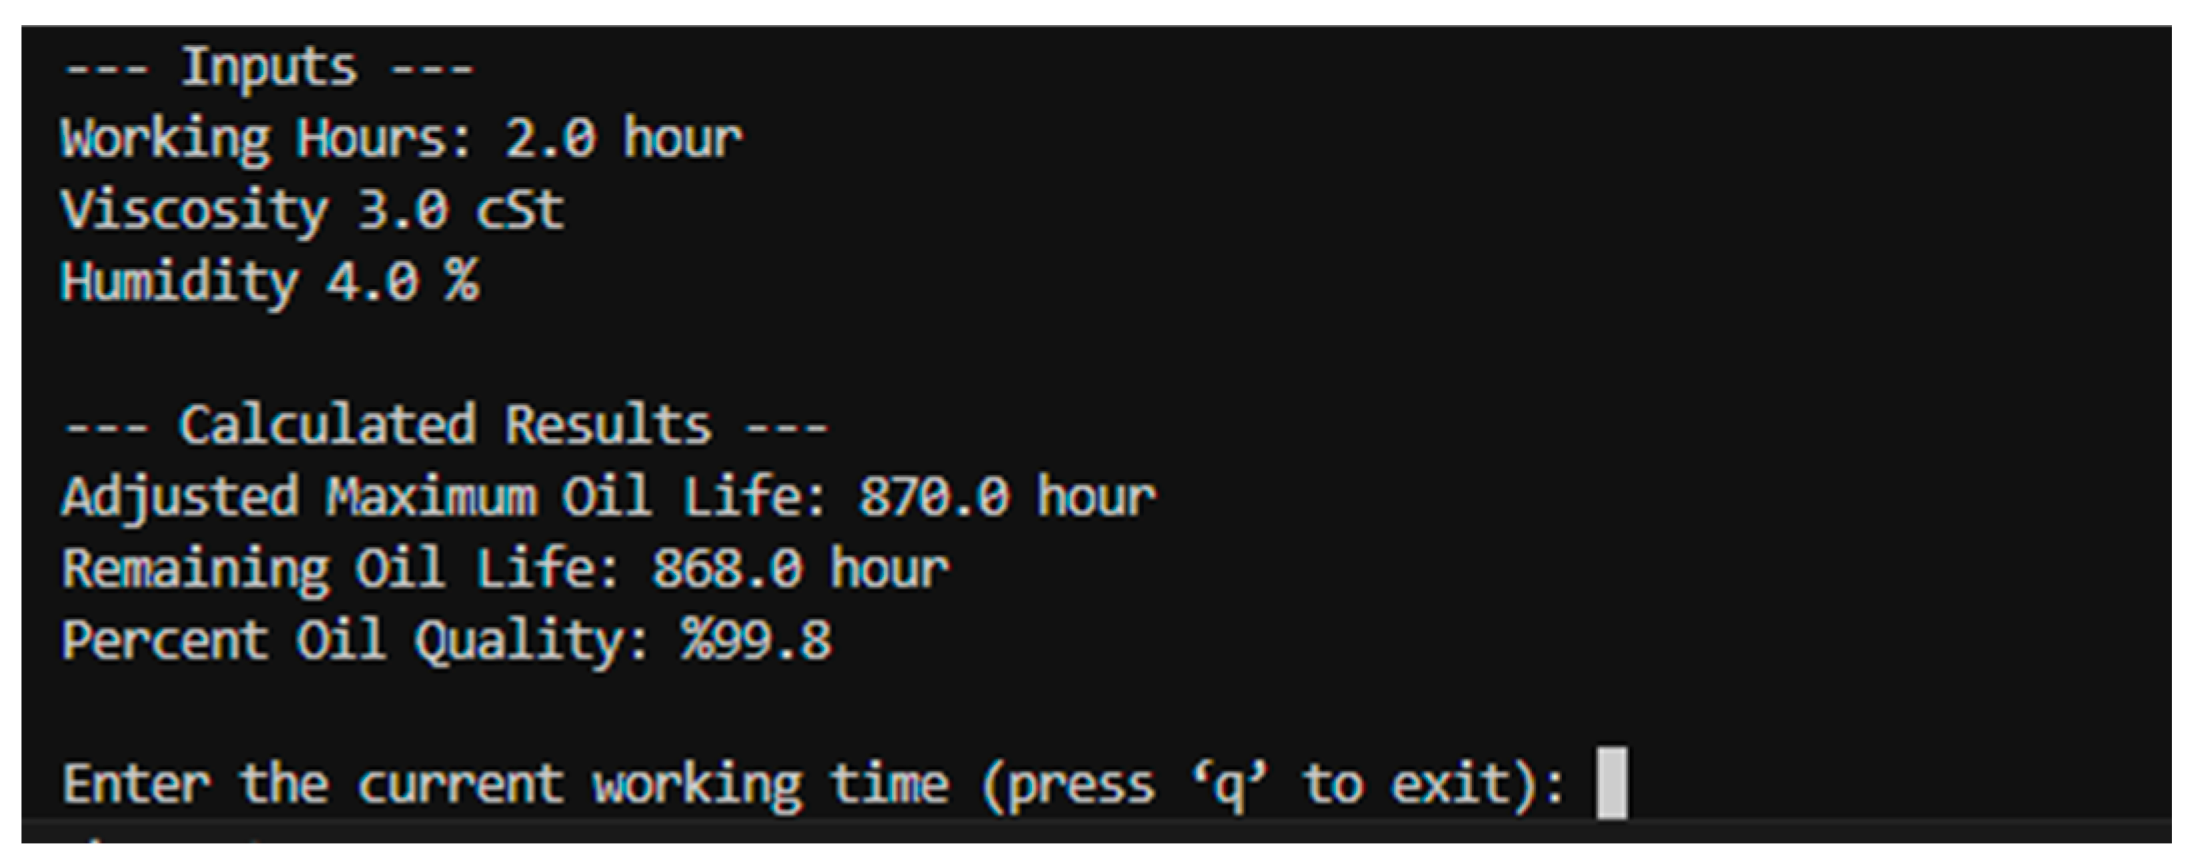
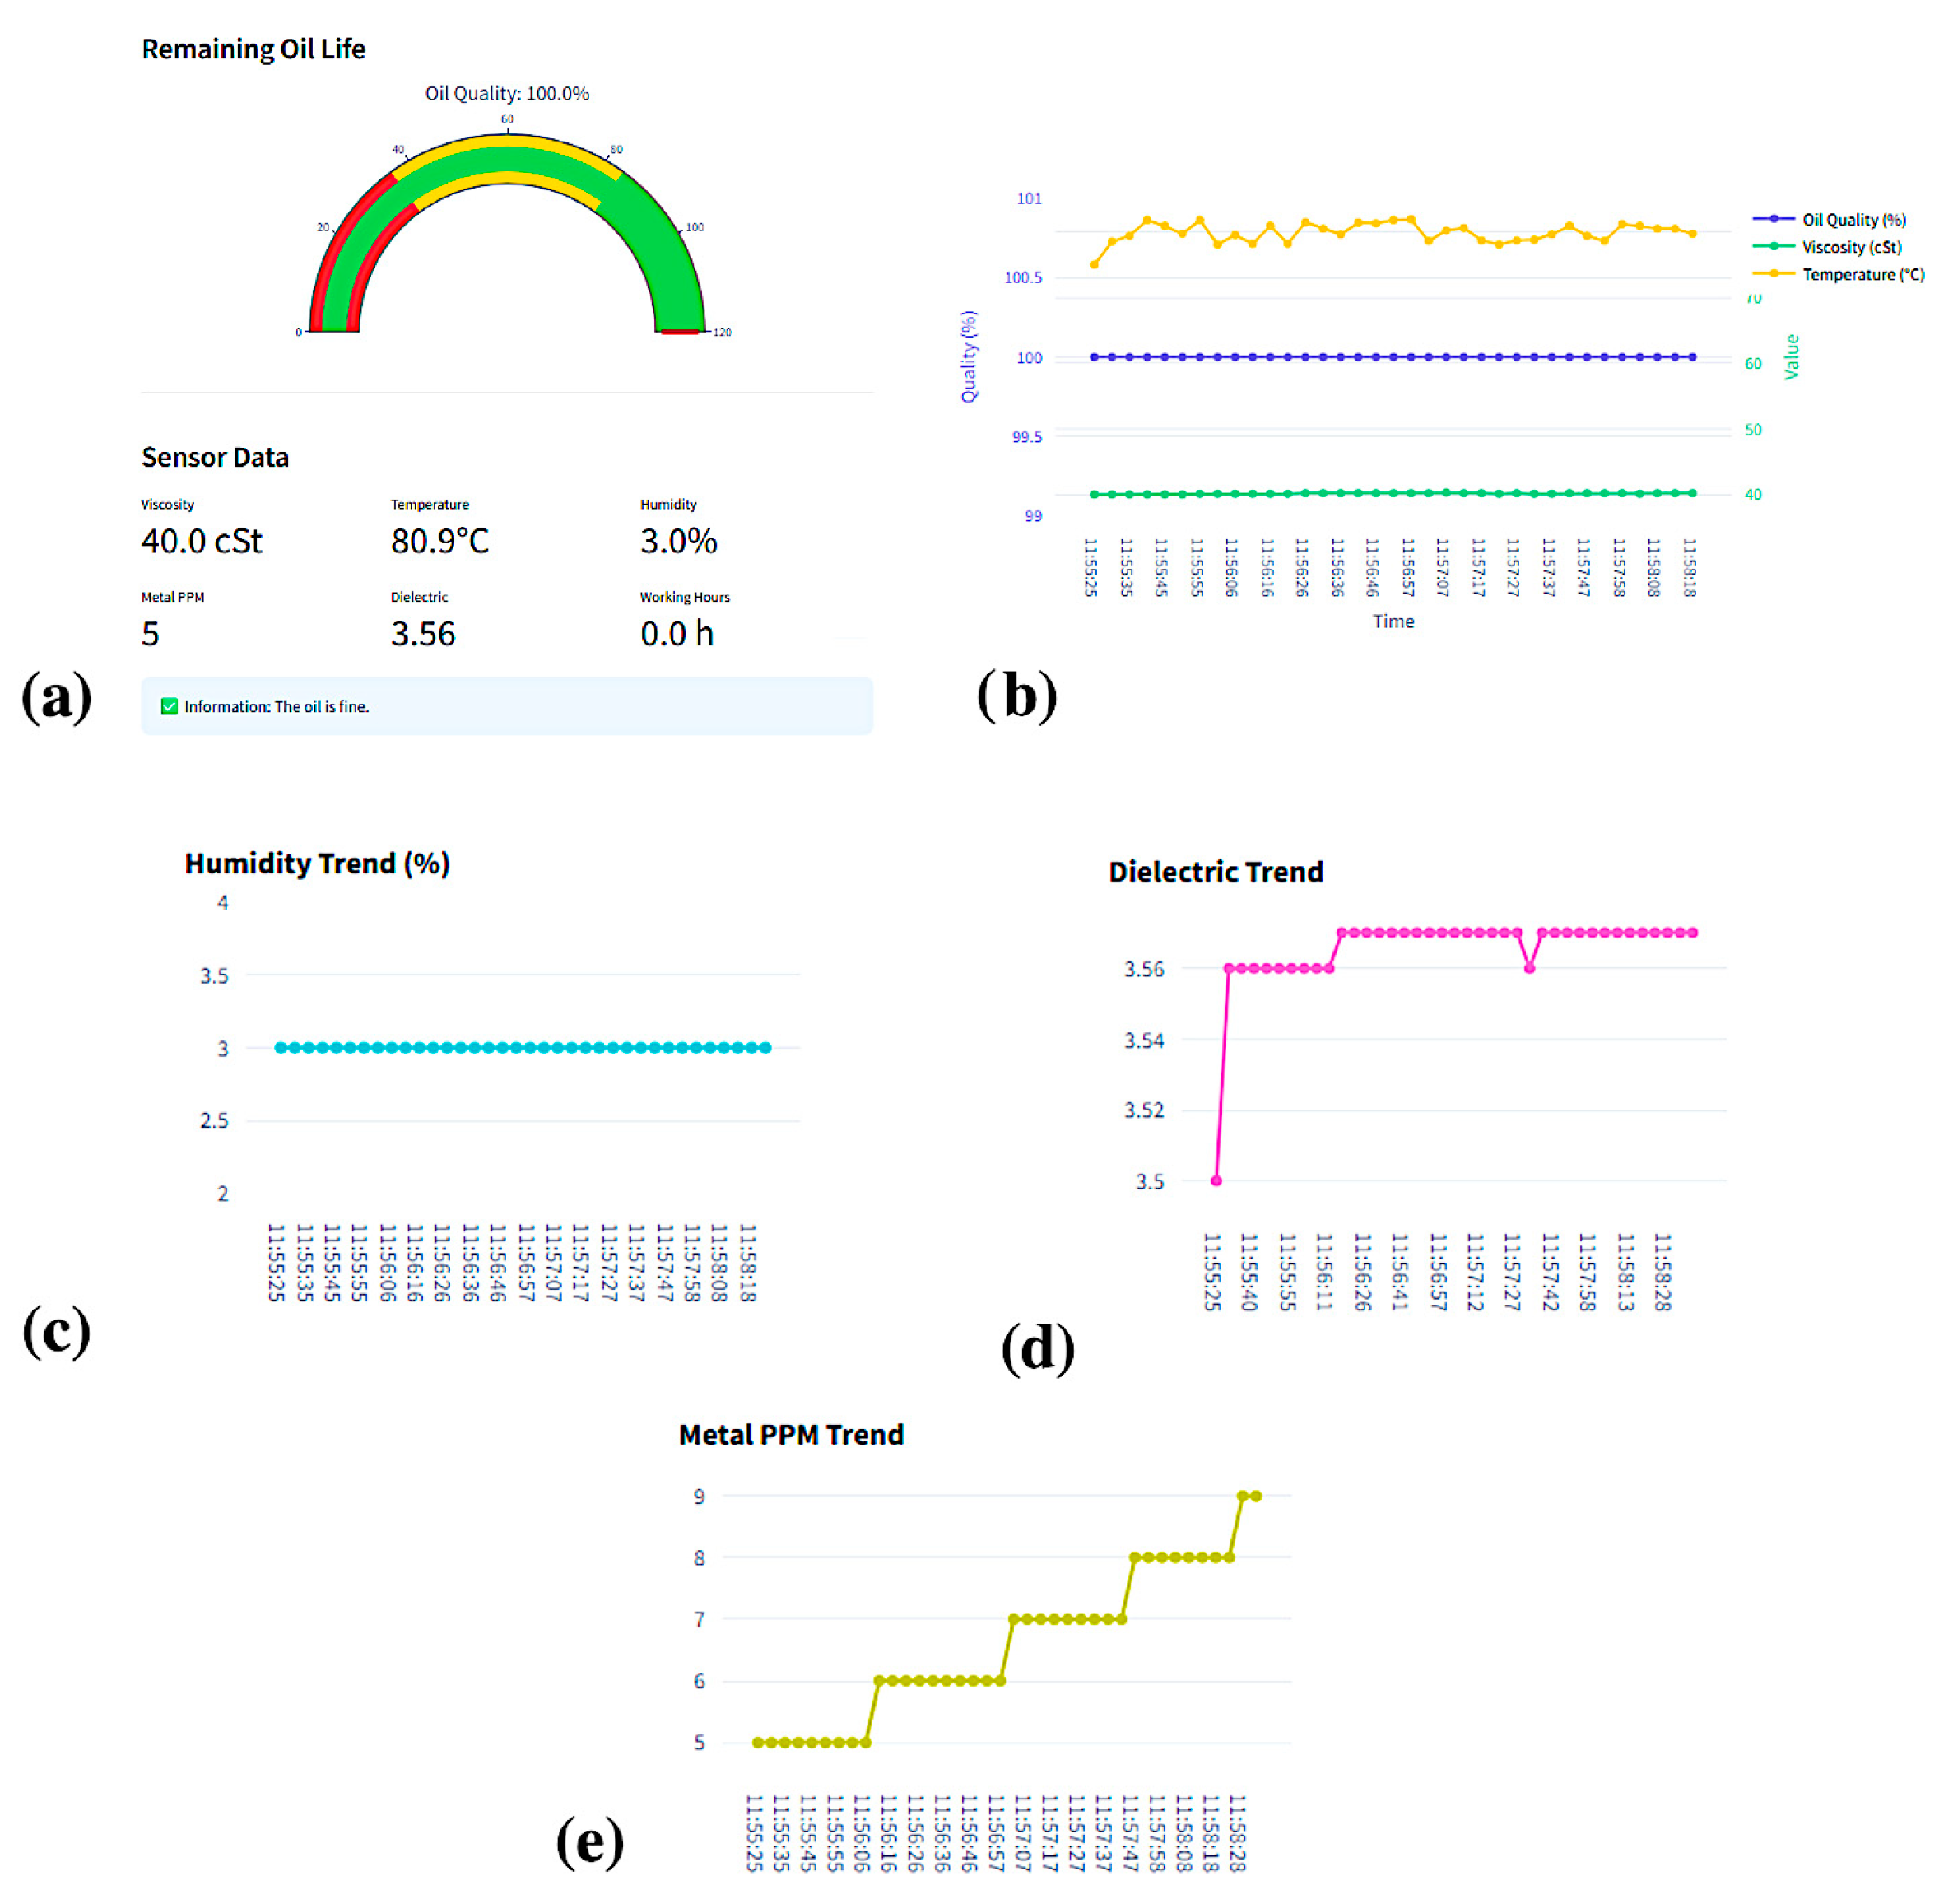
In the study, an interface was created to display the instantaneous changes of the parameters in the oil detected by the sensor. Operating hours (current operating hours of the machine), viscosity (current viscosity value of the oil (cSt)), and moisture (current moisture content of the oil (%)) are given as input to the system. In contrast, the set maximum oil life, remaining oil life, and oil quality (in %) are received as system output and displayed on the screen (Figure 6).

3. Results

3.1. Resistance and Impedance Changes

Timely and correct replacement of lubricants is a critical requirement not only to extend the life of machine equipment but also to prevent economic losses and environmental damage. Oxidation, polymerization, thermal degradation, and degradation of additives occur during oil use. Regarding the overall effect, C-H and C-C bonds are replaced by polar groups such as C=O and C-O. As oil molecules become polarised and larger, the physical and chemical properties of the oil deteriorate. This leads to problems such as increased consumption, oil starvation, and accumulation of sludge in the engine.
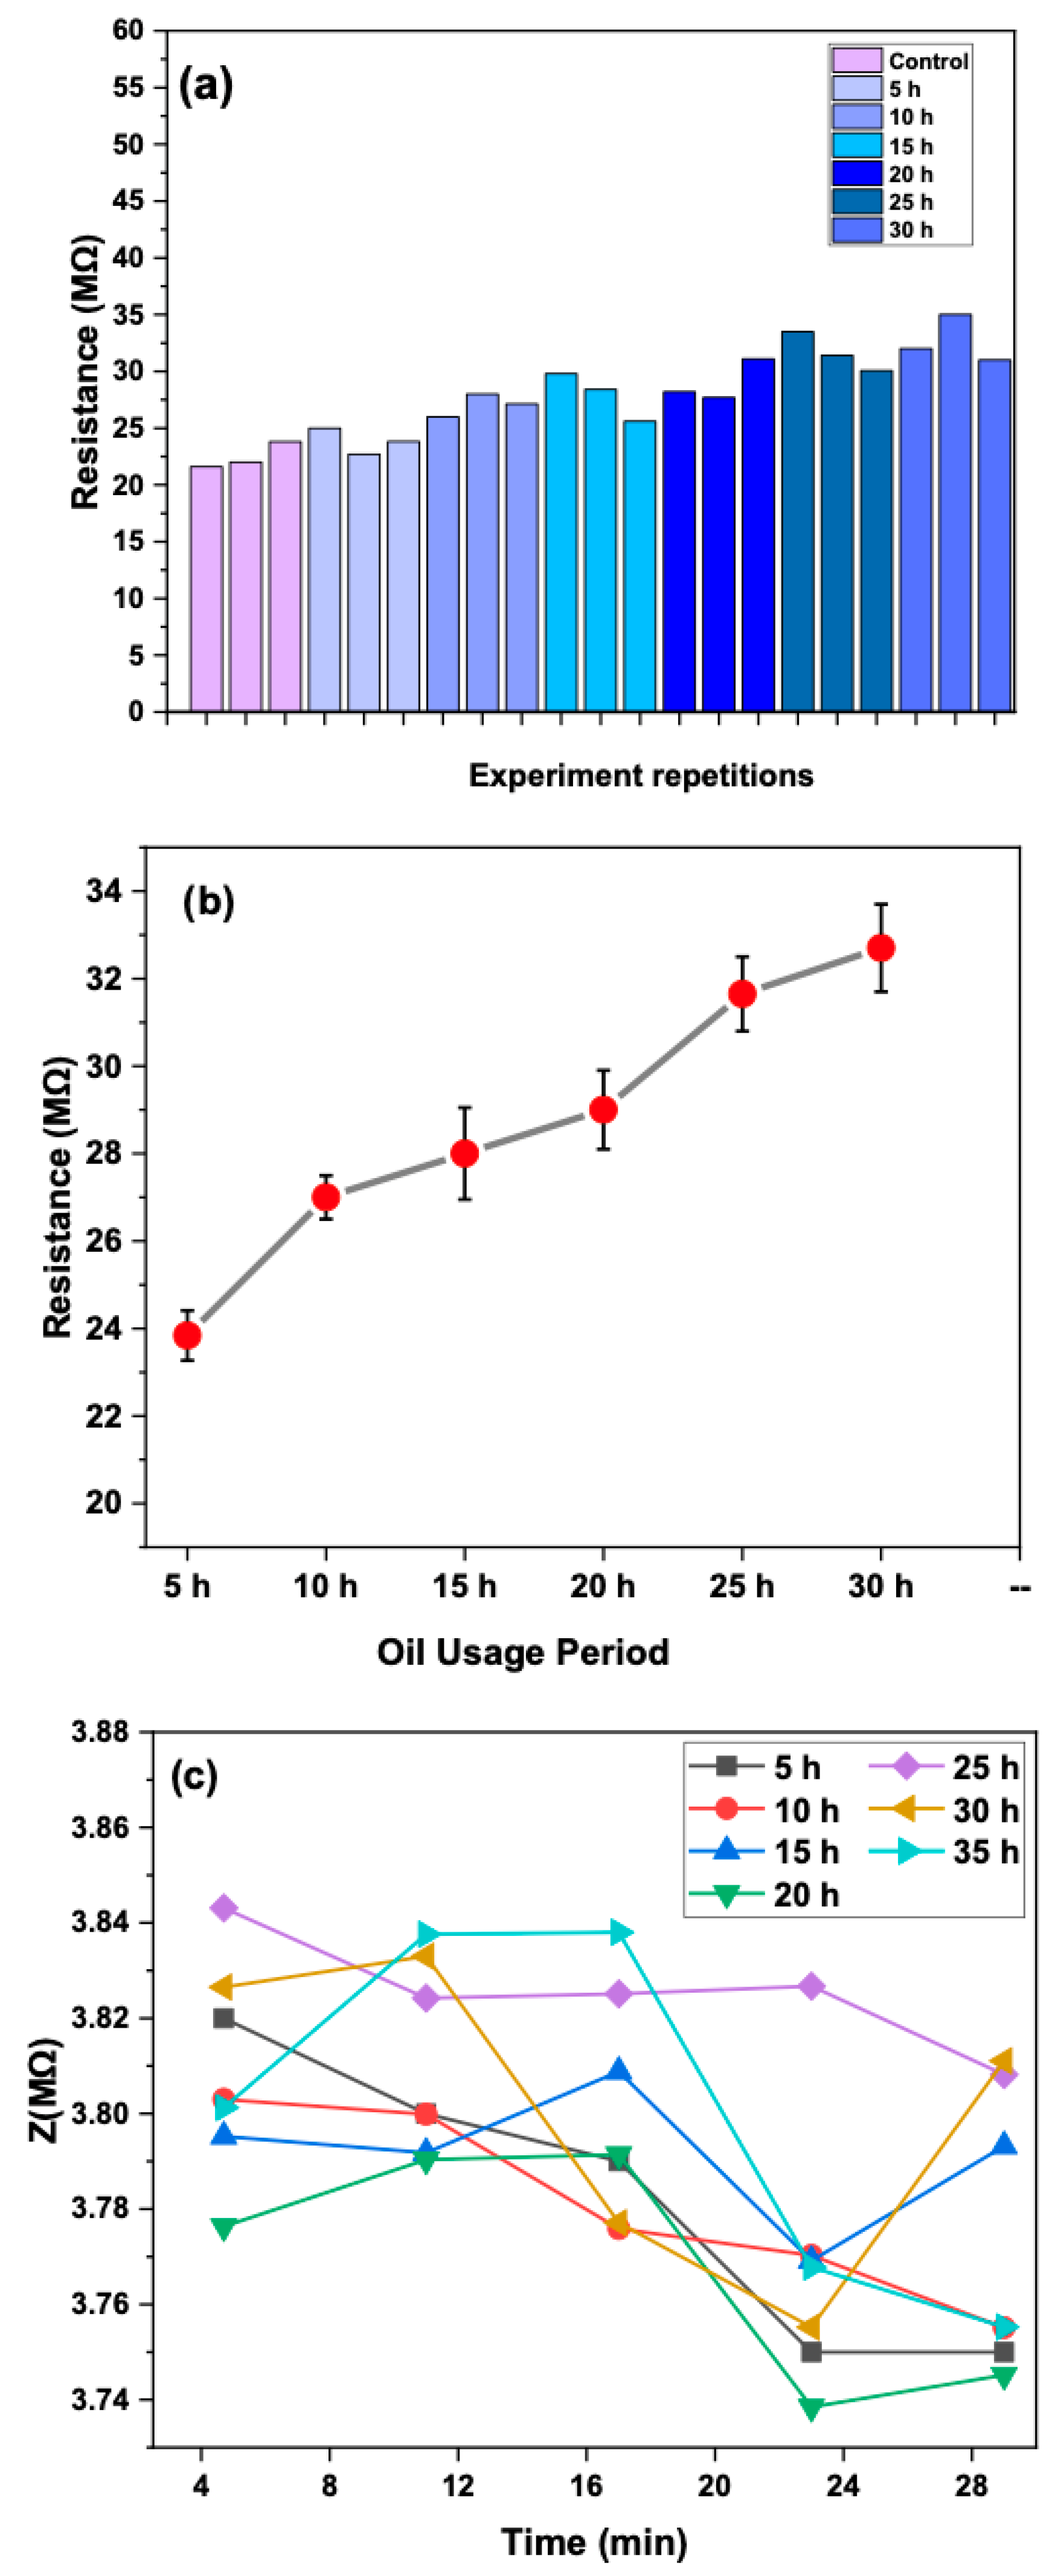
Resistance measurements performed in triplicate for the control group and the oils taken after every 5 h of use are shown in Figure 7a. While the average resistance change in the control group was 22.5 MΩ, this value tended to increase to 32.7 MΩ after 30 h of use. Figure 7b shows the resistance changes due to oil use over 5–30 h. These values are 23.84 ± 0.57 MΩ, 27 ± 0.5 MΩ, 28 ± 1.05 MΩ, 29 ± 0.9 MΩ, 31.65 ± 0.85 MΩ, and 32.7 ± 1 MΩ, respectively. The relatively small standard deviations indicate that repeated measurements yield consistent results. In oil samples with different usage times, -CH groups start to multiply [33,34,35]. A special type of weak hydrogen bonding occurs between the -OH groups in the sensor and the -CH groups of the fat molecules. The interaction between the sensor surface and the oil molecules results in a resistance change. The chains in lubricants, which are hydrocarbons with long carbon chains, are broken due to heating and slipping during long operating times of the machines. Oxygen atoms are captured, and reactive ends are formed due to the fracture. Oxygen-containing groups, such as hydroxyl, are formed in the oil structure. When oil samples are dripped onto the prepared sensors, the interactions between the hydroxyl group and the prepared sensor structure result in resistance changes. The change in resistance varies according to the amount of oil contamination (Figure 7a,b). Looking at the impedance change graph, although a stable curve could not be observed in the measurements taken at different times, impedance values tended to decrease. These results are also supported by the fact that high resistance and low capacitance values can be observed in oil-based biosensors or low conductors (Figure 7c).

3.2. Comparison Between Oil Types

The resistance changes over time in diesel and bench oil were measured, and a comparative graph was plotted. The resistance values measured in the 5–30 h interval in diesel are 23.84 ± 0.57 MΩ, 27 ± 0.5 MΩ, 28 ± 1.05 MΩ, 29 ± 0.9 MΩ, 31.65 ± 0.85 MΩ, and 32.7 ± 1 MΩ, respectively, while these values in bench oil are 19.44 ± 0.06 MΩ, 22 ± 0.8 MΩ, 26 ± 0.5 MΩ, 28 ± 0.2 MΩ, 30 ± 0.2 MΩ, and 31.3 ± 0.3 MΩ, respectively (Figure 8). The graph shows an increase in resistance over time, both in the diesel oil and the benchmark oil. This increase represents the changes in the physicochemical properties of the oils during operation. The value of the measured parameter is notably higher in diesel oil. The difference between the two oil values is particularly pronounced at points 3, 6, and 9. This clearly indicates that diesel oil degrades more rapidly under operating conditions or is subject to more intense contamination conditions [36,37]. Furthermore, the increase in values over time for both oils suggests that the oils exhibit similar ageing trends, but diesel oil has a higher turnover rate. This suggests that diesel oils require more frequent monitoring for performance and lifespan assessments, and that sensor-based real-time monitoring systems are particularly critical for diesel engines.

3.3. FTIR Analysis

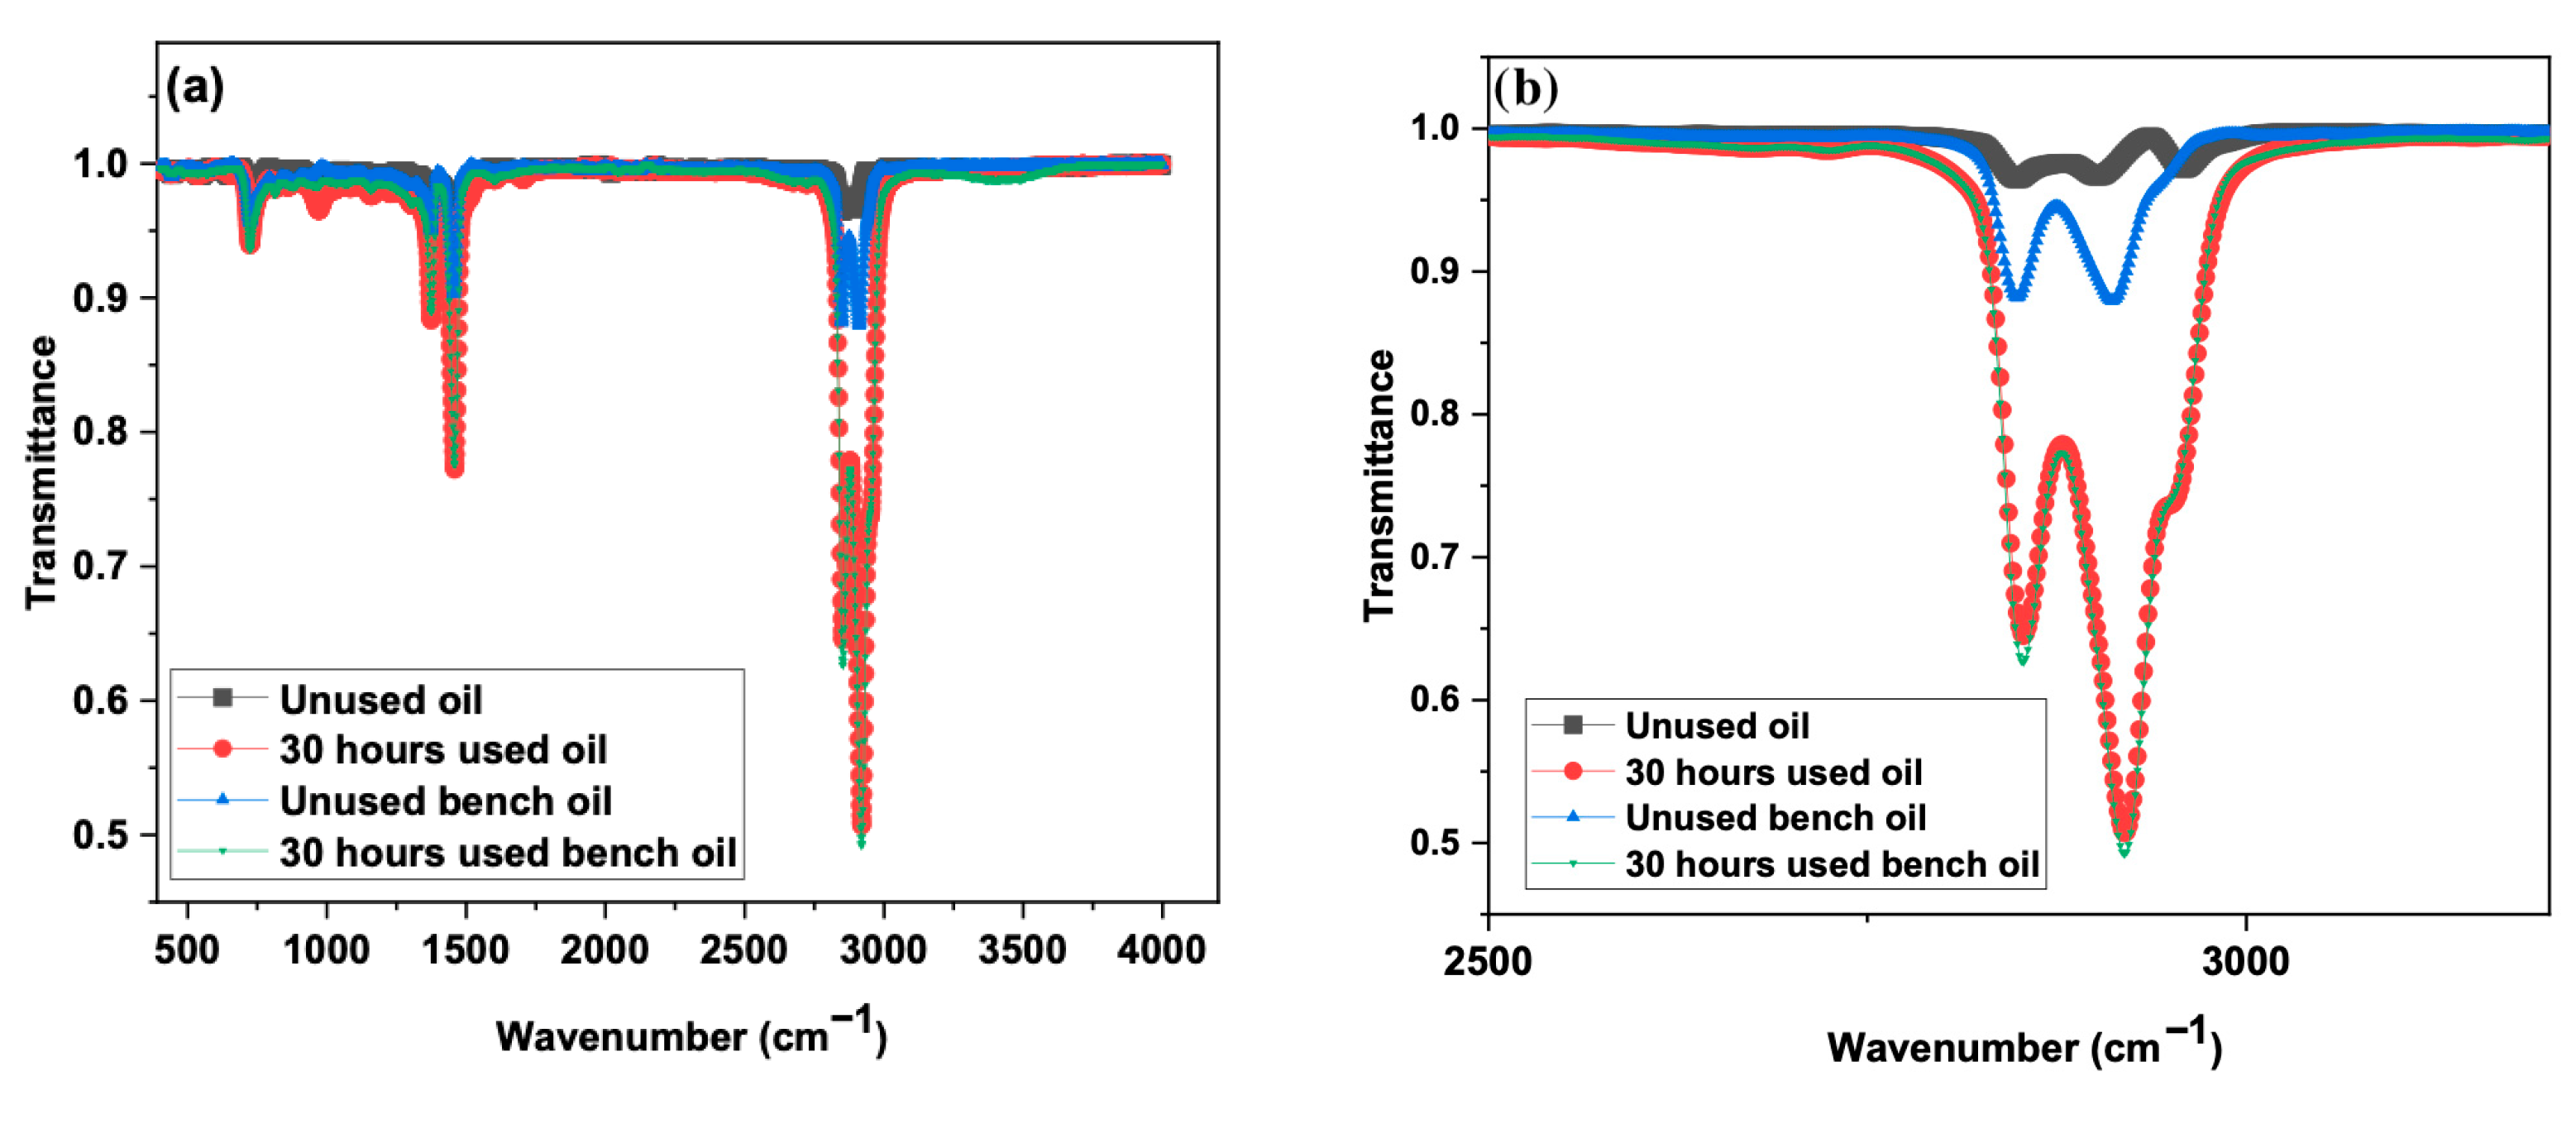
FTIR analysis helps determine when oil needs to be changed and to monitor machine health. Analyses were performed in the wavelength range of 400–4000 cm−1 [33,38]. The FTIR spectra shown in Figure 9 reflect changes in the chemical composition of the oil samples. First, measurements were taken in the 400–4000 cm−1 wavelength range (Figure 9a), followed by measurements in the 2800–3000 cm−1 wavelength range, where intense peaks were observed (Figure 9b).
In general, the spectra of all samples are quite similar, indicating that the basic chemical structures of the oils are the same. The peak at about 1740 cm−1, C=O, usually belongs to carbonyl-containing compounds such as esters, aldehydes, or carboxylic acids. The spectra show clear decreases and shifts in certain wavenumbers, particularly in the 30 h used oil sample. This indicates that absorption increases, oxidative degradation occurs, and carbonyl compounds are formed in the used oil. A peak is generally observed around 1700 cm−1, representing the C=O group. An increase in peak intensity in this region is an indication of oxidation. Oxidation naturally develops as the oil ages or is used at higher temperatures. C-H stretching vibrations at 2800–3000 cm−1 are associated with alkane chains, a significant component of natural oils [33,39]. Similar patterns are observed in this region across all samples, but differences in peak intensity are evident. Peak intensity decreased in these regions during the degradation process. This decrease in intensity in used oils indicates the degradation of long-chain hydrocarbons. The CH3 and CH2 bending vibrations at 1460–1370 cm−1 represent the saturated hydrocarbon structures of the oil. A decrease in the signals in these regions after use indicates that some of the components of this oil have been degraded or the chains have shortened. The C-O stretching (ester bonds) at 1160–1000 cm−1 is an important area due to the ester structure of the oil [34,35]. After use, the change in this region indicates the breakdown of ester bonds by hydrolysis or oxidation. The blue and green spectra are close, but slight differences indicate that bench oil has a limited but significant effect.
When the results obtained from surface characterisation studies and resistance measurements are evaluated together, it is demonstrated that oils degrade over time, both at the macroscopic level (measured parameter increase) and at the microscopic/molecular level (FTIR spectrum). While the resistance change plots show that the physical properties of the oil change and that this change is directly related to the time of use, the FTIR spectra confirm that these changes correspond to modifications in the molecular structure, concentrated in specific IR absorption bands.
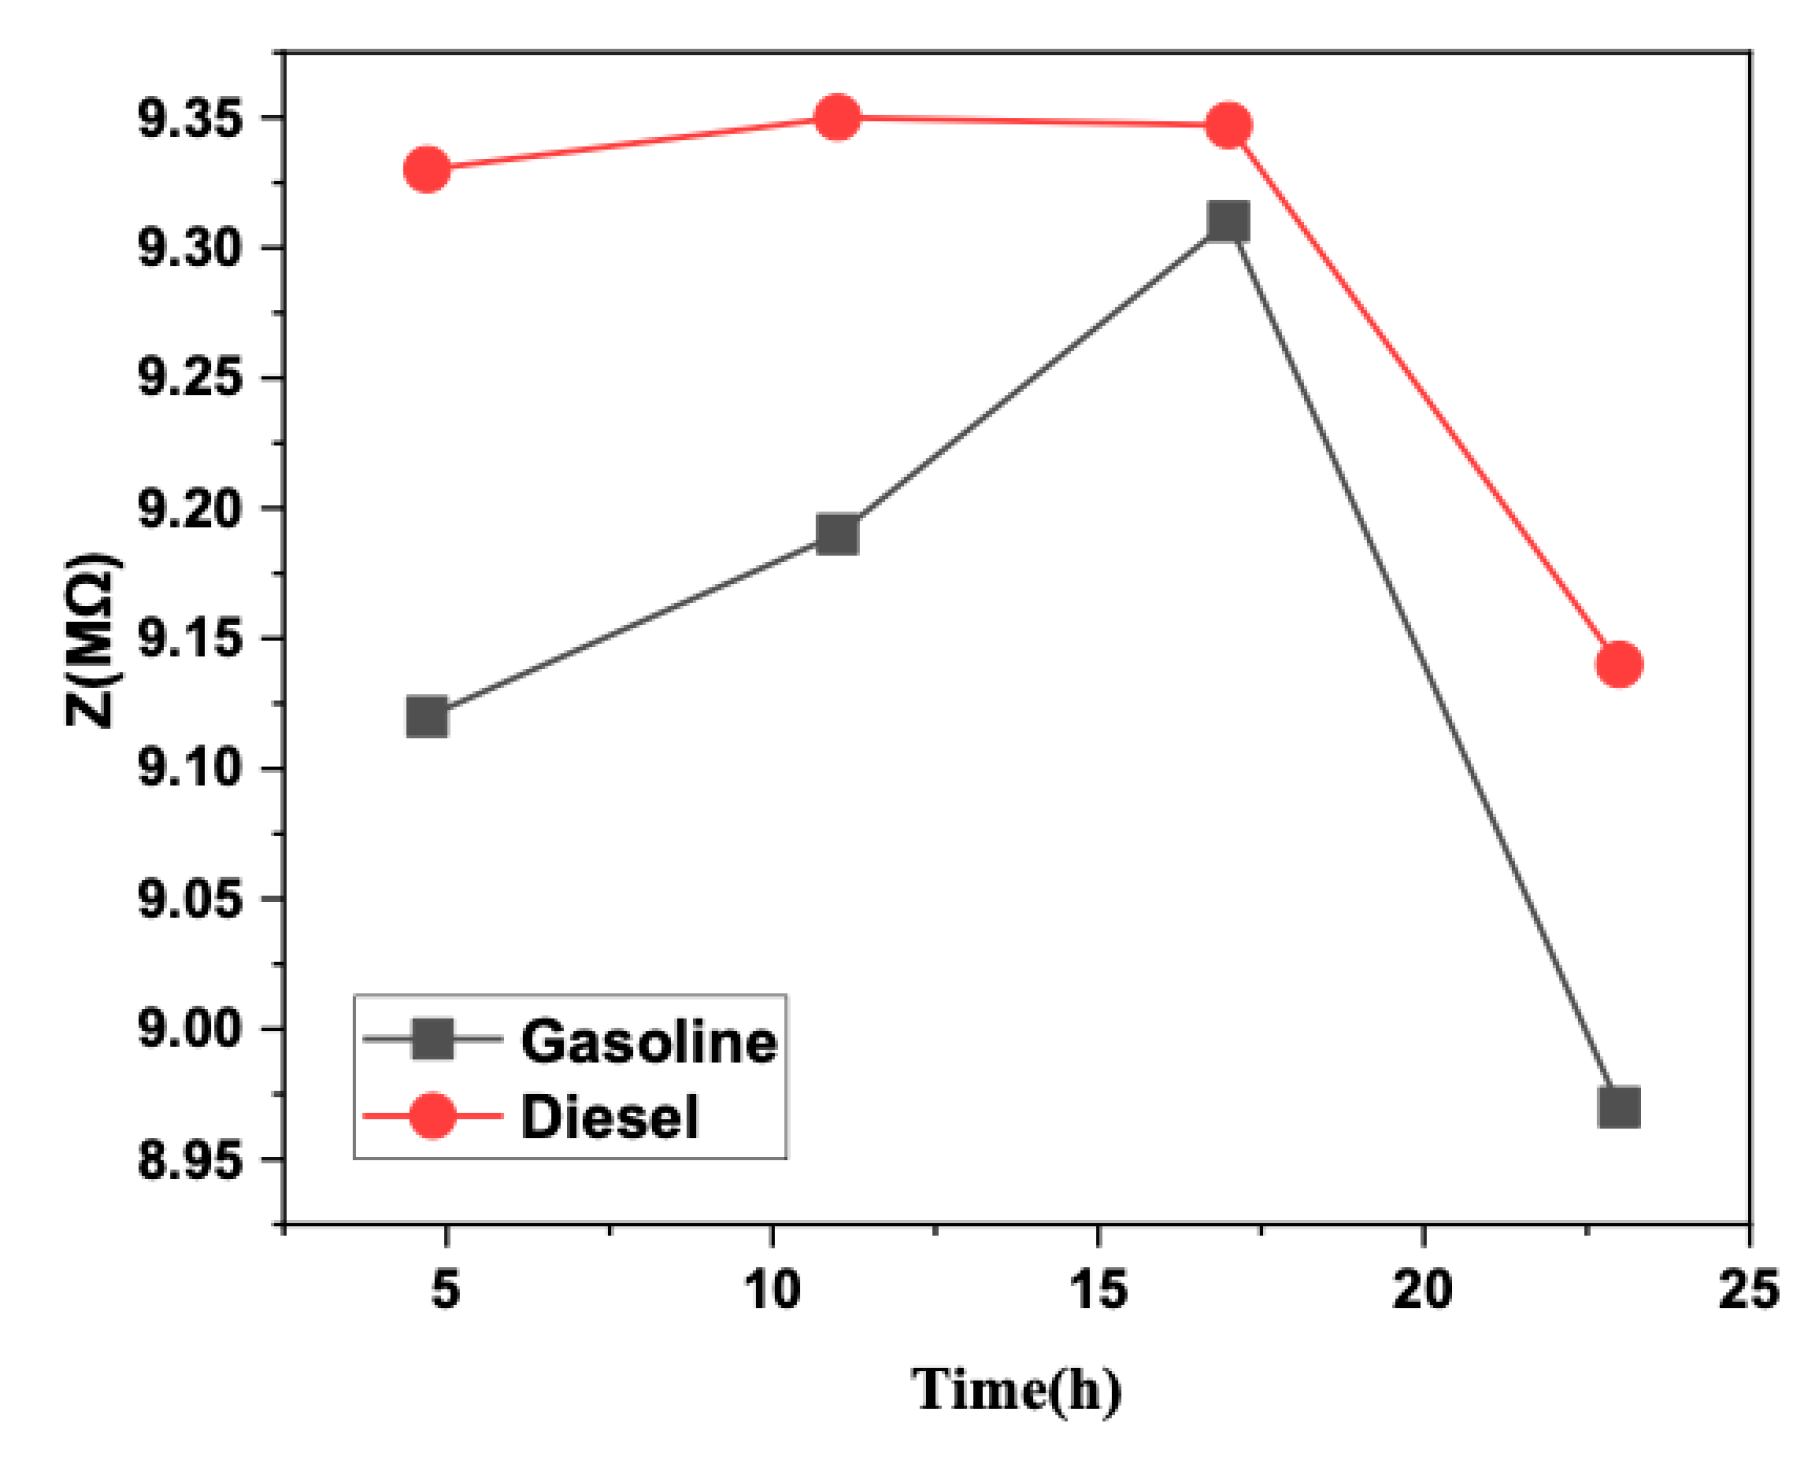
Figure 10 shows the results of the experiments performed on diesel, gasoline, and industrial oils to demonstrate that different oil types can be easily differentiated based on resistance measurement.
When the graph of impedance change depending on time for gasoline and diesel oil is examined, the impedance changes for gasoline for four different times are 9.12 MΩ, 9.19 MΩ, 9.31 MΩ, and 8.97 MΩ, respectively, while these values are 9.33 MΩ, 9.35 MΩ, 9.34 MΩ, and 9.14 MΩ, respectively, for diesel oil. The resistance values measured in the first hours are quite different, but there appears to be a convergence interval of approximately 17 h. Based on this, the ANN analysis suggested that the results should be supported.

3.4. Sensor Thickness Effect

To observe the effect of sensor thickness on the sensitivity of detecting resistance changes, resistance measurements were performed on virgin diesel oil and the most commonly used diesel oil (used for 30 h). The measurement results show that the resistance values measured for sensor thicknesses ranging from 0.1 to 0.4 cm in unused oil are 37.7 ± 0.8 MΩ, 34.3 ± 0.5 MΩ, 30.6 ± 0.6 MΩ, and 27 ± 1.25 MΩ, respectively. These values for diesel fuel used for 30 h are 40.05 ± 0.1 MΩ, 36.4 ± 0.3 MΩ, 32.04 ± 1.25 MΩ, and 28 ± 0.6 MΩ, respectively (Figure 11). For both cases, it is observed that the sensitivity in detecting resistance changes decreases as the thickness increases.
The effect of this geometric pattern on detection performance has changed, and a 0.1 cm gap has been determined as the optimum value. In thicker layers, signal visibility is significantly weakened due to the electrical conduction path change and the active surface and volume separation. Experimental data show that sensitivity decreases by approximately 30% in sensors with a thickness of 0.4 cm. Similarly, a 10% decrease was observed in sensors with a thickness of 0.2 cm compared to reference products. This suggests that the increased ion/electron transport is limited, extending the reaction time and reducing signal amplitude. Therefore, the 0.1 cm gap was chosen due to its optimum signal-to-noise ratio and fast response time. Experimental studies were conducted with sensors produced at this thickness.

3.5. Temperature Effect

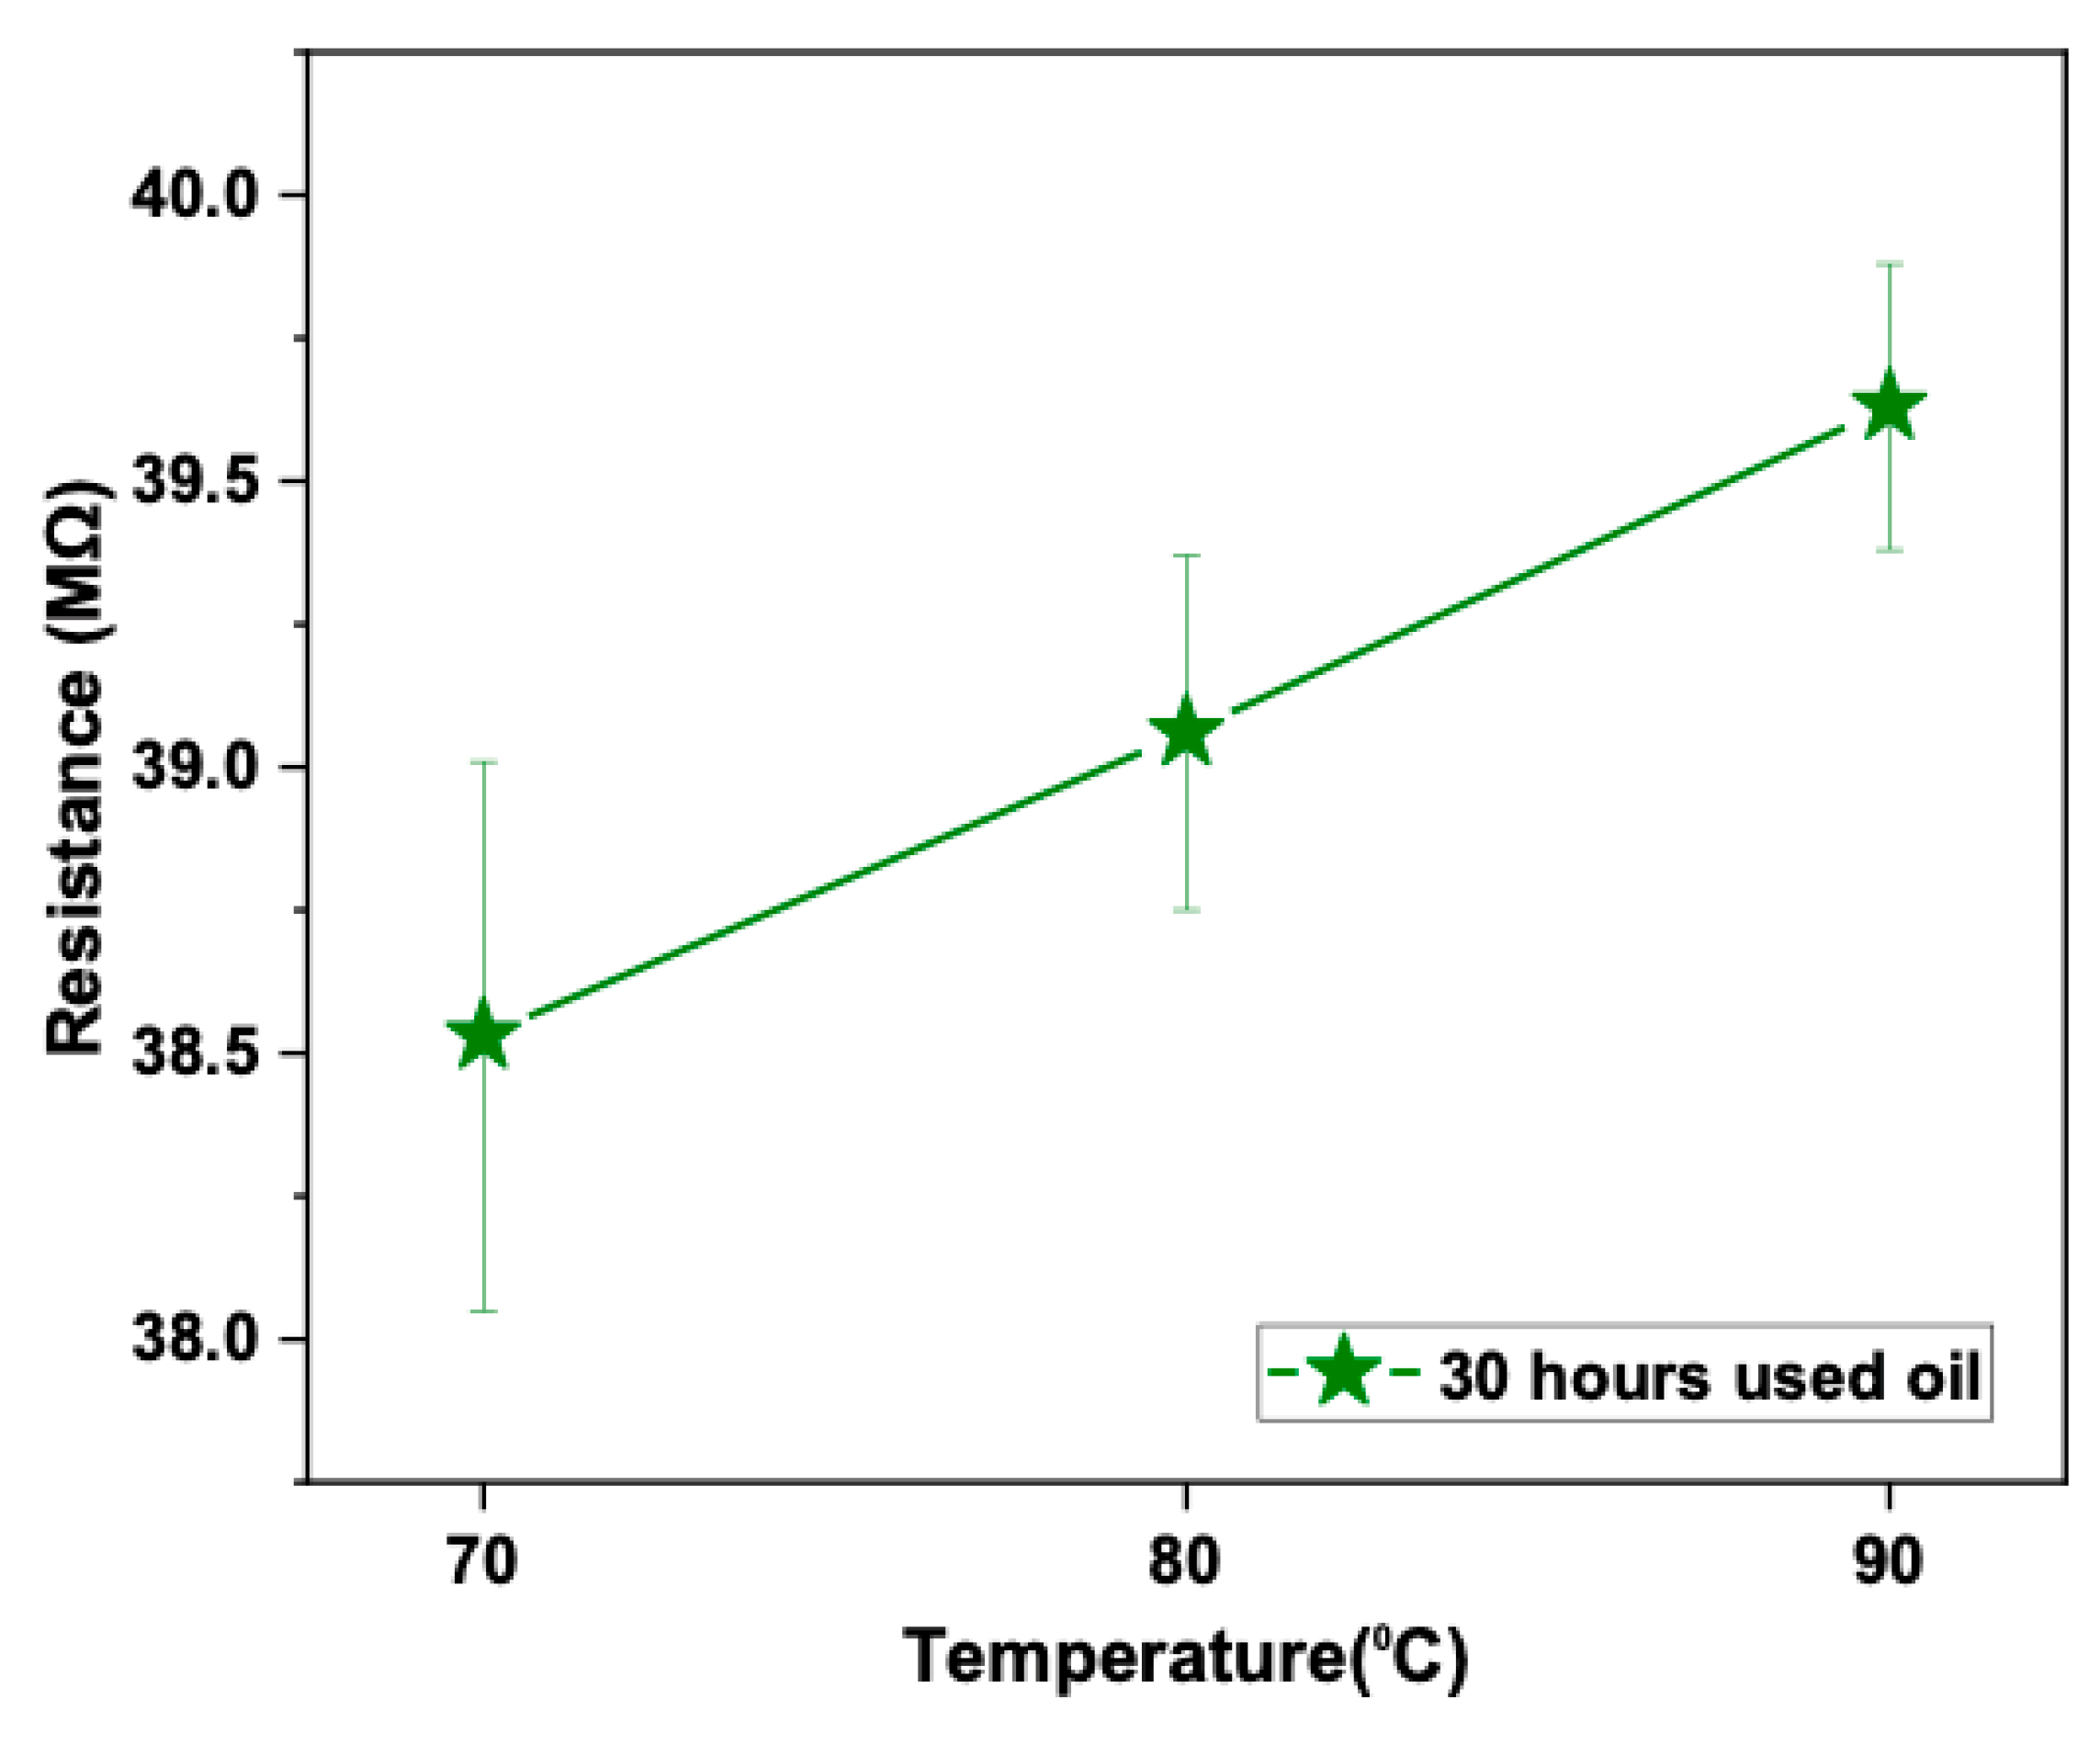
The effect of temperature changes on the resistance change in the sensor was tested (Figure 12). The graph shows that increasing temperature raises the resistance values in used oils, and this change can serve as an indicator of oil ageing or degradation. The results obtained show that the resistivity values increase steadily with increasing temperature. This is an indication of temperature-dependent changes in the dielectric properties of the oil. Such resistivity measurements provide a potential early warning tool for oil condition monitoring and timely replacement decisions. Hydrogen bonds weaken as the temperature increases. This is particularly important for structures that form weak hydrogen bonds with -OH groups [40]. The increase in -CH groups in used oils increases the number of weak hydrogen bonds with -OH groups. These bonds cause interaction between the solid electrolyte structure and the oil molecules. High temperature reduces oil viscosity and increases molecular mobility. However, factors such as oxidation, degradation of additives, combustion by-products, and pollutant accumulation that may occur in the oil used lead to deterioration of its electrical properties, resulting in a change in resistance [41,42,43,44]. Oxidative degradation products formed in the oil during use can increase electrical resistance. In solid electrolytes, temperature increase may cause a transition from crystalline to amorphous structure. This transition lowers impedance by increasing ion mobility. For example, in polymer-based electrolytes, the number of amorphous regions increases with increasing temperature, which increases ionic conductivity [45].
It is known in the literature that the degradation rate of lubricating oils is significantly affected by environmental conditions. One study reported that high temperatures accelerate oxidation kinetics, leading to changes in viscosity and the accumulation of polar compounds [42]. The biopolymer-based sensor developed in this study provided measurable responses to changes in temperature and humidity; rapid changes were recorded in resistance and impedance measurements, particularly at high temperatures. Increased humidity levels affected the sensor’s dielectric properties, leading to a decrease in measurement sensitivity. These findings demonstrate that the sensor is sensitive to environmental parameters and that these effects should be managed with calibration or compensation algorithms in field applications.

3.6. Artificial Intelligence Model Results

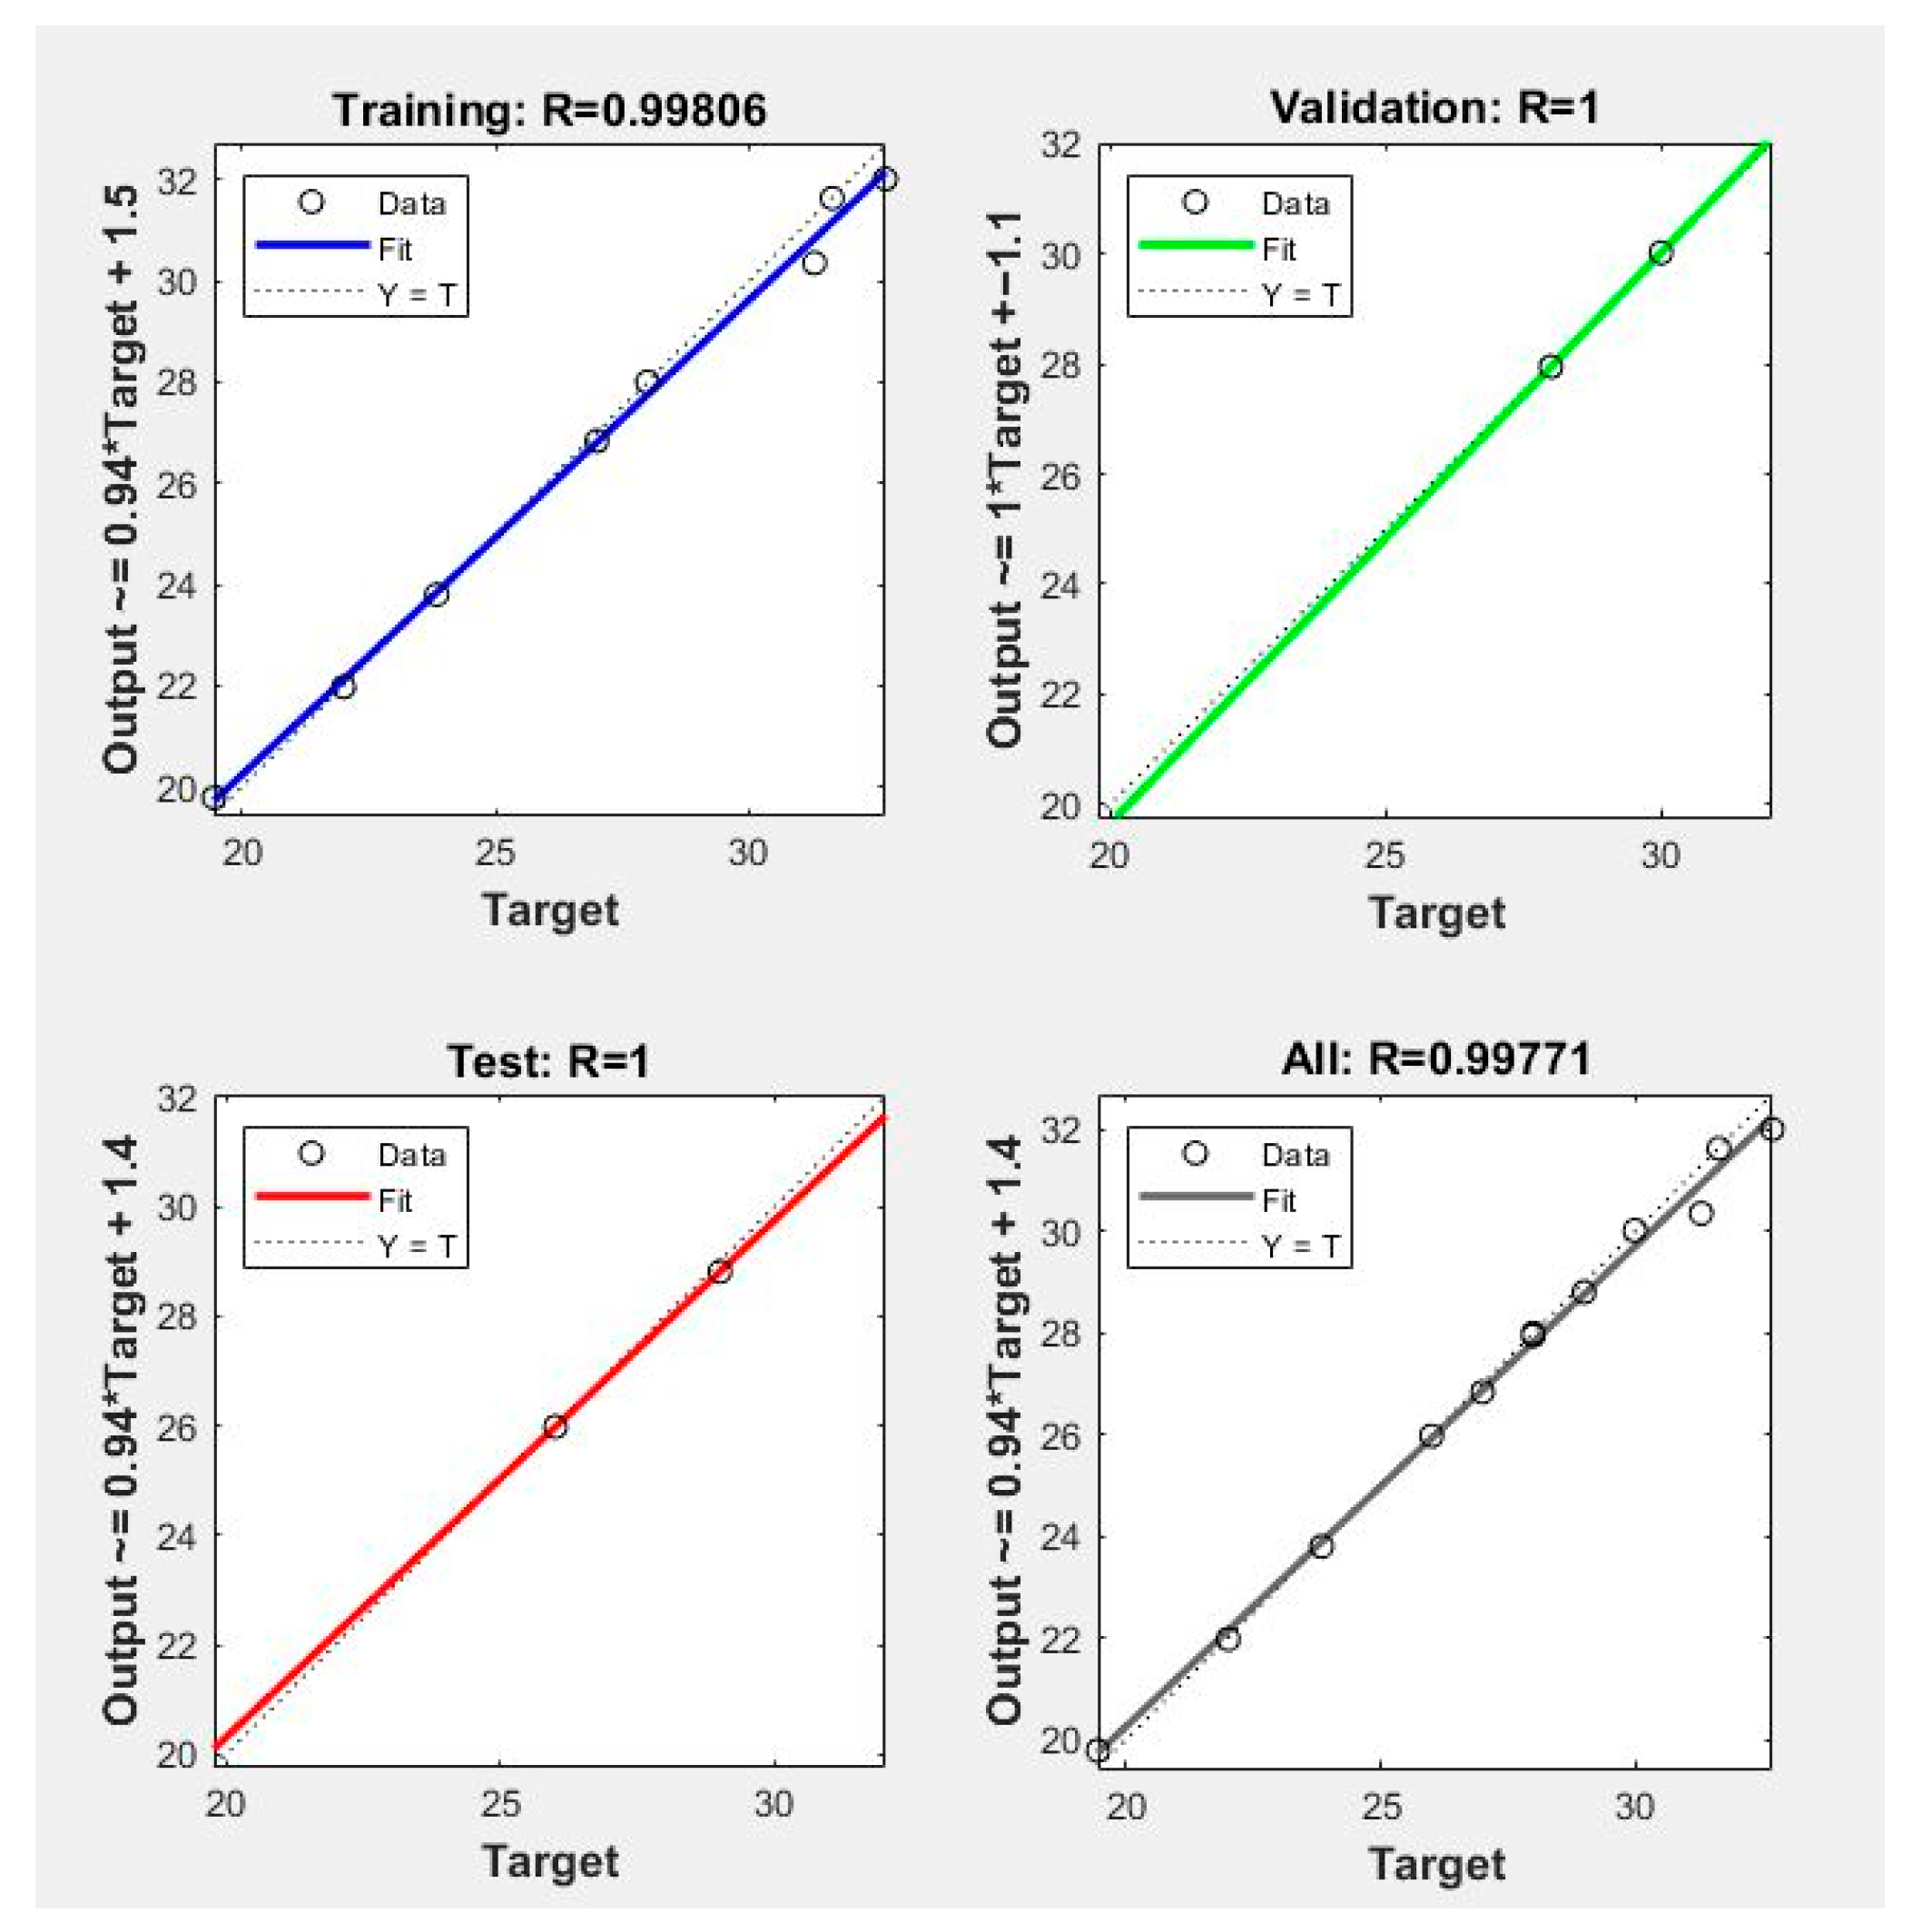
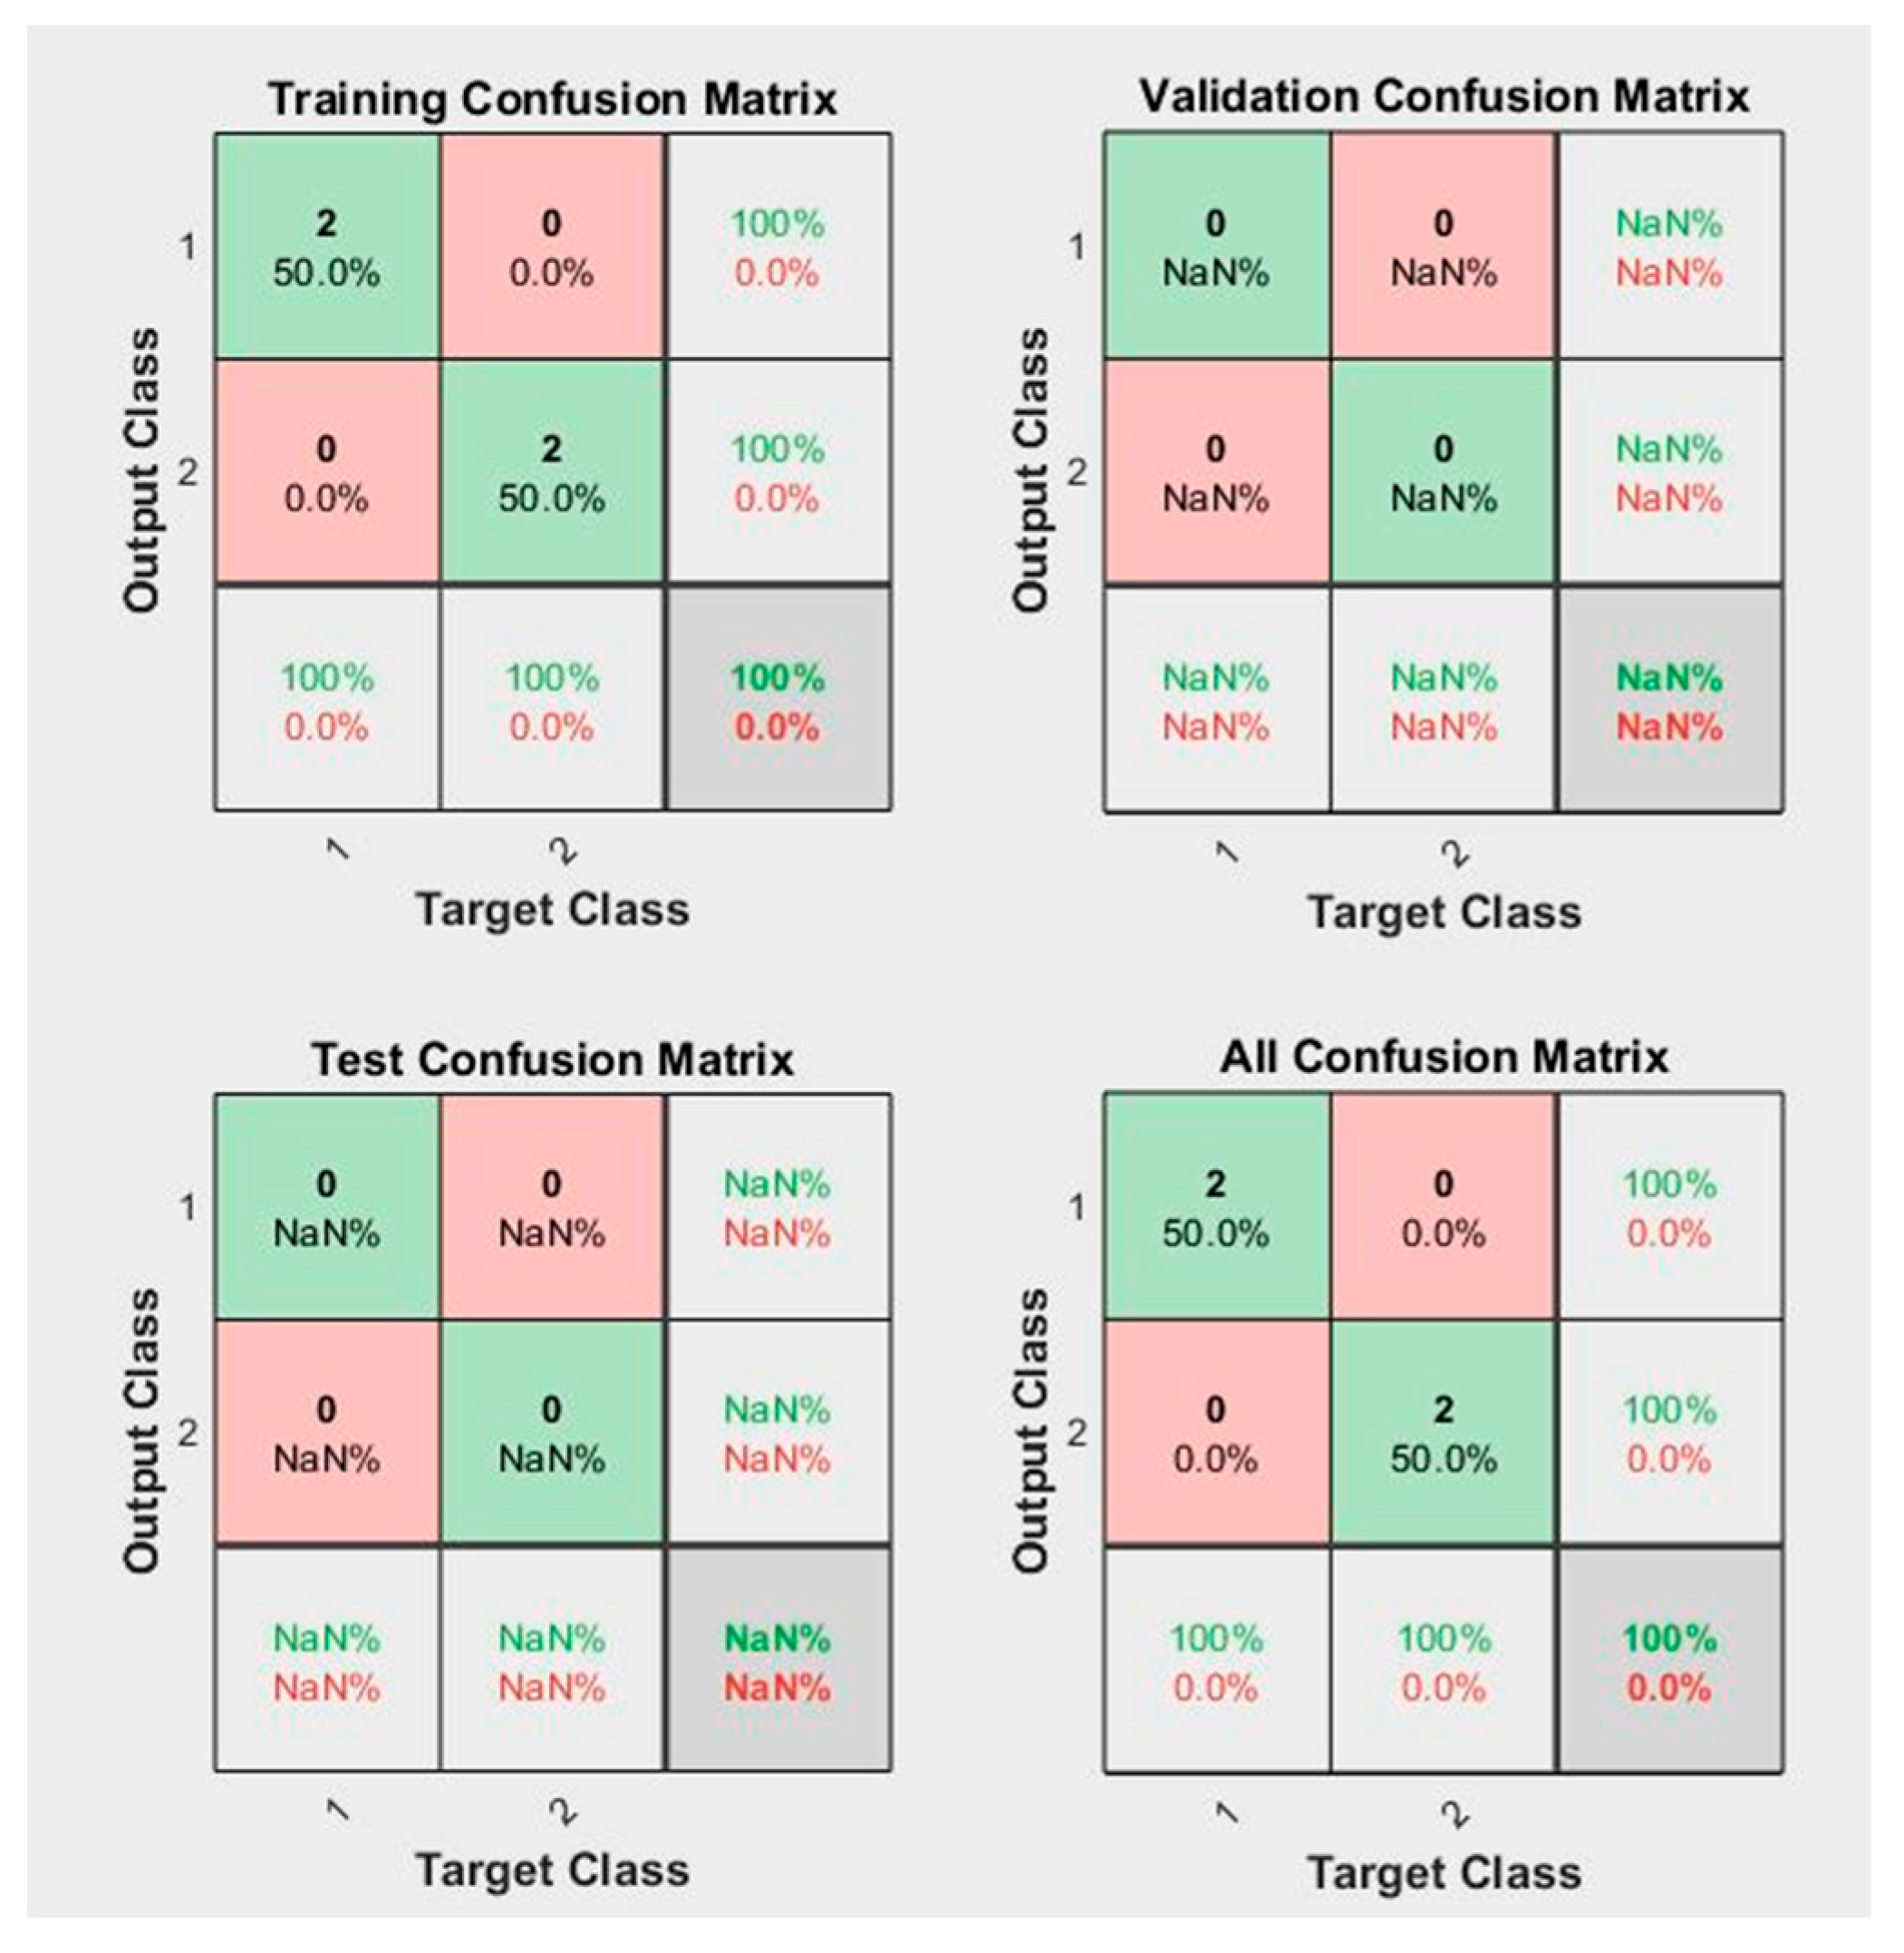
In this study, a new high-accuracy prediction model was created. In order to compare the results obtained with this ANN model in terms of model accuracy, the same data were tested using two methods. The performance of each network was analysed according to the correlation coefficient between network predictions and experimental values using training, validation, and test datasets. The prediction model’s performance using the training and test datasets is shown in Figure 13. As a result, it is seen that the MLP model achieved 99.77% classification accuracy, and the LVQ model achieved 100% classification accuracy. The confusion matrices of this dataset, obtained as a result of the LVQ method used to verify the accuracy values achieved with the MLP network structure and to determine the classification performance, are given in Figure 14. The comparison of the ANN and test results is given in Table 2.
The statistical analysis shows that the data are normally distributed and there is a significant difference between the groups. The p-values obtained for each time interval are 0.0001, 0.0008, 0.04, 0.04, 0.13, 0.03, and 0.08, respectively. Cohen’s d values obtained for each time interval are 10.86, 7.50, 2.43, 1.53, 2.67, and 1.90, respectively. Eta squared (η2) values are 0.98, 0.95, 0.69, 0.47, 0.73, and 0.57.
Cohen’s d and η2 values indicate a significant difference between diesel and bench oils during the 5–30 h period. These results, particularly when examining Cohen’s d values at hours 5 and 10 in the early stages, indicate that almost all of the variance is due to the oil type, and the difference is exceptionally high. The d and η2 values at hours 15–25 are considered in the large-impact category. At hour 30, the difference in Cohen’s d and η2 values had diminished, but remained high [46,47]. Therefore, the observed differences are statistically significant and have strong practical significance, explaining a substantial portion of the variance. These findings reveal that the proposed sensor can distinguish different oil types with high accuracy even under long-term usage conditions and can provide a reliable basis for decision support systems in industrial maintenance applications.

3.7. Interface Design

After all the work was completed, a vehicle-friendly interface was designed using several data points as examples. Oil viscosity, temperature, humidity, metal ppm values, dielectric coefficients, and oil quality parameters can be displayed on the interface, providing real-time data to the user (Figure 15).
Figure 15a shows an example display panel that displays the oil quality by receiving information from the sensor regarding the vehicle oil’s viscosity, temperature, humidity, metal PPM, dielectric, and operating time. Viewing this display allows determination of whether the oil is experiencing performance loss and whether an oil change is necessary. In Figure 15b, time-dependent temperature, viscosity, and oil quality estimation can be monitored together. By monitoring humidity over time, information can be obtained about whether there is a risk of water pollution (Figure 15c). Dielectric tracking over time displays the change in the chemical properties of the oil, and signs of contamination or deterioration may be observed (Figure 15d). Monitoring metal ppm over time can provide information about the accumulation of metal wear particles in the oil. For example, here, the initial five ppm gradually increases over time. This indicates the accumulation of metal wear particles in the oil. The increase is slow but steady, suggesting the machine is beginning to wear (Figure 15e). Literature comparison and information on comparisons according to sensor types is shown in Table 3.
The sensor platform developed in this study is applicable not only in laboratory settings but also in the industrial and automotive sectors. Sensor outputs can be integrated with in-vehicle electronic control units (ECUs) via standard communication protocols such as CAN-Bus or LIN, enabling real-time monitoring of engine oil conditions. This allows for real-time oil status display on the driver information display and dynamic optimisation of maintenance intervals. On an industrial scale, the system can be integrated with a SCADA infrastructure to monitor the oil status of numerous equipment simultaneously. With cloud-based data transfer, maintenance personnel can perform remote monitoring via mobile applications, and automatic alerts can be activated when critical thresholds are exceeded, initiating planned maintenance processes. This supports predictive maintenance strategies, prevents unexpected failures, and significantly reduces maintenance costs.

4. Conclusions

An innovative, low-cost, fast-response, and environmentally friendly solid electrolyte sensor with real-time measurement capability has been developed to determine the optimum lifespan of lubricating oils. Experimental results confirmed the sensor’s sensitivity to different oil types and contamination levels, enabling continuous monitoring through resistance measurements and FTIR analysis. The developed MLP- and LVQ-based artificial neural network models achieved high classification accuracies of 99.77% and 100%, making the system suitable for real-world field applications. This approach directly supports industrial predictive maintenance by optimising oil change decisions based on actual degradation and contributes to sustainability and digital transformation efforts in the machinery and automotive sectors. The study’s strengths include the multi-faceted approach combining physical and chemical analyses, the ability to track trends throughout the service life, the availability of precise FTIR data demonstrating molecular structure changes over time, and the comparison of a real-world system (diesel engine) with a laboratory system. While the developed biopolymer-based sensor platform performs highly accurately under laboratory and field conditions, it has some technical limitations. First, the sensor’s long-term stability is sensitive to mechanical or chemical degradation over time, especially in systems operating continuously and under high loads. Because sensor response curves may deviate across oil types with different viscosities and additive compositions, additional calibration may be required for each oil type. These limitations suggest that future sensors should be enhanced with environmentally friendly coatings and automated calibration algorithms.
Future studies could conduct tests with different engine oils and operating conditions and evaluate other additives or contaminants in the oil. Calibration curves for different oil types must be created at the beginning, and these curves must be updated automatically throughout the machine’s life. Future software interface development should include an automatic recalibration module. Additionally, compensation algorithms are needed to maintain sensor stability under variable conditions such as high temperature, humidity, and particulate contamination. The system can be scaled via CAN-Bus/SCADA integration with industrial maintenance software and vehicle electronic control units, enabling simultaneous oil monitoring across different machine parks. Environmentally friendly protective coatings can be developed to prevent biopolymer degradation on the sensor surface over time. Furthermore, long-term 6–12 month validation can be conducted during field tests.

5. Patents

Both national (2022/002989) and international (PCT/TR2022/050332) patent applications have been filed for the data obtained and the sensor produced in this study. This research did not receive any grants.

Funding

This research received no external funding.

Data Availability Statement

Data will be shared upon request.

Conflicts of Interest

The author declares no conflict of interest.

References

  1. Oladimeji, T.E.; Oguntuashe, K.M.; Emetere, M.E.; Efeovbokhan, V.E.; Odunlami, O.A.; Obanla, O.R. Industrial- and Automotive-Used Lubricating Oils Recycling Cum Acidic Sludge Treatment. Int. J. Adv. Manuf. Technol. 2020, 106, 4157–4167. [Google Scholar] [CrossRef]
  2. Adewole, B.Z.; Olojede, J.O.; Owolabi, H.A.; Obisesan, O.R. Characterization and Suitability of Reclaimed Automotive Lubricating Oils Reprocessed by Solvent Extraction Technology. Recycling 2019, 4, 31. [Google Scholar] [CrossRef]
  3. International Environmental Technology Centre. Policy Brief on Waste Oil: What, Why and How. 2013. Available online: https://www.unep.org/ietc/ (accessed on 20 August 2025).
  4. Lnoue, K.; Yarnanaka, Y. Change in Performance of Engine Oils with Degradation. In Proceedings of the International Fuels and Lubricants Meeting and Exposition, Tulsa, OK, USA, 1990; Available online: https://www.sae.org/publications/technical-papers/content/902122/#:~:text=The%20degradation%20leads%20to%20the,%2C%20lowered%20antiwear%20performance%2C%20etc (accessed on 20 August 2025).
  5. Sejkorová, M.; Hurtová, I.; Jilek, P.; Novák, M.; Voltr, O. Study of the Effect of Physicochemical Degradation and Contamination of Motor Oils on Their Lubricity. Coatings 2021, 11, 60. [Google Scholar] [CrossRef]
  6. Wei, L.; Duan, H.; Jin, Y.; Jia, D.; Cheng, B.; Liu, J.; Li, J. Motor Oil Degradation during Urban Cycle Road Tests. Friction 2021, 9, 1002–1011. [Google Scholar] [CrossRef]
  7. Hameed, D.K. Deterioration in Physical Engine Oil Properties after Different Trip Length. Kurd. J. Appl. Res. 2021, 6, 13–20. [Google Scholar] [CrossRef]
  8. Smigins, R.; Amatnieks, K.; Birkavs, A.; Górski, K.; Kryshtopa, S. Studies on Engine Oil Degradation Characteristics in a Field Test with Passenger Cars. Energies 2023, 16, 7955. [Google Scholar] [CrossRef]
  9. Shinde, H.; Bewoor, A. Capacitive Sensor for Engine Oil Deterioration Measurement. AIP Conf. Proc. 2018, 1943, 020099. [Google Scholar] [CrossRef]
  10. Ibrahim, D.; Stapah, M.; Ruslan, M.A.A.; Yaakob, Y.; Budin, S.; Maideen, N.C.; Yusoff, H. Predicting the next Oil Change for Automotive Engine Oil. Proc. J. Phys. Conf. Ser. 2019, 1349, 012018. [Google Scholar] [CrossRef]
  11. Potyrailo, R.A.; Tokarev, I.; Go, S.; Ottikkutti, P.; Kuzhiyil, N.; Mihok, J.; Anzini, C.; Shartzer, S. Multivariable Electrical Resonant Sensors for Independent Quantitation of Aging and External Contaminants in Lubricating Oils. IEEE Sens. J. 2019, 19, 1542–1553. [Google Scholar] [CrossRef]
  12. Sosnowski, K.; Loh, A.; Zubler, A.V.; Shir, H.; Ha, S.Y.; Yim, U.H.; Yoon, J.Y. Machine Learning Techniques for Chemical and Type Analysis of Ocean Oil Samples via Handheld Spectrophotometer Device. Biosens. Bioelectron. X 2022, 10, 100128. [Google Scholar] [CrossRef]
  13. Karluk, A.A.; Ekim, S.D.; Baytekin, B.; Tarik Baytekin, H. Online Lubricant Degradation Monitoring Using Contact Charging of Polymers. Appl. Surf. Sci. 2022, 584, 152593. [Google Scholar] [CrossRef]
  14. TR201910799A2. Available online: https://www.patentguru.com/assignee/hasan-tarik-baytek%C4%B0n (accessed on 20 August 2025).
  15. Xiaodong, Z.; Kefeng, C.; Jie, Y.; Guangfeng, X.; Jie, S.; Haitao, T. Analysis of Effect of Oil and S2− Impurities on Corrosion Behavior of 16Mn Steel for Storage Tanks by Electrochemical Method. RSC Adv. 2018, 8, 38118–38123. [Google Scholar] [CrossRef]
  16. Engmarksgaard, M.E. Electrical Impedance Spectroscopy for Use in Oil Quality Assessment. Master’s Thesis, University of Southern Denmark, Odense, Denmark, 2021. [Google Scholar] [CrossRef]
  17. Kupareva, A.; Mäki-Arvela, P.; Grénman, H.; Eränen, K.; Sjöholm, R.; Reunanen, M.; Murzin, D.Y. Chemical Characterization of Lube Oils. Energy Fuels 2013, 27, 27–34. [Google Scholar] [CrossRef]
  18. Wolak, A.; Krasodomski, W.; Zając, G. FTIR Analysis and Monitoring of Used Synthetic Oils Operated under Similar Driving Conditions. Friction 2020, 8, 995–1006. [Google Scholar] [CrossRef]
  19. Zhang, J.; Leung, M.C.Y.; Wong, J.S.S.; Spikes, H. Lubricant Inerting. Tribol. Trans. 2025, 68, 180–193. [Google Scholar] [CrossRef]
  20. Heredia-Cancino, J.A.; Carrillo-Torres, R.C.; Félix-Domínguez, F.; Álvarez-Ramos, M.E. Experimental Characterization of Chemical Properties of Engine Oil Using Localized Surface Plasmon Resonance Sensing. Appl. Sci. 2021, 11, 8518. [Google Scholar] [CrossRef]
  21. Hu, K.; Murphy, M.; Van De Voort, F.R.; Pinchuk, D.; Zou, X. A New FTIR Technique for Monitoring the Conditions of Lubricants Used in Pulp and Paper Mills. J. Soc. Tribol. Lubr. Eng. 2012, 3, 23–29. [Google Scholar]
  22. Keser, K.; Soylu, M.Ç. Dimerkaprol İle Zenginleştirilmiş Jelatin Temelli Katı Elektrolitli İmpedimetrik Elektrokimyasal Sensör İle İçme Sularında Arsenik Tespiti. Ph.D. Thesis, Erciyes Üniversitesi, Fen Bilimleri Enstitüsü Biyomedikal Mühendisliği Anabilim Dalı, Kayseri, Turkey, 2023. [Google Scholar]
  23. Keser, K.; Soylu, M.Ç. Simple, Specific, and Ultra-Sensitive Arsenic Detection in Real Drinking Water Samples Using an Impedimetric Green Sensor with Dimercaprol-Doped Solid Electrolyte. Electroanalysis 2025, 37, e202400253. [Google Scholar] [CrossRef]
  24. Keser, K.; Soylu, M.Ç. Detection of Phenylarsine Oxide in Drinking Water Using an Impedimetric Electrochemical Sensor with Gelatin-Based Solid Electrolyte Enriched with Mercaptoethanol: A Novel Prospective Green Biosensor Methodology. ACS Omega 2022, 7, 43111–43121. [Google Scholar] [CrossRef] [PubMed]
  25. Nabi, M.N.; Rasul, M.; Gudimetla, P. Modelling and Simulation of Performance and Combustion Characteristics of Diesel Engine. In Energy Procedia, Proceedings of the 6th International Conference on Power and Energy Systems Engineering, Okinawa, Japan, 20–23 September 2019; Elsevier Ltd.: Amsterdam, The Netherland, 2019; Volume 160, pp. 662–669. [Google Scholar]
  26. Abu-Zaid, M. Performance of Single Cylinder, Direct Injection Diesel Engine Using Water Fuel Emulsions. Energy Convers. Manag. 2004, 45, 697–705. [Google Scholar] [CrossRef]
  27. Frigione, M.; Rodríguez-Prieto, A. Can Accelerated Aging Procedures Predict the Long Term Behavior of Polymers Exposed to Different Environments? Polymers 2021, 13, 2688. [Google Scholar] [CrossRef]
  28. Zhang, J.; Wang, R.; Fang, Y.; Lin, Y. Insulation Degradation Analysis Due to Thermo-Mechanical Stress in Deep-Sea Oil-Filled Motors. Energies 2022, 15, 3963. [Google Scholar] [CrossRef]
  29. Nagengast, N.; Bay, C.; Döpper, F.; Schmidt, H.W.; Neuber, C. Thermo-Mechanical Recyclability of Additively Manufactured Polypropylene and Polylactic Acid Parts and Polypropylene Support Structures. Polymers 2023, 15, 2291. [Google Scholar] [CrossRef]
  30. Arias-Nava, E.H.; Valles-Rosales, D.J.; Sullivan, B.P. Biopolymer Non-Parametric Analysis: A Degradation Study under Accelerated Destructive Tests. Polymers 2023, 15, 620. [Google Scholar] [CrossRef]
  31. Hoess, A.J.; Ziviani, D.; Groll, E.A.; Braun, J.E. Development and Application of Accelerated Life Test Cycles for Performance Degradation Study on Water-Cooled Variable speed Screw Compressor Chillers. In Proceedings of the International Compressor Engineering Conference, West Lafayette, IN, USA, 10–14 July 2022. [Google Scholar]
  32. Demuth, H.; De Jesús, B. Neural Network Design, 2nd ed. Available online: https://hagan.okstate.edu/NNDesign.pdf (accessed on 20 August 2025).
  33. Popovicheva, O.B.; Kireeva, E.D.; Shonija, N.K.; Vojtisek-Lom, M.; Schwarz, J. FTIR Analysis of Surface Functionalities on Particulate Matter Produced by Off-Road Diesel Engines Operating on Diesel and Biofuel. Environ. Sci. Pollut. Res. 2015, 22, 4534–4544. [Google Scholar] [CrossRef] [PubMed]
  34. Ulusoy, Y. Investigation of Particulate Matter by FTIR, TEM and Elemental Analyses in a Diesel Engine Operating on Diesel and Waste Cooking Oil-Biodiesel. Environ. Sci. Pollut. Res. 2020, 27, 500–509. [Google Scholar] [CrossRef] [PubMed]
  35. van de Voort, F.R.; Ghetler, A.; García-González, D.L.; Li, Y.D. Perspectives on Quantitative Mid-FTIR Spectroscopy in Relation to Edible Oil and Lubricant Analysis: Evolution and Integration of Analytical Methodologies. Food Anal. Methods 2008, 1, 153–163. [Google Scholar] [CrossRef]
  36. Agocs, A.; Nagy, A.L.; Tabakov, Z.; Perger, J.; Rohde-Brandenburger, J.; Schandl, M.; Besser, C.; Dörr, N. Comprehensive Assessment of Oil Degradation Patterns in Petrol and Diesel Engines Observed in a Field Test with Passenger Cars—Conventional Oil Analysis and Fuel Dilution. Tribol. Int. 2021, 161, 107079. [Google Scholar] [CrossRef]
  37. Gołębiowski, W.; Krakowski, R.; Zając, G. Degradation of Anti-Wear Additives and Tribological Properties of Engine Oils at Extended Oil Change Intervals in City Buses. Sci. Rep. 2025, 15, 27238. [Google Scholar] [CrossRef]
  38. Adams, M.J.; Romeo, M.J.; Rawson, P. FTIR Analysis and Monitoring of Synthetic Aviation Engine Oils. Talanta 2007, 73, 629–634. [Google Scholar] [CrossRef] [PubMed]
  39. Yousefinejad, S.; Aalizadeh, L.; Honarasa, F. Application of ATR-FTIR Spectroscopy and Chemometrics for the Discrimination of Furnace Oil, Gas Oil and Mazut Oil. Anal. Methods 2016, 8, 4640–4647. [Google Scholar] [CrossRef]
  40. Dong, X.; Li, Z.; Ding, B.; Dou, H.; Zhang, X. Electrolyte and Electrode–Electrolyte Interface for Proton Batteries: Insights and Challenges. ChemElectroChem 2024, 11, e202300569. [Google Scholar] [CrossRef]
  41. Murru, C.; Badía-Laíño, R.; Díaz-García, M.E. Oxidative Stability of Vegetal Oil-Based Lubricants. ACS Sustain. Chem. Eng. 2021, 9, 1459–1476. [Google Scholar] [CrossRef]
  42. Latif, U.; Dickert, F.L. Conductometric Sensors for Monitoring Degradation of Automotive Engine Oil. Sensors 2011, 11, 8611–8625. [Google Scholar] [CrossRef]
  43. Zhou, F.; Yang, K.; Wang, L. The Effect of Water Content on Engine Oil Monitoring Based on Physical and Chemical Indicators. Sensors 2024, 24, 1289. [Google Scholar] [CrossRef]
  44. Soleimani, M.; Sophocleous, M.; Wang, L.; Atkinson, J.; Hosier, I.L.; Vaughan, A.S.; Taylor, R.I.; Wood, R.J.K. Base Oil Oxidation Detection Using Novel Chemical Sensors and Impedance Spectroscopy Measurements. Sens. Actuators B Chem. 2014, 199, 247–258. [Google Scholar] [CrossRef]
  45. Vadhva, P.; Hu, J.; Johnson, M.J.; Stocker, R.; Braglia, M.; Brett, D.J.L.; Rettie, A.J.E. Electrochemical Impedance Spectroscopy for All-Solid-State Batteries: Theory, Methods and Future Outlook. ChemElectroChem 2021, 8, 1930–1947. [Google Scholar] [CrossRef]
  46. Cohen, J. Statistical Power Analysis for the Behavioral Sciences, 2nd ed.; Lawrence Erlbaum Associates: Mahwah, NJ, USA, 1988; Available online: https://utstat.utoronto.ca/brunner/oldclass/378f16/readings/CohenPower.pdf (accessed on 20 August 2025).
  47. Lakens, D. Calculating and Reporting Effect Sizes to Facilitate Cumulative Science: A Practical Primer for t-Tests and ANOVAs. Front. Psychol. 2013, 4, 863. [Google Scholar] [CrossRef]
  48. Lajos Nagy, A.; Rohde-Brandenburger, J.; Zsoldos, I. Artificial Aging Experiments of Neat and Contaminated Engine Oil Samples. Lubricants 2021, 9, 63. [Google Scholar] [CrossRef]
  49. Wierzbicka, N.; Szadkowska, D.; Patalas, A.; Talar, R.; Łabudzki, R.; Zawadzki, P. Evaluation of Deterioration of Engine Oil Properties in the Function of Mileage. J. Phys. Conf. Ser. 2020, 1426, 012004. [Google Scholar] [CrossRef]
  50. Han, Z.; Wang, Y.; Qing, X. Characteristics Study of In-Situ Capacitive Sensor for Monitoring Lubrication Oil Debris. Sensors 2017, 17, 2851. [Google Scholar] [CrossRef]
  51. Wang, Y.; Lin, T.; Wu, D.; Zhu, L.; Qing, X.; Xue, W. A New In Situ Coaxial Capacitive Sensor Network for Debris Monitoring of Lubricating Oil. Sensors 2022, 22, 1777. [Google Scholar] [CrossRef] [PubMed]
  52. Lvovich, V.F.; Smiechowski, M.F. Impedance Characterization of Industrial Lubricants. Electrochim. Acta 2006, 51, 1487–1496. [Google Scholar] [CrossRef]
  53. Zhao, J.; Wang, D.; Zhang, F.; Liu, Y.; Chen, B.; Wang, Z.L.; Pan, J.; Larsson, R.; Shi, Y. Real-Time and Online Lubricating Oil Condition Monitoring Enabled by Triboelectric Nanogenerator. ACS Nano 2021, 15, 11869–11879. [Google Scholar] [CrossRef] [PubMed]
  54. Zhao, J.; Wang, D.; Zhang, F.; Pan, J.; Claesson, P.; Larsson, R.; Shi, Y. Self-Powered, Long-Durable, and Highly Selective Oil–Solid Triboelectric Nanogenerator for Energy Harvesting and Intelligent Monitoring. Nanomicro Lett. 2022, 14, 160. [Google Scholar] [CrossRef]
  55. Wolak, A.; Żywica, R. Electrical Properties of Engine Oils—Comparison of Electrical Parameters with Physicochemical Characteristics. Energies 2025, 18, 2776. [Google Scholar] [CrossRef]
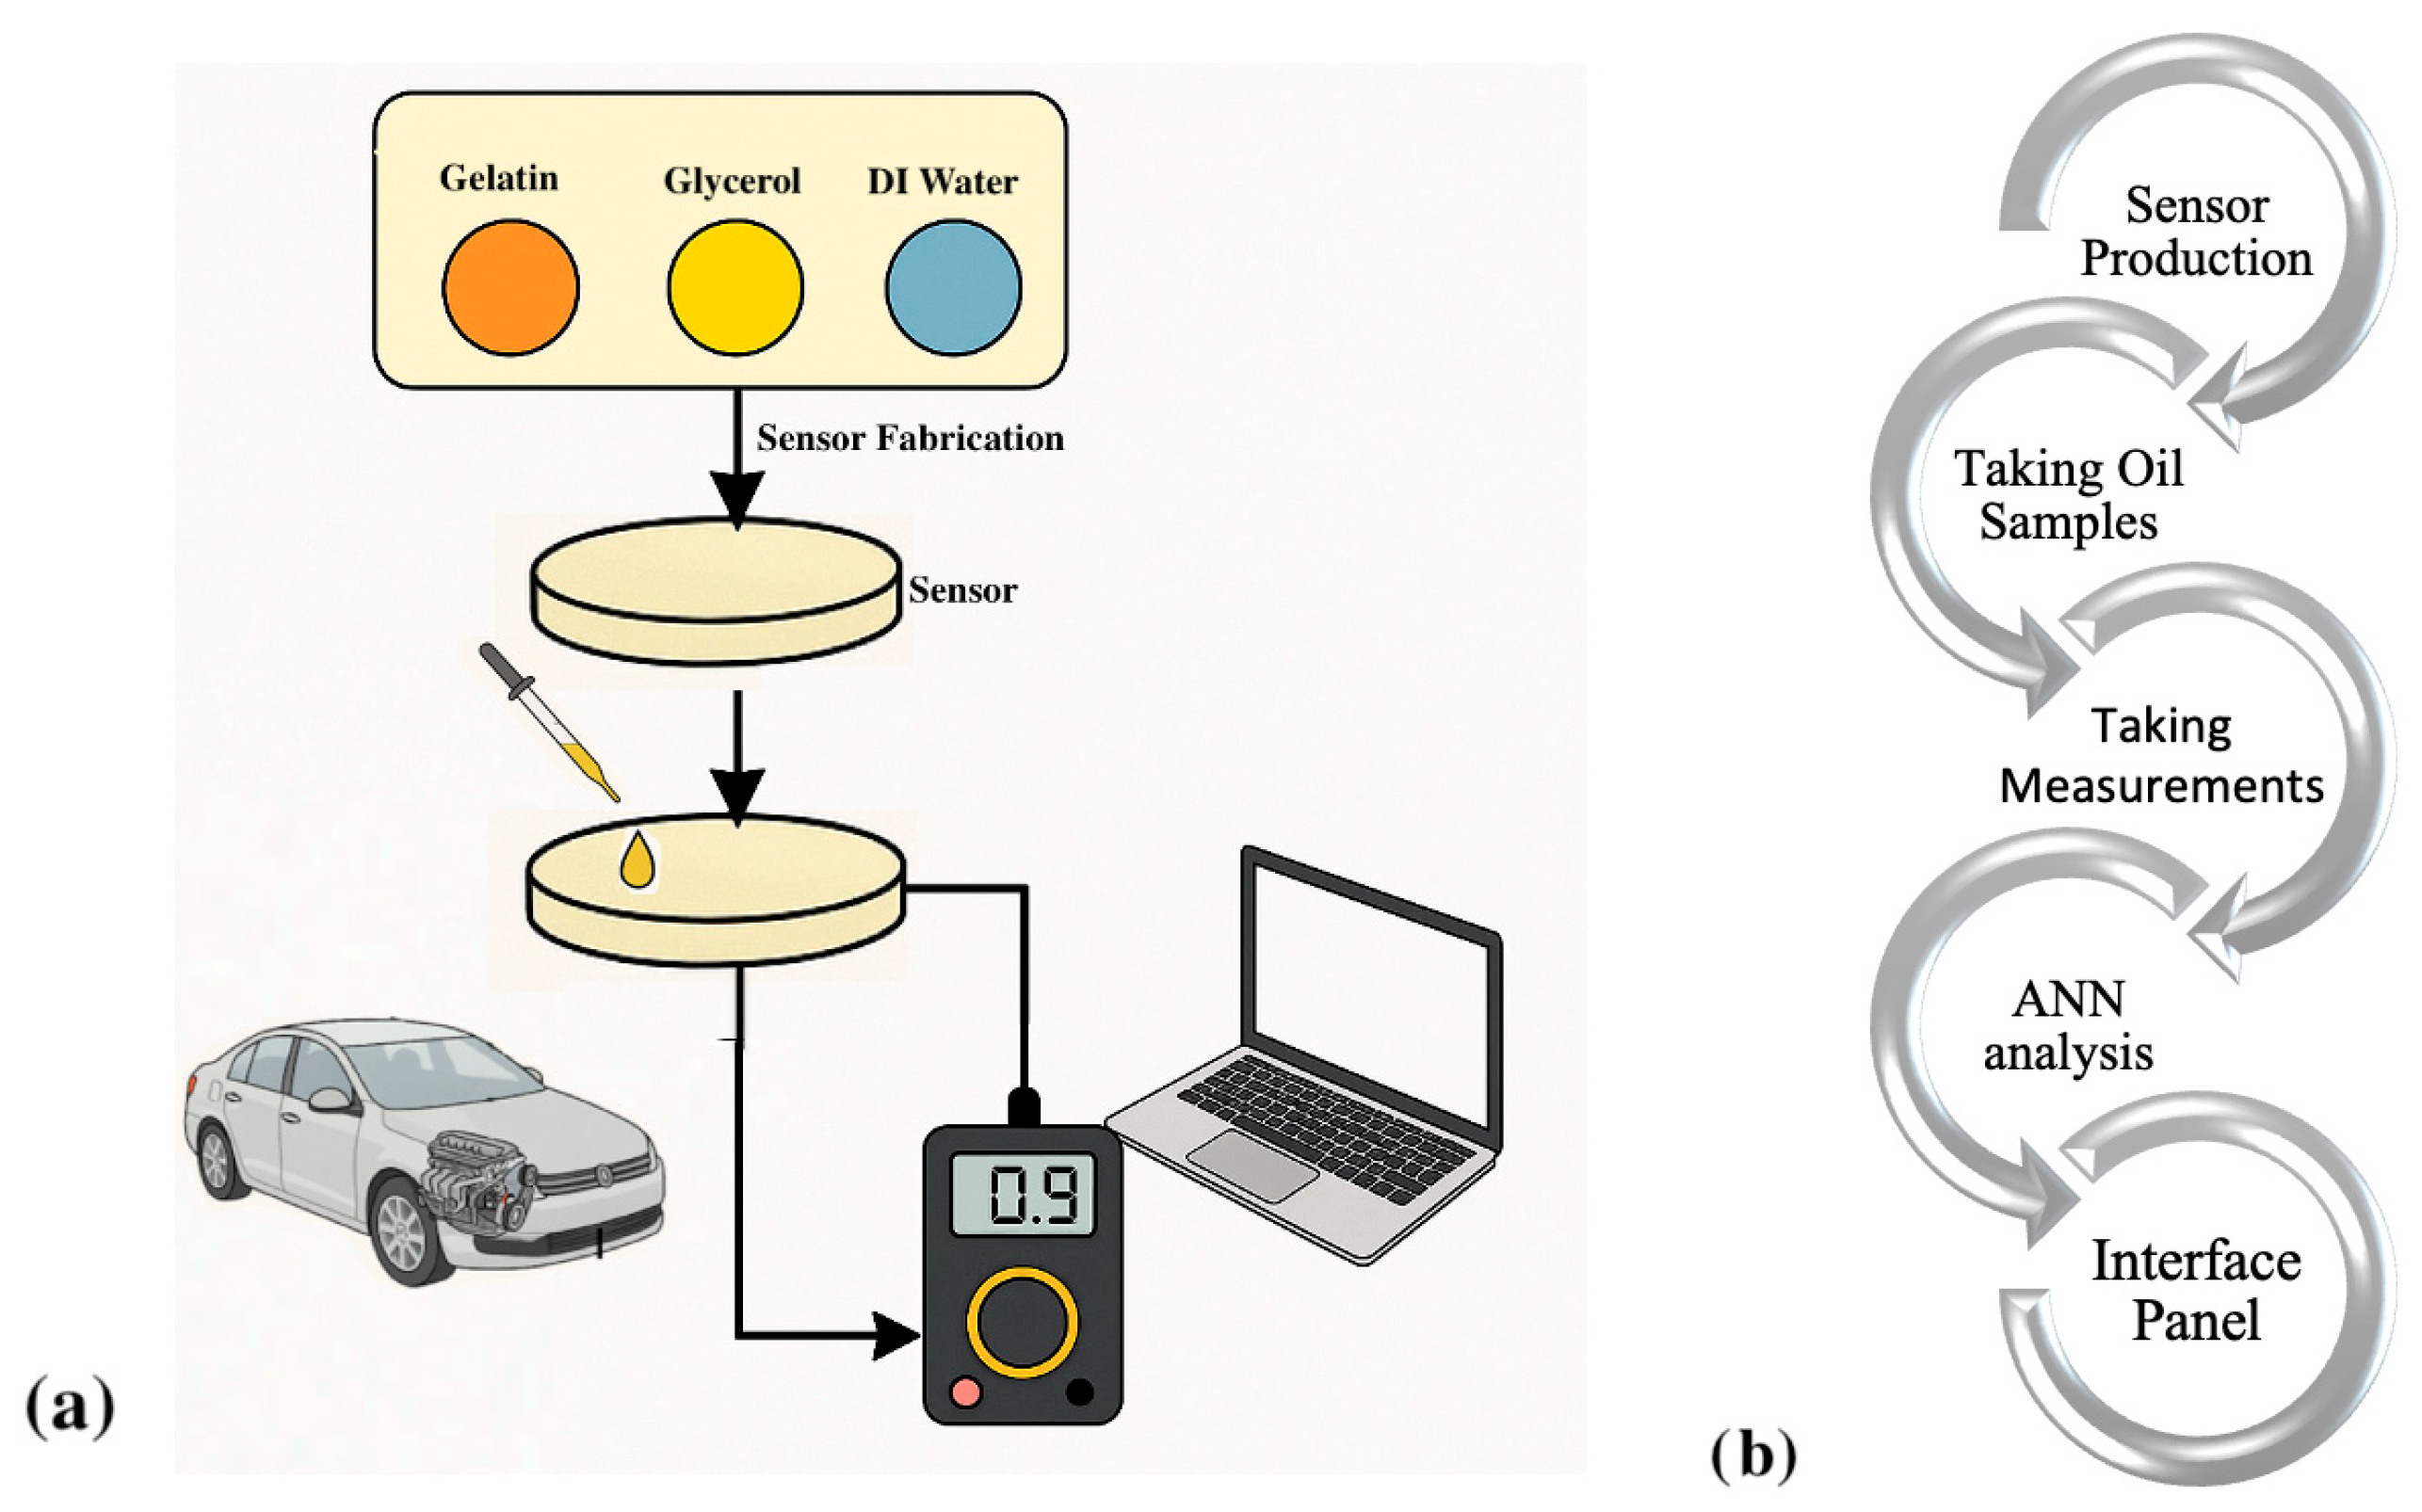
Figure 1. Experimental platform: (a) electrochemical measurements using the measurement system; (b) experimental procedure.
Lubricants 13 00389 g001
Figure 2. Oil samples: (a) diesel oil; (b) bench oil.
Lubricants 13 00389 g002
Figure 3. Adjusting the samples to the desired temperatures.
Lubricants 13 00389 g003
Figure 4. MLP network architecture.
Lubricants 13 00389 g004
Figure 5. LVQ network architecture.
Lubricants 13 00389 g005
Figure 6. Example interface image.
Lubricants 13 00389 g006
Figure 7. Measurements performed in triplicate from each sensor: (a,b) resistance measurements; (c) impedance measurements.
Lubricants 13 00389 g007
Figure 8. Comparative chart of diesel and bench oil.
Lubricants 13 00389 g008
Figure 9. FTIR analyses of different types of oil samples (a) 400–4000 cm –1 wavelength range; (b) 2800–3000 cm–1 wavelength range.
Lubricants 13 00389 g009
Figure 10. Impedance variation in different types of oils.
Lubricants 13 00389 g010
Figure 11. Resistance change in sensors produced with different thicknesses (a) in unused oil; (b) in 30 h used oil.
Lubricants 13 00389 g011
Figure 12. Resistance measurements at different temperatures in diesel oil used for 30 h.
Lubricants 13 00389 g012
Figure 13. MLP regression plots.
Lubricants 13 00389 g013
Figure 14. LVQ regression plots.
Lubricants 13 00389 g014
Figure 15. Oil life determination panel (changes in various parameters depending on time): (a) oil condition panel; (b) critical oil parameters trend; (c) humidity trend (%); (d) dielectric trend; (e) metal PPM trend.
Lubricants 13 00389 g015
Table 1. Comparative evaluation of the present study with the existing literature.
CriteriaExisting
Literature
This StudyComparisonRef.
Parameter TrackingUsually, physical parameters (viscosity, acidity, TBN) are used.Physical and chemical degradation was monitored over time.While chemical degradation signals were detected with FTIR, physical changes such as viscosity were also monitored, and the oil change process was evaluated multidimensionally.[5,17]
Use of
Spectroscopic Methods
Mainly, FTIR is used, but usually at a single time (e.g., used vs. unused oil comparison).The FTIR spectrum shows the change trend with time and duration of use.Using FTIR reveals the gradual progression of oxidation and additive depletion in oil molecules. This allows for more accurate maintenance scheduling decisions.[18]
Oil Type
Separation
Most studies are limited to automotive oil or
reference oil only.
Both diesel oil and bench oil were analysed.Different formulations (different types of oil) have highly different oxidation dynamics.[19]
Monitoring TimeInstant measurements or analysis after a short period of use are
common.
Data covering up to 30 h of use are presented.The early stages of the oil cycle are observed in short-term data, but longer-term molecular degradation processes may be overlooked. In this study, the full degradation curves are more clearly defined.[18]
Depth of AnalysisBased on a physical parameter, it may not be supported at the molecular level.Physical data and FTIR spectral data were correlated.Molecular degradation data can signal physical change before it occurs,
providing critical data for predictive maintenance.
[20]
Data
Presentation
Usually single-axis graphs.Time-series graph + IR spectrum were used together.Multidimensional data presentation allows users to more easily visualise trends and critical thresholds, accelerating decision-making for engineers. [21]
Predictive
Potential
Predictive change over time is recommended.The data infrastructure is suitable for artificial intelligence models since the change trend and structural deterioration are given together.Prediction models are often fed only with physical data; in this study, prediction accuracy can be increased by adding molecular-level data.[17,18]
Table 2. Comparing the ANN and test results.
Oil TypeExperimental
Results (MΩ)
MLP Results (MΩ)LVQ Results (MΩ)
Diesel23.84 ± 0.5723.7923.84
27 ± 0.526.8427
28 ± 1.0527.9528
29 ± 0.928.8129
31.65 ± 0.8531.6331.65
32.7 ± 132.0132.7
Bench Oil19.44 ± 0.0619.7819.44
22 ± 0.821.9722
26 ± 0.525.9826
28 ± 0.22828
30 ± 0.230.0230
31.3 ± 0.330.3531.3
Table 3. (a) Comparison of the literature. (b) Comparison according to sensor types.
(a)
Subject of the StudyOil Type/EngineParameters
Measured
Test Duration/
Kilometres
Main ResultsRef.
Effect of travel length on engine oil properties10W-30 Delta NL (API SL)Viscosity (40 °C, 100 °C), flash point, fire point10,000 km road testViscosity decreased by 23–26%; flash point decreased by 15.6%, fire point decreased by 14.2%[7]
Determination of oil change intervals0W30, 5W30, 5W40Concentration of metal particles, additives12,000–15,000 km field testIron, silicon, and nickel increased; molybdenum and calcium additives decreased; oil change recommended beyond 12,000 km[8]
Laboratory-based ageing of full synthetic oilSAE 0W-30 full synthetic oilZDDP additive, wear performance180 °C, 96 h artificial ageingOil performance decreased with ZDDP depletion[48]
Evaluation of the deterioration of engine oil properties as a function of mileageSynthetic and semi-synthetic oils (SAE 5W-40, 5W-30, 10W-40); collected from various passenger car enginesDynamic viscosity at different temperatures (5 °C to 100 °C) using a Brookfield rotational viscometerNew oils vs. used oils at 12,000; 15,000; 15,500; 17,000; 25,000 kmViscosity decreased with usage but remained within acceptable limits
At 100 °C, relative change in viscosity never exceeded ±25%
No oil required replacement based on viscosity alone, even after 25,000 km
Most change occurred between 0 and 40 °C
[49]
Monitoring lubrication oil debrisLubricating oil in laboratory cycle and water for comparisonRelationship between capacitance change and debris amount; temperature and flow rate effects-Capacitance increases linearly with the amount of debris. Temperature and flow effects have a linear trend; the proposed method is applicable.[50]
Lubricating oil debris monitoring with a capacitive sensor networkSimulated lubricating oil in a laboratory environmentCapacitance change-The effects of different sizes and numbers of metal particles on capacitance were investigated, and it was found that the design of the sensor structure increased the detection sensitivity[51]
Impedance characterisation of industrial lubricants Industrial oils (in a laboratory setting; no actual engine)Responses from bulk solution, adsorption of surface active additives, R, C, CPE parameters related to diffusion and charge transfer-It was shown that oil’s chemical composition and degradation processes can be evaluated with EIS by creating equivalent circuit models containing R, C, and CPE in multiple frequency ranges[52]
Real-time and online oil condition monitoring by triboelectrification of oil-solid contactPure base oils and formulated motor oilDirect measurement of electrical signals; indirect measurement of fat-related parameters.-It provides real-time, online, and high-precision monitoring of engine and
machine oils. The sensor detects low
contamination levels and requires no
external power
[53]
Monitoring the degradation status of automotive engine oils with conductive sensorsUsed engine oilsConductivity change, especially the effect of carbonic acids-The APTES MIP layer demonstrated good sensitivity to engine oil ageing. The composite containing carbon nanotubes provided a significant difference in conductivity between fresh and used oil. The conductivity of the composite is enhanced by the electron-withdrawing effect of carbonic acids[42]
(b)
Sensor TypeSensitivityCostResponse TimeField ApplicabilityRef.
Conductometric Sensor (Polyurethane-CNT & APTES imprinted polymers)Clear discrimination against derivative deformationsRequires laboratory infrastructure and LCR metersRise and recovery times are fast; based on surface interaction Safe in a laboratory environment; apparatus and temperature control may be required for field use [42]
Triboelectric Nanogenerator
(O–S TENG)
Detection of particles ≥ 1 mg/mL and water ≥ 0.01 wt% Enhanced versions have particles ≥ 0.01 wt% and water ≥ 100 ppm Self-powered; no additional power supply required. Simple materials (PTFE, LDPE, copper) and surface treatments are sufficient Signals are instantaneous; they depend on triboelectric contact-separation processes The tank interior can be applied to a real vehicle and is durable[53,54]
Electrical
Parameter
Measuring
Sensors
Good repeatability in the 1 kHz–10 kHz range; correlation with viscosity and IR spectrumCan be implemented with a relatively simple electronic measurement systemSpeed depends on frequency scan time but can approach real time Simple sensor structure; can be integrated into industrial systems, sensitive to environmental parameters[55]
Disclaimer/Publisher’s Note: The statements, opinions and data contained in all publications are solely those of the individual author(s) and contributor(s) and not of MDPI and/or the editor(s). MDPI and/or the editor(s) disclaim responsibility for any injury to people or property resulting from any ideas, methods, instructions or products referred to in the content.