Figure 1.
Selected factors influencing wire wear.
Figure 1.
Selected factors influencing wire wear.
Figure 2.
Experimental setup: Mitsubishi FA10S WEDM machine.
Figure 2.
Experimental setup: Mitsubishi FA10S WEDM machine.
Figure 3.
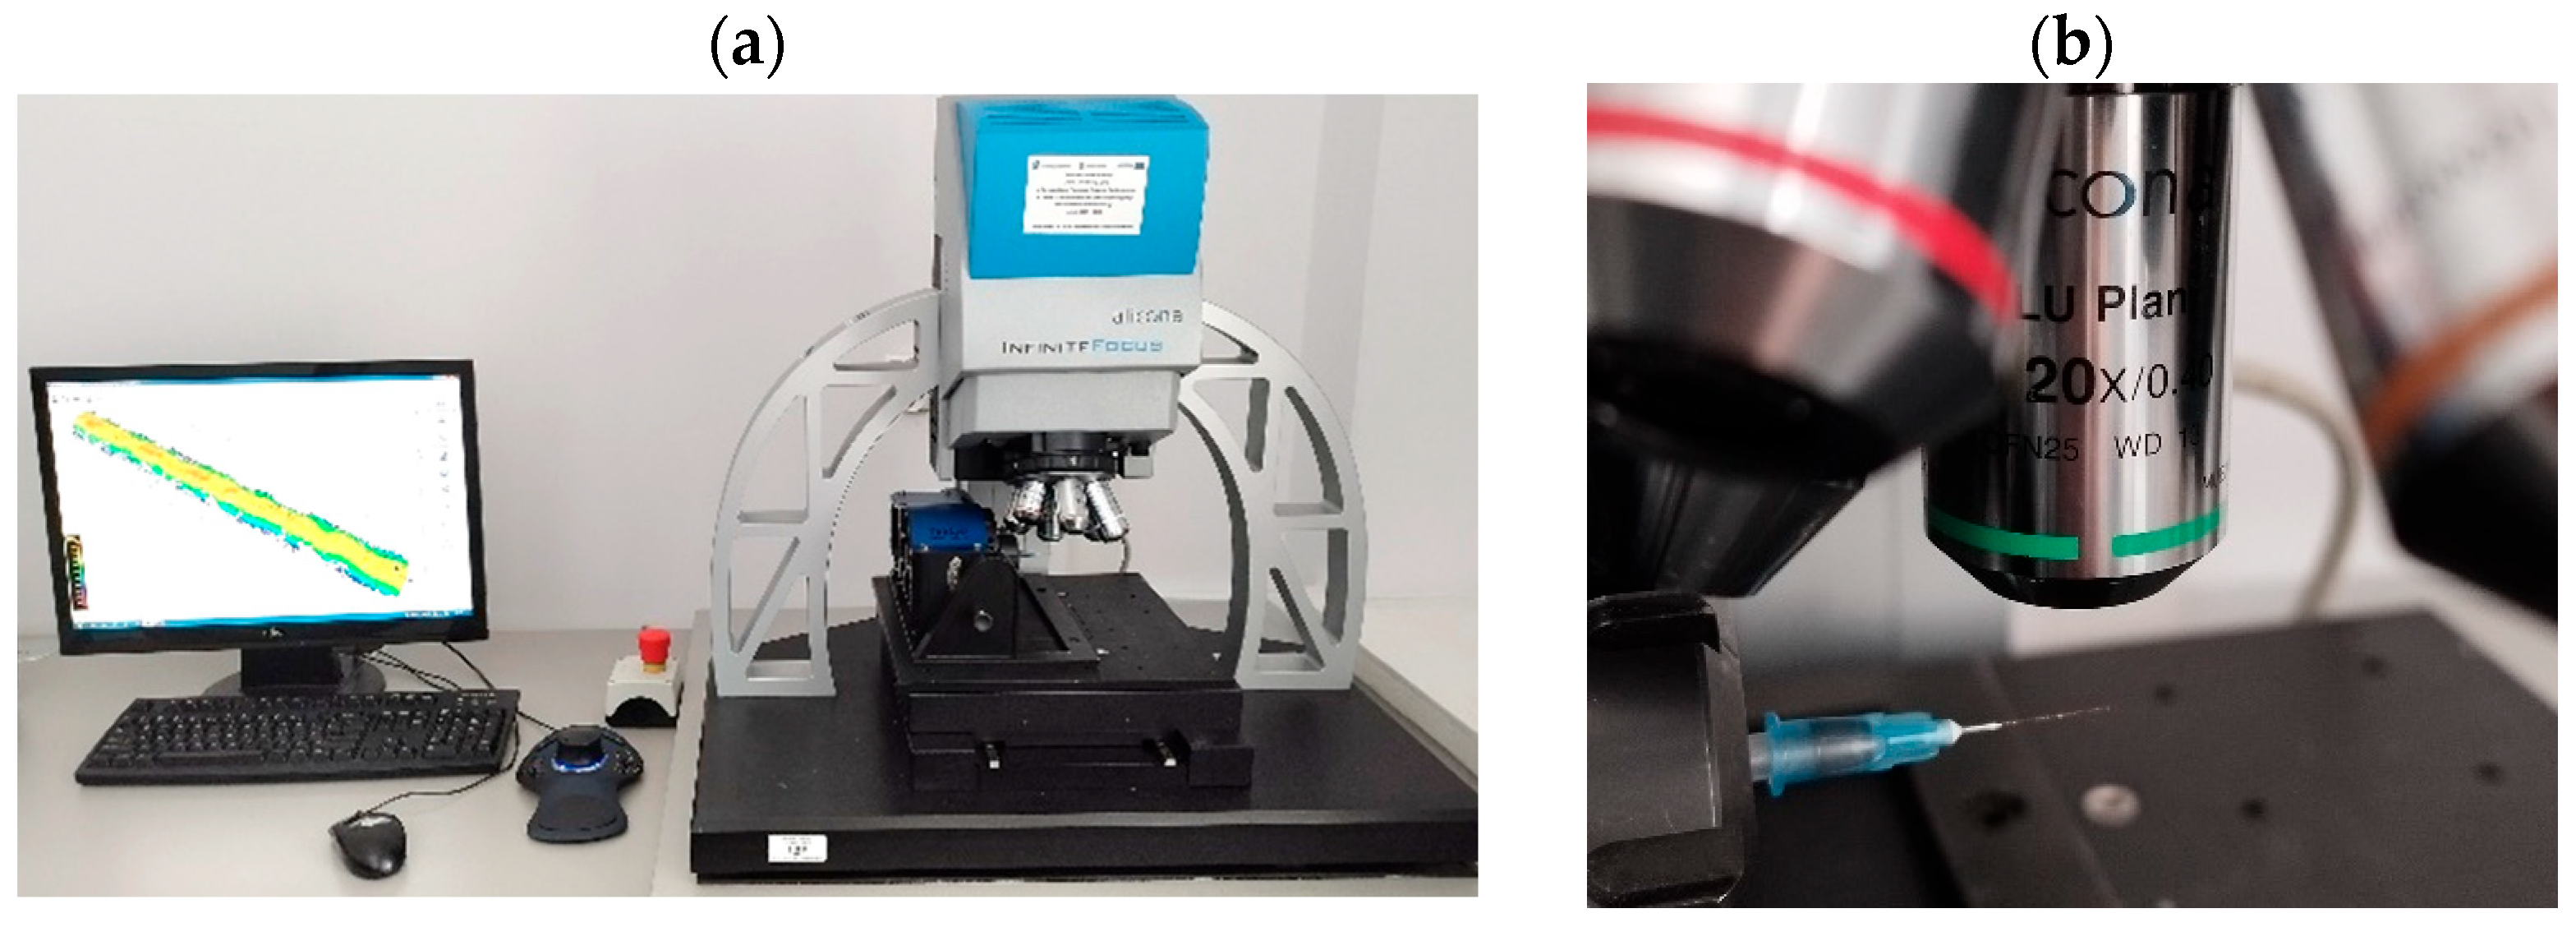
Surface texture measurement: (a) InfiniteFocus G4 microscope, (b) wire electrode measuring setup.
Figure 3.
Surface texture measurement: (a) InfiniteFocus G4 microscope, (b) wire electrode measuring setup.
Figure 4.
Methodology framework.
Figure 4.
Methodology framework.
Figure 5.
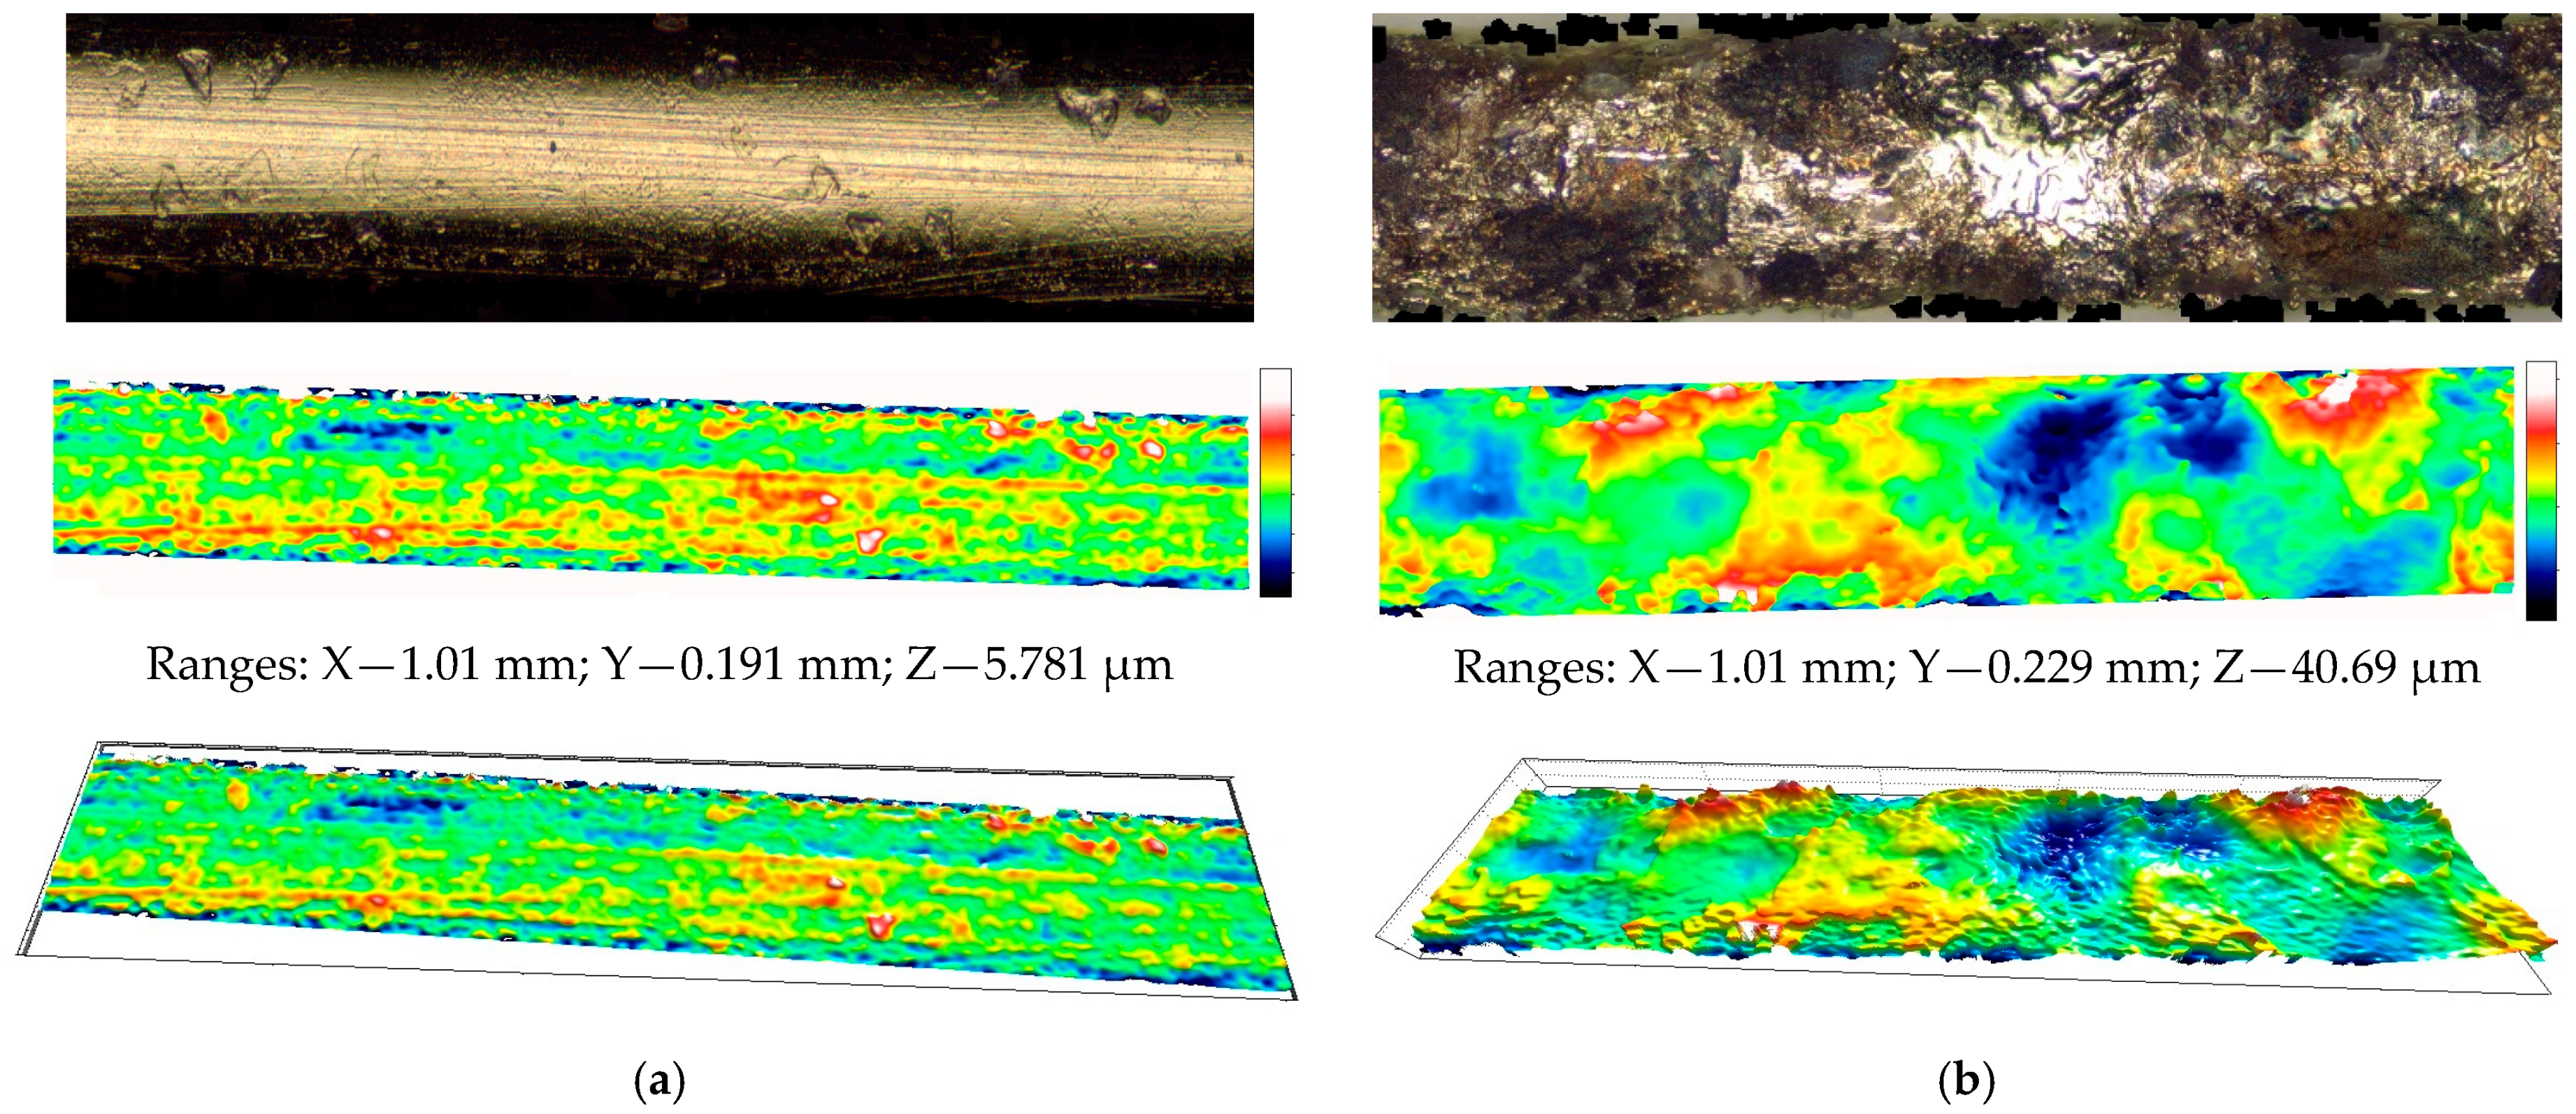
True color images, 2D and 3D pseudo-color maps of 1 mm long wire sections: (a) new wire; (b) worn wire (workpiece—42CrMo4, Ip = 12, toff = 1, h = 50).
Figure 5.
True color images, 2D and 3D pseudo-color maps of 1 mm long wire sections: (a) new wire; (b) worn wire (workpiece—42CrMo4, Ip = 12, toff = 1, h = 50).
Figure 6.
Section of a worn wire with a central area without visible discharge marks (area 0.7 mm × 0.2 mm).
Figure 6.
Section of a worn wire with a central area without visible discharge marks (area 0.7 mm × 0.2 mm).
Figure 7.
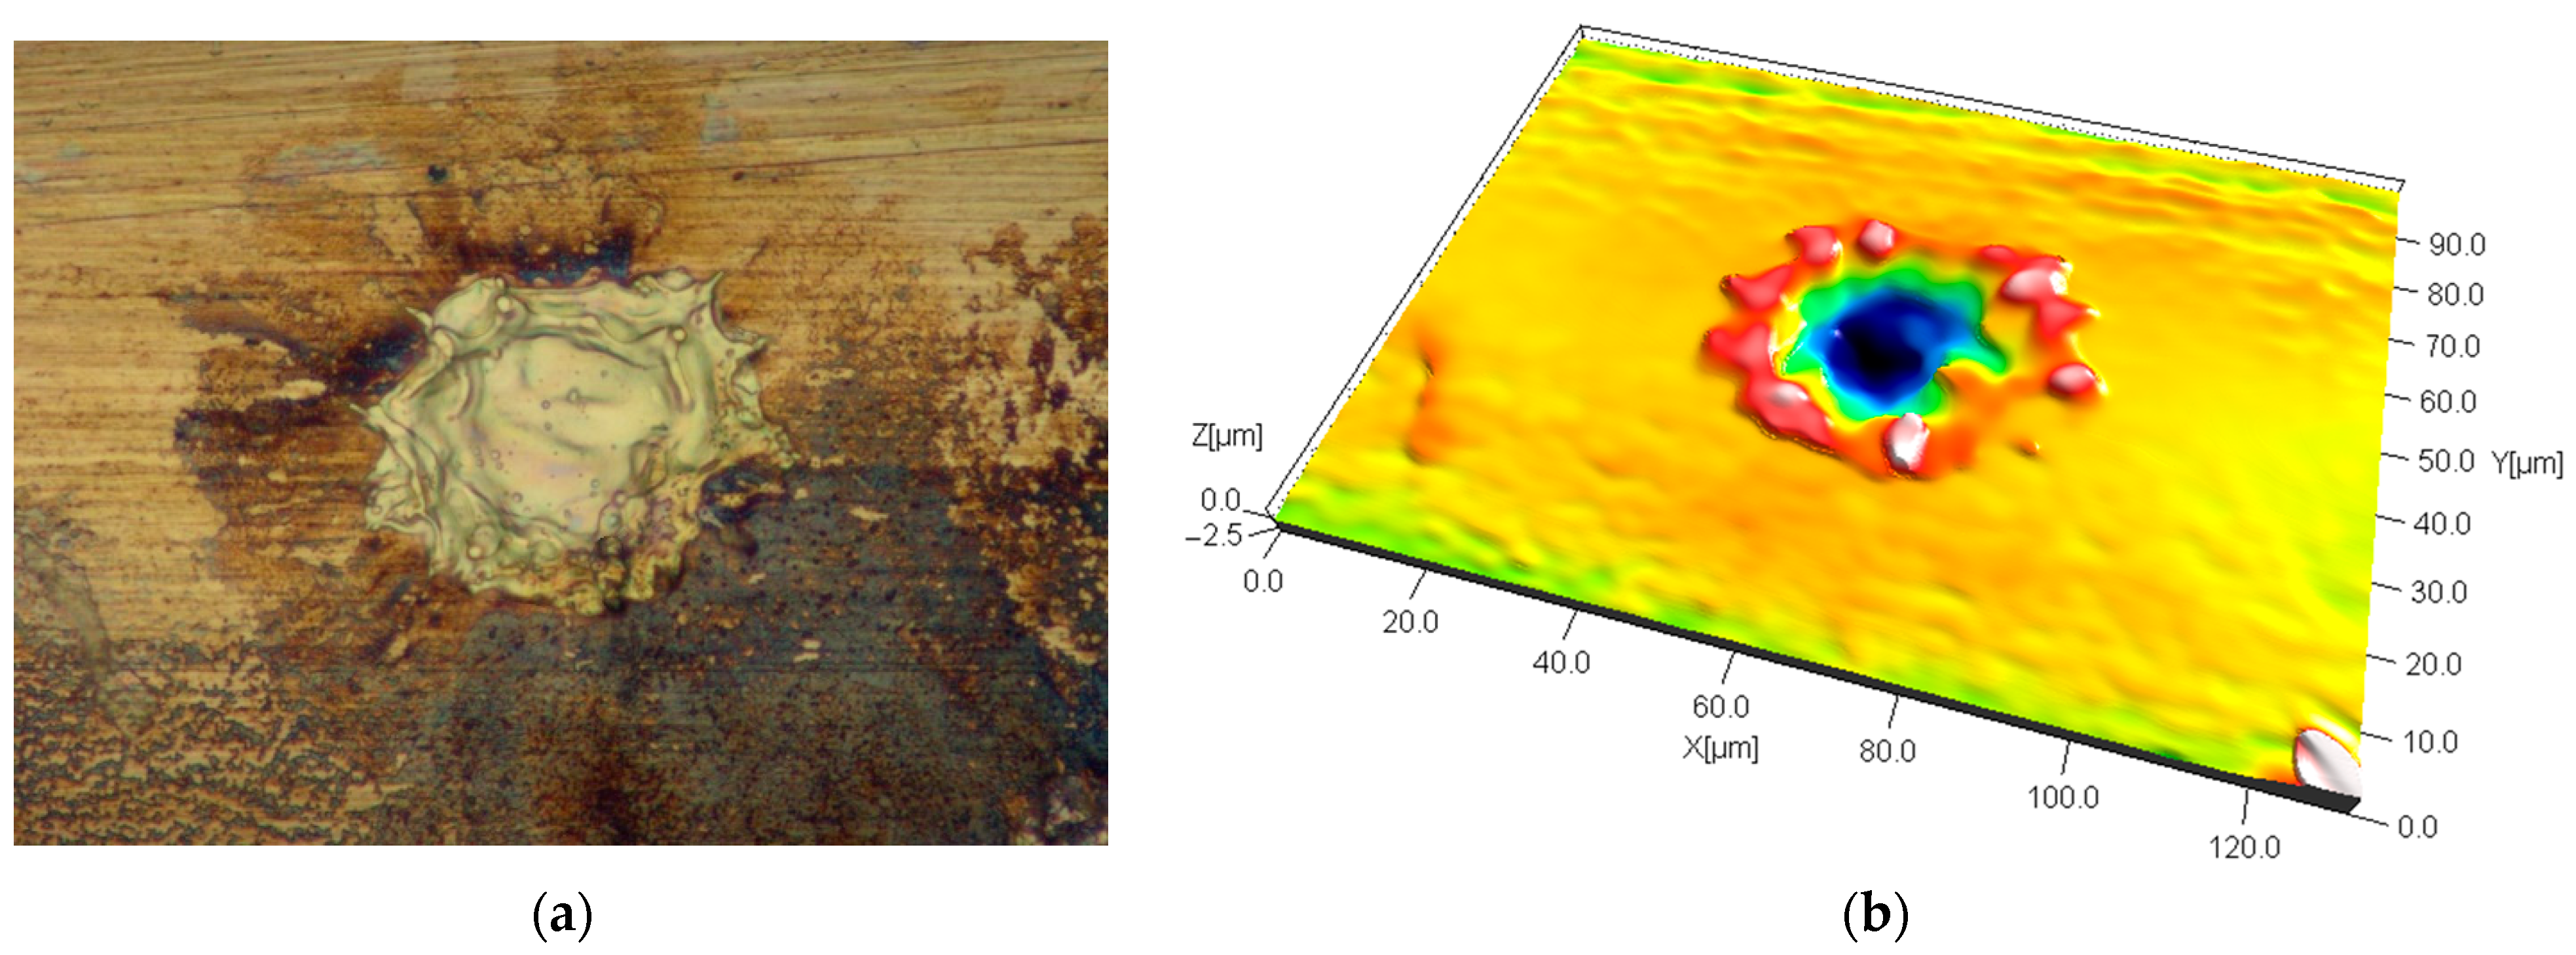
Image of a single discharge crater on the wire: (a) true color view, (b) 3D pseudo-color view (area: 0.1 mm × 0.13 mm) (workpiece: 42CrMo4, Ip = 12, toff = 1, h = 50).
Figure 7.
Image of a single discharge crater on the wire: (a) true color view, (b) 3D pseudo-color view (area: 0.1 mm × 0.13 mm) (workpiece: 42CrMo4, Ip = 12, toff = 1, h = 50).
Figure 8.
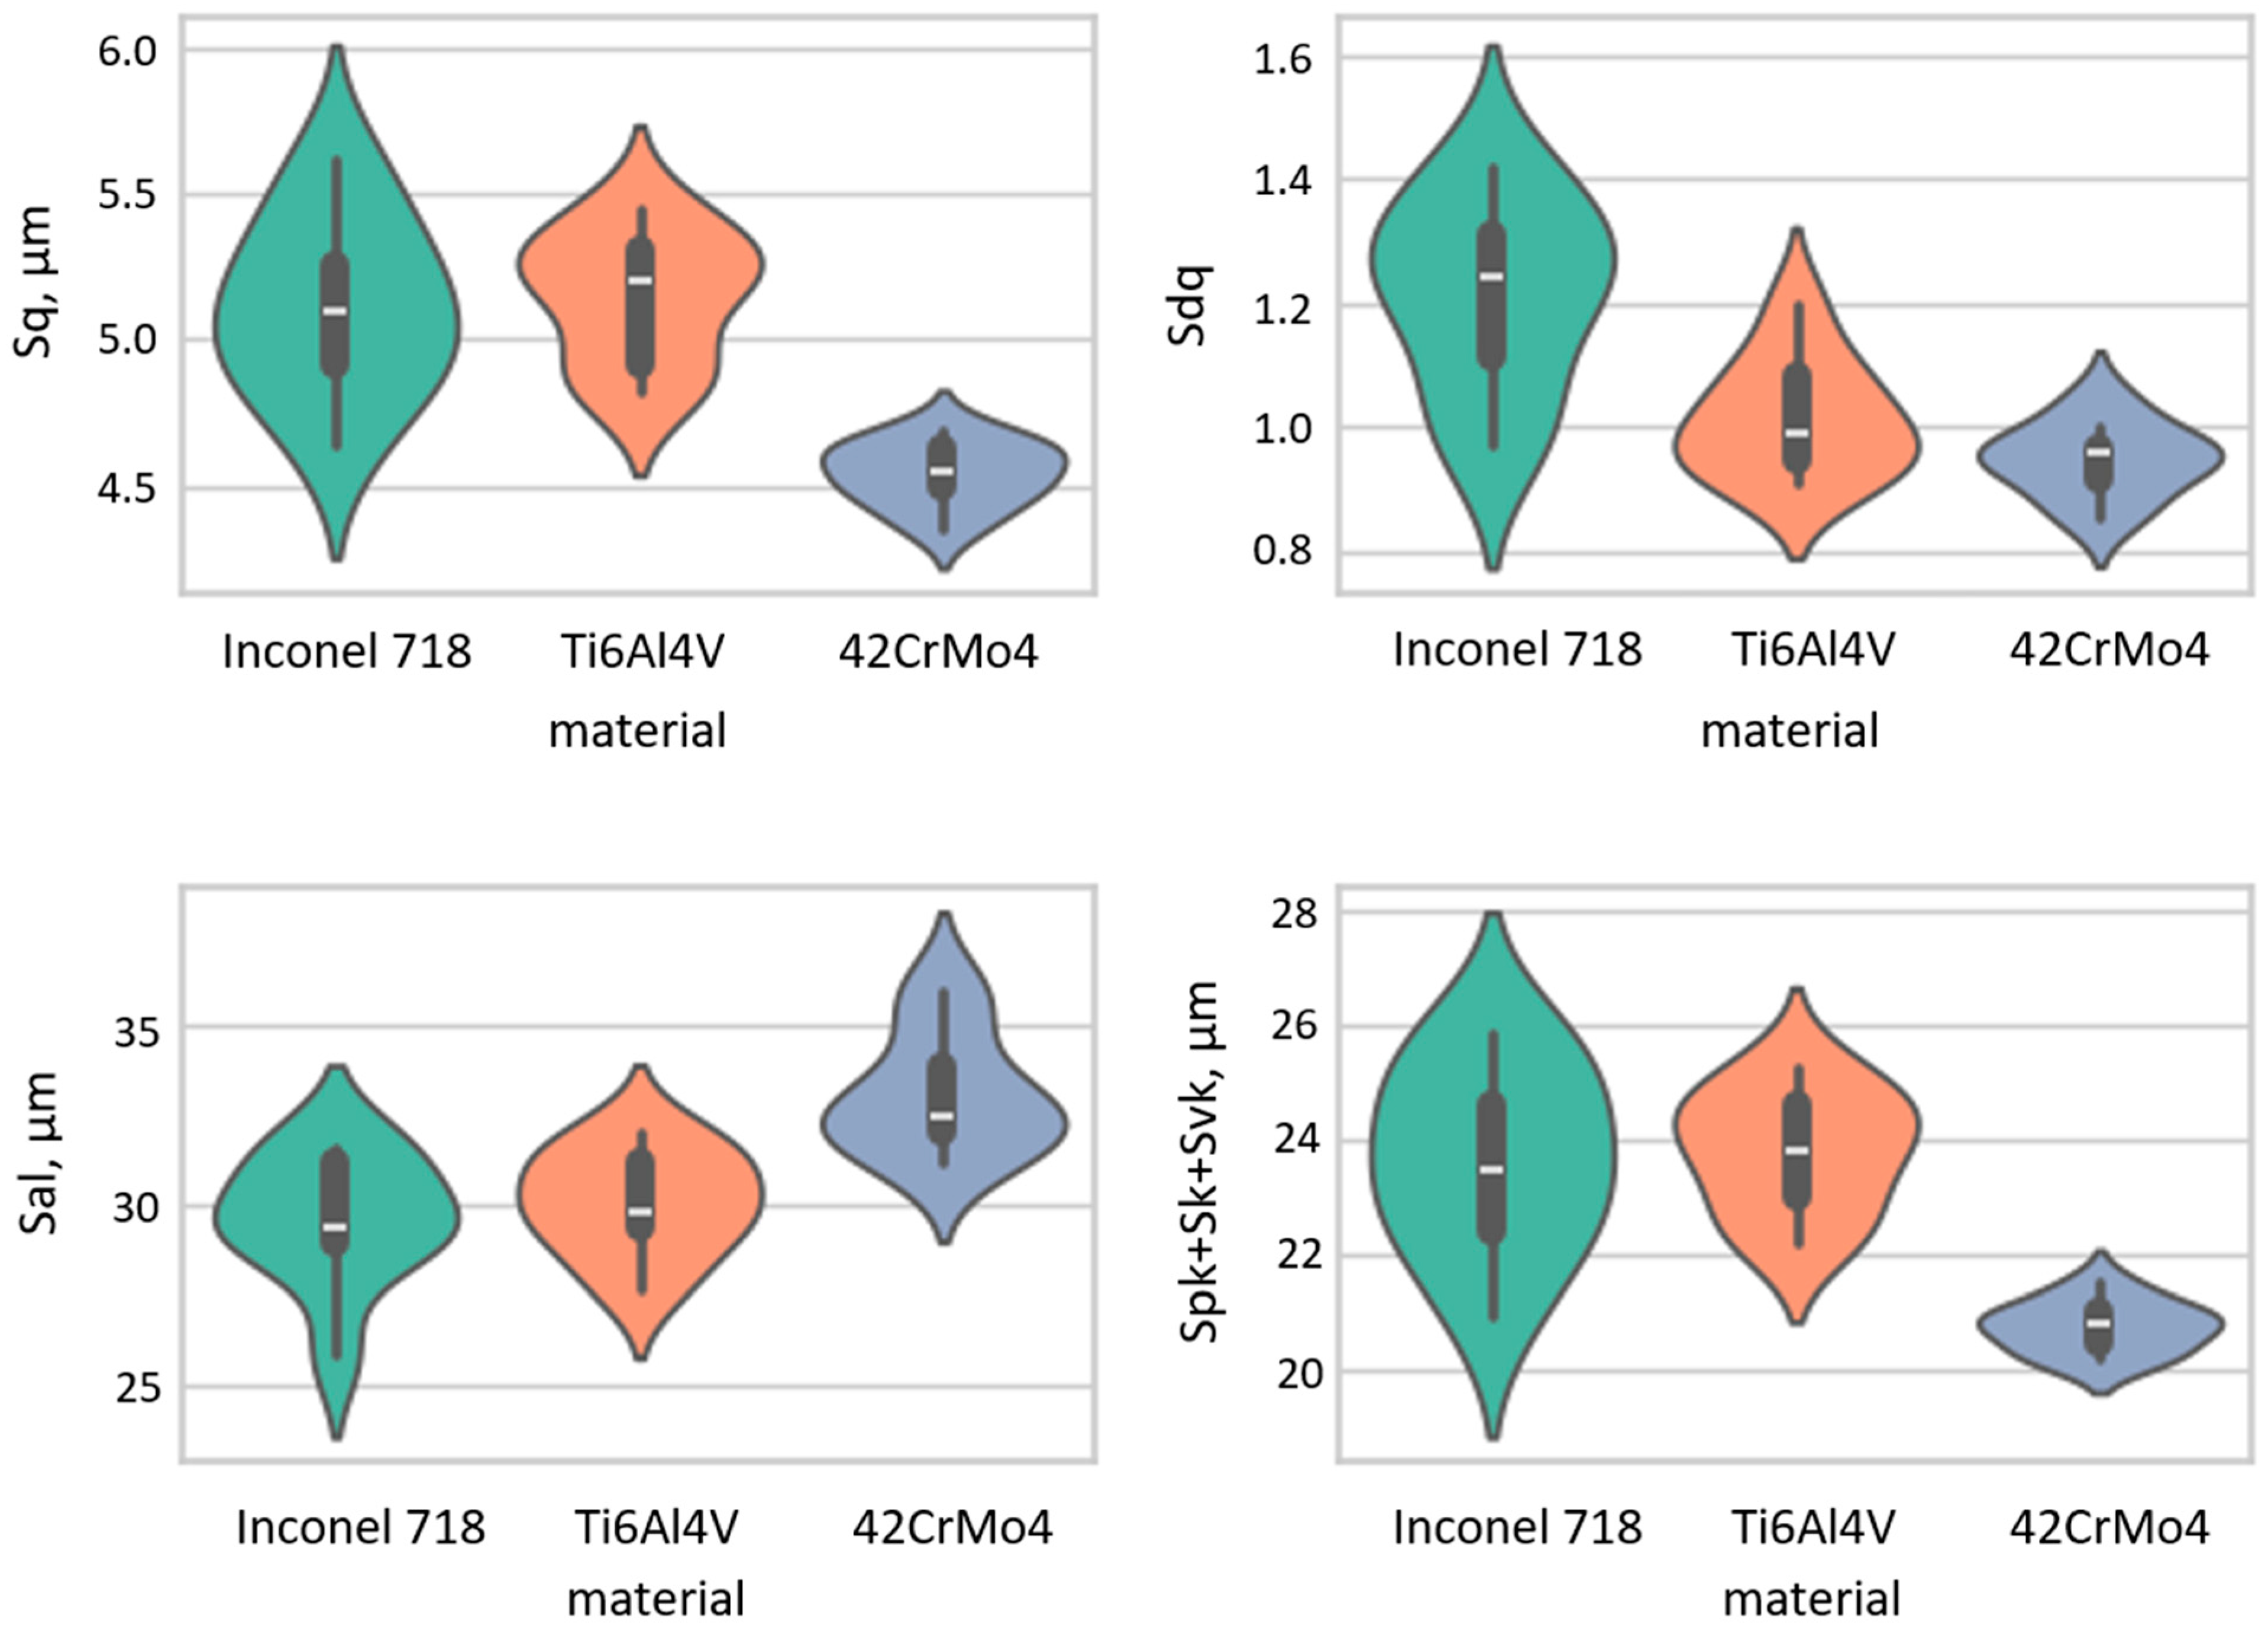
Influence of the workpiece material on the selected surface texture parameters of the wire (Ip = 12, toff = 1, h = 50).
Figure 8.
Influence of the workpiece material on the selected surface texture parameters of the wire (Ip = 12, toff = 1, h = 50).
Figure 9.
Comparison between selected surface texture parameters for two toff settings (workpiece: 42CrMo4, Ip = 12, h = 50).
Figure 9.
Comparison between selected surface texture parameters for two toff settings (workpiece: 42CrMo4, Ip = 12, h = 50).
Figure 10.
Influence of discharge current Ip on selected surface texture parameters of the wire electrode (workpiece: 42CrMo4, toff = 1, h = 50).
Figure 10.
Influence of discharge current Ip on selected surface texture parameters of the wire electrode (workpiece: 42CrMo4, toff = 1, h = 50).
Figure 11.
Influence of sample height h on selected surface texture parameters of the wire electrode (workpiece: 42CrMo4, Ip = 12, toff = 1).
Figure 11.
Influence of sample height h on selected surface texture parameters of the wire electrode (workpiece: 42CrMo4, Ip = 12, toff = 1).
Figure 12.
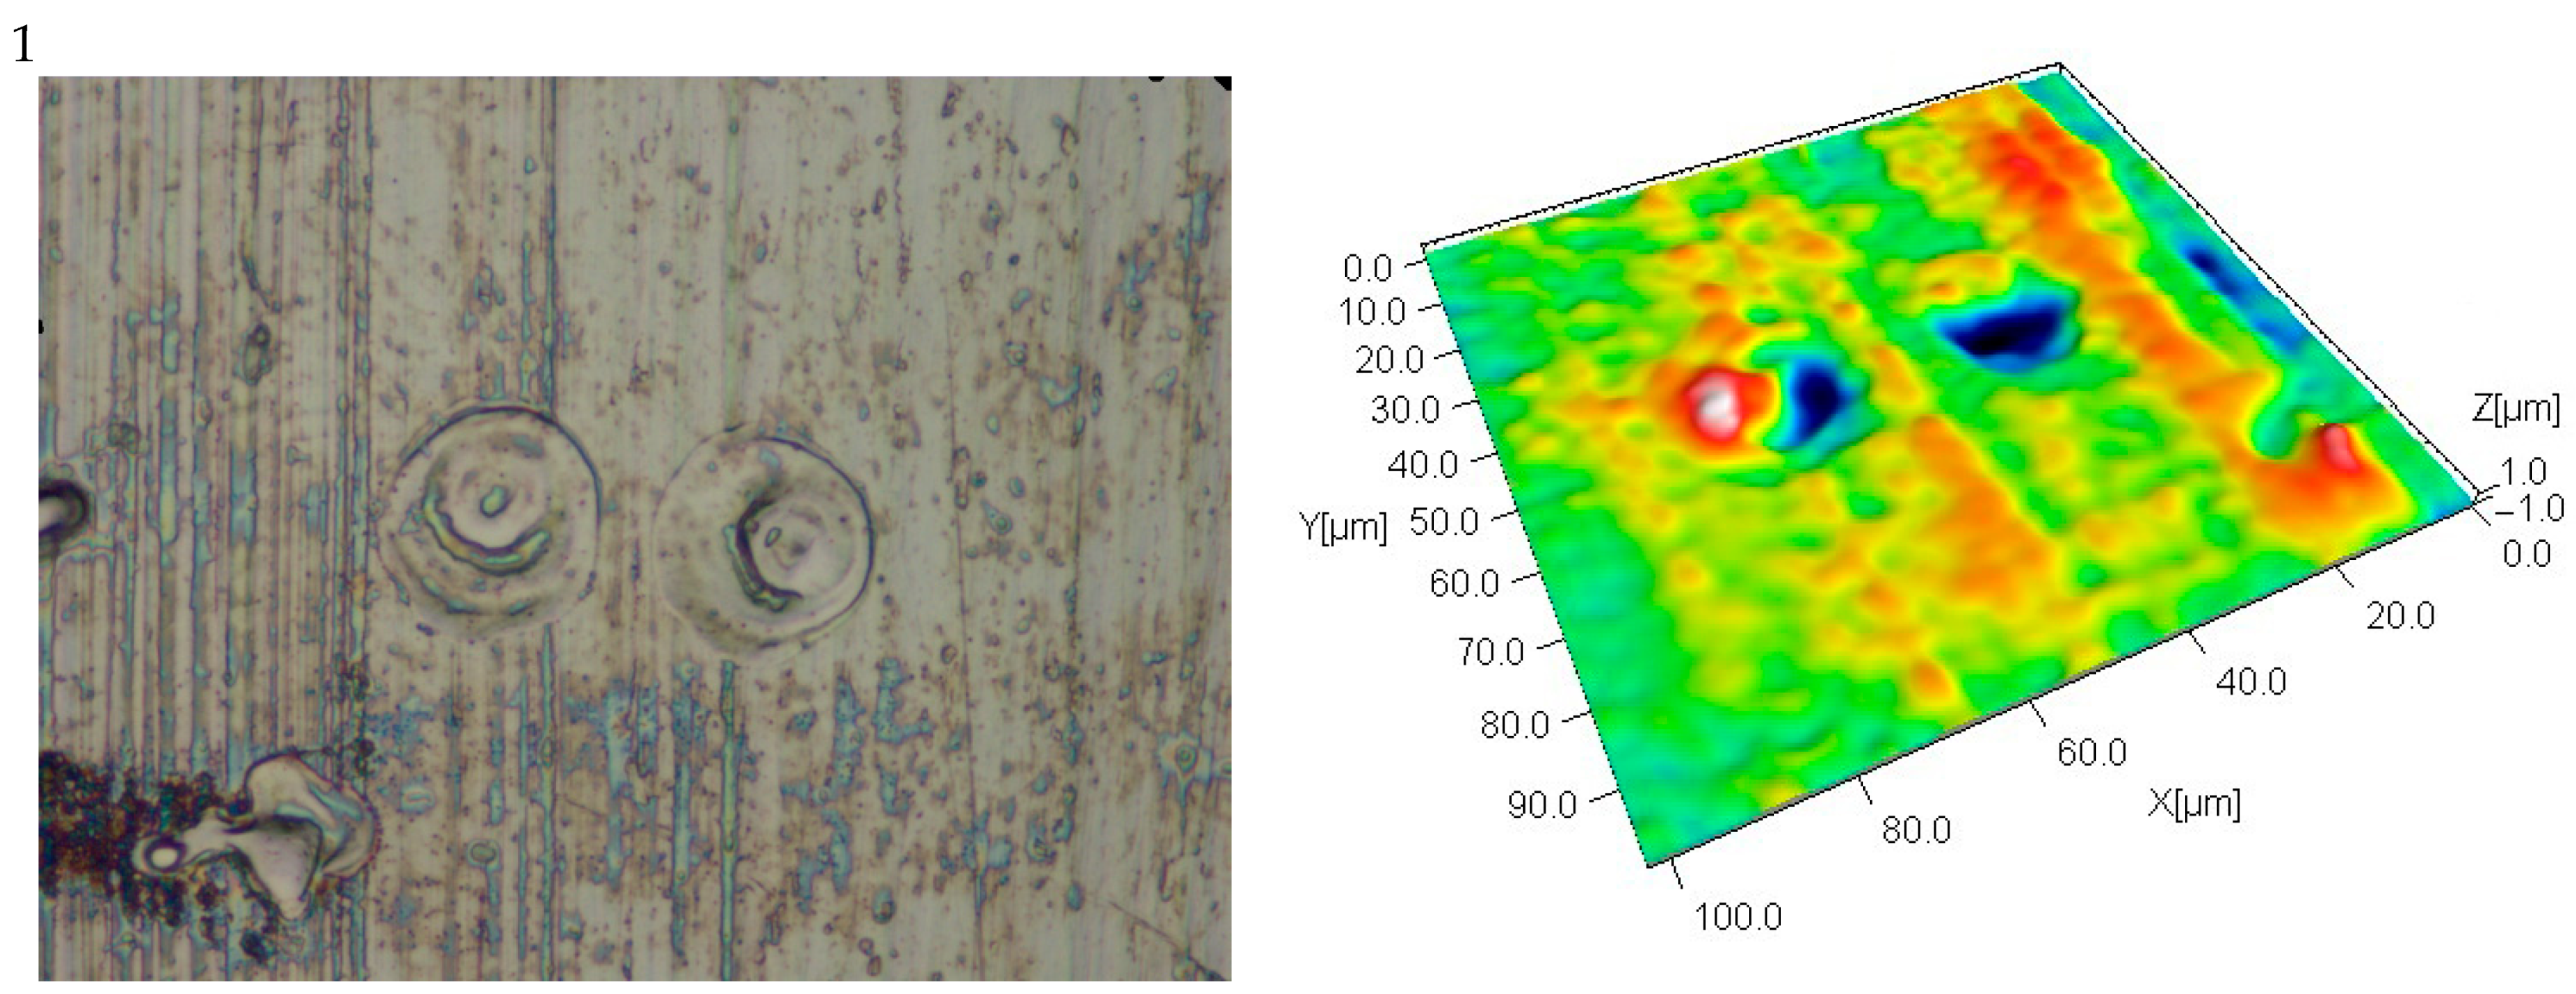
Representative images of individual discharge craters on the workpiece: (a) true color view, (b) 3D pseudo-color view. Dimensions of the two upper areas: 0.1 mm × 0.1 mm; bottom area: 0.2 mm × 0.2 mm (1—Ti6Al4V—Ip = 12, toff = 1, h = 50; 2—Inconel 718—Ip = 12, toff = 1, h = 50; 3—42CrMo4—Ip = 11, toff = 1, h = 50).
Figure 13.
Influence of the workpiece material on the selected surface texture parameters of the workpiece.
Figure 13.
Influence of the workpiece material on the selected surface texture parameters of the workpiece.
Figure 14.
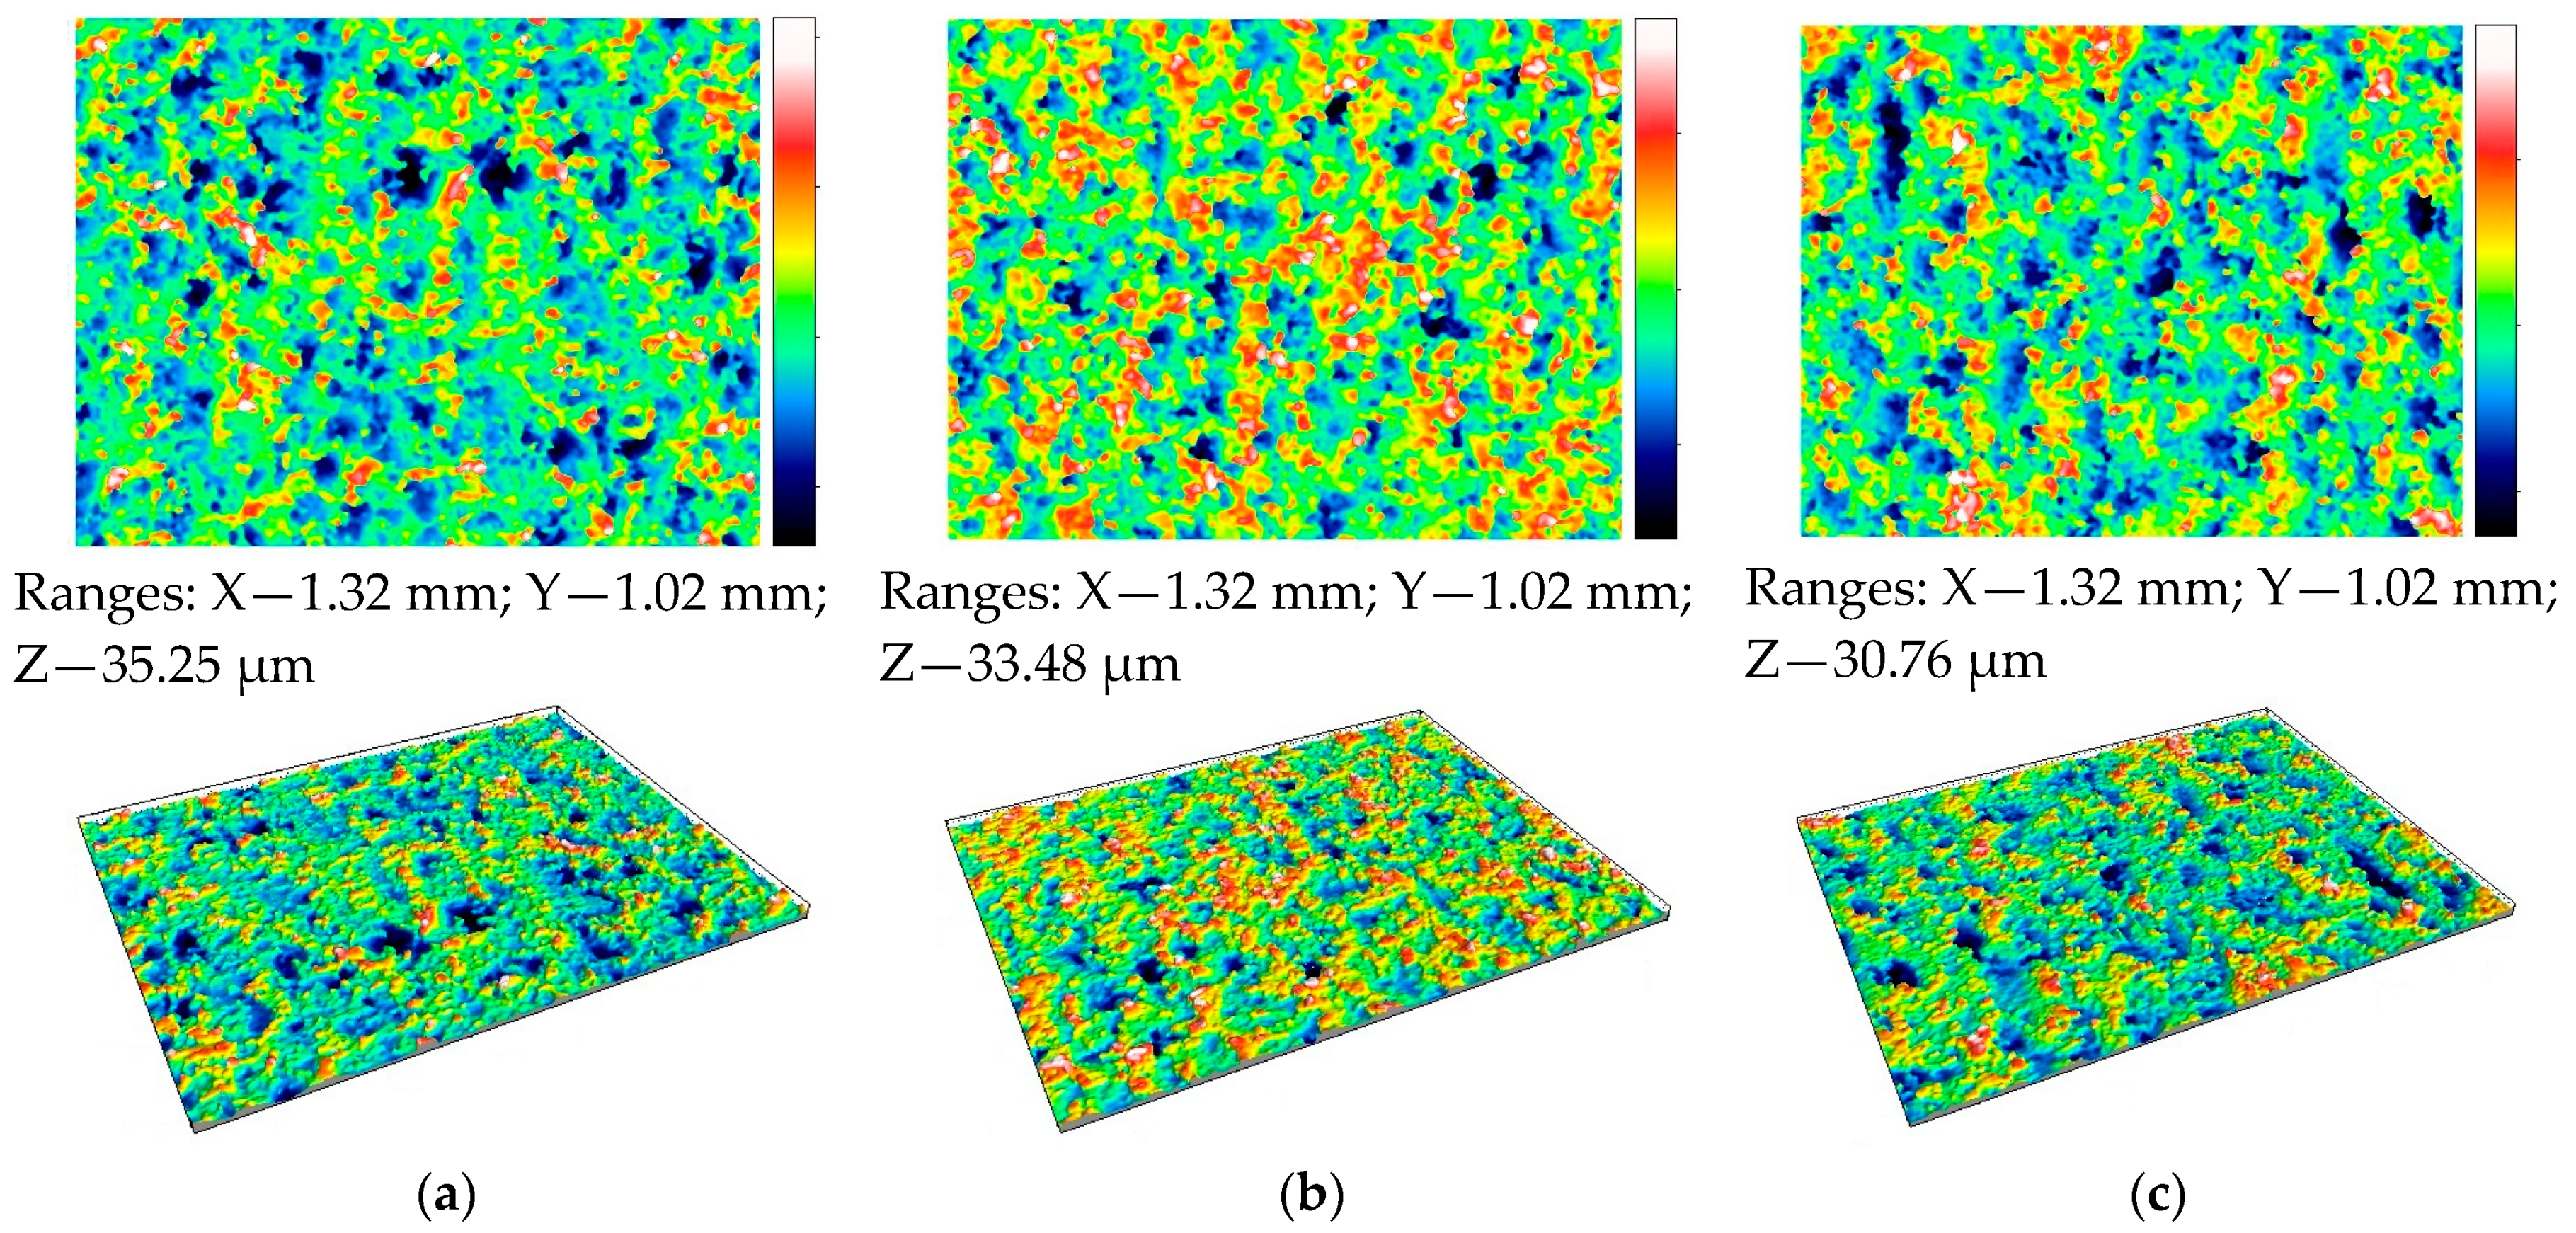
True color images, 2D and 3D pseudo-color maps of samples made from: (a) Inconel 718 (Ip = 12, toff = 1, h = 50); (b) Ti6Al4V (Ip = 12, toff = 1, h = 50); (c) 42CrMo4 (Ip = 11, toff = 1, h = 50) (visible area 1 mm × 1.3 mm).
Figure 14.
True color images, 2D and 3D pseudo-color maps of samples made from: (a) Inconel 718 (Ip = 12, toff = 1, h = 50); (b) Ti6Al4V (Ip = 12, toff = 1, h = 50); (c) 42CrMo4 (Ip = 11, toff = 1, h = 50) (visible area 1 mm × 1.3 mm).
Figure 15.
Comparison between selected surface texture parameters of the workpiece for two toff settings (workpiece: 42CrMo4, Ip = 12, h = 50).
Figure 15.
Comparison between selected surface texture parameters of the workpiece for two toff settings (workpiece: 42CrMo4, Ip = 12, h = 50).
Figure 16.
Influence of discharge current Ip on selected surface texture parameters of the workpiece (workpiece: 42CrMo4, toff = 1, h = 50).
Figure 16.
Influence of discharge current Ip on selected surface texture parameters of the workpiece (workpiece: 42CrMo4, toff = 1, h = 50).
Figure 17.
Influence of sample height h on selected surface texture parameters of the workpiece (workpiece: 42CrMo4, Ip = 12, toff = 1).
Figure 17.
Influence of sample height h on selected surface texture parameters of the workpiece (workpiece: 42CrMo4, Ip = 12, toff = 1).
Figure 18.
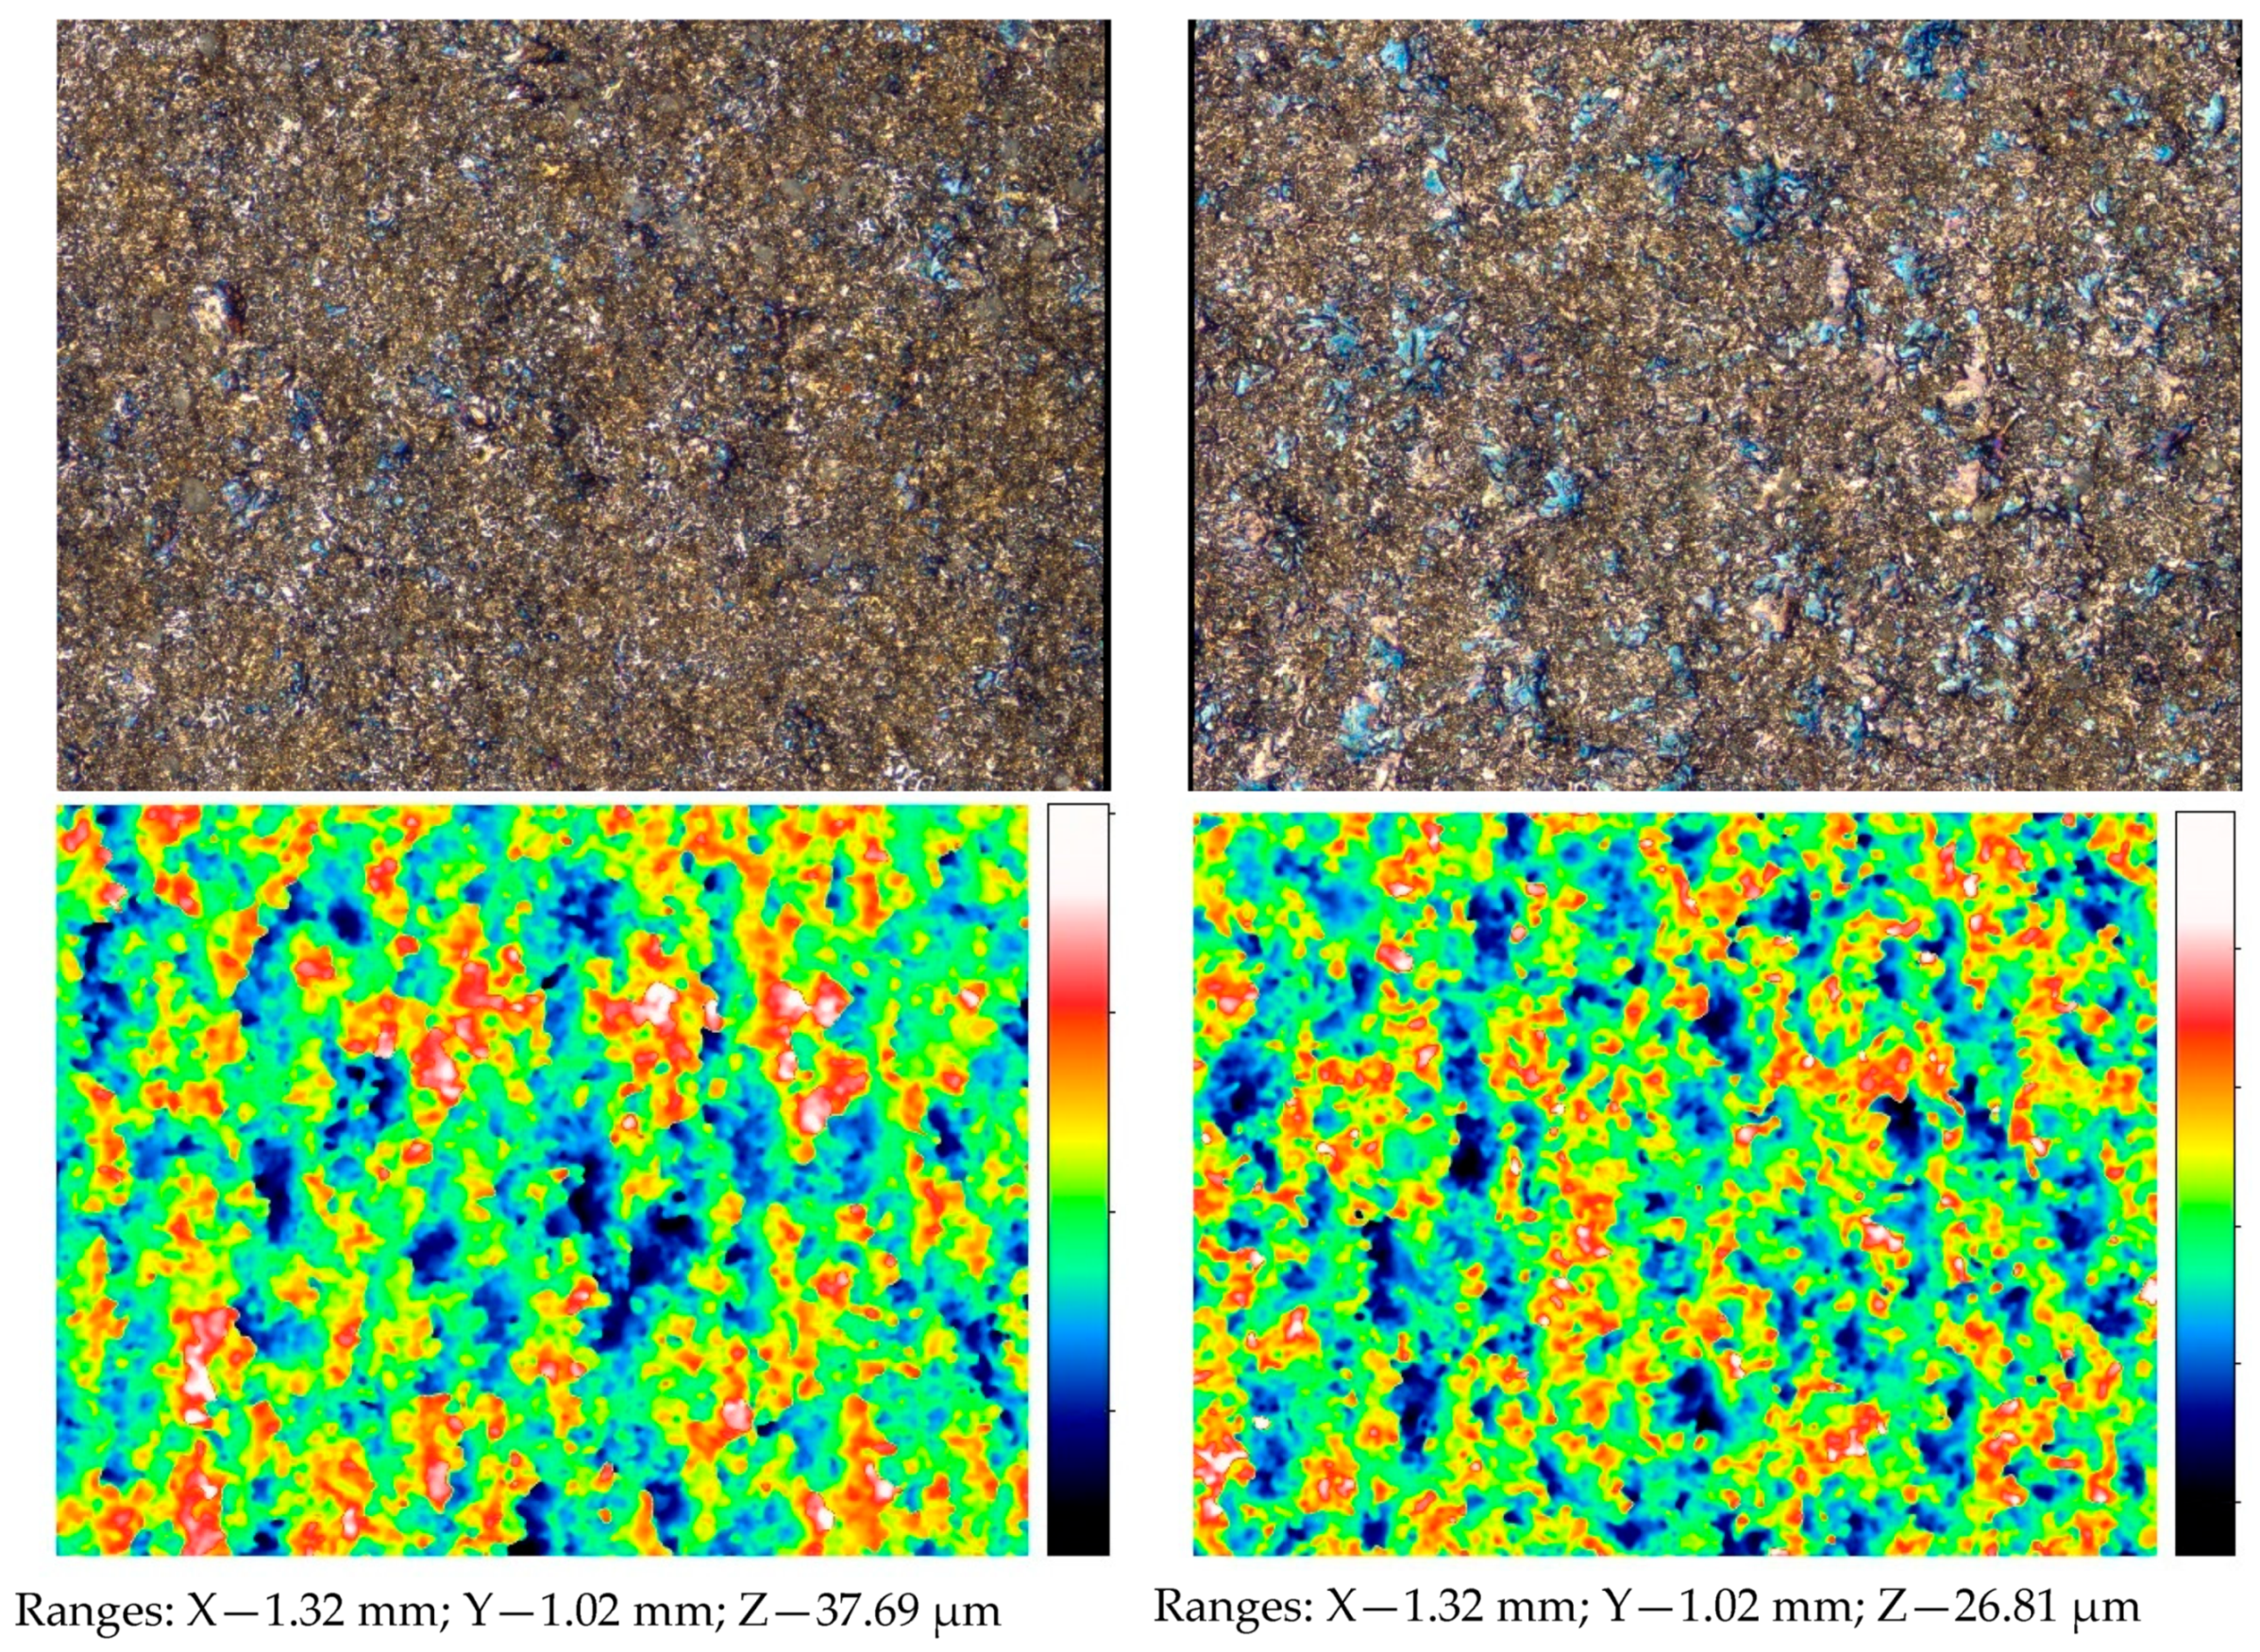
True color images, 2D and 3D pseudo-color maps of samples with: (a) h = 10 mm (workpiece: 42CrMo4, Ip = 12, toff = 1) (b) h = 160 mm (workpiece: 42CrMo4, Ip = 12, toff = 1).
Figure 18.
True color images, 2D and 3D pseudo-color maps of samples with: (a) h = 10 mm (workpiece: 42CrMo4, Ip = 12, toff = 1) (b) h = 160 mm (workpiece: 42CrMo4, Ip = 12, toff = 1).
Table 1.
Constant machining parameters.
Table 1.
Constant machining parameters.
| Technological Parameter | Value |
|---|
| Mean gap voltage Um, notch | 45 |
| Wire running speed Ws, notch | 12 |
| Wire feedrate vf, mm/min | 1.5 |
| Dielectric flow rate Fr, L/min | 10 |
| Wire tension Wt, notch | 14 |
Table 2.
Variable machining parameters and workpiece materials.
Table 2.
Variable machining parameters and workpiece materials.
| Technological Parameter | Value |
|---|
| Current Ip, notch | 4, 11, 12, 18 |
| Pulse off time toff, notch | 1, 2 |
| Workpiece height h, mm | 10, 50, 70, 160 |
| Material group | Alloy grade |
| Steel | 42CrMo4 |
| Nickel alloy | Inconel 718 |
| Titanium alloy | Ti6Al4V |
Table 3.
Chemical composition of Inconel 718, Ti6Al4V and 42CrMo4 [
43,
44].
Table 3.
Chemical composition of Inconel 718, Ti6Al4V and 42CrMo4 [
43,
44].
| Alloy | Mass Percent (Mass%) |
|---|
| | C | Si | Mn | Cr | Mo | Ni | Co | Ti | Al | Nb + T | P | S | Fe | Cu |
| Inconel 718 | Max 0.08 | Max 0.35 | Max 0.35 | 17.0–21.0 | 2.8–3.3 | 50.0–55.0 | 0.04 | 0.65–1.15 | 0.2–0.8 | 4.75–5.5 | Max 0.015 | Max 0.015 | 18.5 | Max 0.3 |
| | Ti | C | Fe | N | Al | O | V | H | Y | Other | - | - | - | - |
| Ti6Al4V | balance | 0.0111 | 0.105 | 0.0065 | 6.41 | 0.176 | 4.17 | 0.0015 | - | <0.40 | - | - | - | - |
| | C | Si | Mn | P | S | Cr | Mo | Ni | - | - | - | - | - | - |
| 42CrMo4 | 0.38–0.45 | ≤0.40 | 0.60–0.90 | ≤0.035 | ≤0.035 | 0.90–1.20 | 0.15–0.30 | - | - | - | - | - | - | - |
Table 4.
Comparison of surface texture parameters for new and worn wire electrodes (average values from all measured surfaces).
Table 4.
Comparison of surface texture parameters for new and worn wire electrodes (average values from all measured surfaces).
| Wire Electrode Condition | Sa, µm | Sq, µm | Spk + Sk + Svk, µm | Sdr, % | Sdq, - | Sal, µm |
|---|
| New | 0.61 | 0.80 | 3.66 | 4.36 | 0.33 | 10.09 |
| Worn | 4.04 | 5.18 | 23.76 | 48.64 | 1.30 | 35.77 |
Table 5.
Surface texture parameters of the wire electrode depending on the workpiece material.
Table 5.
Surface texture parameters of the wire electrode depending on the workpiece material.
| Material | Sa, µm | Sq, µm | Sdr, % | Sdq | Spk_Sk_Svk, µm | Sal, µm |
|---|
| Mean | SD | Mean | SD | Mean | SD | Mean | SD | Mean | SD | Mean | SD |
|---|
| Ti6Al4V | 3.99 | 0.32 | 5.06 | 0.43 | 46.74 | 12.12 | 1.29 | 0.19 | 23.39 | 2.26 | 36.85 | 3.35 |
| Inconel 718 | 4.00 | 0.21 | 5.16 | 0.32 | 46.93 | 10.64 | 1.31 | 0.20 | 24.18 | 2.34 | 33.56 | 5.82 |
| 42CrMo4 | 4.02 | 0.24 | 5.09 | 0.37 | 42.36 | 14.36 | 1.21 | 0.24 | 23.39 | 2.04 | 35.40 | 5.99 |
Table 6.
Mean values and standard deviation of surface texture parameters of the wire electrode influenced by toff setting.
Table 6.
Mean values and standard deviation of surface texture parameters of the wire electrode influenced by toff setting.
| Parameter | toff = 1 | toff = 2 | Diff, % | p-Value |
|---|
| Mean | SD | Mean | SD |
|---|
| Sq, µm | 5.09 | 0.37 | 4.76 | 0.26 | −6.49 | 0.034 |
| Spk + Sk + Svk, µm | 23.39 | 2.04 | 21.67 | 1.50 | −7.34 | 0.046 |
| Sa, µm | 4.02 | 0.24 | 3.81 | 0.21 | −5.26 | 0.048 |
| Sal, µm | 35.40 | 5.99 | 43.21 | 10.09 | +22.05 | 0.049 |
Table 7.
Mean values and standard deviation of surface texture parameters of the wire electrode influenced by Ip setting.
Table 7.
Mean values and standard deviation of surface texture parameters of the wire electrode influenced by Ip setting.
| Parameter | Ip = 4 | Ip = 18 | Diff, % | p-Value |
|---|
| Mean | SD | Mean | SD |
|---|
| Spk + Sk + Svk, µm | 24.95 | 1.76 | 22.53 | 2.20 | −9.7% | 0.038 |
| Sdq | 1.40 | 0.23 | 1.15 | 0.25 | −18.0% | 0.025 |
Table 8.
Mean values and standard deviation of surface texture parameters of the wire electrode influenced by sample height h.
Table 8.
Mean values and standard deviation of surface texture parameters of the wire electrode influenced by sample height h.
| Parameter | h = 10 | h = 160 | Diff, % | p-Value |
|---|
| Mean | SD | Mean | SD |
|---|
| Sq, µm | 5.41 | 0.38 | 5.52 | 0.57 | +2.0% | 0.017 |
| Spk + Sk + Svk, µm | 24.73 | 1.87 | 25.63 | 2.55 | +3.6% | 0.013 |
| Sdr, % | 53.06 | 15.24 | 77.51 | 25.31 | +46.1% | <0.001 |
| Sdq | 1.39 | 0.23 | 1.69 | 0.27 | +21.7% | <0.001 |
| Sal, µm | 32.68 | 5.37 | 28.91 | 2.94 | −11.5% | <0.001 |
Table 9.
Results of post hoc analysis indicating statistically significant differences in surface texture parameters for different workpiece materials.
Table 9.
Results of post hoc analysis indicating statistically significant differences in surface texture parameters for different workpiece materials.
| Parameter | A | B | Mean_A | SD_A | Mean_B | SD_B | Diff, % | p-Value |
|---|
| Sa, µm | Ti6Al4V | Inconel 718 | 4.07 | 0.19 | 3.94 | 0.21 | 3.3 | 0.229 |
| Ti6Al4V | 42CrMo4 | 4.07 | 0.19 | 3.6 | 0.09 | 13.06 | 0 |
| Inconel 718 | 42CrMo4 | 3.94 | 0.21 | 3.6 | 0.09 | 9.44 | 0.001 |
| Sq, µm | Ti6Al4V | Inconel 718 | 5.15 | 0.22 | 5.11 | 0.3 | 0.78 | 0.943 |
| Ti6Al4V | 42CrMo4 | 5.15 | 0.22 | 4.55 | 0.11 | 13.19 | 0 |
| Inconel 718 | 42CrMo4 | 5.11 | 0.3 | 4.55 | 0.11 | 12.31 | 0 |
| Spk + Sk + Svk, µm | Ti6Al4V | Inconel 718 | 23.82 | 1.06 | 23.69 | 1.64 | 0.55 | 0.979 |
| Ti6Al4V | 42CrMo4 | 23.82 | 1.06 | 20.78 | 0.44 | 14.63 | 0 |
| Inconel 718 | 42CrMo4 | 23.69 | 1.64 | 20.78 | 0.44 | 14 | 0.001 |
| Sdq | Ti6Al4V | Inconel 718 | 1.02 | 0.09 | 1.21 | 0.15 | 18.63 | 0.002 |
| Ti6Al4V | 42CrMo4 | 1.02 | 0.09 | 0.95 | 0.06 | 7.37 | 0.409 |
| Inconel 718 | 42CrMo4 | 1.21 | 0.15 | 0.95 | 0.06 | 27.37 | 0 |
| Sdr, % | Ti6Al4V | Inconel 718 | 34.57 | 5.32 | 46.13 | 9.29 | 33.44 | 0.017 |
| Ti6Al4V | 42CrMo4 | 34.57 | 5.32 | 30.12 | 2.91 | 14.77 | 0.11 |
| Inconel 718 | 42CrMo4 | 46.13 | 9.29 | 30.12 | 2.91 | 53.15 | 0.002 |
| Sal, µm | Ti6Al4V | Inconel 718 | 30.06 | 1.44 | 29.62 | 1.77 | 1.49 | 0.836 |
| Ti6Al4V | 42CrMo4 | 30.06 | 1.44 | 33.08 | 1.67 | 10.05 | 0.002 |
| Inconel 718 | 42CrMo4 | 29.62 | 1.77 | 33.08 | 1.67 | 11.68 | 0 |
Table 10.
Mean values and standard deviation of surface texture parameters of the workpiece influenced by toff setting.
Table 10.
Mean values and standard deviation of surface texture parameters of the workpiece influenced by toff setting.
| Parameter | toff = 1 | toff = 2 | Diff, % | p-Value |
|---|
| Mean | SD | Mean | SD |
|---|
| Sa, µm | 3.60 | 0.09 | 3.5 | 0.08 | −2.78 | 0.018 |
| Sq, µm | 4.55 | 0.11 | 4.42 | 0.10 | −2.86 | 0.023 |
| Sdq | 0.95 | 0.06 | 0.89 | 0.01 | −6.32 | 0.018 |
| Sdr, % | 30.12 | 2.91 | 27.21 | 0.68 | −9.66 | 0.017 |
Table 11.
Mean values and standard deviation of surface texture parameters of the workpiece influenced by Ip setting.
Table 11.
Mean values and standard deviation of surface texture parameters of the workpiece influenced by Ip setting.
| Parameter | Ip = 4 | Ip = 18 | Diff, % | p-Value |
|---|
| Mean | SD | Mean | SD |
|---|
| Spk + Sk + Svk, µm | 20.73 | 1.17 | 19.93 | 0.75 | −3.9 | 0.046 |
Table 12.
Mean values and standard deviation of surface texture parameters of the workpiece influenced by sample height h.
Table 12.
Mean values and standard deviation of surface texture parameters of the workpiece influenced by sample height h.
| Parameter | h = 10 | h = 160 | Diff, % | p-Value |
|---|
| Mean | SD | Mean | SD |
|---|
| Sa, µm | 4.34 | 0.11 | 3.09 | 0.07 | −28.7% | <0.001 |
| Sq, µm | 5.45 | 0.12 | 3.91 | 0.10 | −28.3% | <0.001 |
| Spk + Sk + Svk, µm | 24.82 | 0.83 | 18.33 | 0.76 | −26.2% | <0.001 |
| Sdr, % | 41.13 | 4.71 | 19.94 | 1.32 | −51.5% | <0.001 |
| Sdq | 1.14 | 0.08 | 0.74 | 0.03 | −35.1% | <0.001 |


