Abstract
Wafer cleaning after chemical mechanical planarization (CMP) is a critical processing step for copper metallization in integrated circuits. Post-CMP cleaning (PCMPC) commonly combines surface (electro)chemistry with the tribology of brush scrubbing to remove CMP residues from wafer surfaces. While the complex mechanisms of brush-operated PCMPC are supported by this combination, the conventional electroanalytical methods of assessing PCMPC efficiency are typically operated in the absence of surface brushing. Using a model experimental system with tartaric acid (TA) as a cost-effective cleaner of Cu-oxides, we illustrate here how post-CMP Cu samples can be electrochemically examined using brush cleaning to design/assess PCMPC test solutions. A pH-neutral cleaning solution is employed, where TA also serves as a partial dissolution suppressor of Cu, and CMP-treated wafer samples are scrubbed with a commercial PCMPC brush as sample surfaces are simultaneously probed with electrochemical measurements. The results show the active roles of tribology/lubrication and surface chemistry in the removal of CMP residues. The electrochemically determined residue removal efficiencies of PCMPC are found to be ~97% and ~56% in the presence and in the absence of surface brushing, respectively. The implications of these findings are explored in the general context of evaluating PCMPC formulations.
1. Introduction
The integration of copper wiring lines into the back end of line (BEOL) involves a series of complex processing steps, which include the chemical mechanical planarization (CMP) of wafers and post-CMP cleaning (PCMPC) of CMP residues. The central topic of this present investigation is the tribo-electrochemical evaluation of effective PCMPC strategies for Cu. This is explored using a specific test system for PCMPC. Typical CMP residues of Cu include organometallic complexes, Cu-oxides, chemisorbed organic molecules, and abrasive particles. A main requirement of PCMPC is to effectively remove these problematic residues so that device functions are not affected. Commercial PCMPC solutions contain several chemical additives, each with its own individual cleaning function [1,2]. While designing a complex PCMPC solution, it is often necessary to evaluate, in a step-wise systematic approach, the individual roles of the cleaning agents being considered. Our present investigation adapts this latter approach, with specific attention to the component of cleaning Cu-oxide residues from CMP-processed Cu films. Most published reports of PCMPC strategies for Cu have traditionally focused on cleaning abrasive particles and organic residues of CMP, while the corresponding considerations for Cu-oxide cleaning have been studied to a comparatively lesser extent [2,3,4,5].
Despite its relatively underexplored status, the cleaning of Cu-oxide contaminants represents a vital component of Cu-PCMPC. Even if the initial quantities of Cu-oxide residues are relatively small after CMP, the post CMP cleaning process itself often introduces considerable amounts of CuO/Cu2O impurities to the wafer surface [6]. For instance, the Cu-undercut method, which typically aims at removing persistent organic residues, involves the controlled etching of Cu as Cu2+ or Cu-complex ions. These ions can transfer to the scrubbing brush and react with organic residues left on the brush to be converted into Cu-oxide particles that are subsequently transferred back to the Cu surface being cleaned [7]. A similar situation can arise from the oxide conversion of Cu2+ released by the photo-corrosion of Cu during PCMPC [8]. Furthermore, Cu-oxide surface sites have been correlated with the formation of Cu hillocks responsible for decreased device performance [9]. Cu-oxide residues also increase particle contaminations, for instance, by acting as oxygen-bridged binding sites for silica abrasives [6,10]. These considerations underscore the importance of adequate oxide cleaning in PCMPC.
Electrochemical techniques are commonly used for studying metal/alloy PCMPC [11,12,13,14,15,16,17] and CMP [18,19,20,21] systems since the chemical components of these processes typically originate from mixed-potential reactions that respond to electrochemical probes. However, the mechanical component of PCMPC is facilitated by surface-scrubbing with a poly(vinyl alcohol) (PVA) brush [2,22], and this component is rarely included in electrochemical studies of PCMPC. The synergistic roles of tribology/lubrication and chemistry in the PCMPC process remain largely unexplored in this experimental approach. In recent years, we addressed this issue in a laboratory-scale setting by using a custom-designed tribo-electrochemical cell to combine both the chemical and mechanical components of PCMPC. The present work extends the protocols explored in our recent PCMPC studies [11,12,23].
As a model PCMPC system for this study, a pH-neutral aqueous cleaning solution is employed with DL-tartaric acid, TA (C4H6O6 = H2T), as a potential remover of Cu-oxide residues from CMP-treated Cu. A neutral-pH cleaning environment is chosen to minimize corrosion-related defectivity issues that are linked to strong acidic and alkaline cleaning solutions [12]. According to our previous findings, when dissolving Cu-oxides in PCMPC, carboxylic acids tend to be most effective in their deprotonated forms [11,12]. The specific selection of TA as an oxide cleaner is based on this observation as TA readily deprotonates at the neutral pH (a calculated speciation diagram of TA is included in the Supplementary Materials). To prepare the surface residues for PCMPC, we use an abrasive free solution at pH = 6, containing H2O2 as an oxidizer, glycine, H3Gly (Gly = H2C2 NO2), as a surface modifier, and benzotriazole (BTA) as a dissolution inhibitor. This specific CMP system has been extensively studied previously [24,25,26,27], and is selected here to facilitate the analysis of new PCMPC results by utilizing the available knowledge about the reaction products (surface residues) of CMP.
The experiments involve tribology-controlled measurements of open-circuit potential (OCP) transients, cyclic voltammetry (CV), and potentiodynamic polarization using linear sweep voltammetry (LSV), exploring both low and high overpotentials; all these measurements are conducted with and without the operation of a PVA scrubbing brush to examine the tribo-electrochemical aspects of PCMPC. The results are analyzed using an established framework of mixed-potential theory [28]. Detailed mechanisms of PCMPC are determined from this analysis. The experiments are designed to demonstrate a strategic combination of tribology and electrochemistry to bring out the detailed mechanisms of a PCMPC process.
2. Materials and Methods
2.1. Test Samples and Surface Cleaning Materials
Rectangular coupons of typical dimensions, 10 cm × 1.5 cm, were cut out from 200 mm diameter copper blanket wafers and used as experimental samples in a brush cell containing a PCMPC solution of TA. Each wafer consisted of 100 nm thick physical vapor-deposited Cu film, with underlying layers of Ta and tetraethyl orthosilicate, supported by a Si substrate. The spatial uniformity of each wafer was checked by measuring sheet resistances using a Jandel CYL-HM21 Four Point Probe (Jandel Corp., Leighton Buzzard, UK). The measured sheet resistivity of Cu was 2.19 × 10⁻⁸ Ω·m, which was higher than the bulk resistivity of Cu, at 1.72 × 10⁻⁸ Ω·m. No considerable variations in the wafer resistivity were observed in sample-to-sample examinations using the same batch of wafers. The in situ experiments were designed to study the tribo-electrochemical mechanisms of PCMPC. Rectangular Cu samples of typical dimensions, 6 cm × 1.5 cm, were also cut out from the aforesaid blanket wafers for use in ex situ electrochemical measurements that were aimed at measuring the residue removal efficiency (RRE) of PCMPC. For both the in situ and ex situ measurements, the rectangular pieces of Cu samples were used as working electrodes (WEs) in the corresponding test cells. The sample dimensions were measured using a digital slide caliper with a resolution of 0.01 mm. The effective electrode areas determined based on these measurements had <2% uncertainties.
CMP and PCMPC solutions were prepared using triple-distilled water and reagent-grade chemicals (95% purity) obtained from Sigma Aldrich (St. Louis, MO, USA) and Fischer Scientific (Waltham, MA, USA). The PCMPC solution contained 0.1 M DL-Tartaric acid (pKa = 2.89, 4.40), adjusted with ammonium hydroxide to a pH of 6.99. A sensing solution of 0.1 M KNO3 at pH = 7.00 (adjusted using KOH) was used to determine the RREs of the PCMPC test solution with and without brush scrubbing. The PCMPC cell was equipped with a Planarcore PVA brush, manufactured, and supplied by Entegris (Danbury, CT, USA). The Cu wafer samples were also provided by Entegris.
2.2. CMP Pretreatment of Cu Wafer Samples
Cu wafer coupon samples were CMP-pretreated by immersion for 1 min in a CMP solution, followed by rinsing in distilled water. The samples were then dried prior to their incorporation into the PCMPC brush cell. The CMP solution contained an aqueous mixture of 0.01 M H3Gly, 1 mM BTA, and 0.1 wt.% H2O2 at pH = 6. The H2O2 content of this CMP formulation was limited to a relatively low value to minimize the possibility of the emergence of surface defects, which are often linked to H2O2 [29]. The abrasion-free slurry composition was chosen to selectively bring out the PCMPC aspects of oxide/co-adsorbate removal without any overlapping effects of abrasive removal. This approach also helped to utilize several practical advantages of abrasive-free CMP formulations, including defect mitigation, cost reduction, and simplified waste management [30,31,32,33].
2.3. Operation of PCMPC Brush Cell
The design and the operational procedures for the tribo-electrochemical brush cell have been previously described in detail [11]. In brief, the cell had a glass container and a Teflon cover equipped with adapters for electrode inlets and the brush rotor axel. For ease of reference, a schematic diagram of the cell is included here in Figure 1. A 2.5 cm wide rectangular stainless-steel strip was used as a counter electrode (CE) in the three-electrode tribo-electrochemical test cell. A saturated calomel electrode (SCE) served as the reference electrode (RE). The placements of the WE, RE, and CE are indicated in Figure 1. A salt bridge (SB) was used to avoid the direct immersion of the RE in the solution. The PVA brush was cut to fit in the cell, as shown, and was rotated with a computer-controlled motor at a speed of 60 RPM. The PCMPC solution also served as the test cell’s electrolyte. The length of the SB was 29.2 cm, and one of its ends was placed 1.5 cm away from the RE; the other end of the SB was located 4.2 cm away from the WE’s surface. The CE was placed in parallel with and at a distance of 1.0 cm away from the WE.
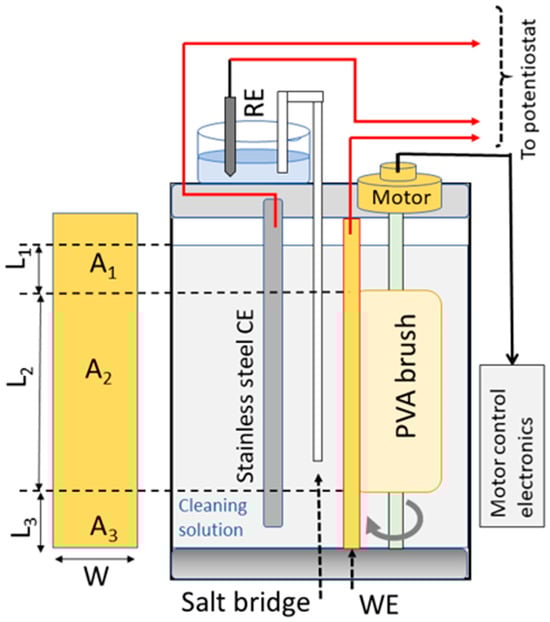
Figure 1.
The schematic on the right side shows the brush-equipped PCMPC test cell used for tribology-coupled electrochemical measurements. The rectangular strip shown on the left is a schematic representation of a Cu wafer sample’s front surface that is subjected to brushing. The three area sectors of the sample and their locations in the cell are indicated. When introduced into the cell, the PVA brush is pressed against the WE (Cu sample), covering the area A2.
Teflon fasteners (not shown in the schematic in Figure 1) held the WE sample stationary, and the brush was pressed against the WE surface at a brush gap of −1 mm. This brush gap was chosen in view of previously reported considerations for minimizing PCMPC defects linked to brush contacts [34,35,36]. As shown in the left side of Figure 1, the geometric area of the sample exposed to the cleaning solution was divided into three parts. In this figure, A1 and A3 are for the parts, respectively, above and below but not in contact with the brush; A2 is for the part subjected to brush scrubbing.
Typical lengths of the three sectors indicated in Figure 1 were as follows: L1 between 0.73 and 1.13 cm; L2 between 8.40 and 8.91 cm; L3 between 0.78 and 0.89 cm. The sample width, w, was generally maintained close to a value of 1.5 cm. The volume of the test cell’s main chamber was 1.5 L, and when present in the cell, the PVA brush displaced ~334 mL of the solution. In the brush-free experiments, this brush volume was compensated for by adding the necessary amount of solution to the cell so that the height, L3 + L2 + L1, remained unchanged between the brush-free and brush-operated cells. Due to the brush’s pressed contact with the sample surface, the electrochemically operative effective area (Aeff) of the WE’s brushed region was different from the value of A2. The Aeff values for different sample treatments were determined as described previously by measuring solution resistances (Rs) of the corresponding systems using electrochemical impedance spectroscopy (EIS) [11].
2.4. Electrochemical Measurements and Atomic Force Microscopy
The electrodes in the PCMPC test cell were controlled by a Solartron 1287A/1252A Electrochemical Interface consisting of a potentiostat and a frequency response analyzer (Ametek Scientific Instruments, Berwyn, IL, USA). Open-circuit potential (OCP) transients were recorded in alternating 4 min cycles of dynamic brushing and stationary hold configurations of the WE. CV and LSV experiments were carried out at different voltage ranges, using a common rate, 5 mV s−1, for potential scans in all cases. Many research groups (including ours) have found this scan rate to be adequate for potentiodynamic polarization studies of CMP [19,37,38,39] and PCMPC [11,15,40,41] systems involving a range of metals and composites. Recently, we experimentally demonstrated, with detailed mechanistic explanations, why this scan rate could be used as an optimized control variable for potentiodynamic studies of many such systems, both in the presence and in the absence of surface friction [42]. Our current selection of this specific scan rate for CV and LSV scans is based on these observations. All potentiodynamic data were corrected for the slurry’s ohmic resistance (IRs correction) by using EIS-measured values of solution resistances (Rs) to the recorded electrode currents (I). The polarization results corrected in this way were used for Tafel extrapolations and Evans plot constructions.
EIS measurements used a perturbation spectrum ranging from 300 kHz to 1 Hz, with 190 frequencies distributed in logarithmic frequency spacings, at an average amplitude of 10 mV. To quantify the EIS results, each of the test systems was checked for electrochemical stability by consecutively collecting three separate impedance spectra without changing the interfacial conditions. System stability was verified by ensuring that the three repeated sets of EIS data were mutually superimposed without exhibiting deviations. Illustrative results of these experiments for checking system stabilities are presented in Figure S6 in the Supplementary Material. The surface topographies of Cu samples treated under different conditions were examined using atomic force microscopy (AFM). A Bruker Multimode 8 AFM (Bruker, Billerica, MA, USA) was used for this purpose. The AFM scan window size was typically set at 50 μm × 50 μm, with a resolution of 1024 lines per image.
2.5. Data Analyses
The recorded electrochemical data were analyzed and plotted using Origin 2023 software. These analyses included Tafel extrapolations of potentiodynamic polarization data. All EIS data were subjected to complex nonlinear least squares (CNLS) analyses to determine the electric equivalent circuit (EEC) models of the electrochemical interfaces. CNLS analyses were carried out using ZSimpWin software (version 3.50). AFM images were analyzed using Gwyddion v2.60 software.
3. Results and Discussion
3.1. CMP Residues Formed on Cu Wafer Test Samples
A calculated speciation diagram for glycine is presented in the Supplementary Materials. As shown, the experimental pH value is 6 and glycine exists as a zwitterion, HGly [43]. The zwitterion-based CMP chemistries of the Cu/Gly/BTA/H2O2 system have been described elsewhere [44]; for ease of reference, here, we briefly note below the makeups and the origins of the CMP surface residues that are subjected to PCMPC in this study. The oxidation of Cu by H2O2 in the CMP solution is linked to cathodic electro-reduction of H2O2 [45,46]:
This is coupled with the anodic steps of Cu oxidation:
The last two reactions are responsible for generating oxide species at a Cu surface subjected to CMP. In a CMP situation, reaction (1) drives reactions (2) and (3) in the mixed-potential mode, leading, respectively, to the following net reactions: 2Cu + H2O2 = Cu2O + H2O and Cu + H2O2 = CuO + H2O. The relative surface coverages of Cu2O and CuO resulting from these reactions are dictated by the H2O2 content of the CMP slurry [47,48].
H2O2 + 2e− + 2H+ = 2H2O
2Cu + H2O = Cu2O + 2H+ + 2e−
Cu2O + H2O = 2CuO + 2H+ + 2e−
Using X-ray Photoelectron Spectroscopy (XPS), Du et al. found Cu2O to be the predominant oxide on Cu surfaces exposed to moderately acidic (pH = 4) glycine/H2O2 based slurries with 1 wt% H2O2 [48]. DeNardis et al. also used XPS to characterize oxide film growth on Cu in CMP solutions containing different H2O2 concentrations at pH = 5 [47]. The latter authors showed that the makeup and the growth characteristics of Cu-oxides observed with 1 wt% H2O2 remained essentially the same when the slurry’s H2O2 content was lowered to 0.25 wt%. They also noted that Cu2O formation would be followed by the slower nucleation of CuO. Based on these published findings, the oxide residues of CMP in the present work contain a mixture of Cu2O and CuO, with the latter having a relatively lower surface coverage.
We note in this context that the PCMPC process itself can introduce Cu-oxide impurities to the surface being cleaned [6]. For instance, the Pourbaix diagrams of Cu suggest that cleaning solutions at pH < 7 are likely to contain Cu2+ ions due to the electro-dissolutions step [25]:
where the Cu2+ hydrates as [Cu(H2O)n]2+ (typically with n = 6), which can precipitate on the Cu surface. In weakly acidic or neutral solutions, the cation deposited on a Cu surface can subsequently undergo dehydration and conversion to CuO [49,50]:
This resulting CuO then appears as a residue at the Cu surface under cleaning.
Cu = Cu2+ + 2e−
[Cu(H2O)n]2+ = Cu(OH)2 +(n − 2) H2O + 2H+
Cu(OH)2 = CuO + H2O
The reactions of metal complexing agents in the CMP context include those supported by dissolved metal cations, and those supported at the oxide-free as well as oxidized surface sites of the metal. For Cu CMP in glycine/H2O2-based acidic slurries, insoluble and surface passivating Cu–glycine species have been found to dominate the CMP-specific surface modifications of Cu [26]. At pH = 6, the main surface complex in the above category is CuGly2 [51]. Since metal oxide sites are more favorable than metal sites for surface complex formation [52], the reactions of CuGly2 complex formation in the CMP solution are largely supported at the oxide-containing sites [24,43,44]:
where the anodic step of reaction (7) can operate with the cathodic reaction (1) under mixed-potential conditions. The inclusion of oxidizers like H2O2 in CMP slurries is based on the strategy of forming and using Cu-oxides as precursors of surface complexes as easily abradable materials.
Cu2O + 4HGly = 2CuGly2 + H2O + 2H+ + 2e−
CuO + 2HGly = CuGly2 + H2O
BTA at pH = 6 exists predominantly in its protonated form, BTAH, and forms a CuBTA complex at the Cu surface [53]. The corresponding reactions involve both Cu and Cu-oxide [53,54,55]: Cu + BTAH = CuBTA + H+ + e−, and Cu2O + 2HBTA = 2CuBTA + H2O. Accordingly, the predominant products of CMP reactions in the present case include the surface adsorbates, CuGly2 and CuBTA, as well as some of the CuO/Cu2O surface species that remain unreacted with HGly or HBTA. A polishing pad’s abrasion in CMP removes these structurally weakened porous surface films and planarizes the Cu surface. Based on these reported mechanisms of Cu-CMP, the main post-CMP surface residues of Cu in the presently used abrasive-free slurry are expected to be Cu2O, CuO, CuGly2, and CuBTA.
3.2. Residue Cleaning Strategy and Design Considerations for a Tartrate-Based PCMPC Solution
Although the PCMPC solution used in this work is mostly intended to remove Cu-oxide residues, the organic residues (of complexing agents and corrosion inhibitors) often exhibit selective affinities for adsorption at the oxide residue sites [55,56,57,58]. In this situation, the removal of oxide residues can also remove a large fraction or most of the organic residues co-adsorbed with the surface oxide species. This has been demonstrated in our previous studies where PCMPC solutions intended primarily for removing Cu-oxides yielded considerably higher cleaning efficiencies than those only related to oxide removal. Other authors also have reported experiments specifically focused on the oxide cleaning aspect of Cu-PCMPC [4,5].
A further consideration for residual oxide removal in PCMPC is that Cu-oxide impurities on a CMP-processed Cu surface are often converted into (and amplified as) other secondary impurities that are responsible for degrading device functions. For example, Cu-oxide impurities have been correlated with the formation of Cu hillocks responsible for declined device performance [9]. Another secondary effect of Cu-oxide residues is to reinforce the particle contamination of the Cu surface, such as by enabling the oxygen-bridged binding of silica abrasives to CuO [6,10]. In these cases, neither the sources nor the actual effects of Cu-oxides are clearly identifiable at the PCMPC stage. Oxide residues on CMP-processed Cu wafers have also been associated with the inadequate distribution of chemicals due to specific configurations of the cleaning tools used [7].
If Cu2+ ions are formed in the cleaning solution and subsequently deposited on to the PCMPC surface of Cu, they can generate CuO, as described in Equations (5) and (6). According to the Pourbaix diagrams of Cu, the effects of Cu2+ generated Cu-oxides are expected to be minimal in the pH-neutral cleaning solutions used here. However, their presence in a neutral solution cannot be completely ruled out if the local interfacial pH of a Cu sample fluctuates during the surface cleaning process [59]. To prevent these effects, a chelating agent is often included in the PCMPC solution, so that the dissolved Cu2+ ion is chelated and blocked from undergoing oxide-generating reactions.
Organic acids with carboxyl groups generally serve as efficient and environmentally compatible oxide removers, and have been shown to promote high cleaning efficiencies as well as smooth profiles of cleaned surfaces [11,12,60]. While TA, containing two carboxyl groups, can be considered in the above category of chemicals, to our knowledge, the utility of TA as a potential cleaning agent for post-CMP Cu has not been reported previously. Here, we explore this potential application of TA, considering its cost-effective and easy availability, as well as its readily biodegradable nature [61]. The neutral-pH setting of PCMPC in the present work was guided by the Pourbaix diagrams of Cu to utilize the chemically unstable nature of Cu-oxides at this pH for oxide removal [62,63]. To regulate Cu corrosion in low- or high-pH solutions, corrosion inhibitor agents are often used in PCMPC [64,65]. While this is a useful approach to reducing PCMPC-induced surface defects, depending on the experimental system in some cases, it could make the removal of these inhibitors an additional task of the cleaning process. A neutral-pH PCMPC environment helps to mitigate these corrosion issues.
In the PCMPC environment considered here, the oxide remover, TA, can also serve as a chelating agent and a dissolution suppressor of Cu. As shown in the Supporting Materials, TA at a neutral pH is fully deprotonated as T2− [66]. This T2− acts as an effective chelating agent to form complexes with Cu2+ [67] in neutral solutions, and hence, can play a useful role in PCMPC, maintaining an oxide-free and smooth Cu substrate in PCMPC. According to the published literature on Cu-TA aqueous chemistry, the predominant species of Cu–tartrate complexes expected under the experimental conditions of this work are Cu(OH)2T2−, and , which can result from the chelating reactions below [68,69,70]:
Cu2+ + T2− + 2H2O = Cu(OH)2T2− + 2H+
The potential of zero charge (PZC) of Cu is around −0.9 V [11,71], and as shown later in this report, the OCP of Cu measured under the experimental conditions of this study typically stays between −0.1 V and −0.2 V. Owing to the sizable positive value of its [EOC − PZC], the Cu surface under this condition contains considerable amounts of excess positive charge, which favor the chemisorption of T2− via electrostatic interactions. The tartrate adlayer formed on Cu not only insulates the Cu surface from the redeposition of dissolved Cu–tartrate complexes, but can also support certain functions of an “adsorption film inhibitor” to lower the level of Cu dissolution by limiting the adsorption of water onto the metal [72].
Aside from metal cations, metal oxides serve as strong candidates for reaction with complexing agents via heterogeneous reactions [52,73]. These reactions of Cu-oxides with complexing agents play leading roles in the removal of Cu in CMP and Cu-oxides in PCMPC. In Cu-CMP, the oxidizer(s) of the polishing slurry converts Cu overburdens into Cu-oxides for subsequent removal by complexing agents under mechanical abrasion [27]. In PCMPC performed with oxidizer-free solutions, a CMP-treated Cu surface is not additionally oxidized while the Cu-oxide residues of CMP are dissolved by complexing agents; thus, the complexing agents included in PCMPC solutions act as cleaning agents. The latter process forms the strategic framework for residual oxide removal using TA in the present work [11,12,74]. Residual Cu-oxides from a CMP-treated Cu surface can be removed in the form of soluble Cu–tartrate complexes:
where the resulting from reaction (14) can be convert into via reaction (11).
If the dissolved Cu–tartrate species are deposited onto the Cu surface, owing to their already complexed nature, they should be weakly physisorbed to Cu rather than strongly binding to Cu via further complex formation. The mechanical action of surface brushing should readily remove these physisorbed surface species. In this approach, the Cu-BTA and Cu-Gly residues co-adsorbed with Cu-oxide sites can also be destabilized and removed by brushing the surface. The surface cleaning strategy in our present work is mostly based on utilizing reactions (12)–(14) in combination with PVA brushing; the signature features of these reactions are checked with electrochemical surface probes.
3.3. Removal of CMP Residues Examined Using Intermittent OCP Transients with and Without Surface Brushing
Figure 2 shows the time (t)-dependent OCP (mixed potential, EOC) data for Cu wafer coupons, recorded in situ using the PCMPC solution of 0.1 M TA at pH = 6.99. Plots (a) and (b) correspond to Cu samples without and with CMP pretreatments, respectively. A PVA cleaning brush was used to scrub the Cu test surface in alternate 4 min cycles, denoted as “S” (where the brush was pressed against the Cu surface in a stationary mode) and “D” (where the brush was pressed against the Cu surface while being dynamically rotated at 60 rpm speed). The TA-based PCMPC solution serves as the electrolyte for these measurements, where the dissolved T2− supports ion conduction in the solution. In the following discussion, we examine the observed features of these OCP data in view of the surface cleaning mechanism considered in Equations (9)–(14).
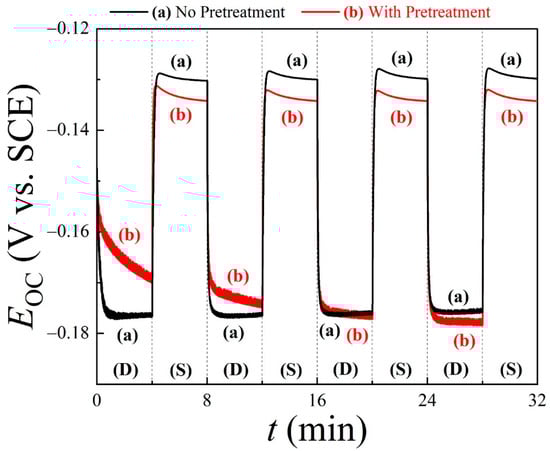
Figure 2.
Open-circuit potential (EOC) transients for Cu wafer coupons (a) without or (b) with CMP pretreatment, with results recorded in cleaning solution of TA under conditions of dynamic brushing (D) and stationary holding (S). Application and withdrawal of brushing were alternated every 4 min for 32 min. The PVA brush remained pressed against Cu sample during both S and D stages.
Because of the strong non-faradaic [75] adsorption affinity of TA on Cu [76,77], the Cu sample surface studied in Figure 2 remains largely covered with T2− as the tartrate adsorbs to its carboxylic groups [76]. This adsorption process at the open-circuit potential does not modify the Cu surface [78] but blocks the latter from the direct deposition of unchelated Cu2+ into the solution. Dissolved Cu2+ ions are mostly chelated according to Equations (9)–(11), and in the static case of no brushing, the chelated species are deposited onto the tartrate adlayer of Cu. The surface-blocking effects of tartrate adsorption are shared by both Cu samples (a) and (b), as evidenced in their comparable initial OCPs. In these data, EOC (t = 0) = (a) −0.147 V and (b) −0.153 V, where the difference between the two values is less than the thermal voltage at room temperature (26 mV) and hence can be considered insignificant.
Since the electrochemical interactions of TA with metallic Cu under OCP conditions are essentially non-faradaic (lack interfacial electron transfer) [79], the OCP of the residue-free Cu sample (a) is dictated by the mixed potential of Cu–water interactions. A survey of the literature on this topic indicates that Cu(OH) exists as a stable surface species on Cu in non-complexing aqueous media at pH values between 6 and 8 [62,80,81]. Hence, the anodic component of the mixed-potential reaction of Cu in the cleaning solution can mostly be associated with the faradaic adsorption of OH− [81]:
This reaction is generally favored at alkaline pH values and operates in a relatively weak mode in neutral solutions [82]. The cathodic component of the mixed reaction is supported by the reduction of O2 dissolved in the PCMPC solution:
This is the usual alkaline pathway of the oxidation reduction reaction (ORR); according to results published earlier [81,83], it is also favored in neutral media.
Cu + OH− = Cu(OH) + e−
Based on the above considerations, reactions (13) and (14) are the main anodic steps supported under the experimental conditions of Figure 2. The mixed-potential form of reactions (14) + (11) + (16) is as follows:
where is a stable form of Cu–tartrate complex. This is expected at the relatively high concentration of TA used here [68]. Since only exists as a residual impurity on the test surface of Cu, the initial surface concentration of this species should be small. Thus, the major features of the OCP data in Figure 2 should be dictated by the formation of Cu(OH), while the removal of would likely affect the secondary features of these data.
To examine how the PCMPC reactions affect the OCP trends in Figure 2, it is useful to consider a theoretical description of the equilibrium potential (Eeq) of an electrochemical interface that supports multiple anodic and cathodic reactions. Depending on the measurement conditions, Eeq may represent the OCP, or the corrosion potential of a system, and the former is the case for the experiments considered in Figure 2. The system parameters that govern the OCP values can be noted from the following previously reported expression of Eeq for multi-component mixed-potential systems [28]:
where the terms and serve as measures of the relative strengths of the system’s cathodic and anodic activities, respectively. F, R, and T denote the Faraday constant, gas constant, and sample temperature, respectively. Assuming a common charge transfer valence (n) and a common transfer coefficient (α) for the individual reactions of the mixed system, the faradaic strength terms can be expressed as follows:
where and denote the square-braced terms on the right-hand side of Equations (19) and (20), respectively. f = nF/RT. c and a are the numbers of simultaneously operating cathodic and anodic reactions, respectively. θck and θal, are fractional surface coverages of the kth cathodic reaction sites and lth anodic reaction sites, respectively; i0k and i0l are the exchange current densities of the corresponding reactions.
For a given set of simultaneously active reactions, the values of θck and θal can change with changes in surface conditions, and the value of then changes according to Equations (18)–(20). On the other hand, if the numbers of participating reactions of the mixed-potential process (values of a and c) change, all terms labeled with subscripts “a” and “c” in Equations (19) and (20) will change. Then, the resulting shift in the value of Eeq will be determined by the relative degrees of the changes occurring in the values of and .
The parameters in Equations (18) and (19) vary in response to changes in experimental conditions, and these variations can be selective or collective in a system-specific way. For instance, if the number of participating anodic reactions in the mixed system increases without affecting the cathodic steps, then the value of increases, and this decreases the value of (with a cathodic shift) according to the above formulas. Likewise, an anodic shift of results from the addition of a cathodic reaction’s contribution to the value of Mc in Equation (18). If the reaction sites of a cathodic step “k” (or those of an anodic step “l”) are blocked by an electro-inactive adsorbate, the value of (or ) decreases, with a corresponding shift in The surface coverage and the active reactants of the residue cleaning reactions in PCMPC depend on the hydrodynamic and frictional effects of brush scrubbing. Due to this reason, the difference in OCPs [EOC(S) − EOC(D)] measured between static and dynamic phases of brush operation serves as a measure of the tribological component of the PCMPC protocols associated with brush scrubbing. This feature of OCP transients generated in response to intermittent applications of surface friction is commonly utilized in the general field of tribology [84], and the working principle of this technique also applies to the experiments considered in Figure 2.
In the static phase of OCP transients, the T2− adsorbates on Cu limit the surface sites available for reactions (14) and (15). Accordingly, the OCPs plotted in Figure 2 shift to higher values when going from the stage of dynamic brushing to that of a static hold. It is likely that the complexed CMP residues initially remain mixed within the T2− adlayer. In this case, the electrochemical double layer contains some of these species, the concentration of which changes with brush scrubbing. As a result, the double-layer contribution of the Frumkin effect to EOC [85] for plot (b) differs from that of (a) during brushing. In agreement with observations reported earlier [32,33], this OCP difference between plots (a) and (b) is the highest in the first D cycle data since the main cleaning of CMP residues via brush operation occurs in this initial cycle. Eventually, a steady state of EOC occurs after the first two D cycles when plots (a) and (b) merge together while brushing is active, indicating the same level of surface cleaning established in the two cases. The adsorbates lifted off the Cu surface by brushing are mostly dispersed in the solution at this stage.
During each stationary cycle in Figure 2, the EOC on plot (b) of the CMP-treated Cu surface settles below the corresponding plot (a) for the untreated surface. This suggests that the anodic activity of the CMP-treated sample surface increases during the sample’s static hold. This likely happens as a further anodic reaction occurs in addition to reactions (14) and (15) in the S stage. Such an effect can originate from anodically active CMP residues that are transferred to the brush during a scrubbing cycle, and subsequently redeposited onto the PCMPC surface. A prime candidate for this type of CMP residue is HGly, which can undergo the following anodic step:
In the presence of this reaction, a new component of the anodic activity term, Ml, will be included in the denominator of Equation (18). This shifts the value of EOC in the cathodic direction—as seen in Figure 2. The mixed-potential version of this reaction in combination with the ORR can be expressed as follows:
Since the chemical removal of HGly is not specifically included in the present PCMPC scheme, traces of the HGly residue can remain in the PCMPC solution and/or on the brush; this persistent residue can support reaction (21) to lower the value of EOC through repeated S cycles, as seen in Figure 2. This effect is absent in the D cycles, where the PVA brush mechanically removes the HGly adsorbates.
Cu + 2HGly = CuGly2 + 2H+ + 2e−
Cu + (1/2)O2 + 2HGly = H2O + CuGly2
Another relevant feature of the data in Figure 2 is that the alternating patterns of EOC on plot (a) are consistently repeated in the subsequent D and S cycles. This indicates that adsorption and desorption of T2− at the Cu surface are reversible with respect to the withdrawal and application of brushing and that these adsorbates do not introduce any detectable chemical modifications of an irreversible/cumulative nature to the Cu surface. Additionally, the relatively large difference observed between the OCPs measured in the S and D stages indicates that the brushing of the post-CMP Cu surface in the cleaning solution plays a major role in residue removal. Thus, Figure 2 illustrates how the combined functions of surface chemistry and tribology are necessary for post-CMP residue removal.
In terms of their structural features and their mechanical interactions with a PVA brush, Cu-oxide species generated by anodic reactions [86] at a Cu surface can be considered comparable to abrasive particle residues of CMP [86,87,88]. Thus, the removal of oxide residues (in their complexed or unreacted form) by the brushing of a Cu surface containing such residues is expected to follow the mechanical steps of rolling and sliding, which are similar to those responsible for removing abrasive particles in PCMPC. The tribological aspects of the latter process have been extensively studied by other authors [89,90,91,92,93]. Certain main elements of these tribological effects of brush abrasion for PCMPC are briefly noted below to further substantiate the implications of the results shown in Figure 2.
When partial lubrication operates at a PCMPC interface under brushing conditions, a particle-like solid residue is acted upon by the following primary forces: the residue–surface adhesion force, Fas, acting normally in relation to the Cu surface and pointing toward the surface; the residue–brush adhesion force, Fab, opposing Fas in a direction that is normal in relation to the Cu surface; and the hydrodynamic drag force of brush rotation, FD, acting in parallel to the Cu surface. The forces Fas and Fab also give rise to the mutually opposing frictional forces, μsFas and μbFab, respectively; μs and μb denote the effective residue–surface and residue–brush friction coefficients, respectively, the values of which can be affected by the viscosity of the cleaning fluid as well as by the fluid’s velocity under dynamic brushing. While additional interfacial forces such as those arising from high brush pressure and brush–residue electrostatic interactions can affect the overall PCMPC tribology, the possible secondary contributions of the latter forces are not considered in the present context.
Accounting for the main forces noted above, the condition required for residue removal by sliding can be written as follows [91]:
where it is assumed that the residual particle is not substantially embedded in the Cu substrate. This assumption is based on the consideration of the chemical component of PCMPC, which is described here as reactions (12)–(14). Due to these reactions, the population of Cu-oxides at the Cu surface should be minimal in the cleaning solution, and the soluble complexes of Cu-oxides that redeposit onto the Cu surface should mostly exist as loosely bound adsorbates.
Cu-oxides formed via anodic reactions result in nanostructures of different geometries [86]. Specifically, residual species of CuO that are generated during CMP via the intermediate formation of Cu(OH)2, as considered in Equation (6), may contain nanoparticles with spherical and cylindrical shapes [88]. Single particles of complexed residues with such structures can undergo removal under brushing via the mechanism of rolling. This mechanism is supported if the particles’ removal moment (determined by , , , particle size, and contact radius of adsorption) exceeds the corresponding adsorption moment (determined by and the contact radius).
The hydrodynamic drag force plays a major role in dictating both the sliding and rolling mechanisms. Specifically, if the frictional forces included in Equation (23) are relatively weak, the process of residue removal under brushing conditions often occurs in the tribological regime of hydrodynamic lubrication [93]. For instance, Cho et al. have shown that at small brush-gaps, the strong hydrodynamic drag force of a PCPMC solution could support the contactless removal of residual particles from CMP-treated surfaces [94]. In another investigation of PCMPC focused on the removal of abrasive particles, Burdick et al. showed that the majority of superficially adsorbed (0% embedded) particles could be removed by the action of hydrodynamics alone [90]. A similar mechanism is expected to operate in the present case, where negligible embedment and weak adsorption of the CMP residues are facilitated by the chemical component of PCMPC. Evidence for this hydrodynamic mechanism of chemically assisted residue removal is presented in the next section.
3.4. Tribological Features of Residue Removal Probed with Cyclic Voltammetry Under Brushing Conditions
While open-circuit conditions largely mimic the electrochemical environment of an actual PCMPC interface, the corresponding (equilibrium) data do not always explicitly display all the signature features of the residue removal mechanism. To bring out the subtle features of residue removal, we performed a set of CV experiments in combination with surface brushing where the amounts of Cu-oxides on a set of Cu film samples were controlled under the faradaic activation of CV. These measurements were performed within a moderate voltage range of faradaic activation around the OCP, using different Cu film samples in the TA-based cleaning solution. A component of the TA-mediated removal of the electrogenerated Cu-oxides operated in this solution. The goal here was to examine if and how the CV features of Cu-oxidation/reduction were affected by the TA-enabled removal of CMP residues (oxides and their co-adsorbed species) with and without the use of surface brushing. The electrode currents measured in these experiments were normalized with respect to the effective surface areas (Aeff) of the Cu samples. While the considerations of the effective areas are discussed elsewhere in detail, certain essential points of this topic are briefly outlined below.
Aeff (no brush) = A0 (no brush), Aeff (with brush) = A2b, and A2b is the electrochemically effective value of the Cu sample’s brushed surface area A2 (Figure 1). is the Cu sample’s geometric area in the solution. A2b was determined with two sets of experiments, one with no brush (identified by parameters labeled with subscript ‘n’) and another one including brush operation (parameters labeled with subscript ‘b’). Two separate Cu samples of slightly different widths, wn and wb, but identical sector lengths (L1, L2, and L3) were used in these two sets of measurements. The value of A2b was calculated according to the previously discussed formula shown below and, using the system-specific solution resistances (Rs) of the test cell, measured with EIS [11]:
where is the value of for the brush-free Cu sample. simply represents the value of the area A2 for the brush-free sample. Table 1 summarizes the sample-dependent values of A0 and Aeff. The formulas used to determine the electrode-specific values of Aeff are outlined in the Supporting Materials.

Table 1.
Surface treatments and electrochemically operative effective areas of Cu samples used for in situ electrochemical measurements in 0.1 M tartaric acid cleaning solution.
Figure 3 displays cyclic voltammograms recorded by scanning the electrode voltage (E) at a rate of 5 mV s−1 using Cu film WEs without (A, C) and with (B, D) a CMP pretreatment, as well as with (C, D) and without (A, B) the brush scrubbing of the Cu surface. To focus mostly on the overall shapes of these graphs, the current densities in these plots were obtained by normalizing the recorded current, I, for each electrode with respect to the electrode’s effective electrode area, Aeff, which accounted for the electrochemically operative surface sites available under brush scrubbing of the sample surface [11]. Under surface brushing, the recorded net current, I, contains some contributions from the unbrushed surface regions of areas A1 and A3 (Figure 1). For this reason, the current densities plotted in Figure 3 are designated as “apparent” current densities, iapp, where iapp = I/Aeff.
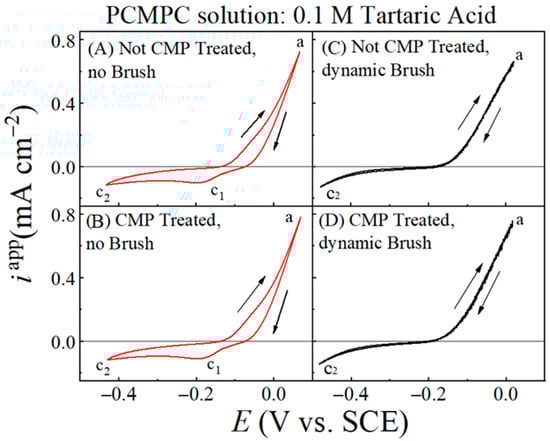
Figure 3.
Cyclic voltammograms of Cu wafer sample recorded at scan rate of 5 mV s−1 in cleaning solution of 0.1 M TA (pH = 6.99) under different experimental conditions indicated. The different conditions used for sample treatments are stated in (A–D). Arrows indicate direction of voltage scan. Rising anodic current observed in forward scan (along increasing voltages) acquires its maximum value at point ‘a’. The cathodic current features c1 and c2 are discussed in the main text. The plots for the brush-free and brush-operated cases are shown in red and black lines, respectively. For brush-free samples, two cathodic current features are observed in reverse voltage scanning. Current hysteresis and cathodic feature c1 disappear under condition of dynamic brushing.
The general features of the plots are similar between panels (A) and (B), as well as between (C) and (D). This shows how with CV activation, the electrochemical response of the Cu surface is dominated by voltage-controlled reactions, with any effects of the CMP residues remaining largely masked. Based on the discussion presented in the context of Figure 2, the faradic response of the Cu sample in the PCMPC solution should be mostly dictated by the intrinsic aqueous electrochemistry of Cu (which forms the basis of Pourbaix diagrams for Cu). This assessment can be confirmed by noting the similarities of the voltammograms in Figure 3A,B with those previously published for Cu electrodes in non-complexing neutral-pH aqueous electrolytes [81,95]. To further ensure that the voltammogram profiles seen in Figure 3 were dictated primarily by faradaic interactions between Cu and water (and not between Cu and TA), we recorded a set of cyclic voltammograms for a Cu coupon electrode in 0.1 M KNO3 at pH = 7. The voltammograms obtained from these latter measurements are discussed in the Supplementary Materials, and it is shown that the latter results essentially duplicate the data features seen in Figure 3.
The underlying reactions of the CV features observed in Figure 3 can be noted based on similar results previously reported for Cu electrodes in neutral-background electrolytes. The reaction (15) of Cu(OH) formation occurs at progressively increasing rates when the applied voltage is increased above −0.2 V. As the electrode potential continues to increase, the Cu surfaces examined in all four panels of Figure 3 are anodically oxidized as follows [83,96,97]:
In addition, some of the Cu(OH) formed due to faradaic adsorption of OH− converts into cuprous oxide:
This likely occurs in combination with voltage-induced adsorption and ordering of adsorbed water dipoles [98,99]. The rising currents (reaching a maximum at point “a”) observed at E > −0.05 V in Figure 3 correspond to the irreversible electro-dissolution of Cu (Equation (4)) under voltage activation [95]. The dissolved Cu2+ ions are complexed by TA in the form of , which, in turn can be deposited onto the tartrate adlayer of the Cu substrate.
2Cu + 2OH− = Cu2O + H2O + 2e−
2Cu(OH) = Cu2O + H2O
The anodic current of reaction (25) is distributed over a broad voltage range in all the four cases examined in Figure 3, and hence, does not lead to a well-defined anodic peak. This lack of a clearly formed peak for Cu2O indicates that the anodically formed Cu2O does not reach its saturation surface coverage during the oxidation scan of CV. As reaction (14) is activated in the anodic region of Cu oxidation, the oxides continue to dissolve while the latter is simultaneously formed by reaction (25). These competitive processes play a leading role in suppressing the occurrence of an anodic oxidation peak for reaction (25) in the CV data. As the potential is swept to higher anodic values, Cu-oxides are generated at higher rates than those of Cu removal, and at the end of the forward anodic scan, some of these anodically formed Cu-oxides remain on the WE surface.
While no well-defined oxidation peaks for reaction (25) appear in Figure 3A,B, the Cu2O retained from this reaction on the Cu surface is indicated in the current hysteresis observed between the forward (increasing E) and reverse (decreasing E) voltage scans performed in the anodic region. This hysteresis is the result of the lowered surface activity of Cu established during the reverse voltage scan as the site-blocking surface species of Cu2O is formed via reaction (25) in the forward scan. Being left on the unbrushed Cu surface after a forward voltage scan, this Cu2O undergoes electroreduction in the reverse cycle as indicated by the cathodic current feature c1 of reduction found around −0.18 V in Figure 3A,B [95,96]. Like the Cu oxidation current, this feature of Cu2O reduction is also distributed over a relatively broad voltage range. Apparently, the T2− ions adsorbed at the Cu surface slows down the steps of Cu oxidation and Cu2O reduction, which results in the broadened current features of oxidation and reduction. The c2 point marked on the cathodic current branch represents the onset of the ORR [81]. As dynamic brushing of the Cu surface is activated, the oxide reduction peak c1 disappears in Figure 3C,D. The current hysteresis detected in A and B because of oxide retention at the Cu surface is also absent in the CV plots, recorded with brushing and shown in Figure 3C,D.
Figure 3C,D provides evidence for oxide cleaning due to the brush scrubbing of the Cu surface. The absence of current hysteresis in the anodic voltage region of these plots also indicates that the adsorbed T2− ions and all redeposited species are effectively detached from the Cu sample during brush scrubbing. Under this condition, the complexed residues, and CuT22−, are mechanically brushed away along with the adsorbed tartrate. If CuO is present on the Cu surface, partial, or complete dissolution of CuO [Equations (12) and (13)] can structurally destabilize the CuO islands/patches, as well as any Cu2O intermixed/co-adsorbed with CuO. Consequently, these loosely surface-bound oxides are readily removed during brush scrubbing, leaving little or no surface oxides for reduction in the reverse CV scan. For this reason, no reduction peaks are detected while brushing the Cu surface, and the faradaic surface activity remains unaltered between the forward and reverse voltage scans, as evidenced in the strongly superimposed anodic dissolution plots recorded in the two opposing sweep directions.
Even though the surface areas A1 and A3 on the Cu samples are excluded from dynamic brushing, the CV plots shown in Figure 3C,D do not show any prominent features of oxide reduction from these unbrushed regions of the surface. According to this observation, it appears that in the presence of dynamic brushing, the unbrushed areas, A1 and A3, of the anodically affected Cu surface acquire a comparable level of cleanness to that of the adjoining brushed area A2. This is possible if hydrodynamic effects play a strong role in the mechanical removal of residues during surface brushing. Such a situation would correspond to the presence of a sufficiently large value of FD, and a sufficiently small value of Fas, so that the condition specified in Equation (23) would be met even if Fab ~ 0.
It is also noteworthy that the CV profile of the CMP-treated Cu surface after brush cleaning in the TA solution (Figure 3D) mostly matches that of the Cu surface brushed without CMP pretreatment (Figure 3C). This latter observation can be explained by noting that the surface coverage of Cu-oxides from CMP residues is substantially smaller than that of the anodically electrogenerated Cu-oxides. Additionally, the surface coverages of the anodically formed oxides are comparable between the samples with and without CMP treatment since both samples undergo the same level of anodic activation. Thus, while the voltammograms in Figure 3 demonstrate the active role of hydrodynamics in the removal of surface oxides on Cu, these data do not exhibit any obvious features of the (relatively low amounts of) residual Cu-oxides.
As noted in the context of Equation (23), an active function of hydrodynamics in residue removal is expected in the present experiments, because the binding forces between Cu and its oxides in this case are chemically weakened by reactions (12)–(14) of TA. While conventional PCMPC generally uses flowing solutions for surface cleaning [22,100], the brush cell used in this work employs a closed reservoir of the cleaning fluid, where the fluid’s swirling motion exists in the regions above and below the rotating brush. The hydrodynamic force resulting from this fluid motion removes a significant fraction of the oxide particles residing at areas A1 and A3 (Figure 1), while both hydrodynamic drag and contact forces of brush asperities act to remove the complexed forms of electrogenerated oxides from area A2 [101].
3.5. Corrosion Variables of Brush-Scrubbed Cu Films Examined Using In Situ Potentiodynamic Polarization Measurements
To further examine the relative roles of surface chemistry and tribology in the PCMPC process, the equilibrium current densities and equilibrium potentials of the Cu interface in the TA solution were determined for comparison with and without the use of brush scrubbing. A specific goal of these measurements was to bring out the relatively subtle effects of dynamic brushing, which remained largely masked in the CV data in Figure 3. To achieve these goals, a set of potentiodynamic experiments were carried out using LSV scans, applied in the direction of increasing potentials. The rate and range of the potential scans considered for Figure 3 were used once again to explore the anodic and cathodic Tafel regions of polarization.
Figure 4 shows Tafel plots recorded using this approach in the TA-based PCMPC solution for Cu wafer coupons (A) without and (B) with CMP pretreatment. Plots (a) and (b) in each panel correspond to the data collected in the absence and in the presence of surface brushing, respectively. The current densities are obtained by dividing the measured currents with respect to the Cu sample’s effective areas, Aeff. Thus, like the cases of Figure 3, the data for plots (b) in Figure 4 contain the mixed faradic contributions of both the brushed (A2) and unbrushed (A1 and A3) surface areas. Following the convention used in Figure 3, these “apparent” current densities in Figure 4 are denoted as iapp. The Tafel plots in Figure 4A,B do not show any strong features of surface passivation (such as a saturation or a decrease in the electrode current in response to increasing anodic overpotentials) [102]. This shows that neither the CMP residues nor the adsorbed tartrate completely blocks electrochemically accessible sites of the Cu sample surface.
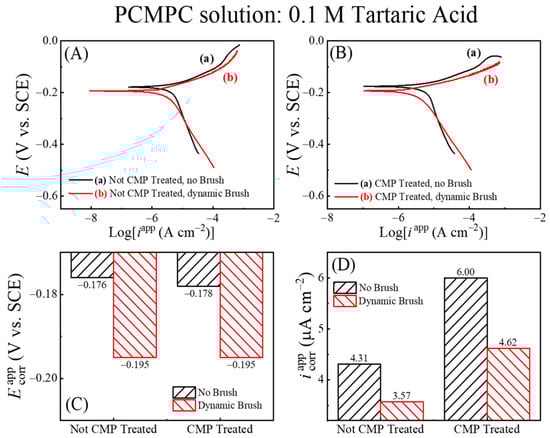
Figure 4.
In situ area normalized potentiodynamic polarization plot of Cu (A) without CMP pretreatment, and (B) with CMP pretreatment under (a) no brushing and (b) dynamic brushing. These data were recorded in situ by scanning electrode potential at rate of 5 mVs−1 in electrochemical brush cell containing 0.1 M TA. Panels (C,D) display, respectively, the apparent values of the corrosion potentials and corrosion current densities obtained from panels (A,B).
Based on the preceding discussion of Figure 3, the currents in the anodic branches in Figure 4 are dominated by voltage-activated modes of reactions (4), (14), and (25), with relatively weaker contributions of reaction (15) at low overpotentials. The corresponding cathodic Tafel branches can be associated with the ORR and the electroreduction of Cu2O. For the CMP-treated Cu samples, CMP residues with low surface coverages of Cu-oxides and HGly provide relatively minor additional contributions to these currents. Since the main reactions [(4), (14) and (25)] responsible for generating the Tafel plots can be placed in the category of corrosion or corrosion-like processes, the equilibrium potentials and equilibrium current densities in Figure 4 are described here as corrosion potentials (Ecorr) and corrosion current densities (icorr), respectively. Figure 4C,D show these corrosion variables (including the label “app”) determined by Tafel extrapolations of the apparent current density plots in Figure 4A,B, respectively.
On the apparent current scale of Figure 4D, the corrosion current densities measured with and without brush cleaning are somewhat comparable, with slightly higher values registered in the brush-free situation. In agreement with the OCP plots of Figure 3, the values recorded with dynamic brushing in Figure 4 appear below those of their corresponding values recorded under static conditions. However, the gaps observed between the static and dynamic cases of cannot be quantitatively compared with those found for EOC, because the experimental conditions of the two sets of measurements differ as follows. (i) The non-faradaic adsorption characteristics of the Cu surface are considerably different in the presence and in the absence of an externally applied voltage sweep [103]. (ii) In the static phase of OCP measurements, the Cu sample surface was pressed against the PVA brush, while the sample was brush-free in the case of Figure 4. Due to these differences between the two experimental situations, the OCP difference observed between plots (a) and (b) due to the Frumkin effect under static conditions in Figure 2 is not detected in the corresponding data in Figure 4.
To further examine the details of the polarization data in Figure 4, it is necessary to quantitatively normalize the recorded currents so that the actual electrode current densities supported at the brushed region of the Cu sample can be selectively probed. The protocols for carrying out this normalization have been described elsewhere in detail [11] and the associated main steps are briefly noted below. The current densities (i) were determined from the measured electrode currents (I) by using the electrochemically accessible effective electrode areas, Aeff, and specifically accounting for the currents supported by the brushed regions of the scrubbed Cu samples.
To extract the value of the current density supported at the Cu sample’s brushed surface region, we use the expression, Ib = (A0b − A2b) (In/A0n) + A2bi2b, which follows from Kirchhoff’s current rule. Ib and In denote the net electrode currents measured for the brushed and unbrushed samples, respectively; i2b denotes the current density maintained at the brushed region of the Cu sample. This i2b was determined by combining the above expression of Ib with Equation (24):
This is taken as for the brushed Cu sample.
The calculations for Equation (27) required the numerical subtraction of parameters involve two separately collected data sets, Ib and In. However, the data points in the two recorded files did not (as they do not generally) fully align on the time axis. Therefore, the experimental Tafel data from Figure 4 were converted into simulated Evans plots. The latter plots were used to numerically evaluate i2b and the results are shown in Figure 5. The quantified corrosion variables, Ecorr and icorr, determined from the Evans plots in Figure 5 are presented in Figure 6A,B. It is necessary to note here that the anodic and cathodic Tafel slopes, extrapolated from specific segments of the raw data in Figure 4, were extended to the full region of the voltage scan to construct the Evans plots in Figure 5. Considering the relatively restricted use of Tafel extrapolation and also noting that Tafel slopes are related to electrode kinetics in a rather complex manner [104], these slopes are not treated here as direct measures of electrode activity. The present analysis strictly focuses on the relative values of Ecorr and icorr obtained from Figure 5 for the different samples to compare these samples’ faradaic activities.
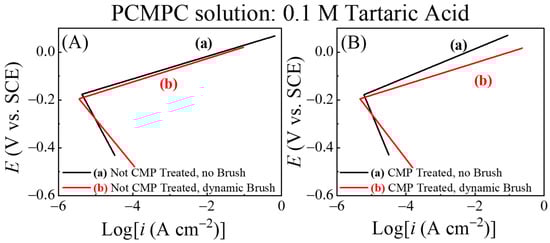
Figure 5.
Evans diagrams for Cu wafer for (A) no CMP pretreatment and (B) with CMP pretreatment under (a) no brushing and (b) dynamic brushing conditions. These diagrams were constructed using experimental data from Figure 4A,B in Equations (24) and (27).
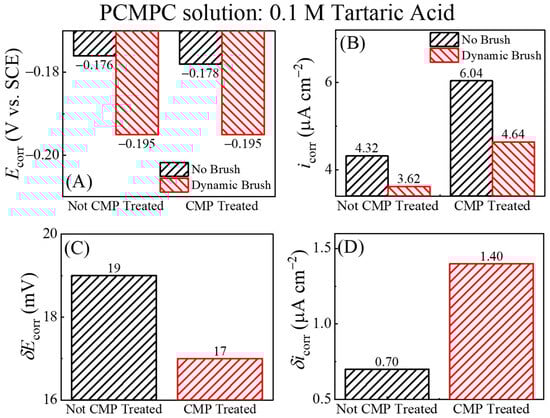
Figure 6.
Comparison of (A) corrosion potentials (Ecorr) and (B) corrosion current densities (icorr) measured for Cu film samples in TA-based cleaning solution under no brush and dynamic brush conditions. Plots (C) and (D) illustrate difference between Cu sample’s corrosion potentials (δEcorr) and corrosion current densities (δicorr) [Equations (28) and (29)].
The Ecorr values shown in Figure 5 are nearly the same as those plotted in Figure 4, suggesting that the corrosion potentials are not significantly affected by the apparent values of the electrode currents. This is expected since the Cu sample maintains an equipotential profile across its surface. The unbrushed Cu samples represented by plots (b) in Figure 5A,B contain anodically generated Cu2O surface species, boosting the anodic activity of the underlying Cu by supporting the simultaneously occurring anodic reaction (14) of oxide removal. At the same time, Cu2O is a known electrocatalyst for ORR [105,106] and thereby serves also as a cathodic promoter. The brushed Cu sample lacks the presence of this Cu2O as the complexed oxides are scrubbed away from the sample surface. Owing to the above effects of Cu2O, the values of icorr in Figure 6B for the unbrushed Cu samples containing Cu2O are higher than those of the brushed sample, which is nearly void of Cu2O adsorbates.
Regardless of brush scrubbing, the CMP-treated Cu surfaces support higher values of icorr compared to those of the samples tested without CMP pretreatment. As we explain below, this observation is consistent with the faradaic function of Cu2O mentioned above. Since the LSV variables are the same for the two samples, the amounts of oxide generated by LSV should be comparable between the two samples. However, the CMP-treated surface contains additional oxides in the form of CMP residues; these additional oxides promote the anodic activity of the CMP-treated sample, thereby making the value of icorr that of the CMP-free Cu surface.
In Figure 6B, the increased faradaic activity of the Cu2O-containing Cu surfaces is manifested predominantly in the cathodic function of the surface. To clarify this observation, we note that a selective increase in the cathodic activity implies an increased value of the ratio (Mc/Ma) in Equation (18), which would result in an anodic shift in the value of Ecorr. Such a situation can arise if, under the given experimental conditions, the catalytic function of Cu2O to promote ORR is more effective than the corresponding anodic role of this oxide in a supporting reaction (14). The Ecorr data in Figure 6A follow this trend, as it is observed that Ecorr (no brush, Cu2O present) > Ecorr (dynamic brush, Cu2O removed) regardless of the Cu sample’s CMP treatment. The combined results for Ecorr and icorr in Figure 6A,B bring out the underlying differences between plots (a) and (b) from Figure 5, which remained mostly masked in Figure 4 due to the mixed current contributions from the brushed and unbrushed electrode areas.
As noted in the discussion of Figure 2, the difference between the equilibrium mixed potentials measured under the conditions of surface brushing and no brushing can be used as a phenomenological measure of the tribological components of PCMPC. This specific data feature could not be fully utilized if the electrode currents were simply normalized by geometric electrode areas and contained mixed contributions from both the brushed and unbrushed surface regions of the metal sample. However, the equilibrium variables, Ecorr and icorr, presented in Figure 6 were processed to separately check the electrochemical signal of the brushed surface regions. Therefore, these data can be used to examine the role of brush scrubbing in residue removal. The “difference variables” δEcorr and δicorr can be determined as follows:
The lower row of Figure 6 shows the results for these variables using the data from Figure 6A,B.
δEcorr = [Ecorr (No Brush) − Ecorr (Dynamic Brush)]
δicorr = [icorr (No Brush) − icorr (Dynamic Brush)]
In Figure 6C, the value of δEcorr is quite small (below the thermal voltage), but still detectable. This nonzero value of δEcorr can be associated with the removal of the T2− adsorbates from the Cu surface under dynamic brushing. Since these adsorbates do not completely block the surface sites for electron transfer (while shielding the surface from redeposition of dissolved residues), the corrosion potential of the Cu surface is not significantly affected by tartrate adsorption in the absence of other residual surface species. The rather small value of δicorr in Figure 6D for the CMP-free surface further confirms that the adsorbed tartare ions have no significant effects on the operative charge transfer sites of the Cu test surface. The δicorr acquires a higher value when going from the no-CMP sample (containing negligible amounts Cu-oxides) to the CMP-treated sample (containing Cu-oxide CMP residues). Based on this observation, the CMP residues that most significantly affect the values of (Ecorr and) icorr under the present experimental conditions are likely to be Cu2O and CuO. Thus, the value of δicorr increases with increasing coverages of these oxides at the Cu surface, and this finding fully aligns with the mechanisms of residue removal considered in reactions (9)–(16).
3.6. Removal of CMP Residues Examined with In Situ EIS Measurements Under Brushing Condition
Here, we utilize a tribology-controlled EIS method to probe the mechanistic details of surface residue removal. The PCMPC solution is used once again as an electrolyte in the test cell shown in Figure 1, and Cu samples with different pretreatments are employed as the working electrode in separate sets of measurements. Figure 7 shows Nyquist impedance spectra for these Cu samples, recorded in situ under different conditions of surface preparation. The experimental systems for plots (a)–(d) are annotated in the figure. The symbols and the lines denote experimental data and CNLS fits to the data, respectively. Inset (B) in Figure 7 shows the EEC model of the PCMPC interface obtained from these fits. The impedance data were normalized using the sample-dependent effective surface areas listed in Table 1.
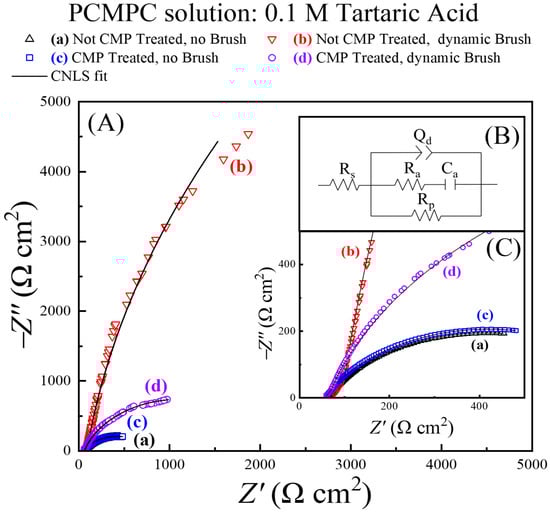
Figure 7.
(A) Electrochemical impedance spectroscopy (EIS) data for first EIS cycle applied to each freshly prepared Cu wafer samples examined in four different situations (symbols). EEC obtained by CNLS fitting the data is common to the four experimental systems, with different values of impedance elements in the individual cases. EEC is shown in panel (B) and corresponding CNLS fits to data are shown in panel (A) in black lines. A closer view of a selected sector of the impedance data at higher frequencies [from the lower left corner of panel (A)] is presented in panel (C), which follows the same legend as panel (A).
For the samples probed under brushing conditions, the impedance response of the brushed regions was extracted from the recorded impedances by using the analytical protocols previously discussed in detail [11]. This analysis (which is like that used in the context of Figure 5) properly normalizes the impedance data in plots (b) and (d) to selectively probe the tribo-electrochemical conditions established at the brushed surface region (area A2).
The impedance characteristics of systems (a) and (c) without surface scrubbing are mutually similar, as these plots are nearly superimposed in Figure 7. On the other hand, the experimental systems represented by plots (b) and (d) in the presence of surface scrubbing exhibit notably different impedances with respect to each other and with respect to those monitored in cases (a) and (c). Generally, the larger the arc radius of a Nyquist plot, the larger the experimental system’s overall impedance. To probe the underlying mechanistic details of these Nyquist features, it is necessary to analyze the sample specific values of the CNLS-analyzed EEC parameters, which are listed in Table 2.
Table 2.
Circuit parameters of the EECs obtained through CNLS analysis of EIS data collected for each case.
In the EEC model shown in Figure 7B, the polarization resistance, Rp, represents an effective faradaic impedance of the system, and Rs is the solution resistance. Qd is a constant phase element (CPE, a frequency-dispersed equivalent of a capacitor) representing the electrochemical double layer. The CPE accounts for the overall spatial inhomogeneity of the Cu surface. Ra and Ca denote resistance and capacitance, respectively, representing adsorptions of T2− at the Cu surface from the solution [77]. τa is the characteristic adsorption time (inverse of adsorption frequency) for T2− under the different conditions explored. Since the CMP residues dissolved by T2− are in their complexed forms, any deposits of these complexes are not expected to have any significant contributions to the impedance of the Ra–Ca combination. Rp is an effective polarization resistance that serves as a measure of the overall faradic (charge transfer) activity at the PCMPC interface.
The double-layer CPE is characterized by two variables, d (a dimensionless index, varying between 0 and 1) and Yd (CPE amplitude), and this CPE takes the form of capacitance in the case where d = 1. The value of d in the present experimental environment can be taken as a phenomenological measure of surface homogeneity, which would be at a maximum value at the upper bound of d. In this view, and according to the values of d listed in Table 2, the Cu surface becomes spatially more homogeneous and less rough under dynamic brushing when the CMP residues and the tartrate adsorbates are mechanically removed.
By referring to Table 2, it is evident that system-dependent variations in the polarization resistance dominate the net impedance changes manifested in the Nyquist plots. The faradaic steps detected in these data constitute those intrinsic to the Cu-TA aqueous system [which, according to the results in Figure 5, are dominated by reaction (15) for all the four Cu samples used] and those of the residue removal reactions [reaction (14), indirectly affected by chemical reactions (12) and (13)] for the CMP-treated samples. Based on these considerations, the polarization resistance, Rp, for the CMP-treated Cu samples can be described as a parallel combination of two polarization resistances, Rp(h) and Rp(r), for these reactions of Cu with water (h) and residues (r), respectively.
For the Cu samples not treated in the CMP solution, Equation (30) takes the simple form: Rp ≡ Rp(h).
To examine the sample-dependent values of the EEC variables listed in Table 2, the polarization resistance, , arising from a faradaic reaction of a surface species, x, can be written in the Stern–Geary form:
where and are the anodic and cathodic Tafel slopes of the underlying mixed-potential reaction supported by the reactant, x, respectively; icorr is the characteristic equilibrium current density supported by the species of type x (x ≡ r or x ≡ h in the present case). The “corrosion” designation of this current is based on the phenomenological considerations that reaction (14) of Cu–water interactions can eventually lead to surface oxidation [via reaction (25)] under certain conditions, and that reaction (14) of residue removal represents an electro-dissolution step. η = E − EOC (overpotential). is the fractional surface coverage of the electroactive species under steady state, which is established by the competitive rates of adsorption and desorption of the species x at the OCP.
The hydrodynamic and frictional effects augment the desorption rates under surface brushing, and therefore, this substantially decreases for all adsorbates at the brushed Cu surfaces. Due to this reason, , which is equal to for the brushed sample without a CMP treatment, exhibits an increase of two orders of magnitude compared to that of the brush-free sample without CMP treatment. The rather large value of measured for the brushed sample without CMP treatment is indicative of a “clean” surface that is nearly free of electroactive adsorbates. Since the residues on a CMP-treated Cu surface generally exist in small concentrations, the surface coverage, , of these residues should be significantly small compared to the coverage, of hydroxide ions.
If the Tafel slopes and the equilibrium currents for adsorbates r and h are not substantially different, the criterion of would make , so that in Equation (30). Under this condition, the variations in the measured value of Rp should be largely dictated by those of This expected feature of the Rp data is observed in Table 2, where the values of Rp for the brush-free, CMP-treated and brushed, CMP-treated samples are affected by both Cu–water and Cu–residue interactions, but they still exhibit essentially the same effects of surface brushing as those measured for the brush-free, not CMP-treated and brushed, not CMP-treated samples, the latter two only being affected by Cu–water interactions. The brushing that enables the augmentation of Rp for the CMP-treated samples is, however, less drastic compared to the corresponding case of the samples that were not CMP-treated. This indicates that Rp(r) has a relatively small but measurable contribution to the observed value of for the CMP-treated samples. It is possible that some persistent HGly residues, such as those considered in reaction (21), act to promote the faradaic activity, lowering the value of of the CMP-treated brushed sample.
To examine the impedance variables in the adsorption branch, we note that the adsorption capacitance measured at the Cu sample’s OCP depends on the fractional surface coverage, , of T2−. In the formalism of Langmuir-type adsorption isotherms, this [107,108]:
where Qs is the surface charge associated with saturation surface coverage of T2− at the Cu sample surface. Equation (32) describes a parabolic profile of as a function of , so that the low values of at are repeated at certain high values at (this is graphically shown in the Supporting Material). Due to this reason, the values of Ca for the unbrushed (high- case and brushed (low- case in Table 2 remain within a relatively moderate range. The features of the adsorption resistance, Ra, are coupled to those of Ca through the usual definition of the adsorption time constant: τa = Accordingly, -dependent values of exhibit an opposite trend of [108,109], and this is seen here in Table 2 by comparing the sample specific variations of and . The values of τa, as calculated from the results for and are listed in Table 2. For all four samples, the values of remain near ~1 ms, which is typical of most anions known for exhibiting specific adsorptions at metal electrodes [109,110,111]. It is also worth noting that these adsorption/desorption times are significantly short compared to the experimental timescales associated with the data in Figure 2, Figure 3 and Figure 4 and 7.
3.7. Results of Atomic Force Microscopy
The electrochemical results presented in the preceding sections clearly indicate the active role of surface brushing in residue removal from CMP-treated Cu. A set of exploratory AFM measurements were carried out to further verify the role of brush scrubbing. To achieve this, Cu wafer samples were subjected to the four types of surface treatment considered in the experiments for Figure 3, Figure 4, and Figure 7; subsequently, the surface topography of each sample was examined using AFM. The surface profiles observed in these experiments are presented in Figure 8, where the different cases are described according to the nomenclature scheme used in Table 1. The values of average surface roughness (RA) and root means square (RMS) surface roughness (RQ) determined from these data are summarized in Table 3.
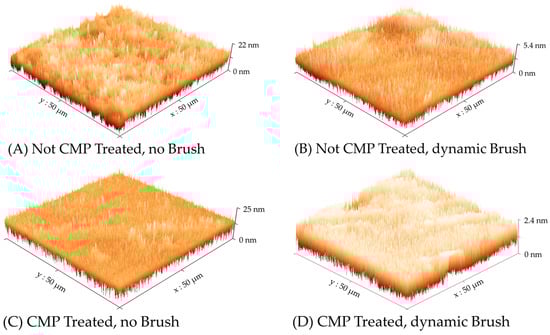
Figure 8.
AFM-generated topographic surface maps of Cu wafer samples prepared under the four experimental conditions described in Table 2. Different optimized scales are used the vertical (height) axis to display the surface features.
Table 3.
Surface roughness factors determined from AFM data in Figure 8 for different Cu samples.
As we noted in the discussions of Figure 2, Figure 3, Figure 4, Figure 5, Figure 6 and Figure 7, the Cu sample surfaces in the absence of brush scrubbing contain adlayers of adsorbed T2− ions, which serve to suppress Cu dissolution and protect the surface from redeposited residues. Sudhakaran et al. studied a similar experimental system, where they used AFM to examine the corrosion protection effects of sodium tartrate on Cu in an aqueous medium (at pH = 7.84). These authors confirmed that the AFM-detected surface topographies of Cu surfaces exposed to tartrate solutions represented those of adsorbed tartrate layers (with 6.9 nm and 7.9 nm for AFM-measured values of RA and RQ, respectively). A similar situation exists here for the unbrushed Cu samples in Figure 8, where the tartrate layers, being formed on uniformly deposited thin Cu films, have lower surface roughness compared to those reported in the above study.
To examine how the CMP treatment affects the roughness of unbrushed Cu samples in Figure 8, we note the following reaction of Cu dissolution, which can be supported by the chemical component of CMP in the present case [43]: Cu + HGly = CuGly+ + H+. Since CuGly+ dissolves in the solution, it does not directly affect the surface-localized composition of CMP residues that are relevant in the context of PCMPC. If this dissolution reaction selectively occurs at the regions of relatively higher surface roughness (where the adsorption of HGly is favored by higher effective areas), the CMP-treated Cu surface should present a more uniform substrate for the adsorption of T2− compared to its counterpart without a CMP treatment. Such an effect appears to be manifested in lower values of RA and RQ measured for the CMP-treated Cu surface that was exposed to the PCMPC solution of TA without brushing.
Most notable in the results presented in Figure 8 and Table 3 are the differences found between the surface morphologies of the brushed and unbrushed Cu surfaces. The comparatively rougher surface topographies for the unbrushed Cu samples are evident in the different scales of the vertical (height) axis associated with these two types of samples. When the Cu sample surface is brush-scrubbed in the PCMPC solution, the tartrate adlayer of Cu continues to be removed as it forms, along with any pre-existing CMP residues at the surface. This is observed in the results presented in Figure 3, Figure 4 and Figure 7, and in the (RA, RQ) values shown in Table 3 for the brushed Cu samples. The values of these roughness factors for the brushed surface are notably smaller than their unbrushed counterparts, and are nearly independent of the sample’s CMP pretreatment. According to these observations, the brushing of the Cu surface effectively removes the residues from the CMP-treated surface, and the roughness of a Cu surface cleaned in this way becomes comparable to that of a CMP-free Cu surface. Thus, the AFM results presented in Figure 8 and Table 3 independently establish the efficiency of brush scrubbing, which we have observed here in the tribo-electrochemical data.
It is useful to further note in this context that CMP residues at a Cu wafer surface can contribute to increasing the wafer’s surface roughness, but the extent of this residue-generated roughness tends to be relatively small for abrasive-free CMP (as considered here) compared to the cases of abrasive-based CMP [112,113,114]. Additionally, if a cleaning solution also acts as a corrosion inhibitor, the surface protecting species (such as the T2− used in this work) adsorbs onto the surface being cleaned, and affects the results of AFM measurements involving such systems. In these cases, and without employing advanced AFM techniques [115], it is difficult to determine the efficiency of the chemical component of PCMPC using conventional AFM based assessments of roughness factors. On the other hand, CMP residues of both abrasive-free and abrasive-based processes affect the electrochemical activity of a post-CMP surface. Additionally, the electrochemical signals registered from a PCMPC-processed Cu sample represent the average surface condition of the full sample surface, while local surface effects may dominate the AFM data for such samples. The electrochemical features of PCMPC-processed surfaces can be readily detected, even when the features are relatively weak. In the next section, we illustrate an electrochemical method for evaluating PCMPC efficiencies for the TA-based system studied here.
3.8. Residue Removal Efficiency (RRE) of Post-CMP Cleaning
The RRE of a PCMPC solution can be conveniently determined using the electrochemical approach [11,12,116]. This generally involves comparative measurements of the polarization resistances, Rp, for a set of samples in a sensing solution after treating the samples under different conditions of CMP and PCMPC. The sensing solution should be electrochemically nonreactive towards the CMP residues, and only weakly reactive towards a clean Cu surface (sufficient to generate a measurable current signal). Thus, the clean surface regions of the Cu test sample provide a relatively weak faradaic response to the electrochemical perturbation voltages, while the nonreacting CMP residues act to block the reaction sites associated with this response. The resulting polarization resistance measures the strength of the faradaic signal, which generally leads to relatively high values of Rp, and these values increase with increasing coverage of CMP residues at the test surface. The evaluation of RRE in this approach generally requires three different values of Rp, measured in the sensing solution for three Cu samples with different pretreatments. These are named as follows [11]: samples (I) CMP, (II) CMP + PCMPC, and (III) PCMPC; the nomenclatures of these samples are explained in Table 4.
Table 4.
Designations of Cu film test samples according to sample treatments.
Denoting the fractional surface coverage of CMP residues on the Cu sample before and after PCMPC as θr and θrc, respectively (θrc ≤ θr), the RRE can be defined as follows [11]:
This indicates the following limiting cases of Equation (33): for the most efficient surface cleaning, and for the most inefficient surface cleaning. To express the above RRE formula in terms of sample-dependent polarization resistances, we assume that the PCMPC sample is the “cleanest” one (with negligible amounts of surface adsorbates) among the three samples tested. In a phenomenological approach, the polarization resistance, Rp(PCMPC), for this sample can be described (before scaling with the sample’s surface area) as follows [117]:
where the term K depends on the current–overpotential characteristics of the specific surface reaction being probed, and As is the clean sample’s surface area. Similarly, the polarization resistances for the CMP sample and the CMP + PCMPC sample can be assumed to have the forms Rp(CMP) ≈ K/[(1 – θr)As] and Rp(CMP + PCMPC) ≈ K/[(1 – θrc)As], respectively.
Rp(PCMPC) ≈ (K/As)
Because the same sensing solution and the same electrochemical cell are used to measure Rp for all these three cases, the K term embedded in the above expressions of Rp should have essentially the same value for the three samples. The value of As is experimentally controlled to be the same for the different samples. Based on these descriptions of Rp, Equation (33) can be expressed as follows [33]:
This yields two sets of results, RRE [no brush (NB)] and RRE [dynamic brush (DB)], for the brush free and brush-operated cleaning cases, respectively.
To measure the polarization resistances included in Equation (35), we use a pH-neutral sensing solution of neutral 0.1 M KNO3, which is mostly non-interacting as regards (clean) Cu surfaces. As we discussed in the Supporting Materials, the cathodic and anodic faradaic activities of Cu in this sensing solution are supported, respectively, by the ORR in Equation (16) and reaction (15) of Cu(OH) formation. The values of Rp associated with this system can be measured using EIS at the OCP, or using the linear polarization resistance (LPR) technique with LSV experiments performed under low-voltage activation near the equilibrium potential (OCP or Ecorr) [102]. In the present case, EIS was found to be unsuitable for these measurements, as the systems involving the PCMPC sample led to time-dependent EIS spectra due to OCP fluctuations in some cases. Therefore, LSV was employed to determine Rp in the sensing solution. The results obtained for brush-free and brush-operated PCMPC are presented in Figure 9A and Figure 9B, respectively.
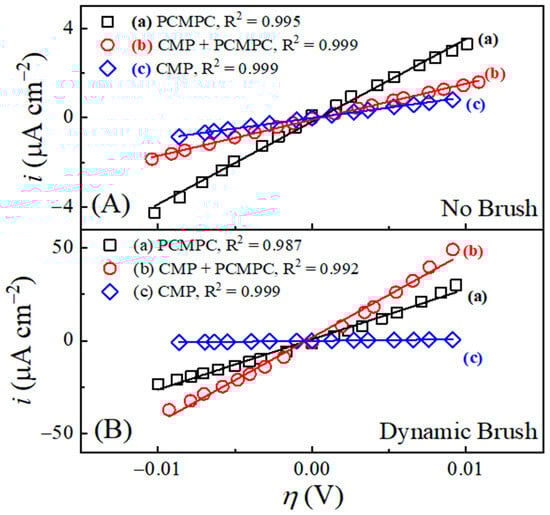
Figure 9.
LPR plots for Cu wafer films, recorded ex situ at low overpotentials in pH-neutral 0.1 M KNO3, after different CMP and/or PCMPC treatments of the samples. The solid traces are linear fits to the data (symbols). Panel (A,B) show the data for the unbrushed and brushed Cu samples, respectively. The samples associated with the individual plots are indicated following the sample designations introduced in Table 3. The coefficient of determination (R2 parameter) for each fit is stated.
The horizontal axis in each panel of Figure 9 represents an overpotential range of . This range is maintained below the thermal voltage, at 0.026 V. The symbols are experimental data points and the lines are linear fits to the data. Rp was calculated from the slopes of these fits, using the following definition [102]:
where is sample-area-normalized, and is the measured current density. The values of obtained from Figure 9 are presented in Table 5. Unlike the case of the in situ experiments in the TA-based PCMPC solution, the ex situ CMP residues in the sensing solution are electrochemically passive. Due to this reason, the values of increase in the order of increasing surface coverages of CMP residues, which is a trend opposite to that of the data shown in Table 2 for the PCMPC solution. Moreover, the values listed in Table 5 are rather large, being typical of electrodes’ weakly interacting electrolytes [117]. This confirms that the intrinsic faradic response of the Cu surface in the sensing solution is quite weak (highly resistive), as intended in the experimental scheme of RRE measurements.
Table 5.
Sample designations and linear polarization results obtained from ex Situ Testing of Different Cu Samples.
The RRE results obtained by incorporating the LPR data from Table 4 in Equation (35) are as follows:
where the role of surface brushing in residue removal is clearly indicated in the notably improved RRE found under brush scrubbing. The above results suggest that some adsorbates, specifically the tartrate ions used to support the chemical component of PCMPC, are retained on the unbrushed Cu surface after sample transfer to KNO3. The brush-cleaned CMP + PCMPC sample yields an RRE value that is indicative of nearly complete removal of the residues responsible for blocking faradaic reaction sites.
RRE without brush scrubbing: 56.6%.
RRE with brush scrubbing: 97.2%.
The above method of estimating RREs through measurements of Rp assumes that the residue-adsorbed surface sites of a cleaned post-CMP surface are blocked from effectively supporting charge transfer reactions. In most cases, abrasive particle residues of CMP (such as SiO2) are expected to fall into this category of electrochemically site-blocking species [117]. Therefore, although the present work focuses on abrasive-free CMP, the electrochemical method illustrated here to determine RREs should be mostly applicable to PCMPC for abrasive removal. Another related assumption of the present method is that of negligible faradaic interactions between CMP residues and the experimental sensing solution. If such interactions are present at a measurable level, the correspondingly determined RREs may become prone to overestimations. While this could be a potential limitation for the simple electrochemical estimation of RREs, the degrees of such overestimates should be minimal since surface coverages of faradaically active CMP residues following PCMPC are rather small in most cases. The RRE results published earlier for PCMPC systems involving multi-component cleaning solutions [116], including those of proprietary commercial formulations [12], are aligned with these considerations. To minimize the possibility of overestimating RREs, it is necessary to carefully design the ex situ sensing solutions with considerably suppressed electrochemical activities. Certain system-specific considerations for choosing these sensing solutions have been discussed previously [23].
4. Conclusions
The surface modification of Cu for CMP typically involves an intermediate step of Cu-oxide formation, and by reacting with slurry chemicals, these oxides generate mechanically removable materials of reduced hardness. Post-CMP Cu surfaces tend to contain residues of such oxides with other impurities, and together these residues can potentially have major negative effects on device performance. Using a model experimental system and tribo-electroanalytical measurements, here, we examined a tartrate-based PCMPC formulation for removing the oxide impurities and their co-adsorbed residues from CMP-processed Cu films. The primary focus of this study has been on the illustration of a tribo-electroanalytical methodology to probe the mechanisms and the efficiencies of surface residue removal in PCMPC. Additionally, we have demonstrated a relatively underexplored application of tartaric acid for cleaning residual Cu-oxides from pos-CMP Cu surfaces. TA should meet the criteria for relatively simple waste management protocols, and incorporation into neutral-pH solutions can help to minimize damages to the corrosion-prone barrier materials of interconnect structures.
The surface residues of Cu-CMP tested here for cleaning involved cupric and cuprous oxides, as well as Cu-BTA and Cu-Gly complexes, all formed by exposing Cu wafer coupon samples to a conventional CMP solution composed of glycine, H2O2, and BTA. In situ measurements of OCP transients, LSV, and EIS were carried out in combination with the mechanical scrubbing of Cu film samples that were strategically treated for CMP-specific surface modifications. The results of these experiments indicate that residual Cu-oxide surface species can be dissolved by reacting them with dissolved tartrate ions. The brushing of the Cu sample surface essentially completes this removal process by sweeping away the remaining weakly adsorbed residual species as well as the tartrate adsorbates. Cu-BTA and other residual complexes co-adsorbed with the oxide sites are also expected to be removed in the oxide cleaning process.
The presence of (electro)chemically dissolved CMP residues in a closed (non-flowing) cleaning solution did not lead to secondary complex formations or strong re-adsorption at the Cu test surface. While partly restricting dissolution, the tartrate species adsorbed at the Cu surface did not passivate or irreversibly modify the surface. Comparative sets of CV data collected with and without surface brushing have shown that the hydrodynamic effects of brush scrubbing played a major role in the mechanical removal of solid residues from the CMP-treated Cu surface. The mechanism of this process is expected to be like that of abrasive particle removal via sliding and/or rolling. However, a major difference between these two cases is that the PCMPC solution substantially assists the mechanical component of residue removal by chemically and electrochemically weakening the residues’ adhesion to the surface. In a typical PCMPC environment, this function of surface chemistry is not generally available as a prevailing component of abrasive removal, and as a result, hydrodynamic effects alone do not yield high efficiency when cleaning abrasive residues in many cases.
Using the LPR method, we measured an RRE of ~56% for electrochemically surface blocking CMP residues in the absence of brush operation. In the presence of brushing, this RRE reached a value of ~97%. Based on this relatively high RRE obtained under brushing conditions, it is likely that the residues removed in this case included not only Cu-oxides, but also Cu-BTA and Cu-Gly residues that were co-deposited at the CMP-treated Cu surface. Aside from testing the surface cleaning and dissolution inhibition features of TA, the results of this study also demonstrate how the functions of surface brushing in PCMPC can be examined by coupling electrochemical measurements with dynamic brush scrubbing. Despite their simplistic features and rather basic instrumentation (compared to the complex arrangements of fab-based PCMPC), laboratory-scale evaluations of PCMPC solutions can play an important role in the selection and assessment of the additives used in such solutions. The incorporation of mechanically assisted surface cleaning with a PVA brush in these benchtop experiments can further augment the latter’s utility in the general field of PCMPC research.
To consider further extensions of the present study, it will be necessary to combine the tribo-electroanalytical approach of this work with additional direct measurements of RREs. Moreover, the CMP pretreatment used here is based on the approach of abrasive free planarization, which, in the present context, helps to set up a relatively simple framework for analyzing the complex interplay between the tribology and surface chemistry of PCMPC. Since most CMP strategies commonly used in the industrial setting involve abrasive-assisted planarization, the tribology-coupled electrochemical testing protocols should be extended to PCMPC studies of wafer samples pretreated with abrasive-based CMP slurries. A detailed comparison of the findings for abrasive-free and abrasive-assisted CMP pretreatments of post-CMP samples can provide a broader understanding of the tribo-electrochemical aspects of PCMPC. Additional considerations for standardizing this approach could include examinations of PCMPC formulations based on multiple cleaning agents and other additives.
Supplementary Materials
The following supporting information can be downloaded at: https://www.mdpi.com/article/10.3390/lubricants13070301/s1, Figure S1: Calculated pH dependent speciation diagrams for (A) glycine and (B) tartaric acid; Figure S2: Schematic diagrams showing the front (Cu-coated) surfaces of the unbrushed (on the left) and brushed (on the right) test samples. The widths, lengths and specific area-sectors of the two types of samples are shown. These parameters are explained in the text; Figure S3: Current density (i) vs. applied potential (E) obtained for a Cu polycrystalline disc sample by CV in a solution of 0.1 M KNO3 at pH = 7, exploring two different voltage limits around the Cu electrode’s OCP. For this system, the feature c2 (representing the onset of a cathodic reaction) does not occur until the electrode potential is made more negative of −0.8 V; Figure S4: Comparison of potentiodynamic polarization data plotted with and without implementing the ohmic corrections (IRs) for the different Cu samples. The current densities are plotted in their apparent values, which were obtained through dividing the recorded electrode currents by Aeff of each sample; Figure S5: Tafel extrapolations of IRS corrected polarization plots for different Cu samples: (A) Not CMP treated, no brush and (B) Not CMP treated, dynamic brush; (C) CMP treated, no brush, (D) CMP treated, dynamic brush. The values of Rs used here to perform the ohmic corrections of electrode potentials were obtained using EIS; Figure S6: Results of EIS stability tests for different Cu samples in the TA cleaning solution. For each sample, three Nyquist spectra were consecutively recorded in-situ (with or without surface brushing). These three Nyquist spectra for each sample are plotted together in the individual panels of Figure S6; these data demonstrate system-stability in the form of adequately superimposed impedance spectra that were collected over an extended period; Figure S7: Results of EIS stability tests in KNO3 for ex-situ treated Cu samples. The experiments were carried out in a pH neutral sensing solution of 0.1 M KNO3 using Cu samples that underwent different ex-situ surface treatments. For each sample, three Nyquist plots were recorded consecutively. The resulting Nyquist spectra are plotted here together in each panel. Although the samples considered in panels (B–E) exhibited good stability, the one checked in Figure S7A showed measurable instability as the sequentially collected Nyquist plots did not fully overlap. Figure S8: Calculated values of the normalized adsorption capacitance as a function of the fractional surface coverage (θT) of tartrate ions on the PCMPC sample. References [11,19,23,71,99,107,108,118] are cited in the supplementary materials.
Author Contributions
Experiments and data curation, C.M.R., K.U.G. and D.R.S.; methodology, C.M.R., D.R.S., K.U.G. and D.R.; validation, D.R. and K.U.G.; formal analysis, C.M.R., D.R. and K.U.G.; investigation, C.M.R., D.R.S., K.U.G. and D.R.; resources, D.R.; data curation, C.M.R. and K.U.G.; writing—original draft preparation, D.R.; writing—review and editing, C.M.R., D.R.S., K.U.G. and D.R.; visualization, D.R. and K.U.G.; supervision, D.R.; project administration, D.R.; funding acquisition, D.R. All authors have read and agreed to the published version of the manuscript.
Funding
The authors gratefully acknowledge partial support (Analytical Services 101429) from Entegris, Inc. (Danbury, CT, USA) in the initial stage of this work for the construction and development of the post-CMP cleaning test cell.
Institutional Review Board Statement
Not applicable.
Informed Consent Statement
Not applicable.
Data Availability Statement
The original contributions presented in the study are included in the article; further inquiries can be directed to the corresponding author.
Acknowledgments
Sincere thanks are extended to Michael White and Jun Liu at Entegris, Inc. for suggesting the initial design of the test cell and for providing the wafer samples and the Planarcore PVA brushes.
Conflicts of Interest
The authors declare that this study received funding from Entegris, Inc. The funder had the following involvement with the study: in the initial stage of this work for the construction and development of the post-CMP cleaning test cell.
References
- Chen, Y.; Mikhaylichenko, K.; Brown, B.; Redeker, F. Post-CMP Cleaning. In Handbook of Silicon Wafer Cleaning Technology; Elsevier: Amsterdam, The Netherlands, 2018; pp. 253–301. [Google Scholar]
- Hazarika, J.; Gupta, A.; Rajaraman, P.V. Post-chemical mechanical planarization cleaning technology. ECS J. Solid State Sci. Technol. 2023, 12, 114002. [Google Scholar] [CrossRef]
- Zhang, L.; Wang, T.; Nan, J.; Lu, X. Developing an Efficient Forward Design Method for Co Post-CMP Cleaning Formulations Based on Nanoparticle Removal Mechanisms. ACS Appl. Electron. Mater. 2023, 5, 6884–6896. [Google Scholar] [CrossRef]
- Yang, L.; Yin, D.; Zhang, W.; Han, T.; Zhao, P.; Wang, T.; Xia, Q. Study on Adsorption and Desorption Mechanism of CuO Particles on the Post-CMP Wafer Surface of Multi-Layered Copper. ECS J. Solid State Sci. Technol. 2024, 13, 124007. [Google Scholar] [CrossRef]
- Yamada, Y.; Yagi, Y.; Konishi, N.; Ogiso, N.; Katsuyama, K.; Asaka, S.; Noguchi, J.; Miyazaki, T. Analysis of post-chemical-mechanical-polishing cleaning mechanisms for improving time-dependent dielectric breakdown Reliability. J. Electrochem. Soc. 2008, 155, H301. [Google Scholar] [CrossRef]
- Hong, J.; Niu, X.; Liu, Y.; He, Y.; Zhang, B.; Wang, J.; Han, L.; Yan, C.; Zhang, J. Effect of a novel chelating agent on defect removal during post-CMP cleaning. Appl. Surf. Sci. 2016, 378, 239–244. [Google Scholar] [CrossRef]
- Kim, H.; Hong, S.; Jin, Y.; Lim, D.H.; Kim, J.-y.; Hwang, H.; Kim, T. Investigation of copper oxide ring formation during post chemical mechanical polishing cleaning of Cu interconnect. ECS J. Solid State Sci. Technol. 2017, 6, P542. [Google Scholar] [CrossRef]
- Beverina, A.; Bernard, H.; Palleau, J.; Torres, J.; Tardif, F. Copper photocorrosion phenomenon during post CMP cleaning. Electrochem. Solid-State Lett. 2000, 3, 156. [Google Scholar] [CrossRef]
- Votta, A.; Pipia, F.; Livellara, L.; Caminati, M.; Spadoni, S.; Ravizza, E.; Grasso, S.; Bollin, M.; Moroni, M.; Alessandri, M. Post CMP Wet Cleaning Influence on Cu Hillocks. Solid State Phenom. 2016, 255, 270–276. [Google Scholar]
- Chen, P.-L.; Chen, J.-H.; Tsai, M.-S.; Dai, B.-T.; Yeh, C.-F. Post-Cu CMP cleaning for colloidal silica abrasive removal. Microelectron. Eng. 2004, 75, 352–360. [Google Scholar] [CrossRef]
- Johnson, C.A.; Roy, D. Editors’ Choice—In Situ Electrochemical Evaluation of Post-CMP Cleaning Reactions for Cobalt and Copper Films under Brushing Conditions. ECS J. Solid State Sci. Technol. 2019, 8, P3163–P3174. [Google Scholar] [CrossRef]
- Johnson, C.; Liu, J.; White, M.L.; Roy, D. Tribo-Electrochemistry of Post-CMP Cleaning: Results for Co and Cu Wafer Films Brushed in Different Solutions. ECS J. Solid State Sci. Technol. 2021, 10, 054005. [Google Scholar] [CrossRef]
- Bilouk, S.; Broussous, L.; Nogueira, R.P.; Ivanova, V.; Pernel, C. Electrochemical behavior of copper and cobalt in post-etch cleaning solutions. Microelectron. Eng. 2009, 86, 2038–2044. [Google Scholar] [CrossRef]
- Wang, Q.; Yin, D.; Gao, B.; Tian, S.; Sun, X.; Liu, M.; Zhang, S.; Tan, B. Effect of arginine-based cleaning solution on BTA residue removal after Cu-CMP. Colloids Surf. A Physicochem. Eng. Asp. 2020, 586, 124286. [Google Scholar] [CrossRef]
- Yin, D.; Yang, L.; Ma, T.; Xu, Y.; Tan, B.; Yang, F.; Sun, X.; Liu, M. Synergistic effect of composite complex agent on BTA removal in post CMP cleaning of copper interconnection. Mater. Chem. Phys. 2020, 252, 123230. [Google Scholar] [CrossRef]
- Ryu, H.-Y.; Cho, B.-J.; Yerriboina, N.P.; Lee, C.-H.; Hwang, J.-K.; Hamada, S.; Wada, Y.; Hiyama, H.; Park, J.-G. Selection and optimization of corrosion inhibitors for improved Cu CMP and post-Cu CMP cleaning. ECS J. Solid State Sci. Technol. 2019, 8, P3058. [Google Scholar] [CrossRef]
- Tseng, W.-T.; Chu, P.; Siddiqui, S.; Canaperi, D.; Huang, Y.-P.; Gramigna, K.; Hsu, P.; Bernatis, P. Post Tungsten CMP Cleaning: Optimization for Cleaning Efficiency and Corrosion Reduction. ECS J. Solid State Sci. Technol. 2024, 13, 114004. [Google Scholar] [CrossRef]
- Rock, S.E.; Crain, D.J.; Zheng, J.P.; Pettit, C.M.; Roy, D. Electrochemical investigation of the surface-modifying roles of guanidine carbonate in chemical mechanical planarization of tantalum. Mater. Chem. Phys. 2011, 129, 1159–1170. [Google Scholar] [CrossRef]
- Rock, S.; Crain, D.; Pettit, C.; Roy, D. Surface-complex films of guanidine on tantalum nitride electrochemically characterized for applications in chemical mechanical planarization. Thin Solid Films 2012, 520, 2892–2900. [Google Scholar] [CrossRef]
- Steigerwald, J.; Duquette, D.; Murarka, S.; Gutmann, R. Electrochemical Potential Measurements during the Chemical-Mechanical Polishing of Copper Thin Films. J. Electrochem. Soc. 1995, 142, 2379. [Google Scholar] [CrossRef]
- Anik, M.; Osseo-Asare, K. Tungsten CMP: Application of mixed potential theory to the tungsten/iodate system. In Chemical Mechanical Planarization VI, Proceedings of the International Symposium, Orlando, FL, USA, 12–17 October 2003; Electrochemical Society: Pennington, NJ, USA, 2003. [Google Scholar]
- Zhang, S.; Wang, F.; Tan, B.; Li, W.; Gao, B.; He, Y. Recent advances and future developments in PVA brush scrubbing cleaning: A review. Mater. Sci. Semicond. Process. 2022, 152, 107122. [Google Scholar] [CrossRef]
- Santefort, D.; Roy, D. Electrochemistry of copper post-CMP cleaning examined in combination with brush-scrubbing in a malonic acid solution. J. Electroanal. Chem. 2024, 953, 118016. [Google Scholar] [CrossRef]
- Aksu, S.; Doyle, F.M. The Role of Glycine in the Chemical Mechanical Planarization of Copper. J. Electrochem. Soc. 2002, 149, G352–G361. [Google Scholar] [CrossRef]
- Aksu, S.; Wang, L.; Doyle, F.M. Effect of Hydrogen Peroxide on Oxidation of Copper in CMP Slurries Containing Glycine. J. Electrochem. Soc. 2003, 150, G718–G723. [Google Scholar] [CrossRef]
- Jani, C.K.; Venkataswamy, R.; Seo, J.; Krishnan, S. Revisiting the Roles of Chelator, Inhibitor, Oxidant, and Abrasive in High-Rate Copper CMP. ECS J. Solid State Sci. Technol. 2025, 14, 044003. [Google Scholar] [CrossRef]
- Kim, Y.J.; Kwon, O.J.; Kang, M.C.; Suh, M.-W.; Im, Y.; Kim, J.J. Development of a copper chemical mechanical polishing slurry at neutral pH based on ceria slurry. J. Electrochem. Soc. 2010, 157, H952–H958. [Google Scholar] [CrossRef]
- Gray, D.; Cahill, A. Theoretical Analysis of Mixed Potentials. J. Electrochem. Soc. 1969, 116, 443–447. [Google Scholar] [CrossRef]
- Wang, H.; Song, Z.; Liu, W.; Kong, H. Effect of hydrogen peroxide concentration on surface micro-roughness of silicon wafer after final polishing. Microelectron. Eng. 2011, 88, 1010–1015. [Google Scholar] [CrossRef]
- DeNardis, D.; Sorooshian, J.; Habiro, M.; Rogers, C.; Philipossian, A. Tribology and removal rate characteristics of abrasive-free slurries for copper CMP applications. Jpn. J. Appl. Phys. 2003, 42, 6809. [Google Scholar] [CrossRef]
- Nguyen, J.; Martin, G.; Carpio, R.; Grief, M.; Joshi, S. Performance Comparisons of Abrasive Containing and Abrasive Free Slurries for Copper Low-k CMP. MRS Online Proc. Libr. (OPL) 2002, 732, 14. [Google Scholar] [CrossRef]
- Penta, N.K. Abrasive-Free and Ultra-Low Abrasive Chemical Mechanical Polishing (CMP) Processes. In Advances in Chemical Mechanical Planarization (CMP), 2nd ed.; Woodhead Publishing: Duxford, UK, 2022; pp. 221–236. [Google Scholar]
- Kondo, S.; Sakuma, N.; Homma, Y.; Goto, Y.; Ohashi, N.; Yamaguchi, H.; Owada, N. Abrasive-Free Polishing for Copper Damascene Interconnection. J. Electrochem. Soc. 2000, 147, 3907. [Google Scholar] [CrossRef]
- Kim, H.J. Effect of brush treatment and brush contact sequence on cross contaminated defects during CMP in-situ cleaning. Tribol. Lubr. 2015, 31, 239–244. [Google Scholar] [CrossRef]
- Han, K.-M.; Kumar, S.; Khan, M.J.; Lee, J.-H.; Kim, T.-G.; Park, J.-G. Combined Effects of PVA Brush Scrubbing Parameters and Processes on Post-CMP Cross-Contamination. ECS J. Solid State Sci. Technol. 2025, 14, 044013. [Google Scholar] [CrossRef]
- Yang, L.; Tan, B.; Liu, Y.; Gao, B.; Han, C. Optimization of cleaning process parameters to remove abrasive particles in post-Cu CMP cleaning. J. Semicond. 2018, 39, 126002. [Google Scholar] [CrossRef]
- Shi, X.; Simpson, D.; Roy, D. Tribo-electrochemical characterization of Ru, Ta and Cu CMP systems using percarbonate based solutions. ECS J. Solid State Sci. Technol. 2015, 4, P5058. [Google Scholar] [CrossRef]
- Shi, X.; Rock, S.; Turk, M.; Roy, D. Minimizing the effects of galvanic corrosion during chemical mechanical planarization of aluminum in moderately acidic slurry solutions. Mater. Chem. Phys. 2012, 136, 1027–1037. [Google Scholar] [CrossRef]
- Zhou, J.; Niu, X.; Yang, C.; Huo, Z.; Lu, Y.; Wang, Z.; Cui, Y.; Wang, R. Surface action mechanism and planarization effect of sarcosine as an auxiliary complexing agent in copper film chemical mechanical polishing. Appl. Surf. Sci. 2020, 529, 147109. [Google Scholar] [CrossRef]
- Li, Y.; Liu, Y.; Wang, C.; Li, Y. Synergetic effect of chelating agent and nonionic surfactant for benzotriazole removal on post Cu-CMP cleaning. J. Semicond. 2016, 37, 086001. [Google Scholar] [CrossRef]
- Seo, J.; Vegi, S.H.; Babu, S. Post-CMP cleaning solutions for the removal of organic contaminants with reduced galvanic corrosion at copper/cobalt interface for advanced Cu interconnect applications. ECS J. Solid State Sci. Technol. 2019, 8, P379. [Google Scholar] [CrossRef]
- Wei, S.; Roy, D. Galvanodynamic probing of tribologically assisted material removal under chemical control: A cobalt/copper case study for application in chemical mechanical planarization. Tribol. Int. 2023, 179, 108185. [Google Scholar] [CrossRef]
- Aksu, S.; Doyle, F.M. Electrochemistry of copper in aqueous glycine solutions. J. Electrochem. Soc. 2001, 148, B51–B57. [Google Scholar] [CrossRef]
- Lu, J.; Garland, J.E.; Pettit, C.M.; Babu, S.V.; Roy, D. Relative roles of H2O2 and glycine in CMP of copper studied with impedance spectroscopy. J. Electrochem. Soc. 2004, 151, G717–G722. [Google Scholar] [CrossRef]
- Milazzo, G.; Caroli, S. Tables of Standard Electrode Potentials; John Wiley: New York, NY, USA, 1978. [Google Scholar]
- Cao, D.; Sun, L.; Wang, G.; Lv, Y.; Zhang, M. Kinetics of hydrogen peroxide electroreduction on Pd nanoparticles in acidic medium. J. Electroanal. Chem. 2008, 621, 31–37. [Google Scholar] [CrossRef]
- DeNardis, D.; Rosales-Yeomans, D.; Borucki, L.; Philipossian, A. Characterization of copper-hydrogen peroxide film growth kinetics. Thin Solid Films 2006, 513, 311–318. [Google Scholar] [CrossRef]
- Du, T.; Vijayakumar, A.; Desai, V. Effect of hydrogen peroxide on oxidation of copper in CMP slurries containing glycine and Cu ions. Electrochim. Acta 2004, 49, 4505–4512. [Google Scholar] [CrossRef]
- Baylan, N.; İlalan, İ.; İnci, İ. Copper oxide nanoparticles as a novel adsorbent for separation of acrylic acid from aqueous solution: Synthesis, characterization, and application. Water Air Soil Pollut. 2020, 231, 465. [Google Scholar] [CrossRef]
- Fonseca, I.T.; Marin, A.C.S.; Sá, A.C. The effect of SO2− 4 on the electrochemical behaviour of Cu in neutral medium. Electrochim. Acta 1992, 37, 2541–2548. [Google Scholar] [CrossRef]
- Patri, U.B.; Aksu, S.; Babu, S.V. Role of the Functional Groups of Complexing Agents in Copper Slurries. J. Electrochem. Soc. 2006, 153, G650–G659. [Google Scholar] [CrossRef]
- Blesa, M.A.; Weisz, A.D.; Morando, P.J.; Salfity, J.A.; Magaz, G.; Regazzoni, A.E. The interaction of metal oxide surfaces with complexing agents dissolved in water. Coord. Chem. Rev. 2000, 196, 31–63. [Google Scholar] [CrossRef]
- Tromans, D. Aqueous Potential-pH Equilibria in Copper-Benzotriazole Systems. J. Electrochem. Soc. 1998, 145, L42–L45. [Google Scholar] [CrossRef]
- Tamilmani, S.; Huang, W.; Raghavan, S.; Small, R. Potential-pH Diagrams of Interest to Chemical Mechanical Planarization of Copper. J. Electrochem. Soc. 2002, 149, G638–G642. [Google Scholar] [CrossRef]
- Finšgar, M.; Milošev, I. Inhibition of copper corrosion by 1,2,3-benzotriazole: A review. Corros. Sci. 2010, 52, 2737–2749. [Google Scholar] [CrossRef]
- Giziński, D.; Brudzisz, A.; Lee, J.; Harishchandre, R.; Choi, J.; Stȩpniowski, W.J.; Ziegler, K.J. Exploring the Impact of Chelating Agents on Copper Oxide Layer Formation and Morphology. Inorg. Chem. 2025, 64, 7437–7449. [Google Scholar] [CrossRef] [PubMed]
- Lin, J.-Y.; West, A.C.; Wan, C.-C. Adsorption and desorption studies of glycine and benzotriazole during Cu oxidation in a chemical mechanical polishing bath. J. Electrochem. Soc. 2008, 155, H396. [Google Scholar] [CrossRef]
- Kovačević, D.; Kobal, I.; Kallay, N. Adsorption of organic acids on metal oxides. The umbrella effect. Croat. Chem. Acta 1998, 71, 1139–1153. [Google Scholar]
- Kuhn, A.T.; Chan, C.Y. pH changes at near-electrode surfaces. J. Appl. Electrochem. 1983, 13, 189–207. [Google Scholar] [CrossRef]
- Zhang, L.; Wang, T.; Lu, X. The effect of citric acid based cleaning solution on particle adhesion and removal during post-Cu CMP cleaning. Microelectron. Eng. 2019, 216, 111090. [Google Scholar] [CrossRef]
- Tartaric Acid, USDA Technical Evaluation Report; USDA: Washington, DC, USA, 2011; pp. 1–12.
- Protopopoff, E.; Marcus, P. Potential–pH diagrams for hydroxyl and hydrogen adsorbed on a copper surface. Electrochim. Acta 2005, 51, 408–417. [Google Scholar] [CrossRef]
- Beverskog, B.; Puigdomenech, I. Revised Pourbaix diagrams for copper at 25 to 300 C. J. Electrochem. Soc. 1997, 144, 3476–3483. [Google Scholar] [CrossRef]
- Harada, K.; Kusano, T.; Shibata, T.; Kawase, Y. Investigation of Co surface reaction by in situ measurement for chemical mechanical planarization and post-chemical mechanical planarization cleaning. Jpn. J. Appl. Phys. 2018, 57, 07MD02. [Google Scholar] [CrossRef]
- Kuroda, A.; Otake, A.; Bernatis, P. Development of next generation post copper CMP cleaners. ECS Trans. 2013, 52, 575–580. [Google Scholar] [CrossRef]
- Janjam, S.; Peddeti, S.; Roy, D.; Babu, S. Tartaric acid as a complexing agent for selective removal of tantalum and copper in CMP. Electrochem. Solid State Lett. 2008, 11, H327. [Google Scholar] [CrossRef]
- Velarde, F.J.S.; Ortiz, J.A.Q.; Apaza, A.A.H.; de Namor, A.F.D. A New Approach for Increasing the Chelating Capacity of the Tartrate Ion in the Extraction of Copper from Ores. Metals 2023, 13, 1672. [Google Scholar] [CrossRef]
- Ballesteros, J.; Chainet, E.; Ozil, P.; Meas, Y.; Trejo, G. Electrodeposition of copper from non-cyanide alkaline solution containing tartrate. Int. J. Electrochem. Sci 2011, 6, 2632–2651. [Google Scholar] [CrossRef]
- Han, M.-j.; He, J.-y.; Wei, S.; Sai, L.; Heng, Y.; Tong, Y.; Xin, W.; Zhang, C.-y. Coordination configurations of cupric tartrate in electronic industry wastewater. Trans. Nonferrous Met. Soc. China 2022, 32, 3753–3766. [Google Scholar] [CrossRef]
- Schoenberg, L. The structure of the complexed copper species in electroless copper plating solutions. J. Electrochem. Soc. 1971, 118, 1571. [Google Scholar] [CrossRef]
- Łukomska, A.; Sobkowski, J. Potential of zero charge of monocrystalline copper electrodes in perchlorate solutions. J. Electroanal. Chem. 2004, 567, 95–102. [Google Scholar] [CrossRef]
- Monticelli, C. Corrosion Inhibitors. In Encyclopedia of Interfacial Chemistry; Wandelt, K., Ed.; Elsevier: Oxford, UK, 2018; pp. 164–171. [Google Scholar]
- Bock, C.; MacDougall, B. The influence of metal oxide properties on the oxidation of organics. J. Electroanal. Chem. 2000, 491, 48–54. [Google Scholar] [CrossRef]
- Peng, C.; Tong, H.; Yuan, P.; Sun, L.; Jiang, L.; Shi, J. Aggregation, sedimentation, and dissolution of copper oxide nanoparticles: Influence of low-molecular-weight organic acids from root exudates. Nanomaterials 2019, 9, 841. [Google Scholar] [CrossRef]
- Ribeiro da Silva, D.; Barbosa Ferreira, M.; do Nascimento Brito, C.; Ferro, S.; Martinez-Huitle, C.A.; De Battisti, A. Anodic Oxidation of tartaric ácid at different electrode materials. Curr. Org. Chem. 2012, 16, 1951–1956. [Google Scholar] [CrossRef]
- Rieger, A.; Sax, C.; Bauert, T.; Wäckerlin, C.; Ernst, K.H. Chiral molecules adsorbed on a solid surface: Tartaric acid diastereomers and their surface explosion on Cu (111). Chirality 2018, 30, 369–377. [Google Scholar] [CrossRef]
- Yan, H.-J.; Wang, D.; Han, M.-J.; Wan, L.-J.; Bai, C.-L. Adsorption and coordination of tartaric acid enantiomers on Cu (111) in aqueous solution. Langmuir 2004, 20, 7360–7364. [Google Scholar] [CrossRef]
- Sudhakaran, R.; Deepa, T.; Thirumavalavan, M.; Sabarimuthu, S.Q.; Babu, S.; Asokan, T.; Almansour, A.I.; Raja, P.B.; Perumal, K. Enhanced corrosion inhibition effect of sodium tartrate on copper in potable water. J. King Saud Univ.-Sci. 2023, 35, 102921. [Google Scholar] [CrossRef]
- Pounds, T.; Sieradzki, K.; Erlebacher, J.; Cammarata, R. Effects of acetic acid, tartaric acid and Pb UPD on Cu electrodeposition in sub-micron trenches. J. Electrochem. Soc. 2017, 164, D307. [Google Scholar] [CrossRef]
- Chan, H.Y.H.; Takoudis, C.G.; Weaver, M.J. Oxide film formation and oxygen adsorption on copper in aqueous media as probed by surface-enhanced Raman spectroscopy. J. Phys. Chem. B 1999, 103, 357–365. [Google Scholar] [CrossRef]
- King, F.; Quinn, M.; Litke, C. Oxygen reduction on copper in neutral NaCl solution. J. Electroanal. Chem. 1995, 385, 45–55. [Google Scholar] [CrossRef]
- De Chialvo, M.G.; Zerbino, J.; Marchiano, S.; Arvia, A. Correlation of electrochemical and ellipsometric data in relation to the kinetics and mechanism of Cu2O electroformation in alkaline solutions. J. Appl. Electrochem. 1986, 16, 517–526. [Google Scholar] [CrossRef]
- Benzbiria, N.; Zertoubi, M.; Azzi, M. Oxygen reduction reaction kinetics on pure copper in neutral sodium sulfate solution. SN Appl. Sci. 2020, 2, 2101. [Google Scholar] [CrossRef]
- Mischler, S. Triboelectrochemical techniques and interpretation methods in tribocorrosion: A comparative evaluation. Tribol. Int. 2008, 41, 573–583. [Google Scholar] [CrossRef]
- Timmer, B.; Sluyters-Rehbach, M.; Sluyters, J. Electrode kinetics and double layer structure. Surf. Sci. 1969, 18, 44–61. [Google Scholar] [CrossRef]
- Giziński, D.; Brudzisz, A.; Santos, J.S.; Trivinho-Strixino, F.; Stępniowski, W.J.; Czujko, T. Nanostructured anodic copper oxides as catalysts in electrochemical and photoelectrochemical reactions. Catalysts 2020, 10, 1338. [Google Scholar] [CrossRef]
- Cheng, Y.; Wang, S.; Li, H.; Wang, C.; Yang, Y.; Lei, S.; Li, S. Study on particle removal during the Co post-CMP cleaning process. Colloids Surf. A Physicochem. Eng. Asp. 2021, 627, 127189. [Google Scholar] [CrossRef]
- Baylan, N.; Dedecan, T.; Ilalan, I.; İnci, İ. Preparation of copper oxide nanoparticles as a novel adsorbent for the isolation of tartaric acid. Anal. Lett. 2021, 54, 2113–2125. [Google Scholar] [CrossRef]
- Xu, K.; Vos, R.; Vereecke, G.; Doumen, G.; Fyen, W.; Mertens, P.; Heyns, M.; Vinckier, C.; Fransaer, J. Particle adhesion and removal mechanisms during brush scrubber cleaning. J. Vac. Sci. Technol. B Microelectron. Nanometer Struct. Process. Meas. Phenom. 2004, 22, 2844–2852. [Google Scholar] [CrossRef]
- Burdick, G.; Berman, N.; Beaudoin, S. A theoretical evaluation of hydrodynamic and brush contact effects on particle removal during brush scrubbing. J. Electrochem. Soc. 2003, 150, G658. [Google Scholar] [CrossRef]
- Zhang, F.; Busnaina, A. Submicron particle removal in post-oxide chemical–mechanical planarization (CMP) cleaning. Appl. Phys. A 1999, 69, 437–440. [Google Scholar] [CrossRef]
- Sampurno, Y.; Philipossian, A.; Linhart, A.; Wortman-Otto, K.; Tseng, W.-T.; Tamboli, D.; Keleher, J. Understanding the Reasons Behind Defect Levels in Post-Copper-CMP Cleaning Processes with Different Chemistries and PVA Brushes. ECS J. Solid State Sci. Technol. 2021, 10, 064011. [Google Scholar] [CrossRef]
- Philipossian, A.; Mustapha, L. Tribological attributes of post-CMP brush scrubbing. J. Electrochem. Soc. 2004, 151, G456–G460. [Google Scholar] [CrossRef]
- Cho, H.C.; Kim, Y.M.; Lee, H.S.; Joo, S.B.; Jeong, H.D. The effect of PVA brush scrubbing on post CMP cleaning process for damascene Cu interconnection. Solid State Phenom. 2009, 145, 367–370. [Google Scholar]
- Friebel, D.; Broekmann, P.; Wandelt, K. Electrochemical in situ STM study of a Cu (111) electrode in neutral sulfate containing electrolyte. Phys. Status Solidi (a) 2004, 201, 861–869. [Google Scholar] [CrossRef]
- Feng, Y.; Teo, W.-K.; Siow, K.-S.; Tan, K.-L.; Hsieh, A.-K. The corrosion behaviour of copper in neutral tap water. Part I: Corrosion mechanisms. Corros. Sci. 1996, 38, 369–385. [Google Scholar] [CrossRef]
- Giri, S.D.; Sarkar, A. Electrochemical study of bulk and monolayer copper in alkaline solution. J. Electrochem. Soc. 2016, 163, H252. [Google Scholar] [CrossRef]
- Mosaferi, M.; Céolin, D.; Rueff, J.-P.; Selles, P.; Odelius, M.; Björneholm, O.; Ohrwall, G.; Carniato, S. Fingerprint of dipole moment orientation of water molecules in Cu2+ aqueous solution probed by X-ray photoelectron spectroscopy. J. Am. Chem. Soc. 2024, 146, 9836–9850. [Google Scholar] [CrossRef]
- Guo, L.; Zhao, X.; Bai, Y.; Qiao, L. Water adsorption behavior on metal surfaces and its influence on surface potential studied by in situ SPM. Appl. Surf. Sci. 2012, 258, 9087–9091. [Google Scholar] [CrossRef]
- Kim, H.J.; Bohra, G.; Yang, H.; Ahn, S.-G.; Qin, L.; Koli, D. Study of the cross contamination effect on post CMP in situ cleaning process. Microelectron. Eng. 2015, 136, 36. [Google Scholar] [CrossRef]
- Xu, K.; Vos, R.; Vereecke, G.; Doumen, G.; Fyen, W.; Mertens, P.; Heyns, M.; Vinckier, C.; Fransaer, J.; Kovacs, F. Fundamental study of the removal mechanisms of nano-sized particles using brush scrubber cleaning. J. Vac. Sci. Technol. B Microelectron. Nanometer Struct. Process. Meas. Phenom. 2005, 23, 2160–2175. [Google Scholar] [CrossRef]
- Stansbury, E.E.; Buchanan, R.A. Fundamentals of Electrochemical Corrosion; ASM International: Novelty, OH, USA, 2000. [Google Scholar]
- Scully, J.R. Polarization resistance method for determination of instantaneous corrosion rates. Corrosion 2000, 56, 199–218. [Google Scholar] [CrossRef]
- van der Heijden, O.; Park, S.; Vos, R.E.; Eggebeen, J.J.; Koper, M.T. Tafel slope plot as a tool to analyze electrocatalytic reactions. ACS Energy Lett. 2024, 9, 1871–1879. [Google Scholar] [CrossRef]
- Putra, R.P.; Samejima, Y.; Nakabayashi, S.; Horino, H.; Rzeznicka, I.I. Copper-based electrocatalyst derived from a copper chelate polymer for oxygen reduction reaction in alkaline solutions. Catal. Today 2022, 388, 360–364. [Google Scholar] [CrossRef]
- Zhang, X.; Zhang, Y.; Huang, H.; Cai, J.; Ding, K.; Lin, S. Electrochemical fabrication of shape-controlled Cu2O with spheres, octahedrons and truncated octahedrons and their electrocatalysis for ORR. New J. Chem. 2018, 42, 458–464. [Google Scholar] [CrossRef]
- Srinivasan, S. Electrode/Electrolyte Interfaces: Structure and Kinetics of Charge Transfer. In Fuel Cells: From Fundamentals to Applications; Srinivasan, S., Ed.; Springer: Boston, MA, USA, 2006; pp. 27–92. [Google Scholar]
- Emery, S.B.; Hubbley, J.L.; Roy, D. Time resolved impedance spectroscopy as a probe of electrochemical kinetics: The ferro/ferricyanide redox reaction in the presence of anion adsorption on thin film gold. Electrochim. Acta 2005, 50, 5659–5672. [Google Scholar] [CrossRef]
- Pettit, C.; Garland, J.; Walters, M.; Roy, D. Time resolved study of electrode reactions using Fourier transform impedance spectroscopy: Mutually correlated adsorption kinetics of Cu2+ and ClO4− on gold. Electrochim. Acta 2004, 49, 3293–3304. [Google Scholar] [CrossRef]
- Pajkossy, T.; Wandlowski, T.; Kolb, D.M. Impedance aspects of anion adsorption on gold single crystal electrodes. J. Electroanal. Chem. 1996, 414, 209–220. [Google Scholar]
- Jović, V.D.; Jović, B.M. EIS and differential capacitance measurements onto single crystal faces in different solutions: Part I: Ag(111) in 0.01 M NaCl. J. Electroanal. Chem. 2003, 541, 1–11. [Google Scholar] [CrossRef]
- Kirino, O.; Enomoto, T. Ultra-flat and ultra-smooth Cu surfaces produced by abrasive-free chemical–mechanical planarization/polishing using vacuum ultraviolet light. Precis. Eng. 2011, 35, 669–676. [Google Scholar] [CrossRef]
- Park, S.; Lee, H. Electrolytically ionized abrasive-free CMP (EAF-CMP) for copper. Appl. Sci. 2021, 11, 7232. [Google Scholar] [CrossRef]
- Yamada, Y.; Konishi, N.; Kurokawa, S.; Doi, T. Development of abrasive-free copper cmp process? reduction of copper residue using randomly formed polyurethane pad. J. Jpn. Soc. Precis. Eng. 2009, 75, 496–500. [Google Scholar] [CrossRef]
- Datta, D.; Rai, H.; Singh, S.; Srivastava, M.; Sharma, R.K.; Gosvami, N.N. Nanoscale tribological aspects of chemical mechanical polishing: A review. Appl. Surf. Sci. Adv. 2022, 11, 100286. [Google Scholar] [CrossRef]
- Venkatesh, R.P.; Cho, B.J.; Ramanathan, S.; Park, J.-G. Electrochemical Impedance Spectroscopy (EIS) Analysis of BTA Removal by TMAH during Post Cu CMP Cleaning Process. J. Electrochem. Soc. 2012, 159, C447–C452. [Google Scholar] [CrossRef]
- Gabrielli, C.; Keddam, M.; Takenouti, H.; Kinh, V.Q.; Bourelier, F. The relationship between the impedance of corroding electrode and its polarization resistance determined by a linear voltage sweep technique. Electrochim. Acta 1979, 24, 61–65. [Google Scholar] [CrossRef]
- Habib, M.; Bockris, J. Potential-dependent water orientation: An in situ spectroscopic study. Langmuir 1986, 2, 388–392. [Google Scholar] [CrossRef]

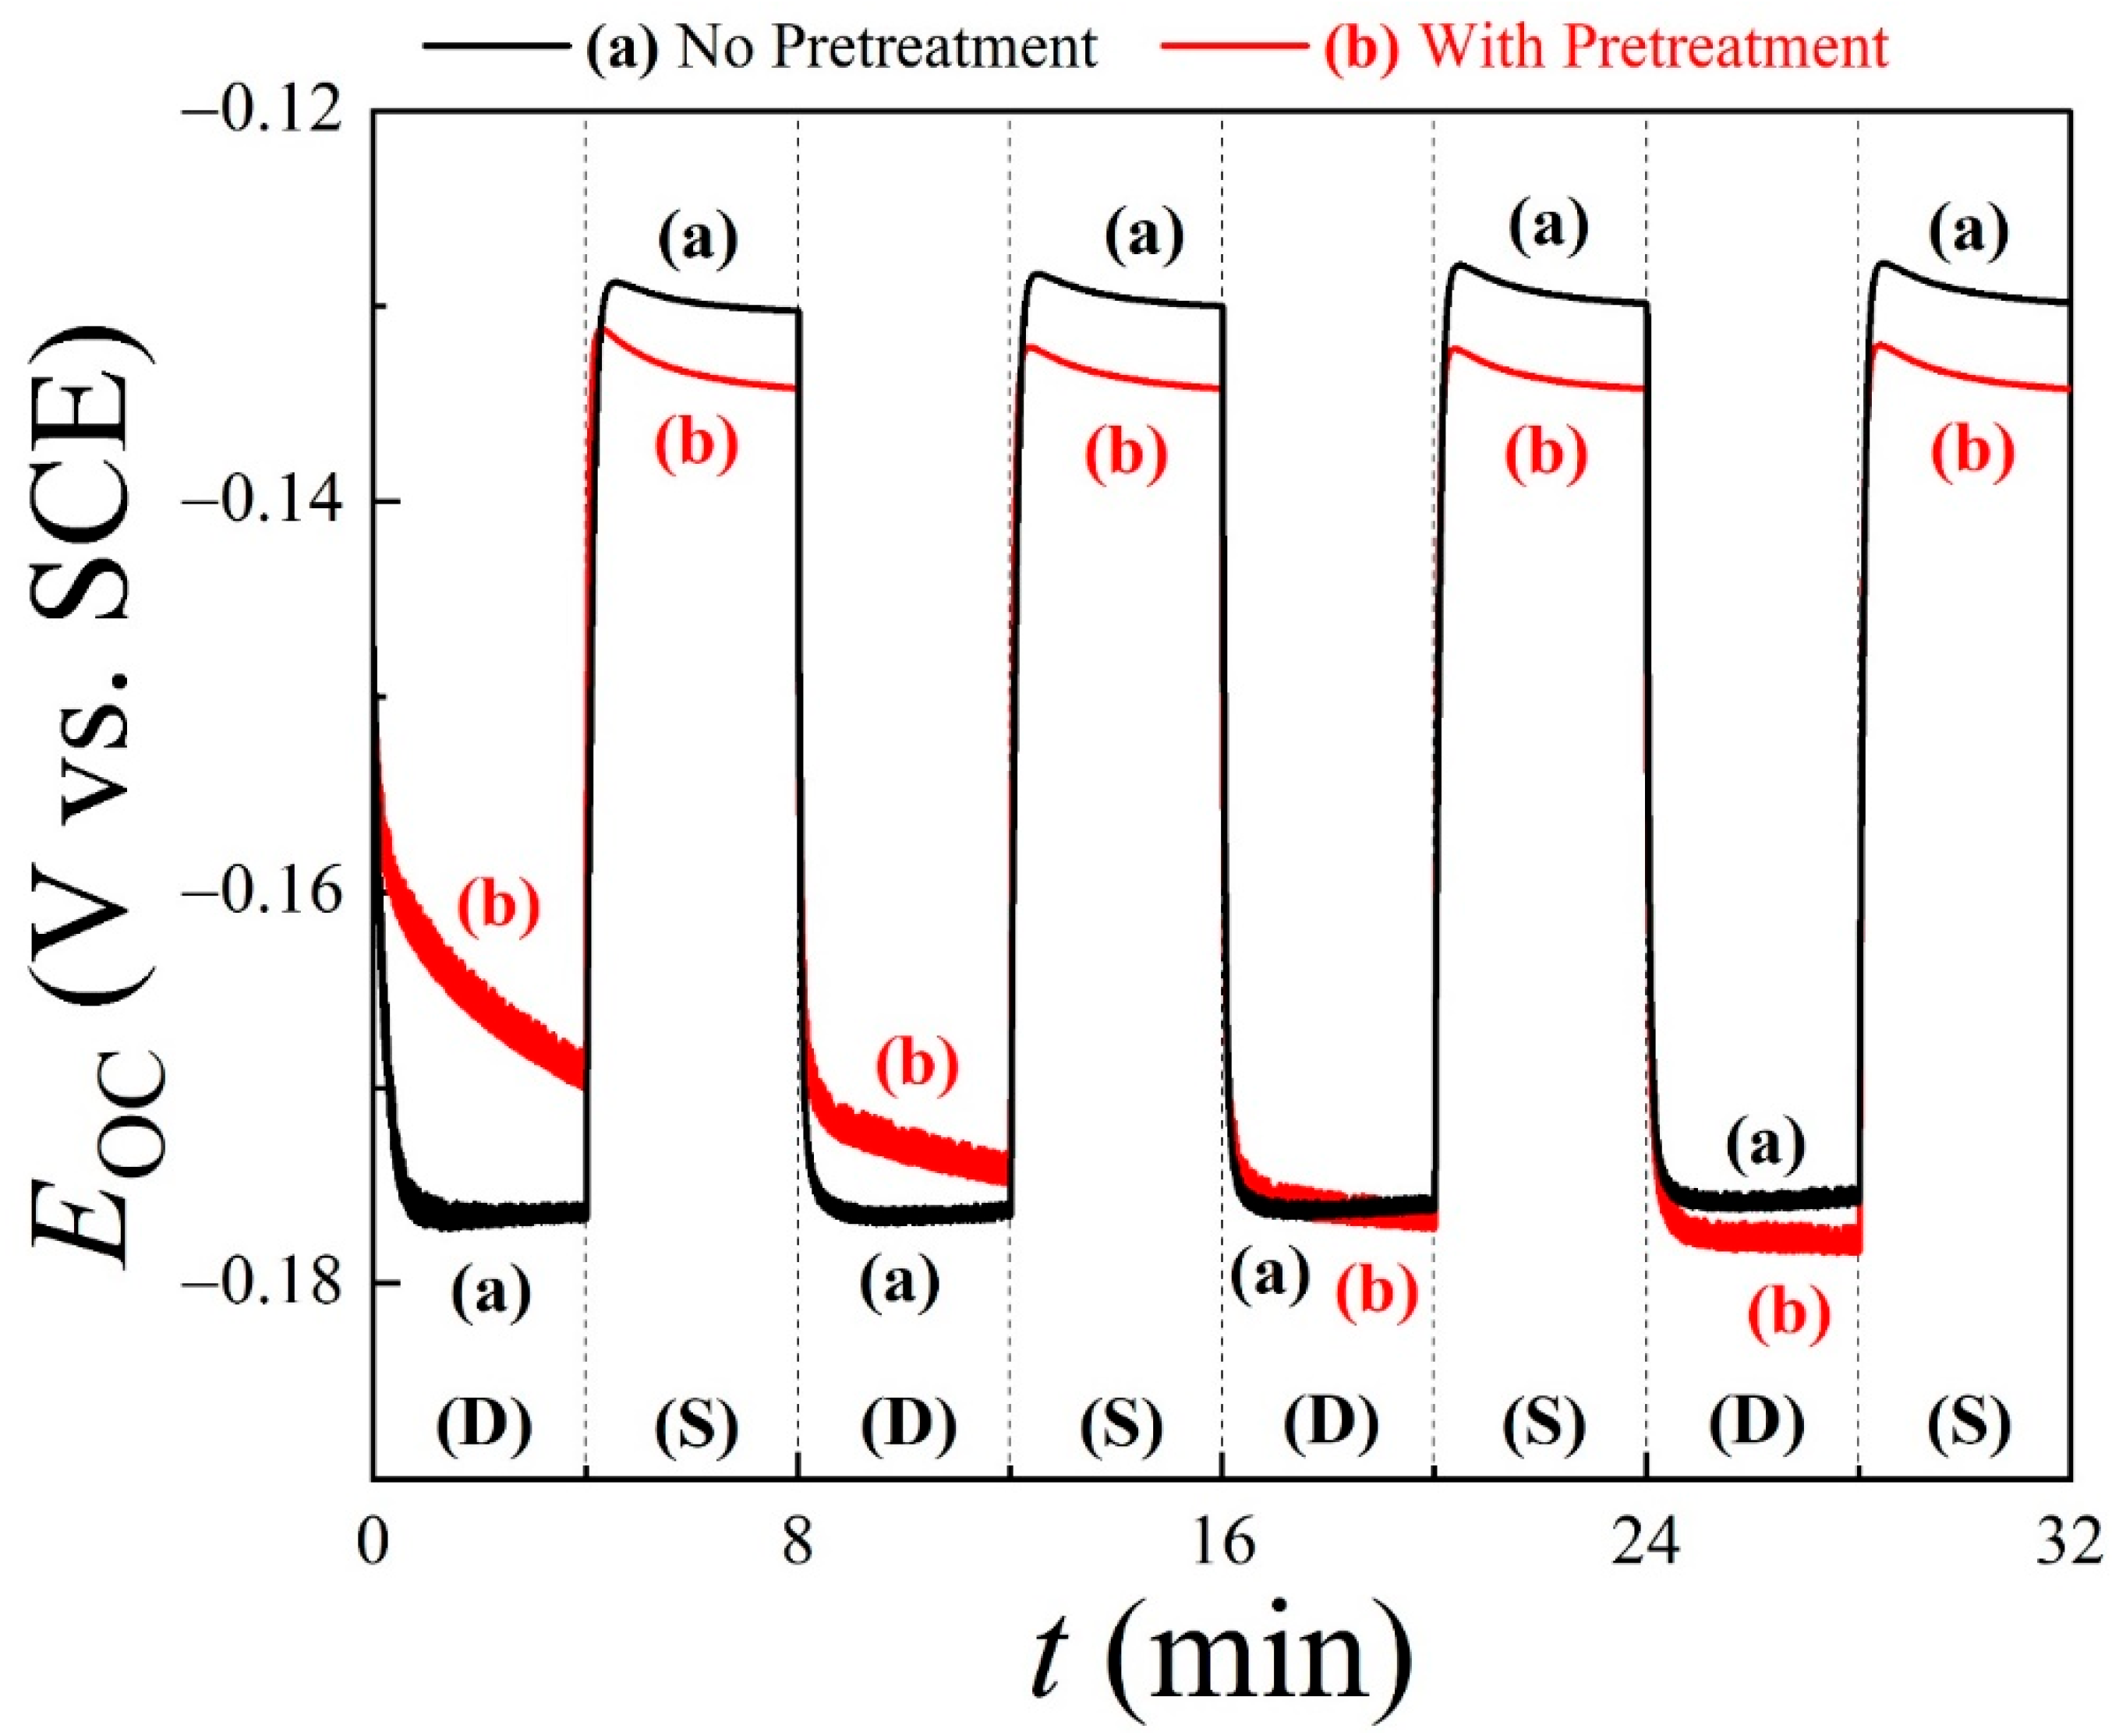
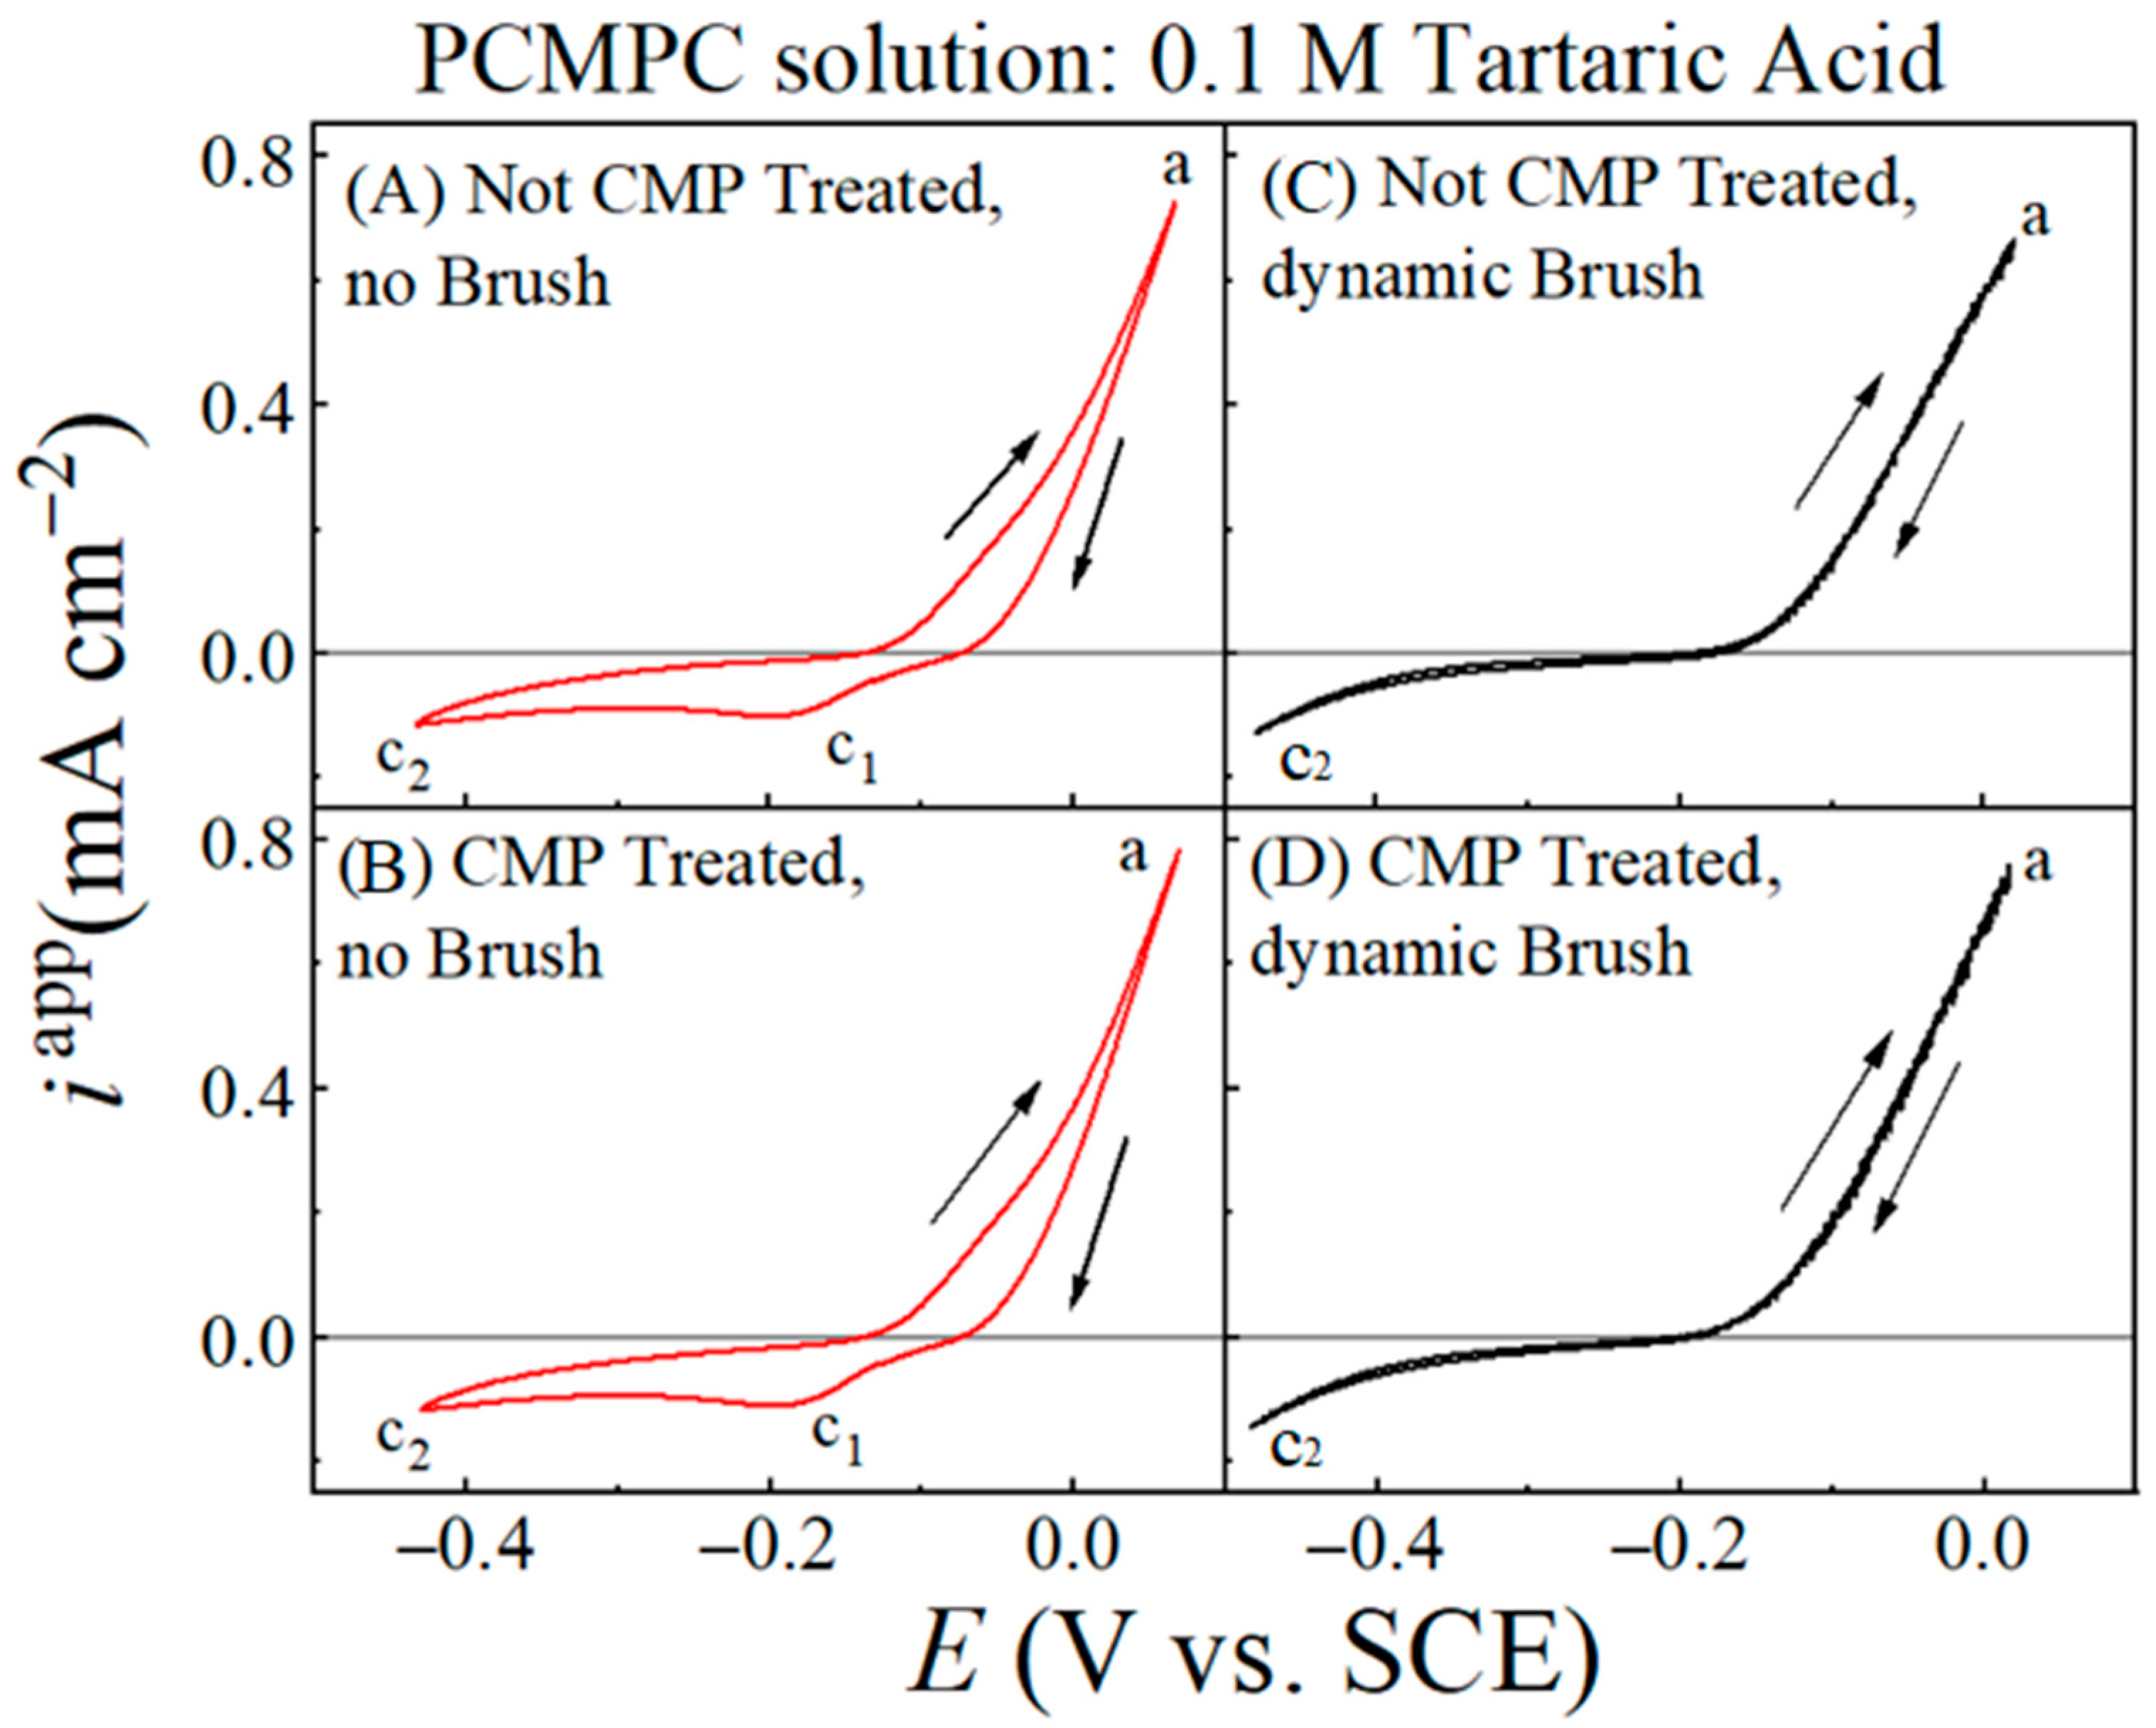
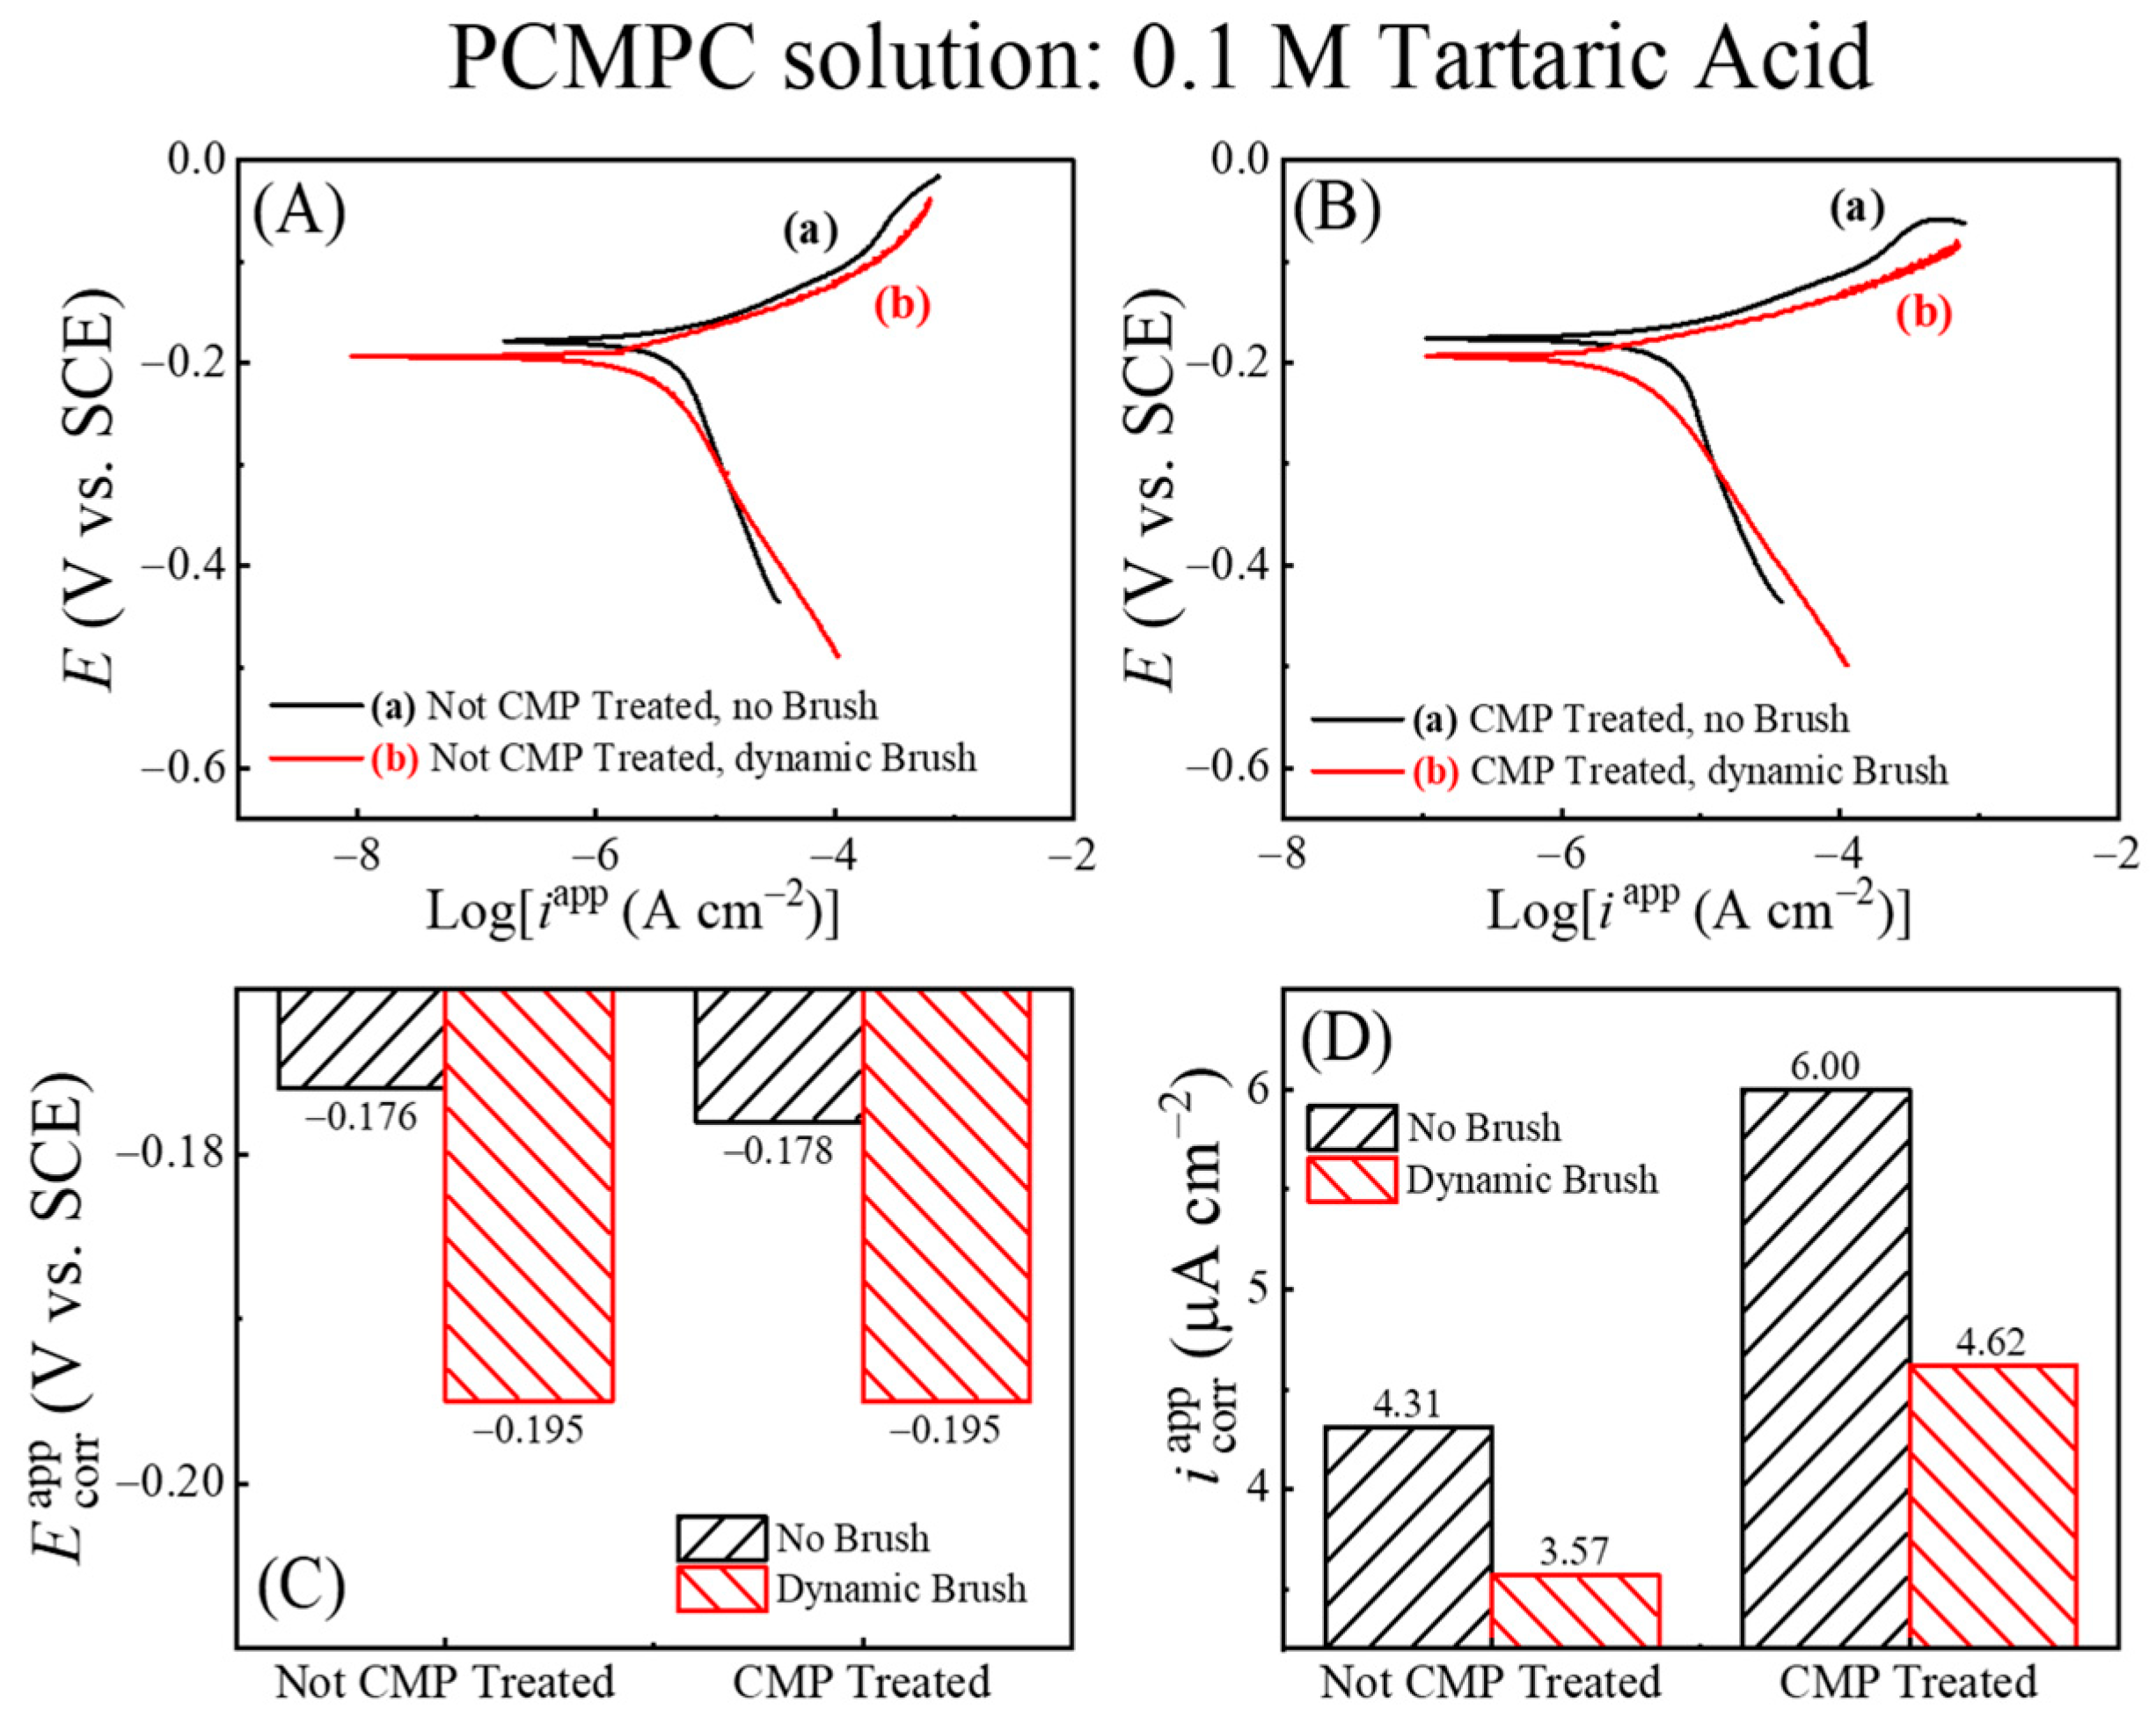
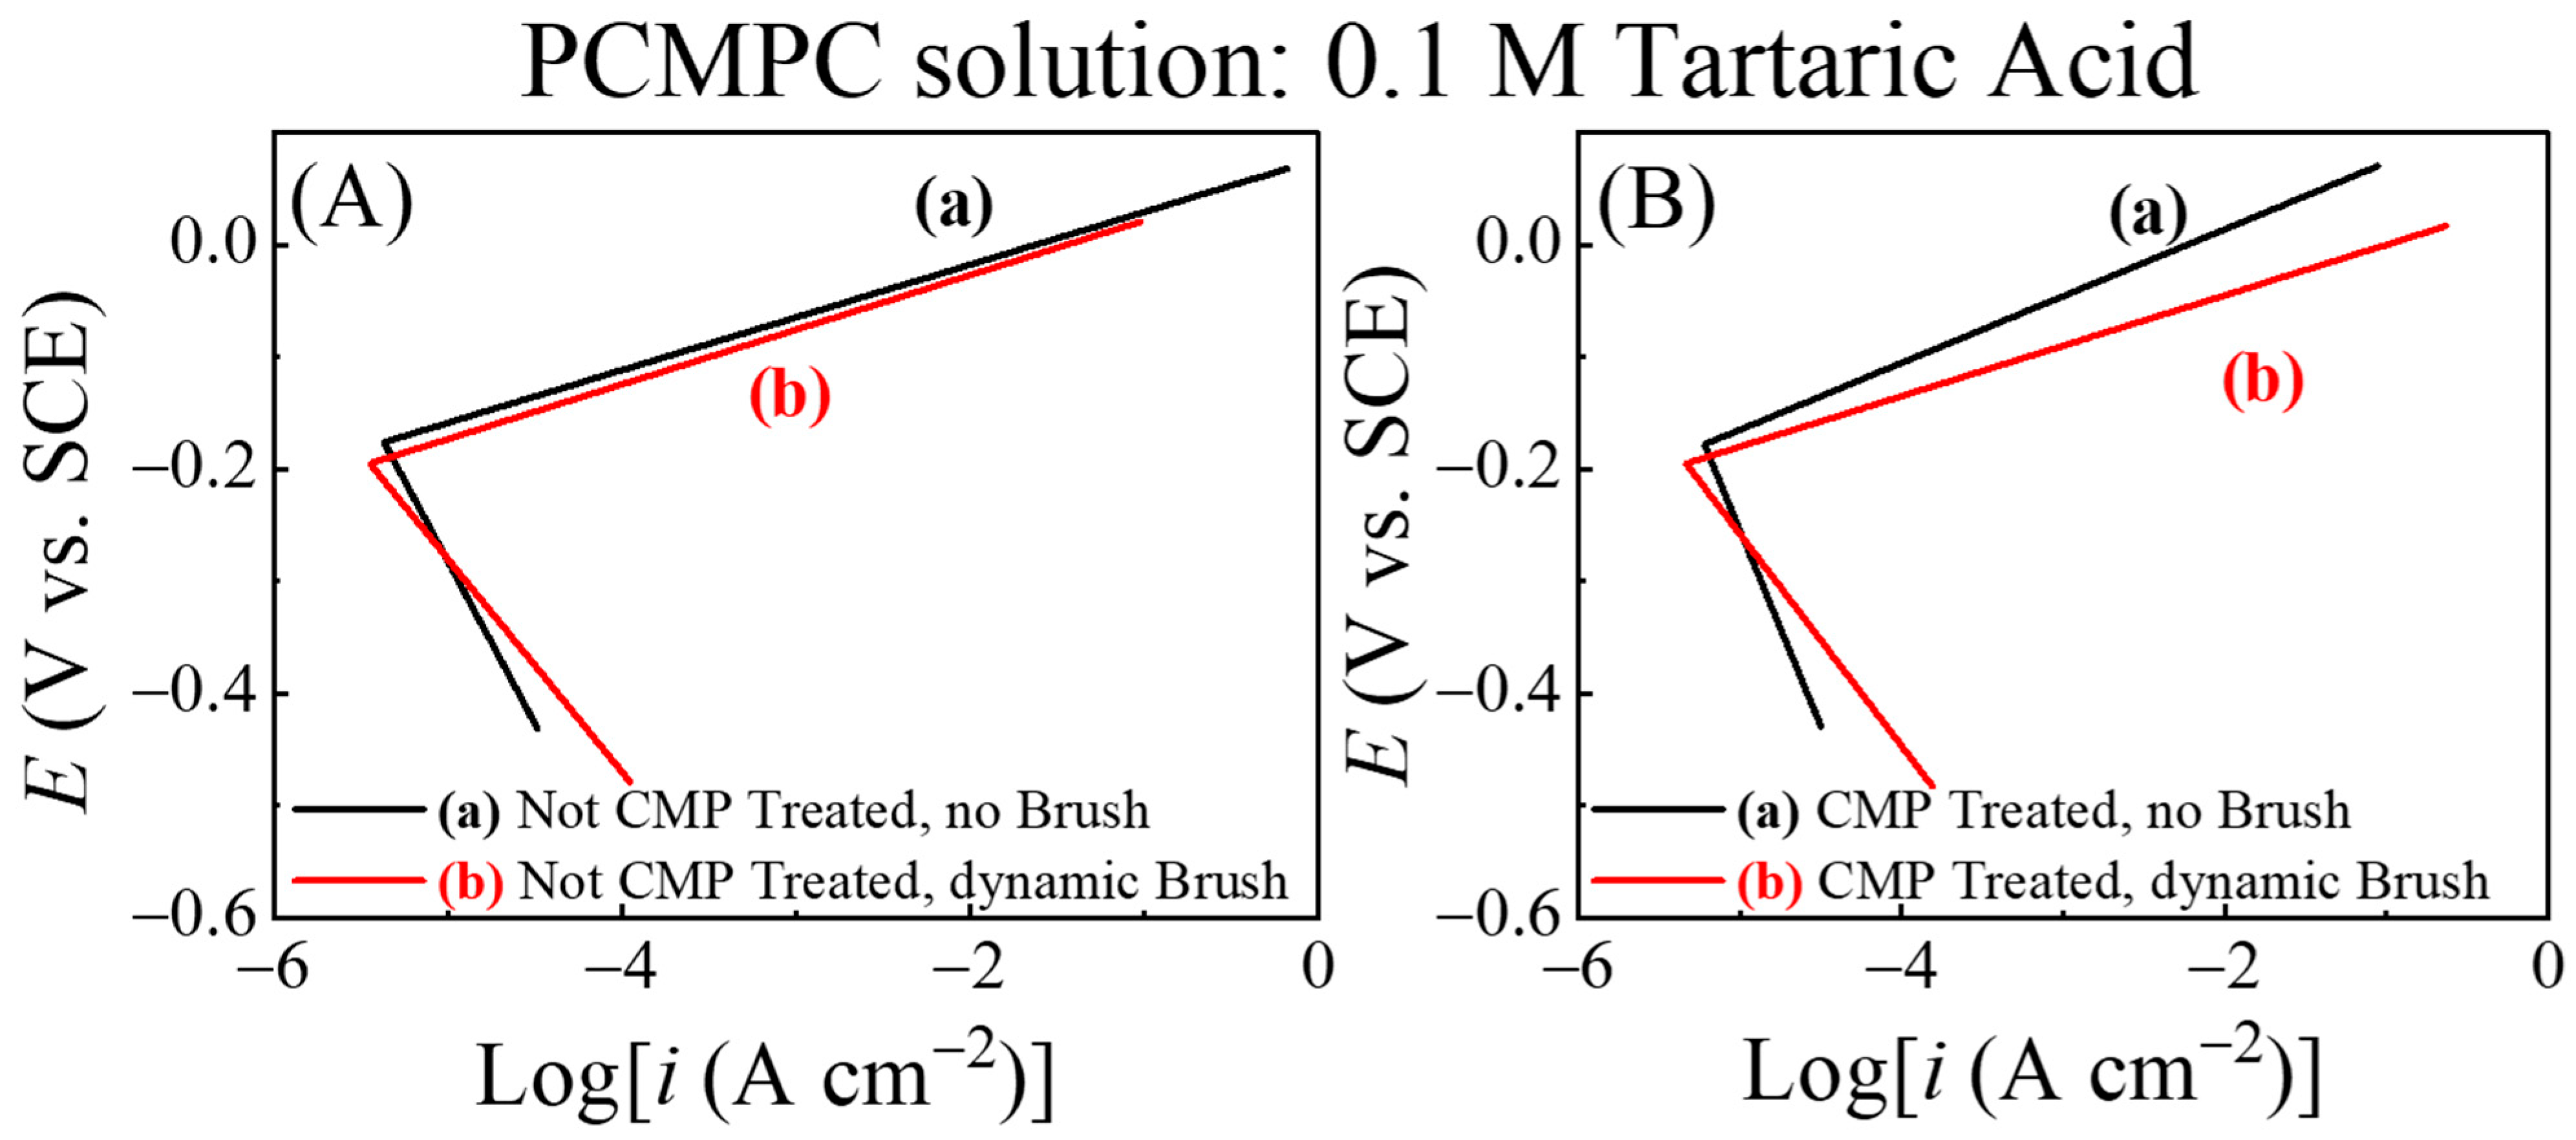
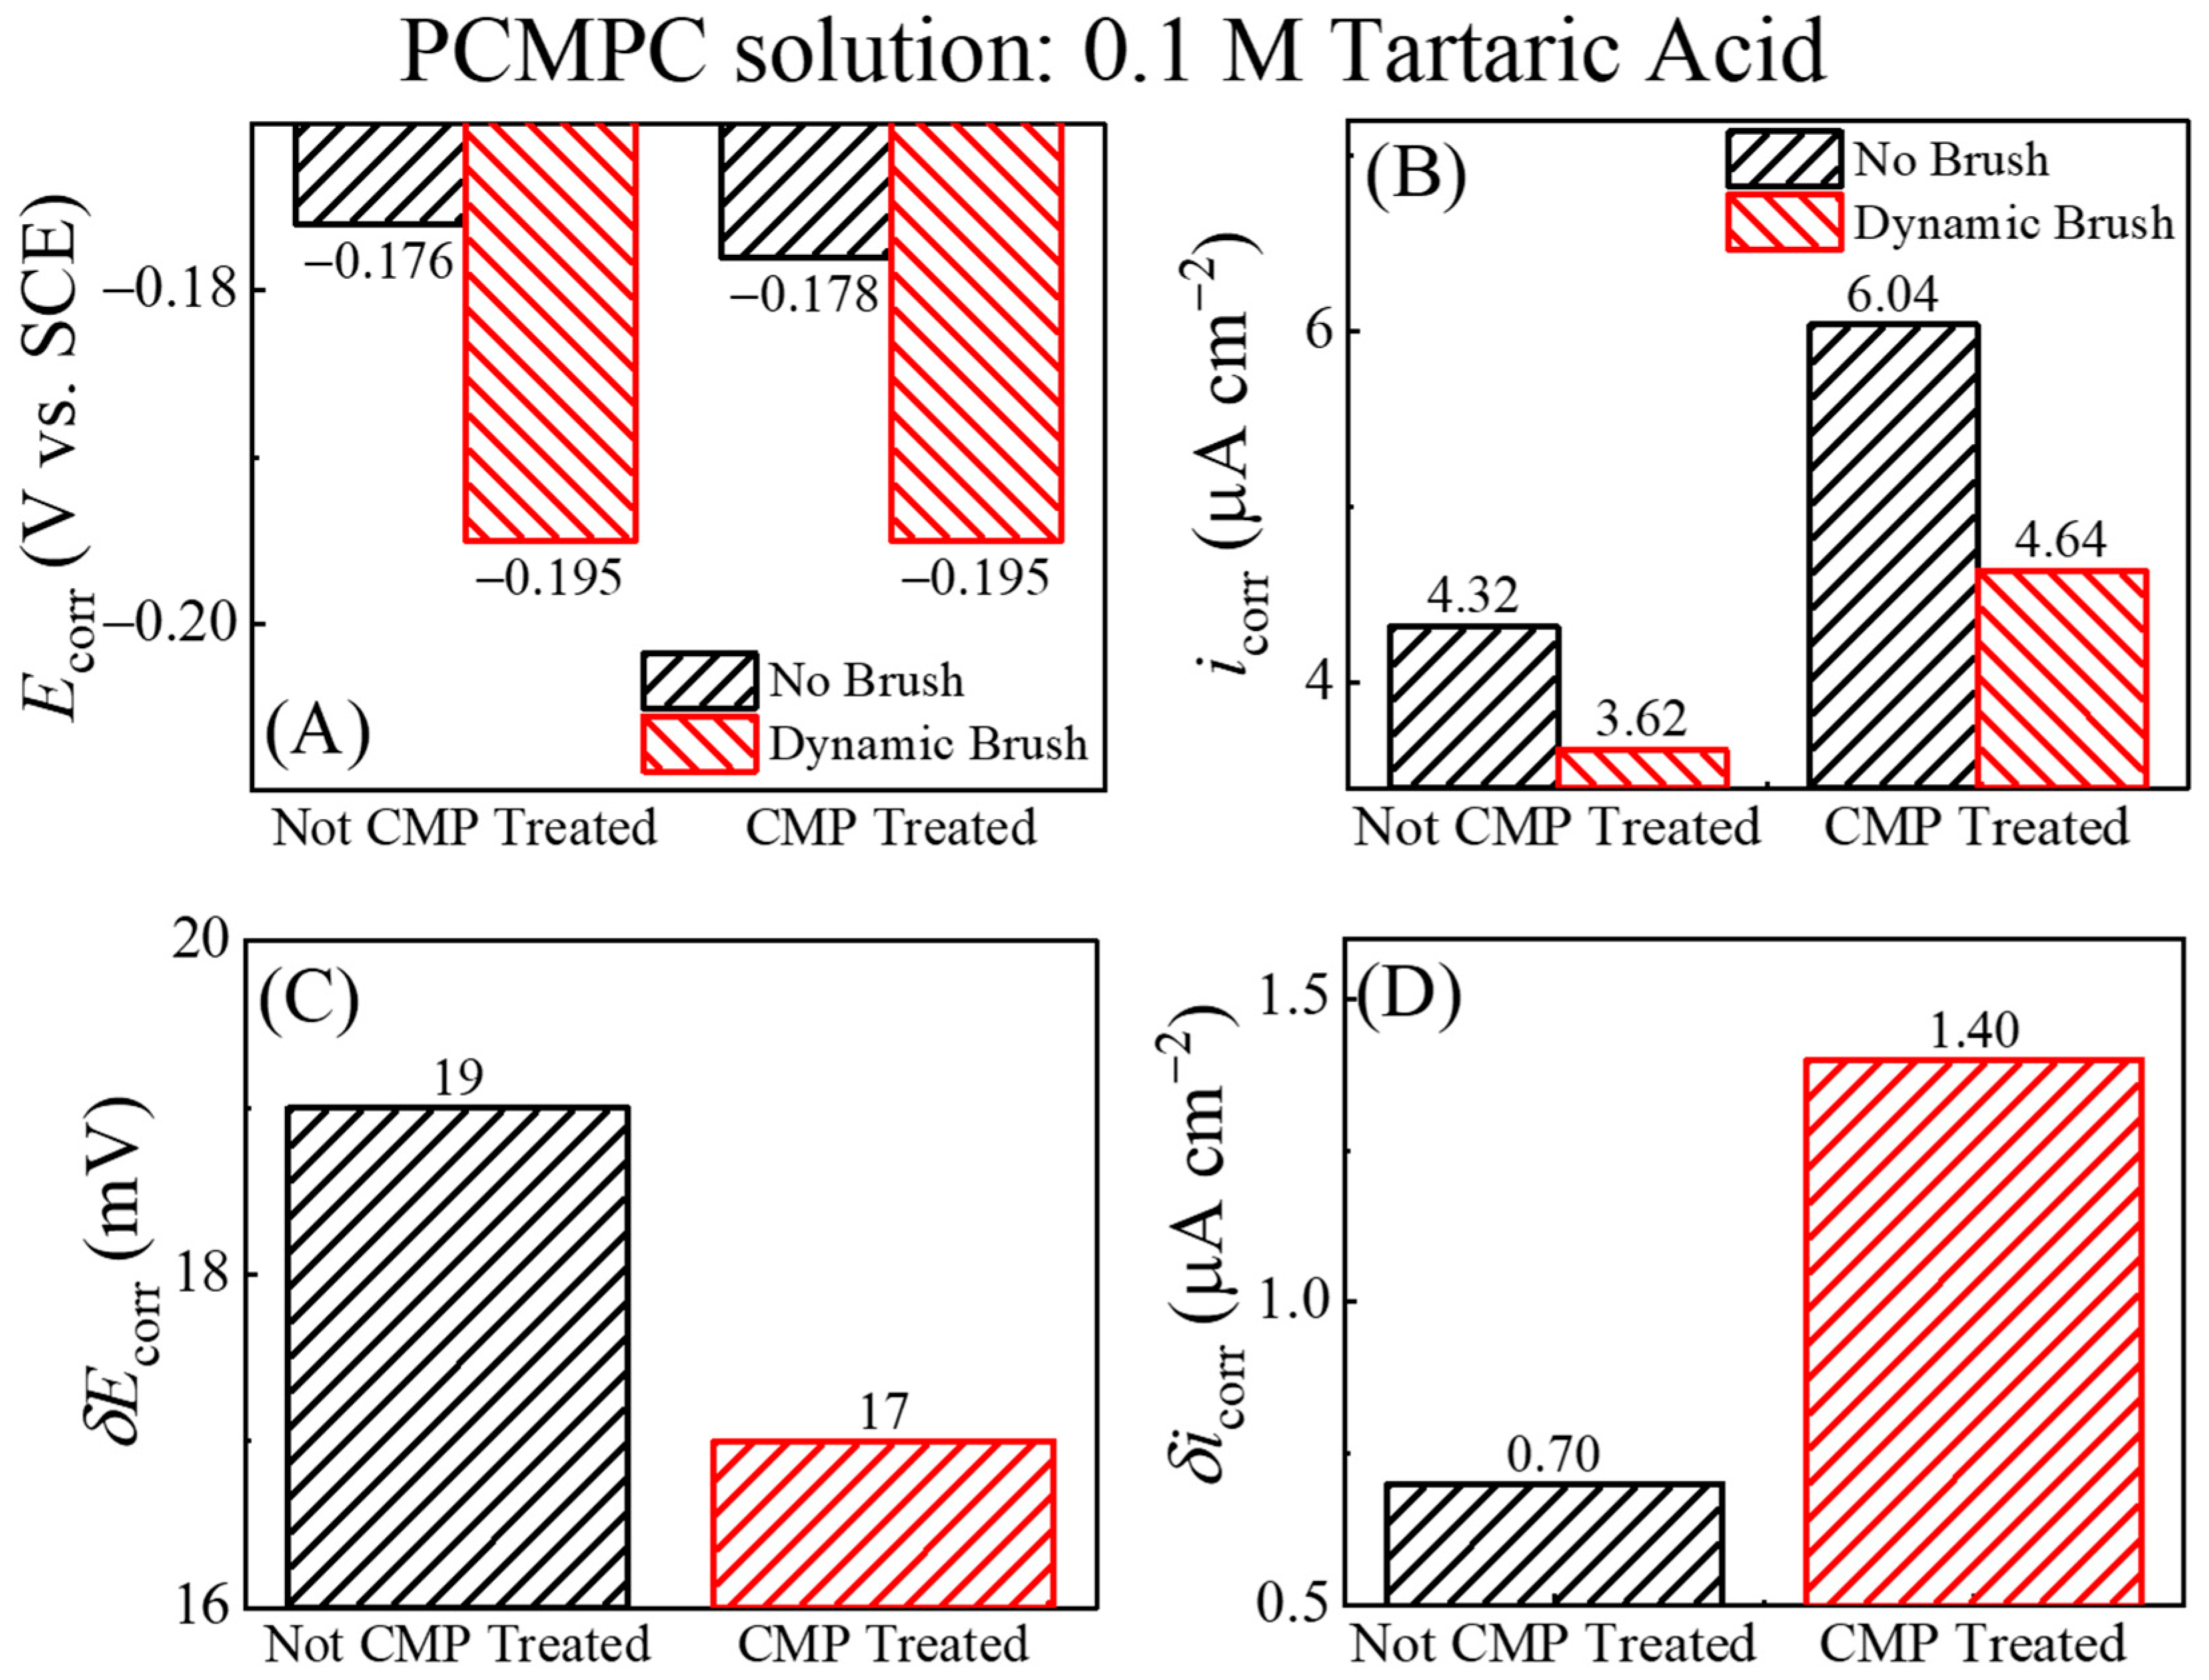
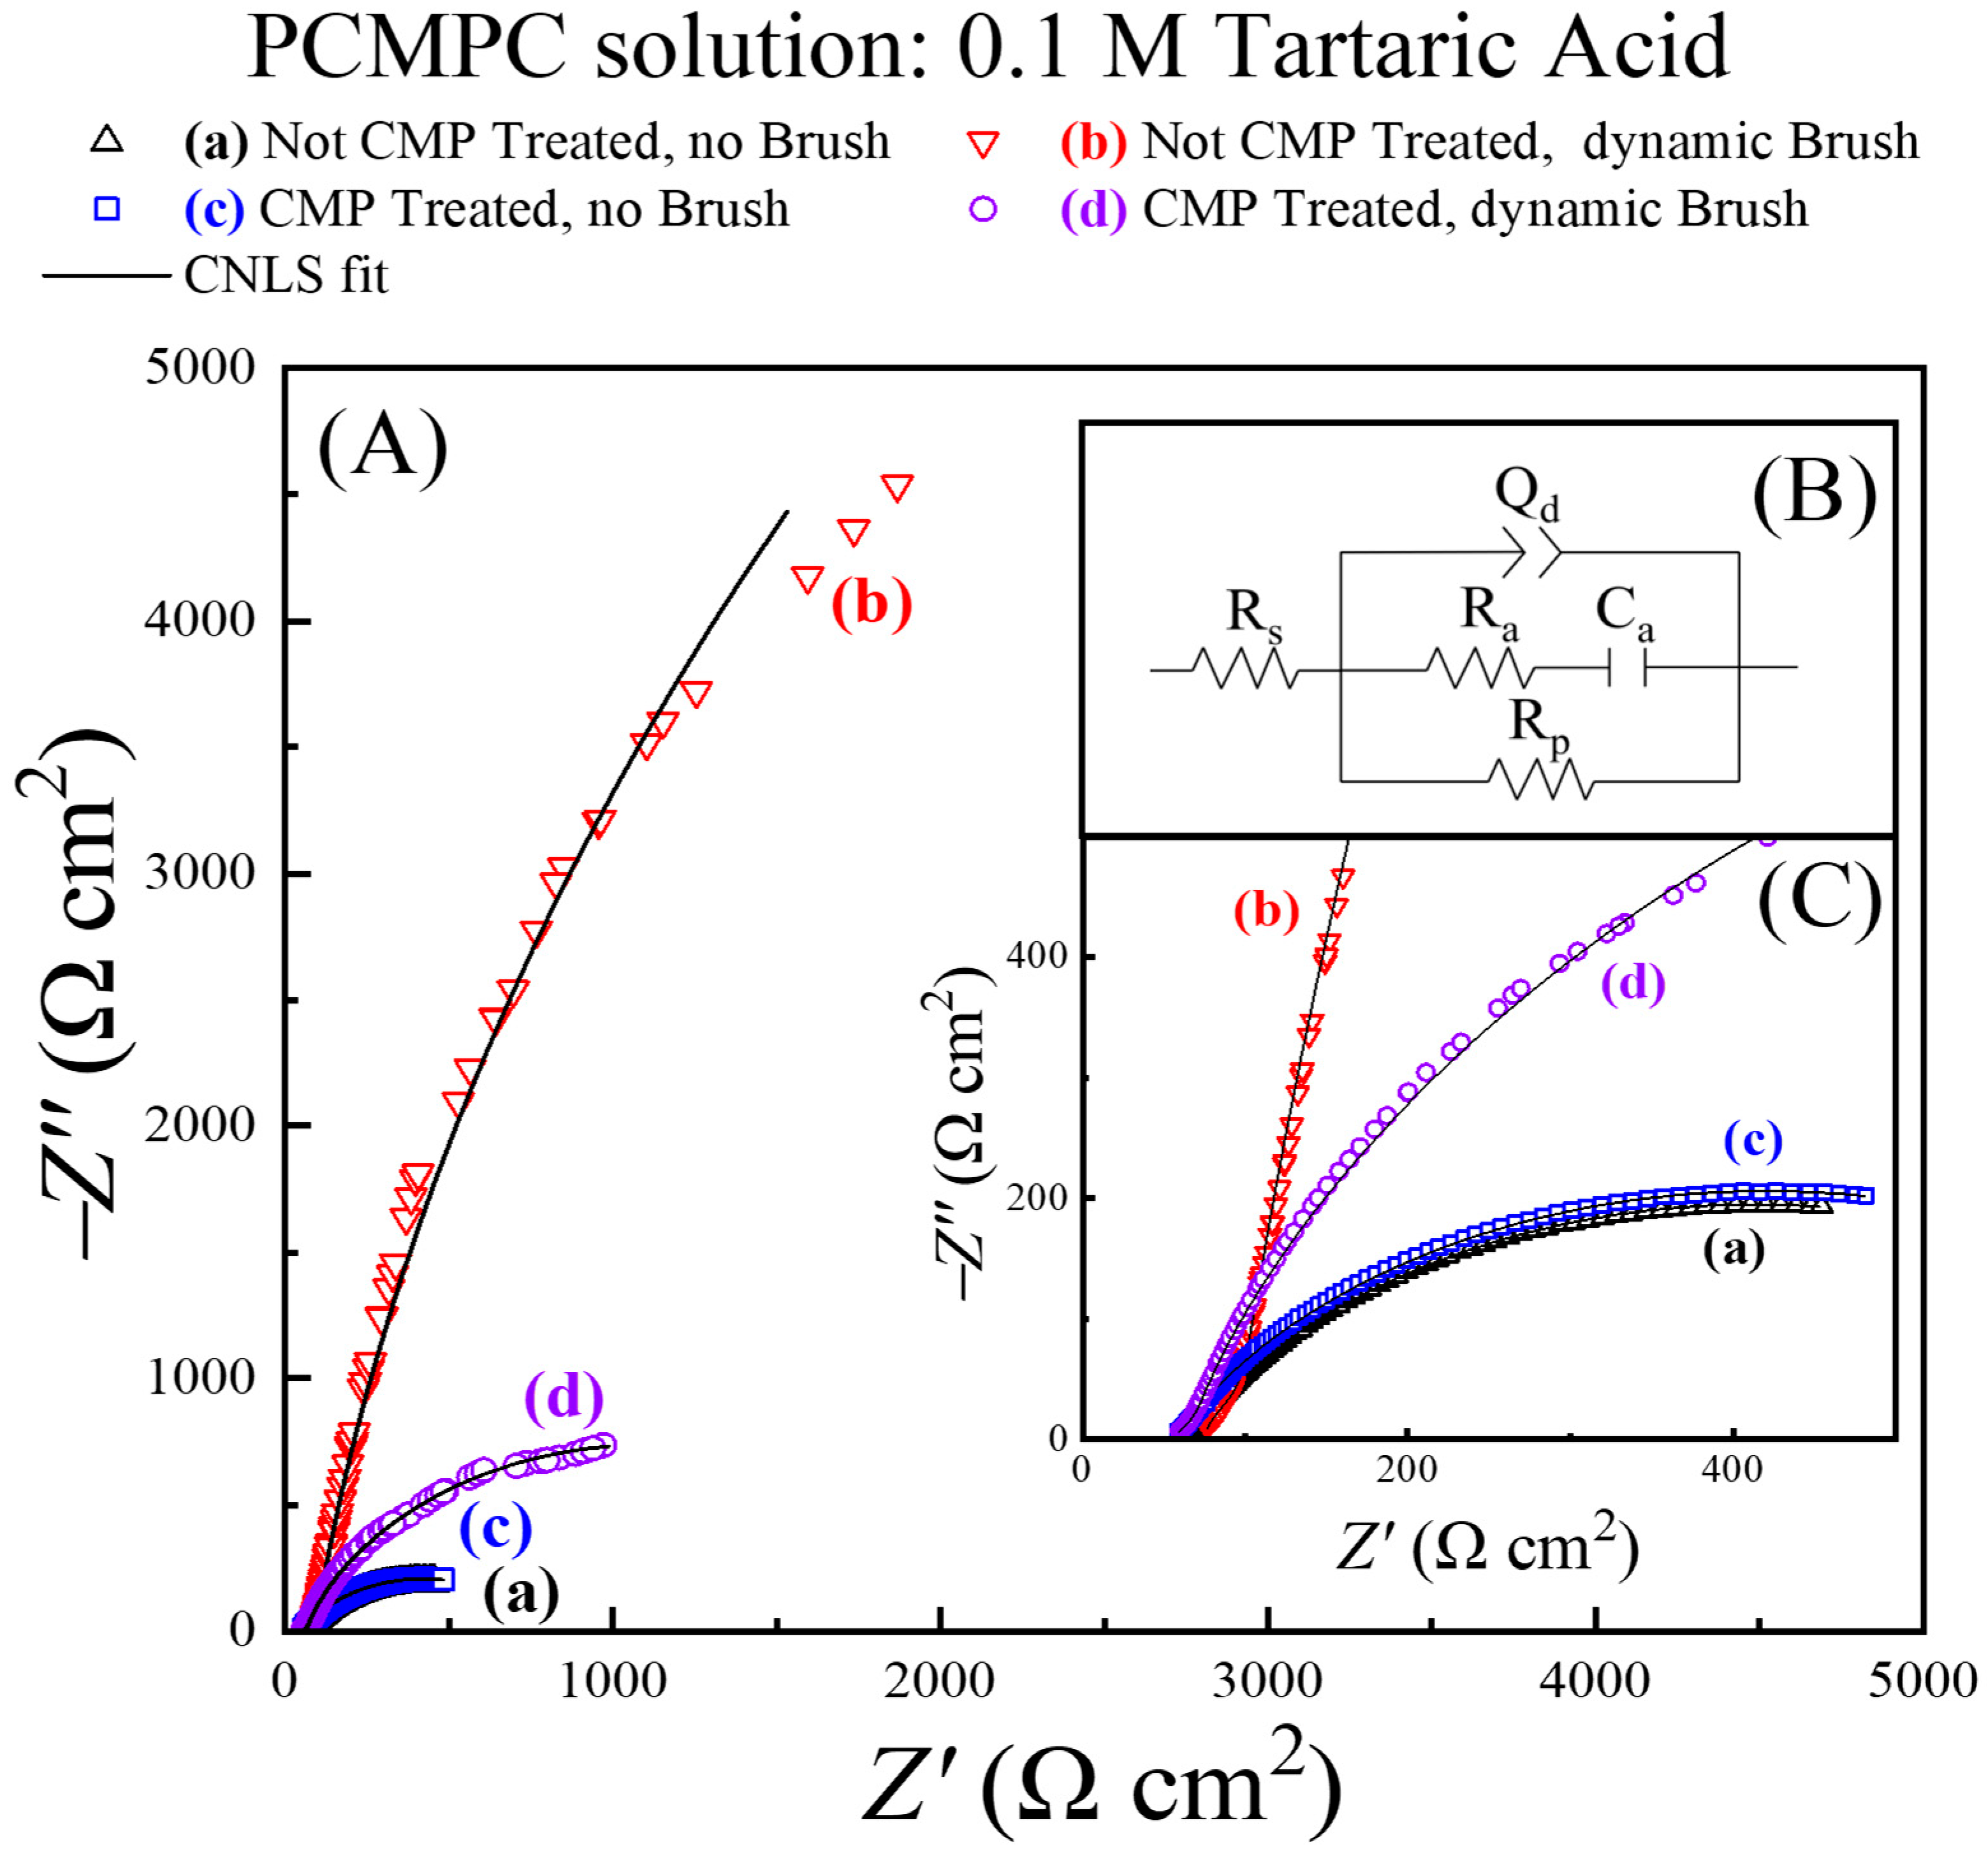
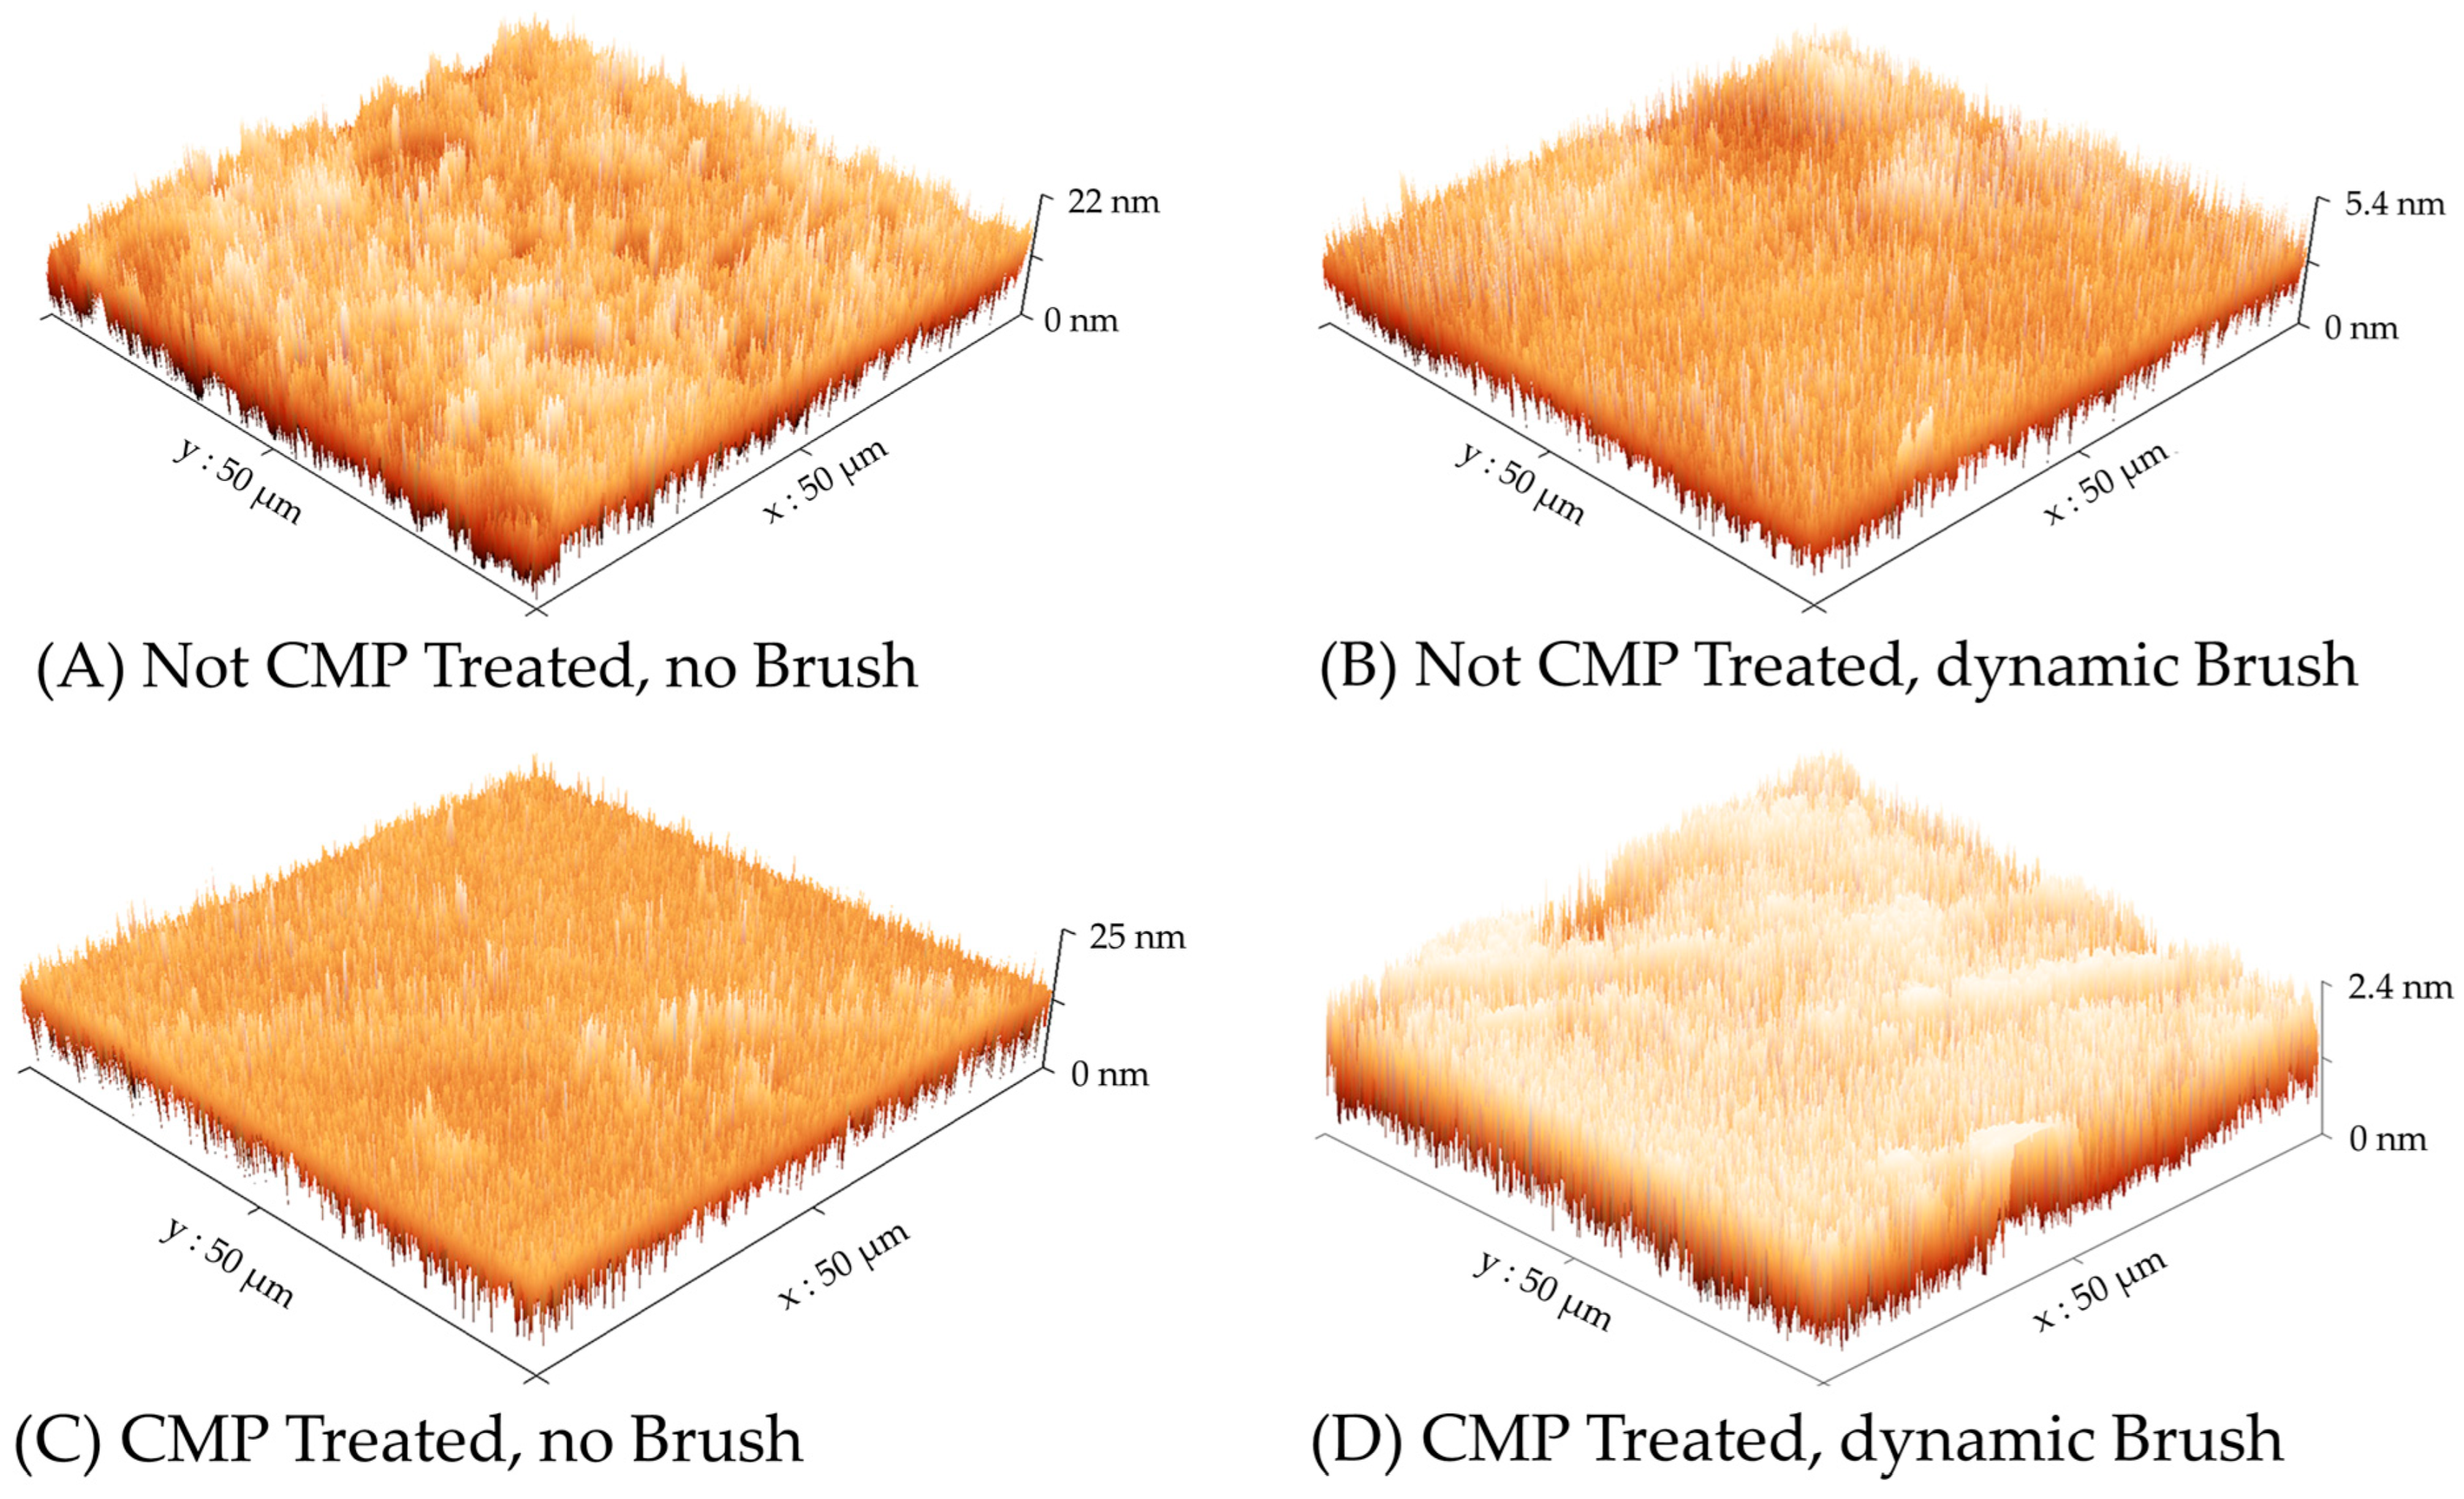
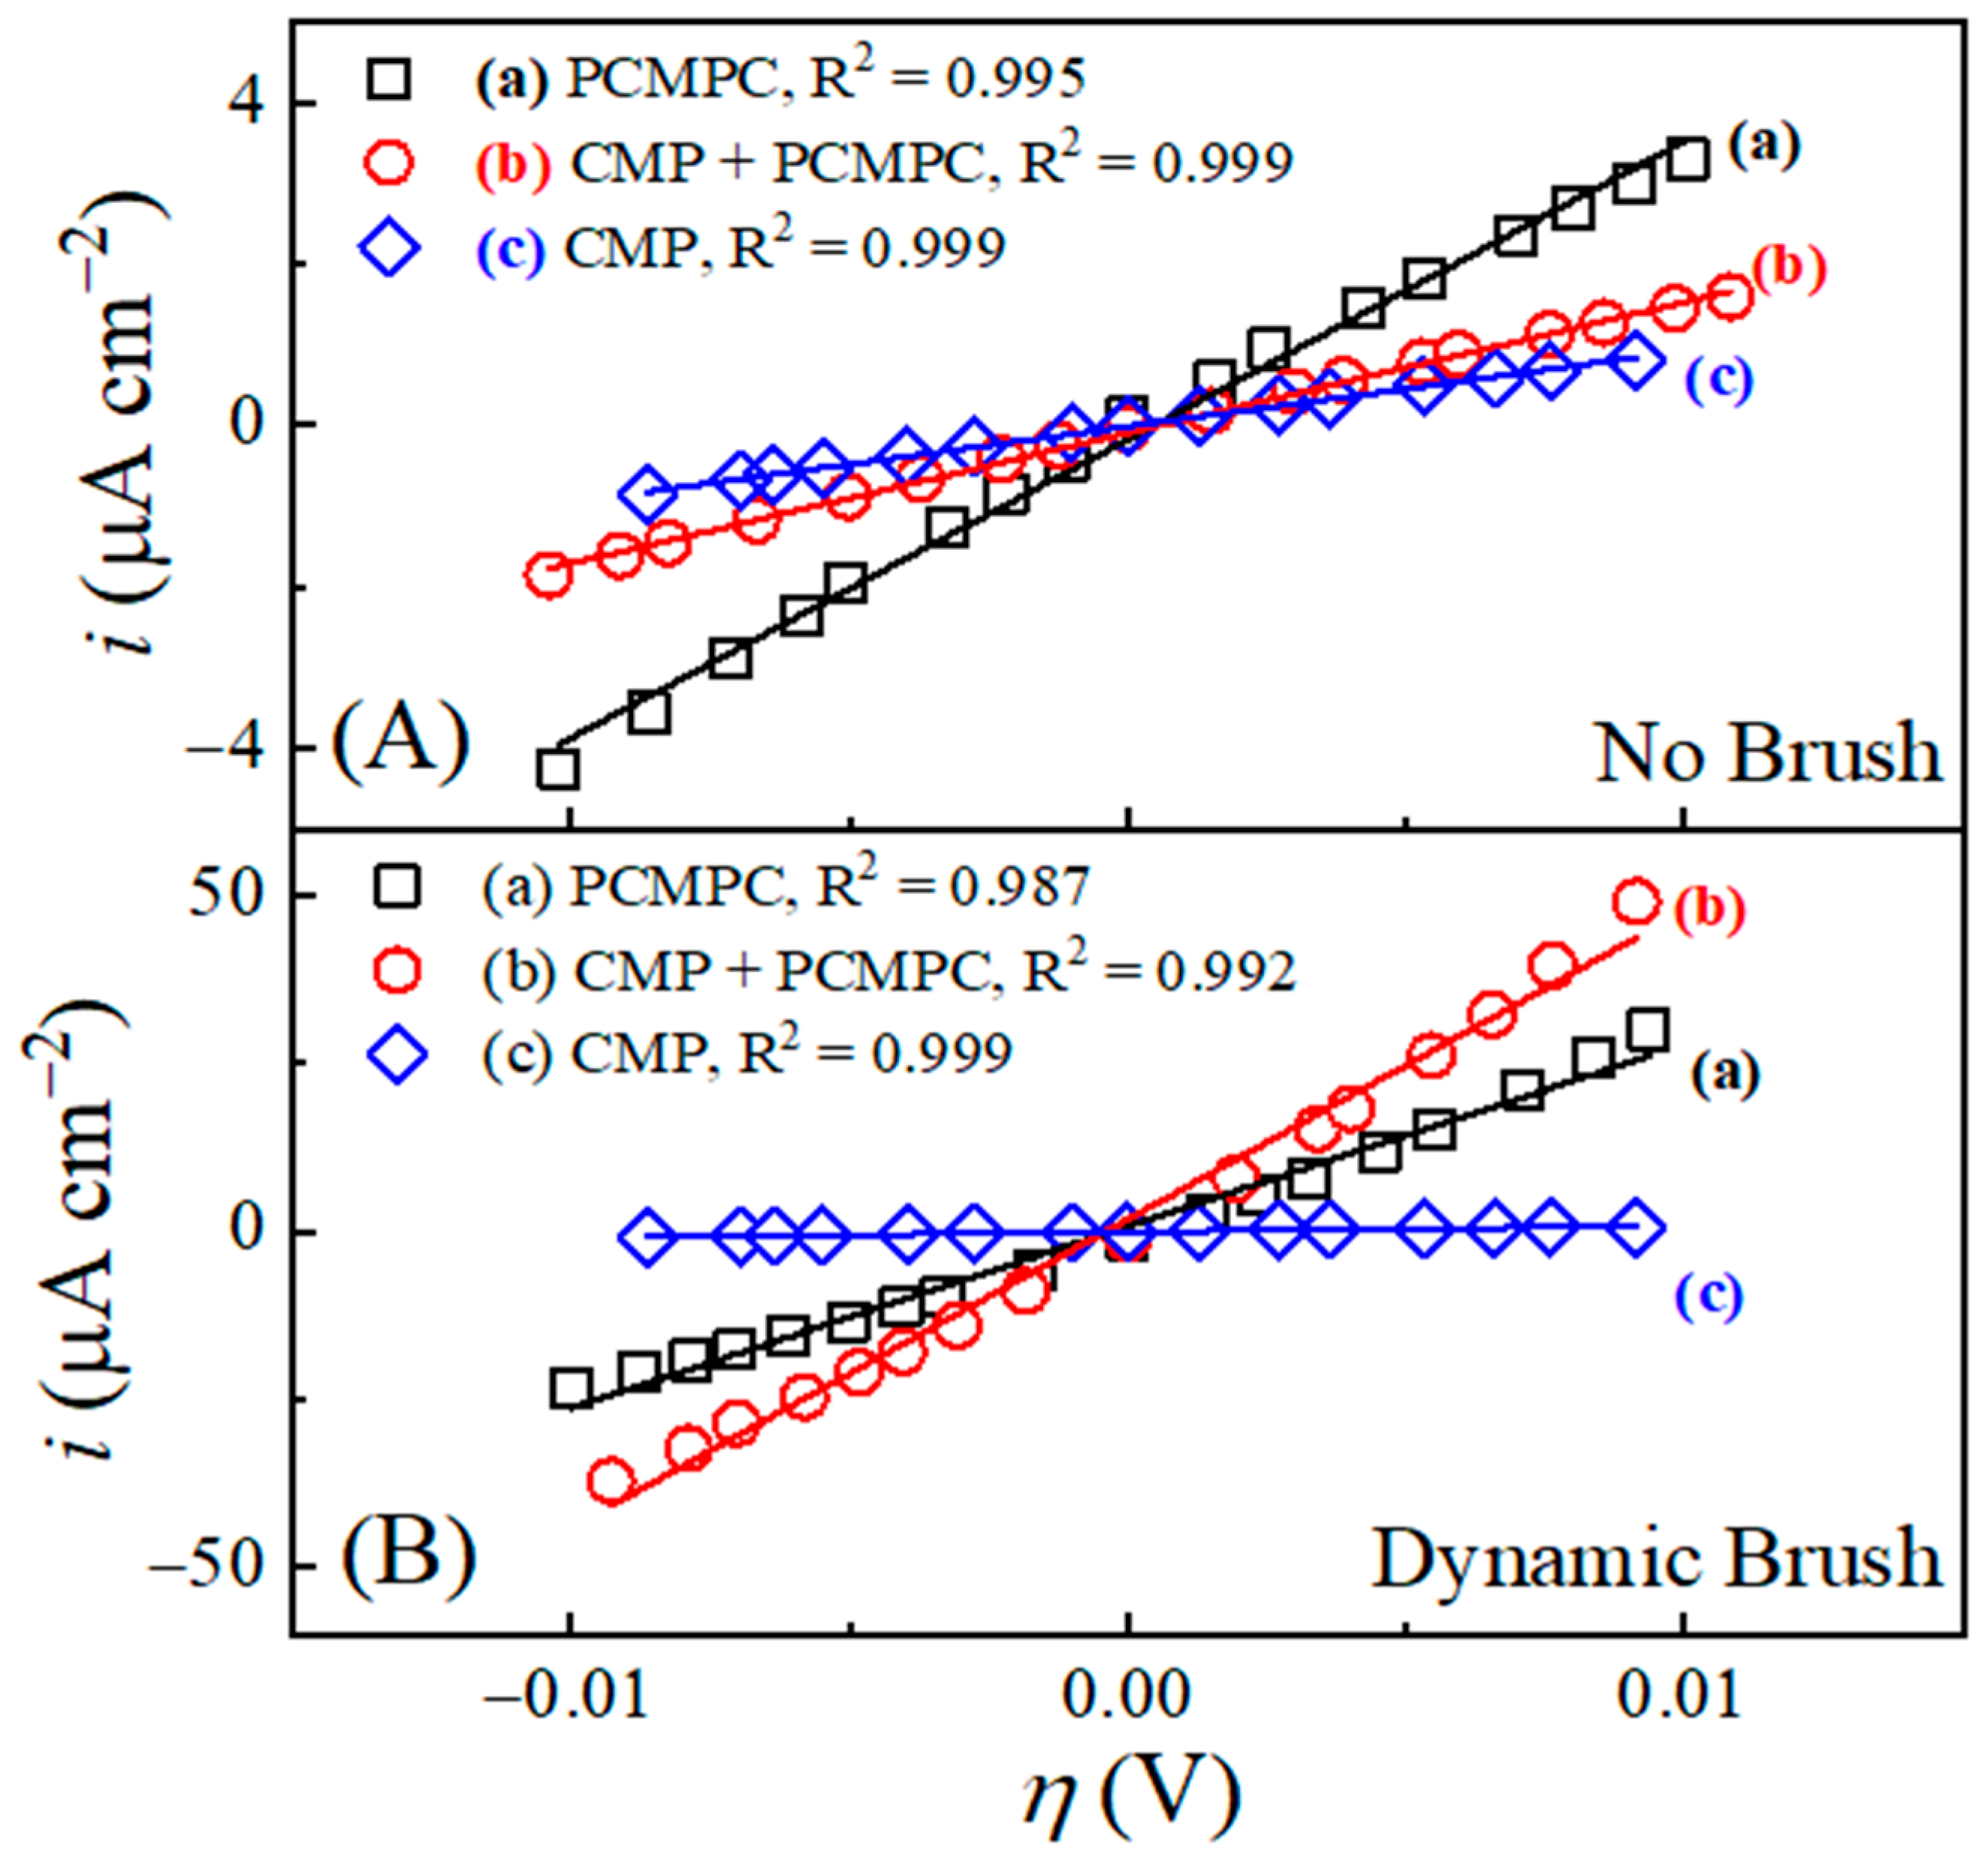
Disclaimer/Publisher’s Note: The statements, opinions and data contained in all publications are solely those of the individual author(s) and contributor(s) and not of MDPI and/or the editor(s). MDPI and/or the editor(s) disclaim responsibility for any injury to people or property resulting from any ideas, methods, instructions or products referred to in the content. |
© 2025 by the authors. Licensee MDPI, Basel, Switzerland. This article is an open access article distributed under the terms and conditions of the Creative Commons Attribution (CC BY) license (https://creativecommons.org/licenses/by/4.0/).